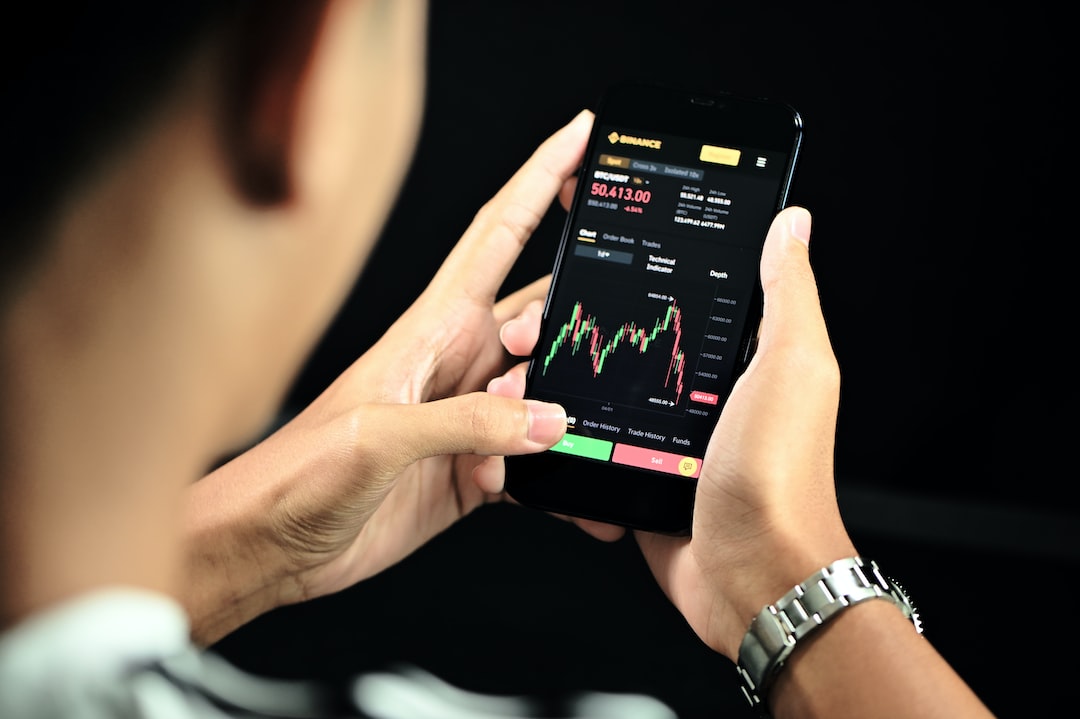
Candlestick charts are a popular form of technical analysis used in the Forex market. The candlestick chart is used to show the price movement of an asset over a certain period of time. Each candlestick represents a specific time frame, such as a day, week, or month. The candlestick chart is made up of a series of candlesticks that are formed by the opening, closing, high, and low prices of an asset.
The candlestick chart is an excellent tool for traders as it provides a visual representation of the price movement of an asset. It helps traders to identify trends and patterns in the market, which can help them make more informed trading decisions. In this article, we will discuss how to see future candlesticks in Forex.
Understanding Candlestick Charts
Before we dive into the topic of seeing future candlesticks, it’s essential to understand how candlestick charts work. A candlestick chart is made up of a series of candlesticks. Each candlestick represents a specific period of time, such as a day, week, or month. The candlestick is made up of a body and two wicks, one at the top and one at the bottom.
The body of the candlestick represents the opening and closing prices of the asset. If the opening price is higher than the closing price, the body is colored red. If the opening price is lower than the closing price, the body is colored green. The wicks represent the high and low prices of the asset during the specific time frame.
Reading Candlestick Patterns
Candlestick charts are used to identify patterns in the market. There are several types of candlestick patterns, including bullish and bearish patterns. Bullish patterns indicate that the price of the asset is likely to go up, while bearish patterns indicate that the price of the asset is likely to go down.
One of the most common bullish patterns is the hammer pattern. The hammer pattern is formed when the price of the asset opens high, then drops, but then recovers to close near the opening price. This pattern indicates that the price of the asset is likely to go up.
Another bullish pattern is the engulfing pattern. The engulfing pattern is formed when a small red candlestick is followed by a large green candlestick. This pattern indicates that the price of the asset is likely to go up.
On the other hand, one of the most common bearish patterns is the shooting star pattern. The shooting star pattern is formed when the price of the asset opens high, then drops, but then recovers to close near the opening price. This pattern indicates that the price of the asset is likely to go down.
Another bearish pattern is the bearish engulfing pattern. The bearish engulfing pattern is formed when a small green candlestick is followed by a large red candlestick. This pattern indicates that the price of the asset is likely to go down.
Predicting Future Candlestick Patterns
Predicting future candlestick patterns can be challenging, but there are some methods that traders can use to help them make more informed trading decisions.
One of the most popular methods is using technical analysis tools such as moving averages, support and resistance levels, and trend lines. These tools can help traders identify trends and patterns in the market, which can help them predict future candlestick patterns.
Another method is to use fundamental analysis. Fundamental analysis involves analyzing economic and political factors that can affect the price of an asset. For example, if a country’s economy is doing well, it’s likely that the price of its currency will go up. Traders can use this information to predict future candlestick patterns.
Conclusion
Candlestick charts are an excellent tool for traders as they provide a visual representation of the price movement of an asset. Traders can use candlestick charts to identify trends and patterns in the market, which can help them make more informed trading decisions. Predicting future candlestick patterns can be challenging, but traders can use technical and fundamental analysis to help them make more accurate predictions.