Forex trading is all about making informed decisions based on current market trends and patterns. One of the most important tools for traders to analyze market behavior is the forex chart. Forex charts provide a visual representation of the price movements of currency pairs over time. Reading forex charts can be daunting for beginners, but with some practice and knowledge, it can become an essential tool for traders to make informed trading decisions.
There are three types of forex charts: line charts, bar charts, and candlestick charts. Each type has its own advantages and disadvantages, and traders can choose the one that suits their trading style and preferences.
Line charts are the simplest type of forex chart. They are created by drawing a straight line connecting the closing prices of each period. Line charts are useful for identifying long-term trends and support and resistance levels.
Bar charts, also known as OHLC (open, high, low, close) charts, display the price range of each period as a vertical line, with a horizontal line on either side to show the open and close prices. Bar charts provide more information than line charts, including the high and low prices of each period, and are useful for identifying market volatility and price action.
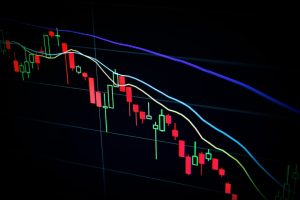
Candlestick charts are the most popular type of forex charts. They display the same information as bar charts but are presented in a more visually appealing way. Each period is represented by a candlestick, with the body showing the open and close prices and the wicks showing the high and low prices. Candlestick charts are useful for identifying market sentiment and momentum, and traders can use various candlestick patterns to make trading decisions.
Once you have chosen the type of chart you want to use, the next step is to understand the different elements of the chart. The horizontal axis represents time, with each period usually ranging from 1 minute to 1 month, depending on the timeframe chosen by the trader. The vertical axis represents the price of the currency pair, with the lowest prices at the bottom and the highest prices at the top.
Traders can use various tools and indicators to analyze forex charts, including trend lines, support and resistance levels, moving averages, and oscillators. Trend lines are used to identify long-term trends and can be drawn by connecting the highs or lows of the price movements. Support and resistance levels are areas where the price has previously reversed, and traders can use them to identify potential buying and selling opportunities.
Moving averages are used to smooth out the price movements and identify the direction of the trend. Traders can use different types of moving averages, including simple moving averages, exponential moving averages, and weighted moving averages. Oscillators, such as the Relative Strength Index (RSI) and Stochastic Oscillator, are used to identify overbought and oversold conditions and potential trend reversals.
Reading forex charts can be overwhelming at first, but with practice and knowledge, traders can use them to make informed trading decisions. Traders should choose the type of chart that suits their trading style and preferences, and use various tools and indicators to analyze the price movements. By understanding the different elements of the chart and identifying potential buying and selling opportunities, traders can increase their chances of success in the forex market.