Forex and future charts are an essential tool for traders to analyze market trends and make informed trading decisions. These charts provide a visual representation of price movements over a specific period, allowing traders to identify patterns, trends, and potential entry and exit points. However, reading these charts can be intimidating for beginners. In this article, we will discuss in-depth how to read chart for forex and future.
1. Understanding the Basics of Forex and Future Charts
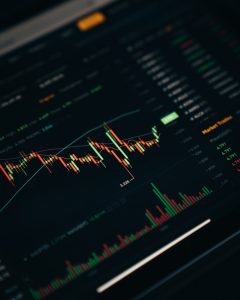
Before we delve into the details of reading forex and future charts, it’s essential to understand the basics. Forex and future charts display prices over a specific time frame, with the horizontal axis representing time and the vertical axis representing price. The price movements are represented by candlesticks, which are colored differently to indicate whether the price went up or down within a specific period.
Each candlestick has four main components, namely the open price, high price, low price, and closing price. The open price is the price at the start of the period, while the closing price is the price at the end of the period. The high and low prices are the highest and lowest points reached during the period.
2. Identifying Chart Patterns
One of the most crucial aspects of reading forex and future charts is identifying chart patterns. Chart patterns are specific price movements that occur repeatedly and indicate potential buying or selling opportunities. There are several chart patterns, such as head and shoulders, double tops, and triple tops. These patterns can be bullish or bearish, indicating whether the price is likely to go up or down.
3. Evaluating Market Trends
Another critical aspect of reading forex and future charts is evaluating market trends. Market trends refer to the overall direction of price movements over a specific period. There are three types of market trends, namely uptrend, downtrend, and sideways trend. An uptrend is characterized by higher highs and higher lows, while a downtrend is characterized by lower highs and lower lows. A sideways trend, on the other hand, is characterized by price movements that are relatively flat.
Traders can use trend lines to evaluate market trends. Trend lines connect two or more significant price points on the chart, forming a line that indicates the direction of the trend. An uptrend line is drawn by connecting two or more higher lows, while a downtrend line is drawn by connecting two or more lower highs.
4. Using Technical Indicators
Technical indicators are mathematical calculations based on price and volume data that help traders identify potential trading opportunities. These indicators are displayed on the chart and can provide valuable insights into market trends and potential entry and exit points. Some of the most commonly used technical indicators include moving averages, relative strength index (RSI), and stochastic oscillator.
Moving averages are used to identify the overall direction of the trend, as well as potential support and resistance levels. The RSI is used to indicate whether the market is overbought or oversold, while the stochastic oscillator is used to identify potential turning points in the market.
5. Analyzing Volume
Volume is an essential aspect of analyzing forex and future charts. Volume refers to the number of contracts traded during a specific period, and it can provide insights into market sentiment. High volume indicates that traders are actively buying and selling, while low volume indicates that there is little trading activity.
Traders can use volume indicators to analyze the volume of trades in the market. The volume indicator displays the total number of contracts traded during a specific period, as well as the average volume over a longer period. By analyzing volume, traders can identify potential support and resistance levels, as well as potential entry and exit points.
Conclusion
Reading forex and future charts requires a combination of technical knowledge and analytical skills. Traders must understand the basics of chart patterns, market trends, technical indicators, and volume analysis to make informed trading decisions. By analyzing these factors, traders can identify potential trading opportunities and make profitable trades.