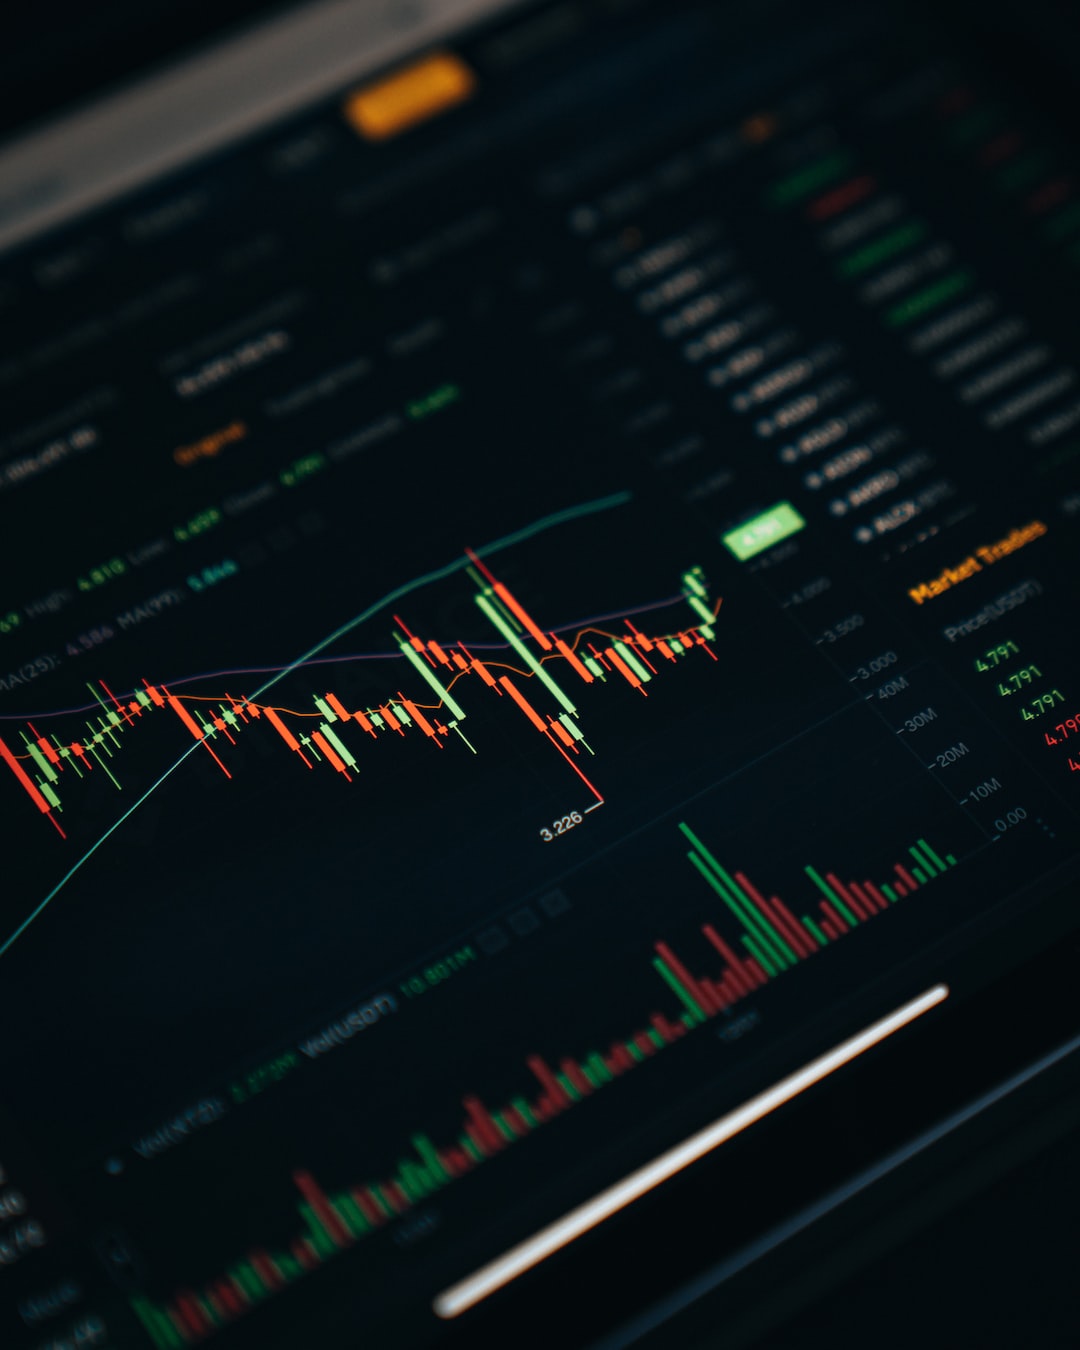
Candlestick charts are used by traders in the forex market to help them identify trends and make informed trading decisions. They are a popular tool for technical analysis and are used alongside other indicators to help traders predict price movements. In this article, we will explain how to read candlesticks in forex and how to use them to your advantage.
What are Candlesticks?
Candlesticks are a visual representation of price movements in the forex market. Each candlestick represents a specific time frame, such as 1 minute, 5 minutes, 1 hour, or 1 day. The candlestick consists of a body and two wicks, one at the top and one at the bottom.
The body of the candlestick represents the opening and closing prices for the time frame. If the candlestick is green, the opening price is at the bottom of the body and the closing price is at the top. This indicates that the price has risen during the time frame. If the candlestick is red, the opening price is at the top of the body and the closing price is at the bottom. This indicates that the price has fallen during the time frame.
The wicks represent the highest and lowest prices reached during the time frame. The top wick represents the highest price, and the bottom wick represents the lowest price. The length of the wicks can indicate the volatility of the market during the time frame. Longer wicks indicate greater volatility, while shorter wicks indicate less volatility.
Reading Candlestick Patterns
Candlestick patterns can provide valuable information to traders. There are many different patterns that can occur, each with its own meaning. Some of the most common patterns include:
1. Doji – This pattern occurs when the opening and closing prices are very close together, resulting in a very small body. This indicates indecision in the market and can be a sign of a potential trend reversal.
2. Hammer – This pattern occurs when the opening and closing prices are close together, and the bottom wick is longer than the body. This indicates that buyers have taken control of the market and can be a sign of a potential trend reversal.
3. Shooting Star – This pattern occurs when the opening and closing prices are close together, and the top wick is longer than the body. This indicates that sellers have taken control of the market and can be a sign of a potential trend reversal.
4. Engulfing – This pattern occurs when a small candlestick is followed by a larger candlestick that completely engulfs the previous candlestick. This indicates a potential trend reversal as the larger candlestick indicates a shift in market sentiment.
Using Candlesticks in Trading
Candlesticks can be used in conjunction with other technical indicators to help traders make informed trading decisions. For example, if a trader sees a hammer pattern forming on a chart, they may look at other indicators such as moving averages or trend lines to confirm the potential trend reversal.
Traders can also use candlesticks to identify support and resistance levels. Support levels are areas where the price has previously bounced back up from, while resistance levels are areas where the price has previously been rejected. Traders can use candlestick patterns to identify these levels and make trading decisions based on them.
Conclusion
Candlestick charts are a powerful tool for technical analysis in the forex market. They provide valuable information to traders about price movements and market sentiment. By learning how to read candlesticks and identify patterns, traders can make informed trading decisions and increase their chances of success. However, it is important to remember that no indicator is foolproof, and traders should always use multiple indicators to confirm their trading decisions.


