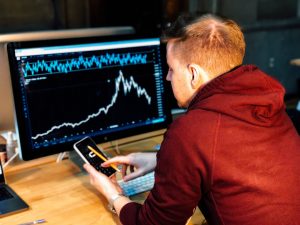
Forex trading is all about analyzing and interpreting charts and other technical indicators. The bar chart is one of the most commonly used charts in the forex market. It is a graphical representation of the price movement of a currency pair over a specific period of time. Bar charts are used by traders to identify trends, spot trading opportunities, and make informed trading decisions. In this article, we will discuss how to read a bar chart forex.
What is a Bar Chart?
A bar chart is a type of chart that displays the price movements of a currency pair over a specific period of time. It is composed of vertical bars that represent the opening, closing, high, and low prices of a currency pair for each trading period. Each bar on the chart represents a specific time frame, such as 1 minute, 5 minutes, 1 hour, 1 day, or 1 week.
How to Read a Bar Chart Forex
A forex bar chart is composed of several elements that provide valuable information to traders. The following are the elements of a bar chart forex and how to read them:
1. Vertical Bars
The vertical bars on the chart represent the price range of a currency pair for a specific period of time. Each bar has a vertical line that represents the high and low prices of the currency pair for that period. The top of the bar represents the highest price of the currency pair during that period, while the bottom of the bar represents the lowest price.
2. Horizontal Lines
The horizontal lines on the chart represent the opening and closing prices of the currency pair for a specific period of time. The left horizontal line represents the opening price of the currency pair, while the right horizontal line represents the closing price.
3. Colors
The colors of the bars on the chart provide valuable information to traders. The bars can be red or green, depending on whether the closing price is lower or higher than the opening price. If the closing price is higher than the opening price, the bar is green, indicating that the currency pair has gained in value during that period. If the closing price is lower than the opening price, the bar is red, indicating that the currency pair has lost value during that period.
4. Time Frame
The time frame of the bar chart forex is indicated on the x-axis of the chart. It can be a minute, an hour, a day, or a week, depending on the trader’s preference.
Using Bar Charts for Forex Trading
Bar charts provide valuable information to traders that they can use to make informed trading decisions. Here are some of the ways that traders use bar charts for forex trading:
1. Identifying Trends
Traders use bar charts to identify trends in the forex market. They look for patterns of higher highs and higher lows or lower highs and lower lows to determine the direction of the trend. A bullish trend is characterized by a series of higher highs and higher lows, while a bearish trend is characterized by a series of lower highs and lower lows.
2. Spotting Trading Opportunities
Traders use bar charts to spot trading opportunities. They look for price patterns, such as support and resistance levels, trend lines, and chart patterns, to identify potential entry and exit points. For example, if a trader sees a bullish trend and the price of a currency pair has just bounced off a support level, he or she may consider buying the currency pair.
3. Setting Stop Loss and Take Profit Levels
Traders use bar charts to set stop loss and take profit levels. They use the high and low prices of the bars to determine the maximum loss they are willing to incur and the potential profit they can make. For example, if a trader sees a resistance level at a certain price, he or she may set a stop loss just below that price to limit potential losses.
Conclusion
Bar charts are an essential tool for forex traders. They provide valuable information about the price movements of currency pairs over a specific period of time. Traders use bar charts to identify trends, spot trading opportunities, and make informed trading decisions. By understanding how to read a bar chart forex, traders can improve their chances of success in the forex market.