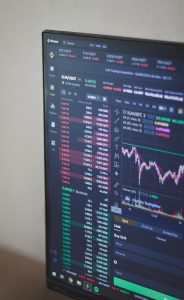
Candlestick charts are one of the most popular charting methods used in forex trading. They provide traders with a visual representation of price movements and help them to identify patterns and trends in the market. Candlestick charts were first developed in Japan in the 18th century for trading rice, but they have since become a popular tool for forex traders all over the world. In this article, we will explain how to invest on candlesticks in forex.
Understanding Candlestick Charts
Before we get into how to invest on candlesticks in forex, it is important to understand what candlestick charts are and how they work. Candlestick charts are a type of chart that displays the open, high, low, and close prices of an asset for a specific period of time. Each candlestick represents a trading session, whether it be a day, week, or month.
The body of the candlestick represents the opening and closing prices of the asset, while the wicks or shadows represent the high and low prices for the period. If the closing price is higher than the opening price, the candlestick is green or white, indicating a bullish trend. If the closing price is lower than the opening price, the candlestick is red or black, indicating a bearish trend.
Reading Candlestick Patterns
Candlestick charts are used to identify patterns and trends in the market. Some of the most common candlestick patterns include:
1. Bullish Engulfing Pattern: This pattern occurs when a small red or black candlestick is followed by a larger green or white candlestick, which completely engulfs the previous candlestick. This pattern indicates a potential reversal in the market, with buyers taking control of the asset.
2. Bearish Engulfing Pattern: This pattern is the opposite of the bullish engulfing pattern. It occurs when a small green or white candlestick is followed by a larger red or black candlestick, which completely engulfs the previous candlestick. This pattern indicates a potential reversal in the market, with sellers taking control of the asset.
3. Doji: A doji occurs when the opening and closing prices are almost the same. This pattern indicates indecision in the market and can be a potential reversal point.
4. Hammer: A hammer occurs when the asset opens near its high and closes near its low, with a long lower wick or shadow. This pattern indicates a potential reversal in the market, with buyers taking control of the asset.
5. Shooting Star: A shooting star occurs when the asset opens near its high and closes near its low, with a long upper wick or shadow. This pattern indicates a potential reversal in the market, with sellers taking control of the asset.
Investing on Candlestick Patterns
Now that you understand candlestick charts and how to read candlestick patterns, you can start investing on candlestick patterns. The first step is to identify the pattern on the chart. Once you have identified the pattern, you need to confirm it with other indicators, such as trend lines, moving averages, or support and resistance levels.
If the pattern is confirmed, you can enter a trade based on the direction of the pattern. For example, if you see a bullish engulfing pattern, you can enter a long position, expecting the price to go up. On the other hand, if you see a bearish engulfing pattern, you can enter a short position, expecting the price to go down.
It is important to remember that candlestick patterns are not always accurate and should be used in conjunction with other technical and fundamental analysis tools. Candlestick patterns can provide valuable insights into market sentiment and potential price movements, but they should not be relied on as the sole basis for making trading decisions.
Conclusion
Candlestick charts are a popular tool for forex traders to identify patterns and trends in the market. Understanding candlestick charts and how to read candlestick patterns is essential for successful forex trading. Candlestick patterns can provide valuable insights into market sentiment and potential price movements, but they should be used in conjunction with other technical and fundamental analysis tools. Remember to always practice proper risk management and use stop-loss orders to protect your investments.


