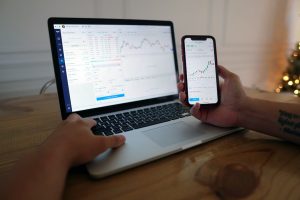
Forex trading is a popular investment option for many individuals who are looking to make a profit through currency exchange. When it comes to analyzing market trends and identifying potential trading opportunities, traders often rely on technical analysis tools such as charts and graphs. One of the most commonly used chart types in forex trading is the candlestick chart. However, there is an alternative chart type called the bar chart that can also be useful for forex traders. In this article, we will explore how to forex trade using bars instead of candlesticks.
What is a Bar Chart?
A bar chart is a type of chart that displays market data using vertical bars. Each bar represents a specific time period, such as a day or an hour, and shows the opening, closing, high, and low prices for that time period. The top of the bar represents the highest price reached during the time period, while the bottom of the bar represents the lowest price. The left side of the bar represents the opening price, while the right side represents the closing price.
How to Read a Bar Chart
To read a bar chart, traders need to understand the different components of each bar. The top of the bar represents the highest price reached during the time period, while the bottom of the bar represents the lowest price. The left side of the bar represents the opening price, while the right side represents the closing price. If the closing price is higher than the opening price, the bar is usually colored green or white. If the closing price is lower than the opening price, the bar is usually colored red or black.
Advantages of Using Bar Charts
There are several advantages to using bar charts instead of candlestick charts in forex trading. One advantage is that bar charts are easier to read for some traders. While candlestick charts can be more visually appealing, some traders find them confusing or overwhelming. Bar charts provide a simple and clear representation of market data that can be easier to understand for some traders.
Another advantage of using bar charts is that they can provide more detailed information about market trends. Because each bar represents a specific time period, traders can analyze trends over a longer period of time. Candlestick charts, on the other hand, can be more focused on short-term trends and may not provide as much information about longer-term trends.
How to Trade Using Bar Charts
To trade using bar charts, traders need to follow a similar process as they would with candlestick charts. They need to analyze market trends and identify potential trading opportunities based on technical indicators and other factors. Some commonly used technical indicators for trading with bar charts include moving averages, trend lines, and support and resistance levels.
Traders can also use bar charts to identify potential entry and exit points for trades. For example, if a trader sees a series of bars with higher highs and higher lows, this could indicate an uptrend. The trader may decide to enter a long position when the price breaks above a resistance level, or exit a short position when the price falls below a support level.
Conclusion
While candlestick charts are the most commonly used chart type in forex trading, bar charts can also be a useful tool for traders. Bar charts provide a simple and clear representation of market data that can be easier to read for some traders. They can also provide more detailed information about market trends over a longer period of time. By using technical indicators and analyzing market trends, traders can use bar charts to identify potential trading opportunities and make informed trading decisions.