
The zigzag pattern is a three-wave structure that has a limited number of variations. In this educational post, we’ll present how to analyze the zigzag pattern under an intermediate level perspective,
The Elliott’s Zigzag Pattern
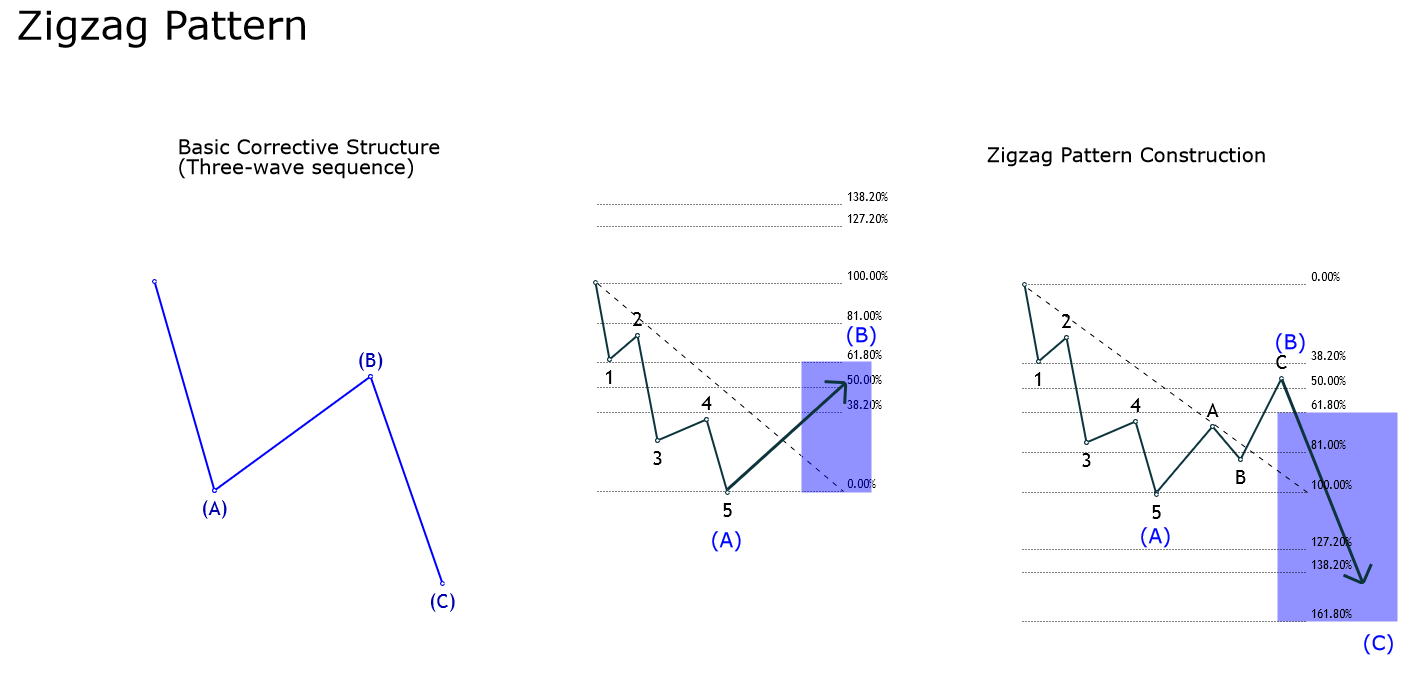
R.N. Elliott, in his work The Wave Principle, described the zigzag as a corrective formation that follows an internal sequence defined by 5-3-5.
The wave analysis analyst should consider that corrective patterns are not easy to recognize while the structure is not complete; however, it results revealing and useful to make forecasts once the formation is complete.
Zigzag Construction
Glenn Neely, in his work Mastering Elliott Wave, describes the zigzag construction as follows:
- Wave A shouldn’t retrace beyond 61.8% of the impulsive wave.
- Wave B should retrace at least 1% of wave A, but shouldn’t exceed 61.8% of wave A.
- Wave C must finish at least slightly beyond the end of wave A.
- If wave B retraces more than 61.8% of wave A, thus the movement developed doesn’t correspond to the end of wave B. In this case, the move realized correspond to a segment of a complex wave B.
The following figure illustrates the steps of the zigzag pattern construction previously described.
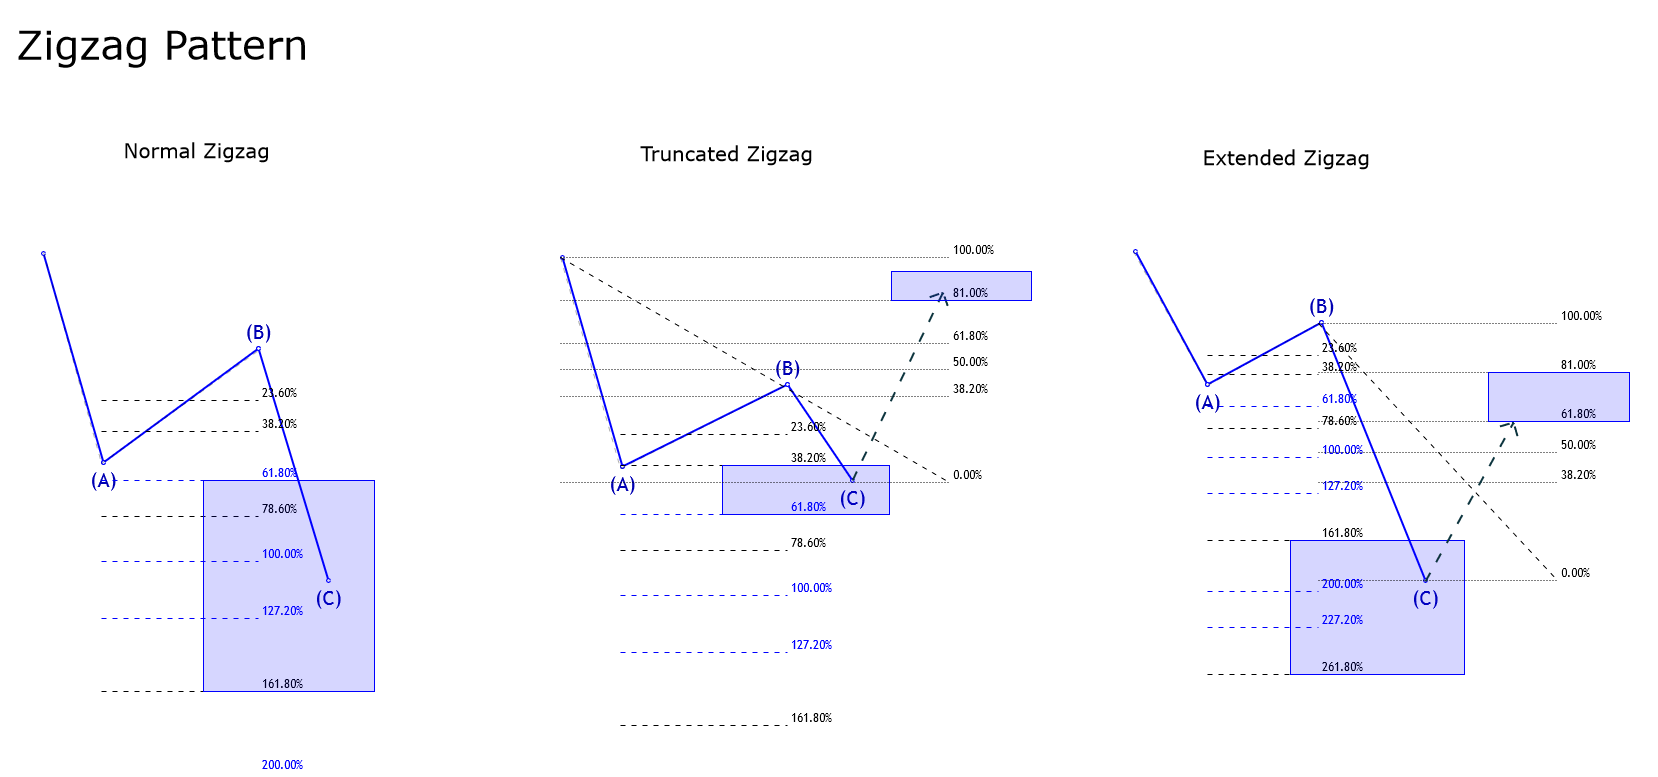
Types of Zigzag
According to the extension of wave C, the zigzag pattern would be classified as normal, extended, or truncated.
Normal zigzag: In this case, wave C can reach between 61.8% to 161.8% extension of wave A. Concerning wave B, this segment doesn’t retrace more than 61.8% of wave A, and wave C shouldn’t extend beyond 161.8% of wave A.
Truncated zigzag: This formation is less frequent than the other two zigzag pattern variations. Further, wave C shouldn’t be lower than 38.2% of wave A, but not greater than 61.8% of wave A.
Once wave C ends, the next path should retrace at least 81% of the entire zigzag formation. According to Neely, this pattern it is likely that appears in a triangle structure.
Extended zigzag: This variation is characterized by having a more prolonged wave C than the other two models, which surpasses the 161.8% of wave A, being similar to an impulsive sequence.
Once completed the wave C, the next path tends to retrace at least 61.8% of wave C.
Canalization Process
To canalize a zigzag formation, the wave analyst should pay attention to wave A and the end of wave B.
The canalization process begins with the trace of a base-line linking the origin of wave A with the end of wave B, then using this line, a parallel line is projected at the end of wave A.
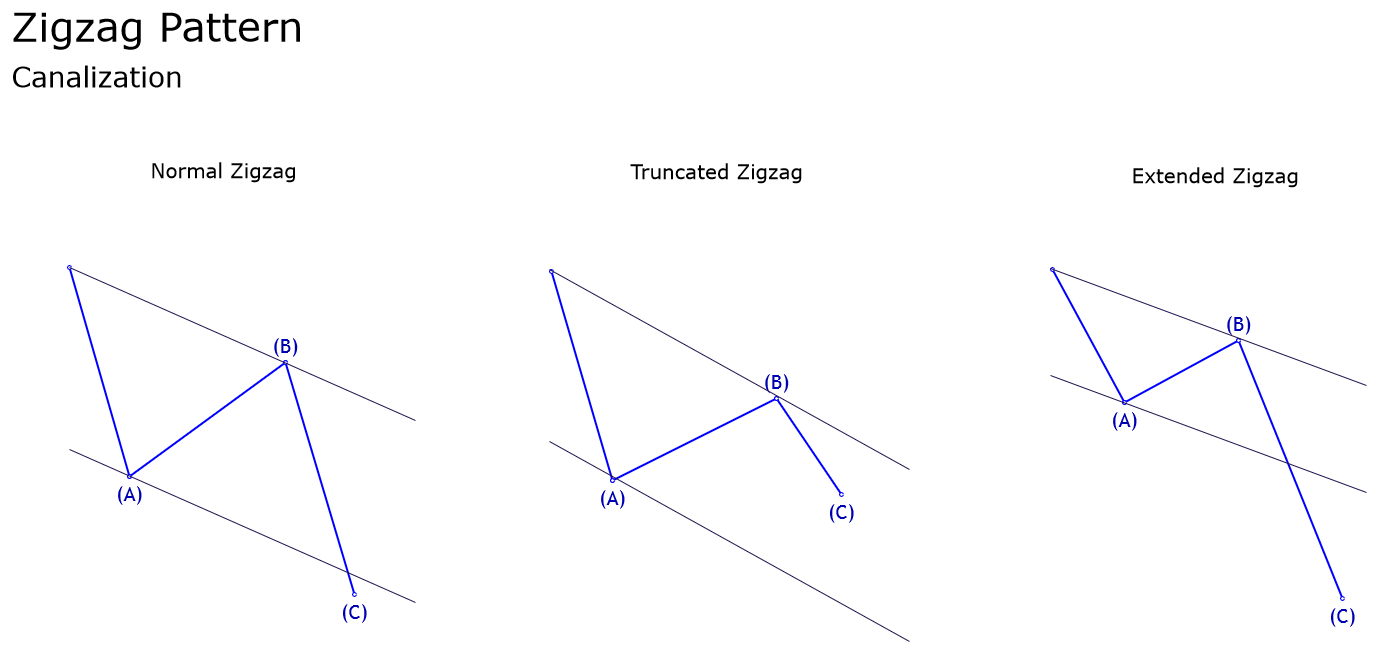
If the wave analyst encounters a zigzag pattern, then the corrective formation could move inside the channel, violate it, but never move in a tangent way to the channel. If it occurs, then the corrective sequence may correspond to a complex correction.
Finally, once the price violates the base-line O-B, we can conclude that the zigzag pattern ended.
NASDAQ e-mini and its Zigzag Pattern
The following figure represents to NASDAQ in its 12-hour timeframe. The chart reveals the upward process that the technologic index developed in the Christmas rally of 2018 at 5,820.50 pts.
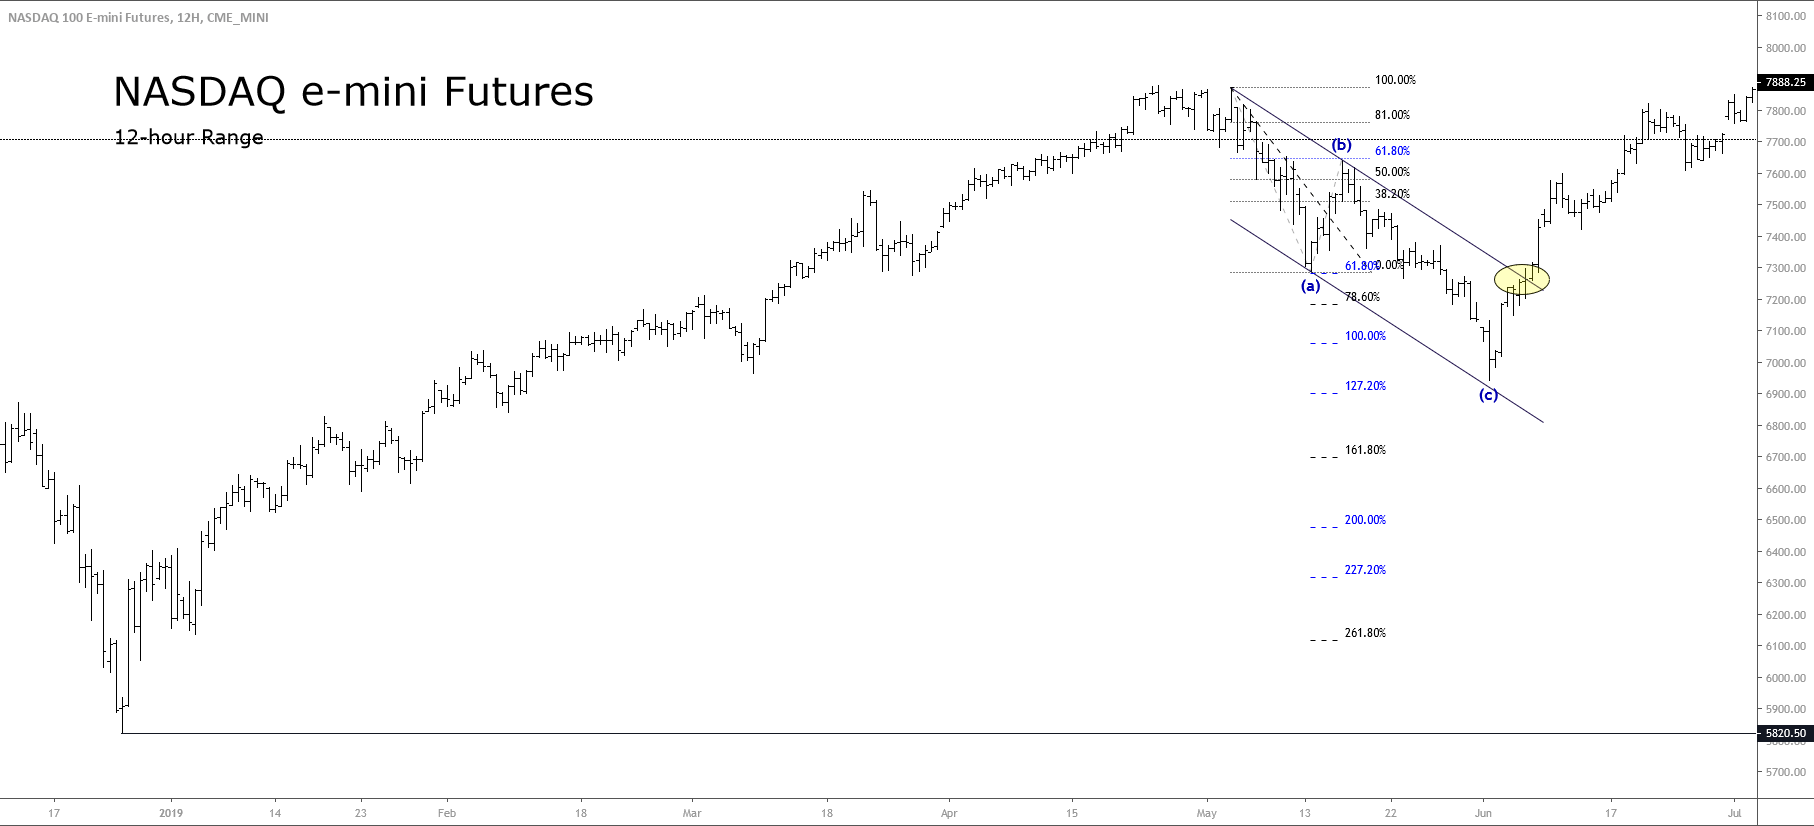
The impulsive bullish sequence completed its internal five-wave moves at 7,879.50 pts on April 24th, 2019, from where the price began to develop a corrective zigzag pattern.
As illustrated in the last figure, the wave (a) in blue looks as a five-wave structure that ended at 7,290 pts on May 13th, 2019. The second leg of the zigzag pattern advanced close to 61.8% of the wave (a), which accomplishes the requirement of zigzag construction.
The next bearish path, corresponding to wave (c) produced a second decline in five waves and dropped beyond the 61.8% and below 161.8% of (a) which lead us to conclude that the type of zigzag pattern is normal.
At the same time, we observe that the price didn’t violate the lower line of the descending channel. However, once NASDAQ soared above the upper line of the descending channel, the corrective structure ended, giving way to the next upward motive wave.
Conclusion
In this educational article, we reviewed the characteristics of the zigzag pattern and how the wave analysts can differentiate from another kind of corrective formation.
At the same time, the Fibonacci tools represent a useful way to validate what structure develops the market. In this context, this knowledge will allow the wave analyst to identify potential zones of reaction, which would enable us to incorporate into the trend.
In the next article, we will review the triangle pattern and how to recognize its variations.
Suggested Readings
- Neely, G.; Mastering Elliott Wave: Presenting the Neely Method; Windsor Books; 2nd Edition (1990).
- Prechter, R.; The Major Works of R. N. Elliott; New Classics Library; 2nd Edition (1990).


4 replies on “How to Analyze the Zigzag Pattern – Intermediate Level”
“Wave B should retrace at least 1% of wave A”
I think it too small, can you check it again?
Likely Neely considers the 1% in a fast market. However, if we take the Dow Theory, the minimum retracement should be 33% of the previous movement. In a fast market could be at least 20% of the previous movement. See the EURGBP cross rally developed in early May 2019.
and a question
“If wave B retraces more than 61.8% of wave A, thus the movement developed doesn’t correspond to the end of wave B. In this case, the move realized correspond to a segment of a complex wave B.”
I think wave B is a triangle, so wave (a) of wave B retraces more than 61.8% of wave A, but end of triangle( = wave B) is not, it’s right? and anything else?
It’s correct that wave B could be a triangle pattern. To understand this point, we must consider the scenario when wave A realizes a fast (or aggressive) correction. The second segment of a corrective structure (wave B) should be a complex correction or a triangle pattern. This assumption is based on the alternation principle. In short, wave B should elapse in a broad range of time than wave A. To clarify, you can see the incomplete correction developed by GBPJPY in the daily timeframe, where wave B looks like a complex corrective pattern.