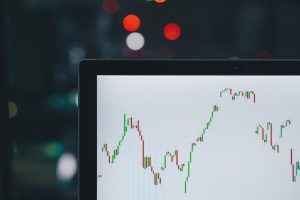
Forex trading is one of the most popular forms of investment in the world. It involves trading currencies in different countries, with the aim of earning profits from the fluctuations in their exchange rates. To make informed trading decisions, traders need to analyze forex charts. Forex charts are graphical representations of the price movements of currency pairs over time. In this article, we discuss how to analyze forex charts.
1. Identify the Currency Pair
The first step in analyzing a forex chart is identifying the currency pair that you want to trade. For instance, if you want to trade the US Dollar and Euro, you will need to look at the EUR/USD chart. It is essential to understand the characteristics of the currency pair you are trading to develop a successful trading strategy.
2. Determine the Timeframe
Forex charts come in different timeframes, ranging from one minute to one month. The timeframe you choose will depend on your trading style and strategy. Short-term traders may use lower timeframes, such as one minute or five minutes, while long-term traders may use higher timeframes, such as one day or one week.
3. Analyze Price Movements
Price movements are the most critical aspect of forex chart analysis. Traders need to identify the trends, support and resistance levels, and key price levels. Trends are the direction in which the price is moving, either upwards (bullish) or downwards (bearish). Support levels are areas where the price has difficulty falling below, while resistance levels are areas where the price has difficulty moving above.
4. Technical Analysis
Technical analysis involves using technical indicators to analyze price movements. Technical indicators are mathematical calculations based on the price and volume data of a currency pair. They help traders identify trends, momentum, and potential reversals. Some of the most popular technical indicators include moving averages, Relative Strength Index (RSI), and Bollinger Bands.
5. Fundamental Analysis
Fundamental analysis involves analyzing economic and geopolitical events that may affect the currency pair’s exchange rate. For instance, if there is a positive economic report from the US, the USD may appreciate against other currencies. Similarly, if there is political instability in Europe, the EUR may depreciate against other currencies. Traders need to stay informed about global events and their potential impact on the currency markets.
6. Risk Management
Analyzing forex charts is not enough to make successful trades. Traders need to manage their risk by setting stop-loss orders and take-profit orders. Stop-loss orders are orders that automatically close a trade if the price reaches a specific level. Take-profit orders are orders that automatically close a trade if the price reaches a specific level of profit. Traders need to set their stop-loss and take-profit levels based on their risk tolerance and trading strategy.
Conclusion
Analyzing forex charts is a crucial aspect of successful forex trading. Traders need to identify the currency pair, determine the timeframe, analyze price movements, use technical and fundamental analysis, and manage their risk. By following these steps, traders can develop a successful trading strategy that maximizes their profits and minimizes their risks.


