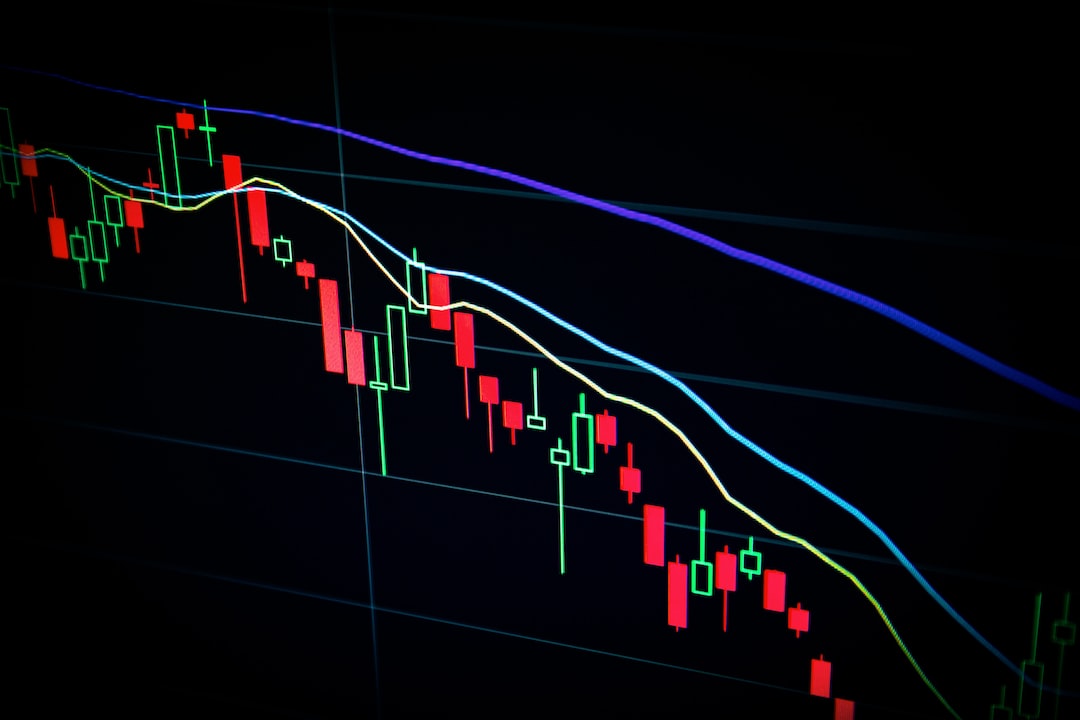
The Fibonacci spiral is a popular trading tool in the forex market. It is based on the Fibonacci sequence, which is a sequence of numbers where each number is the sum of the previous two numbers. The sequence is as follows – 0, 1, 1, 2, 3, 5, 8, 13, 21, 34, 55, and so on. The Fibonacci spiral is a curve that is created by connecting the corners of squares that are based on this sequence. In this article, we will explain how to use the Fibonacci spiral in forex trading.
The Fibonacci spiral is used to identify potential support and resistance levels on a price chart. This is done by drawing a line from the center of the spiral to the edge of the spiral. This line is then used to identify potential support and resistance levels. The Fibonacci spiral is often used in conjunction with other technical analysis tools like trend lines, moving averages, and oscillators.
To use the Fibonacci spiral, you need to first identify the direction of the trend. This can be done by looking at the price chart and identifying the highs and lows. If the highs are getting higher and the lows are getting higher, then the trend is up. If the highs are getting lower and the lows are getting lower, then the trend is down.
Once you have identified the trend, you can then draw the Fibonacci spiral. To do this, you need to draw a circle at the center of the chart. This circle should be the same size as the range of the price movement. You can then draw a series of squares around the circle. The size of the squares should be based on the Fibonacci sequence. The first square should have a side length of 1, the second square should have a side length of 2, the third square should have a side length of 3, and so on.
Once you have drawn the Fibonacci spiral, you can then use it to identify potential support and resistance levels. To do this, you need to draw a line from the center of the spiral to the edge of the spiral. This line should be drawn along the diagonal of the squares. Once you have drawn this line, you can then use it to identify potential support and resistance levels.
If the price is moving up, then you should look for potential support levels on the Fibonacci spiral. These levels will be where the price touches the spiral or where the line drawn from the center of the spiral to the edge of the spiral intersects with the price chart. If the price is moving down, then you should look for potential resistance levels on the Fibonacci spiral. These levels will be where the price touches the spiral or where the line drawn from the center of the spiral to the edge of the spiral intersects with the price chart.
It is important to note that the Fibonacci spiral is not always accurate. It is just one tool in a trader’s toolkit. Traders should use the Fibonacci spiral in conjunction with other technical analysis tools to get a more complete picture of the market.
In conclusion, the Fibonacci spiral is a useful tool in forex trading. It is based on the Fibonacci sequence and is used to identify potential support and resistance levels on a price chart. To use the Fibonacci spiral, traders need to identify the trend and draw the spiral. They can then use the spiral to identify potential support and resistance levels. However, traders should use the Fibonacci spiral in conjunction with other technical analysis tools to get a more complete picture of the market.


