Description
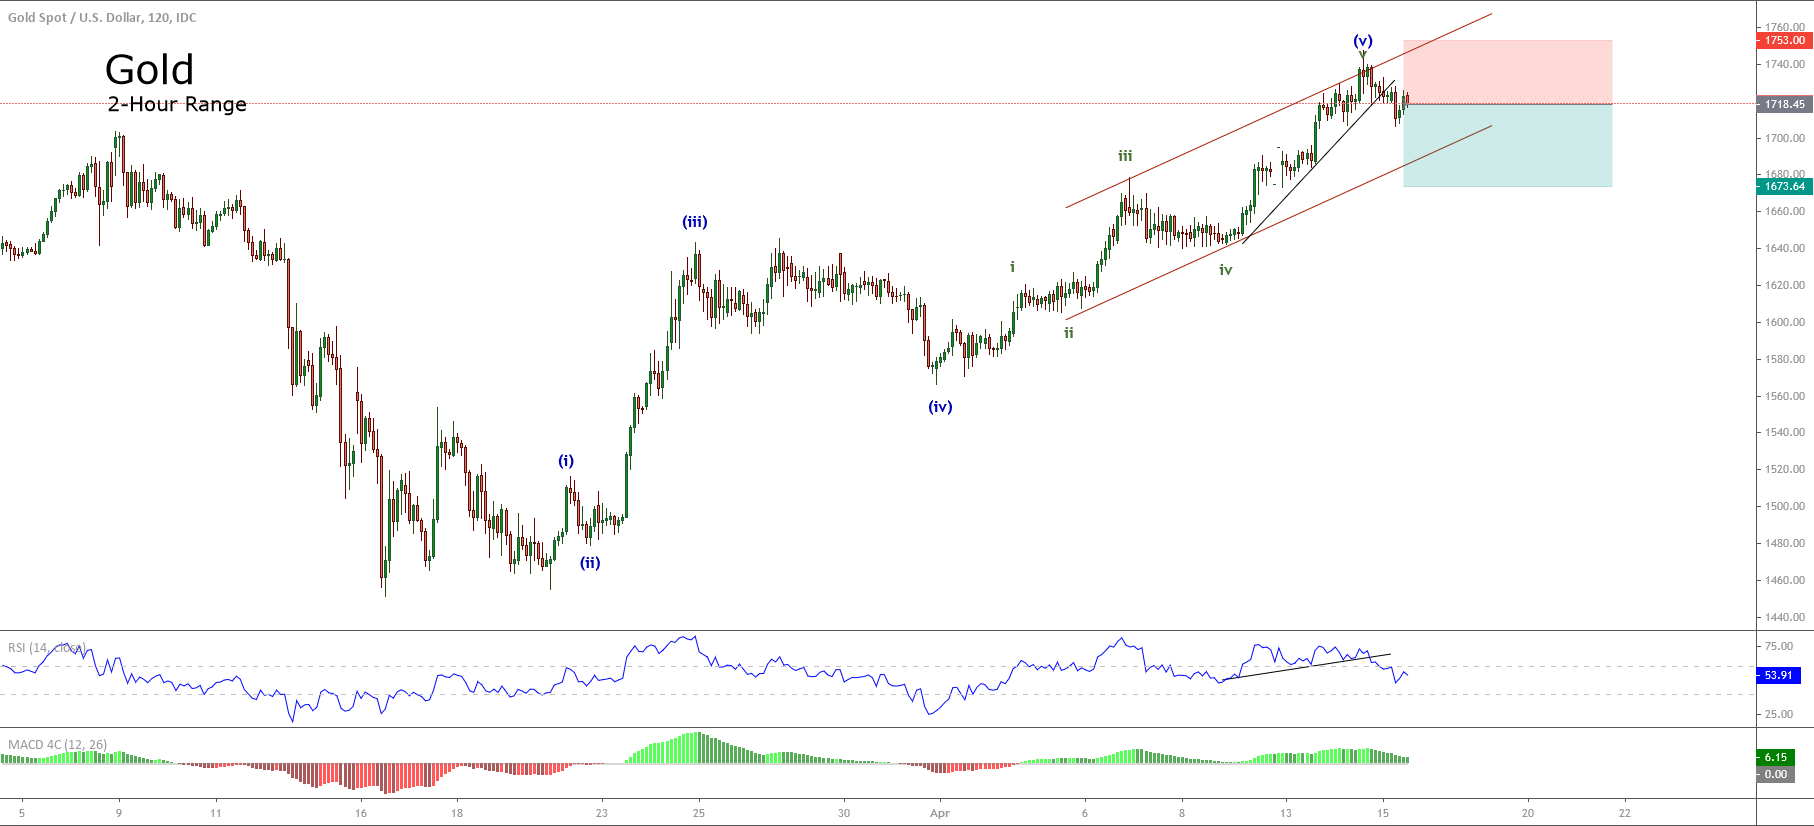
Gold, in its 2-hour chart, shows the completion of an upward five-wave sequence at $1,747.74 per ounce on Tuesday 14th.
The last bullish move corresponds to wave (v) of the Minuette degree labeled in blue. At the same time, we observe the thrust developed by the yellow metal as a false breakout. This movement warns us about the potential upward sequence completion.
On the other hand, we observe the bullish trendline in the fifth wave of Subminuette degree in green pierced. This bearish reaction gives us a second argument for the exhaustion of the bullish sequence.
In conclusion, we consider a sell-side position at $1,718 per ounce, with a potential bearish target at $1,673.64 per ounce. This level converges with the end of the third wave of Subminuette degree in green.
Our bearish scenario will be invalid if the yellow metal surges and closes above $1,753 per ounce.
Chart

Trading Plan Summary
- Entry Level: $1,718.4
- Protective Stop: $1,753
- Profit Target: $1,673
- Risk/Reward Ratio: 1.3
- Position Size: 0.01 lot per $1,000 in account.


