
The GBPUSD pair advances in an incomplete Elliott Wave Irregular Flat pattern that began on September 01st when the Pound found resistance at 1.34832. Currently, the price action moves in its wave (b) of Minuette degree identified in blue, suggesting a potential decline in the coming trading sessions.
Technical Overview
The big picture of the GBPUSD illustrated in the following daily chart shows the advance in an incomplete upward corrective sequence of Minute degree labeled in black, which began on last March 20th when the Pound found support and fresh buyers at 1.14098 developing a corrective rally. Once completed the three-wave upward sequence on September 01st at 1.34832, the price completed its wave ((a)) in black and began to advance in a sideways corrective formation corresponding to wave ((b)), which remains in progress.
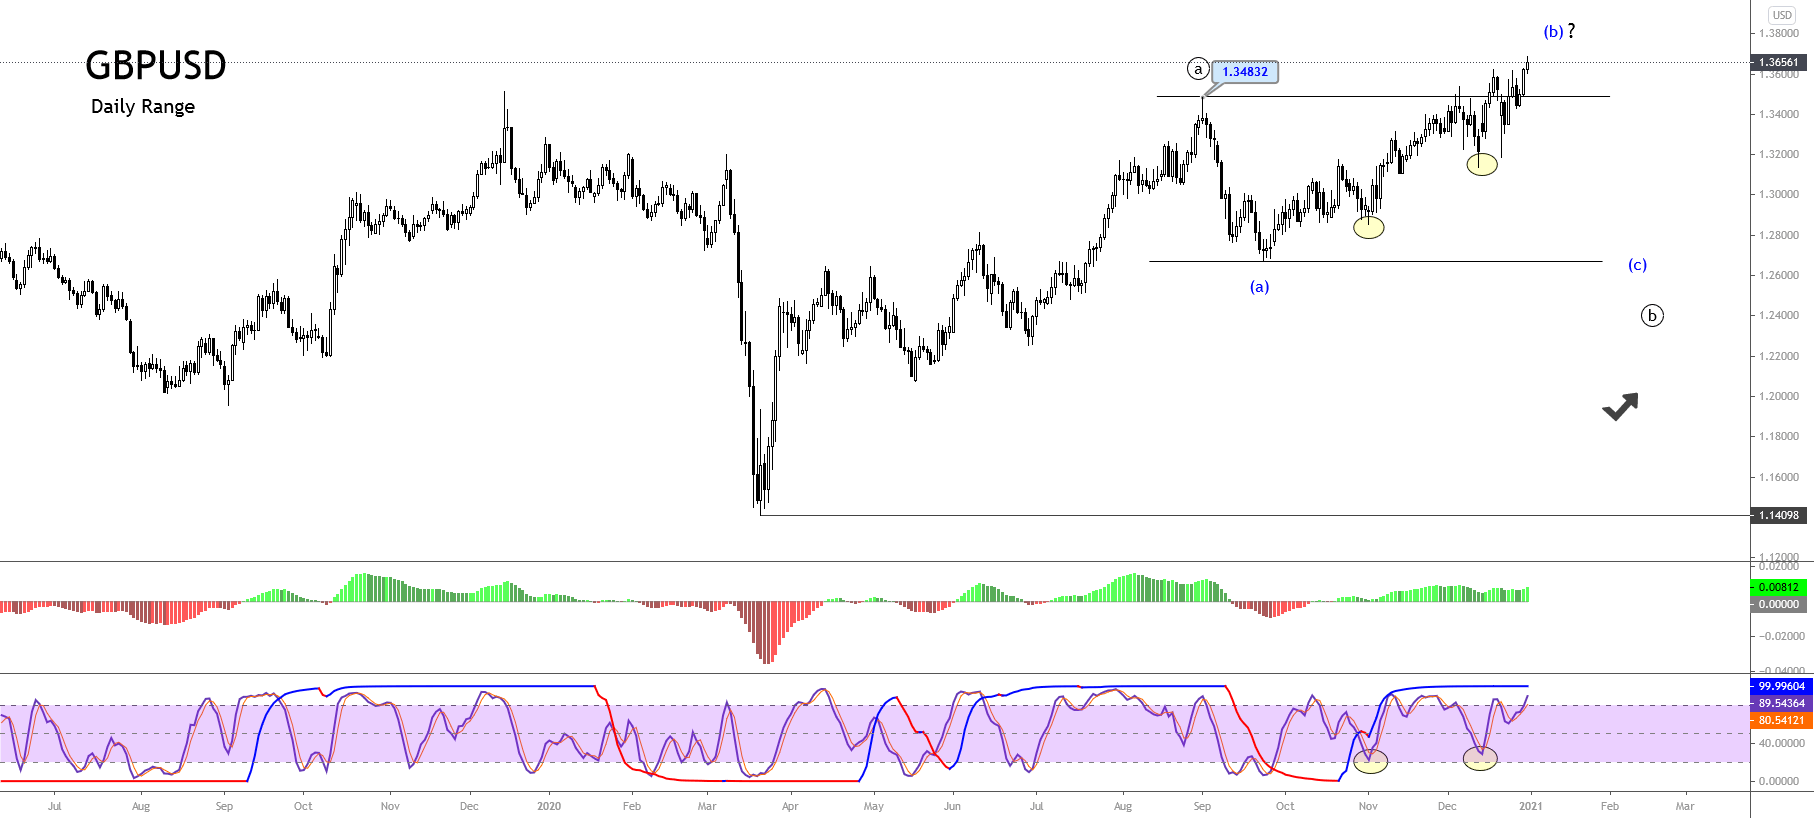
The previous chart shows the incomplete wave ((b)), which at the same time, rallies in a corrective sequence corresponding to wave (b) of Minuette degree identified in blue. This corrective formation in progress could correspond to an irregular flat pattern (3-3-5).
On the other hand, both the trend and momentum indicator confirms the upward bias of wave (b). The stochastic oscillator that acts as a timing indicator carries to suspect the wave (b) could advance in a complex correction. In this regard, the next 8-hour chart illustrates the internal structure of the wave (b).

The second chart exposes the Pound advancing in a triple-three pattern of Subminuette degree labeled in green. According to the textbook, this complex formation identified as w-x-y-x-z follows an internal structural series subdivided into (3-3-3-3-3). In this context, the complex correction in progress looks advancing in its third segment of wave z, which seems like an ending diagonal pattern.
In consequence, the GBPUSD should end this complex corrective rally in the coming trading sessions giving way to a new decline corresponding to wave (c) of Minuette degree.
Technical Outlook
The short-term structure developed by GBPUSD corresponds to an ending diagonal pattern, which suggests the finalization of the current corrective rally before starting a new decline.
The next chart exposes the Pound in its 8-hour time frame, which could make a new upward move, surpassing the ending diagonal pattern’s upper-line with a potential target in the area between 1.3700 and 1.3800.

Once the ending diagonal pattern finalizes, a breakdown below the Invalidation Level at 1.3439 would confirm the start of wave (c) in blue. According to the Elliott Wave Theory, this bearish leg should follow an internal sequence subdivided into a five-wave sequence.
On the other hand, considering that the upper degree’s current corrective pattern might correspond to an irregular flat, the price might develop two potential scenarios identified as follows.
- Scenario 1: If wave (c) finds support above the end of wave (a), the Pound could drop to the demand zone between 1.2916 and 1.2853. This scenario suggests the strong long-term bullish pressure and the Elliott Wave formation should correspond to an irregular flat pattern with the failure in wave (c).
- Scenario 2: If the price drops violating the end of wave (a) at 1.26753, the GBPUSD could decline to the next demand zone between 1.2553 and 1.2506. This scenario suggests the strength of bearish pressure, and the irregular flat pattern is extended in wave (c).
The price advance in a complex correction is identified as a triple-three formation, which seems moving in its last internal segment, which looks like an incomplete ending diagonal pattern. In this context, the breakdown and close below the 1.3439 would confirm the end of wave (b) and the start of wave (c) of Minuette degree identified in blue.
Considering that the upper degree corrective structure could correspond to an irregular flat pattern, wave (c) offers two potential scenarios. The first scenario could see a potential target between 1.2916 and 1.2853. In the second one, the price could decline between 1.2553 and 1.2506.
Related posts
 Daily F.X. Analysis, August 17 – Top Trade Setups In Forex – Eyes Technical Levels!
 Daily F.X. Analysis, August 21 – Top Trade Setups In Forex – Eyes in PMI Figures!
 Daily F.X. Analysis, January 06 – Top Trade Setups In Forex – ADP Non-Farm Employment Change Ahead!
 Daily F.X. Analysis, January 19 – Top Trade Setups In Forex – Economic Sentiment Under Spotlight!
3 replies on “GBPUSD Advances in an Irregular Correction. What’s Ahead?”
sorry sir, Is it an Elliott wave?
Yes, this is an Elliott Wave analysis.
sorry about my question, because it is the first time I see you use Elliott wave analysis
And what is the indicator below RSI?, and can I get it on tradingview?