

Description
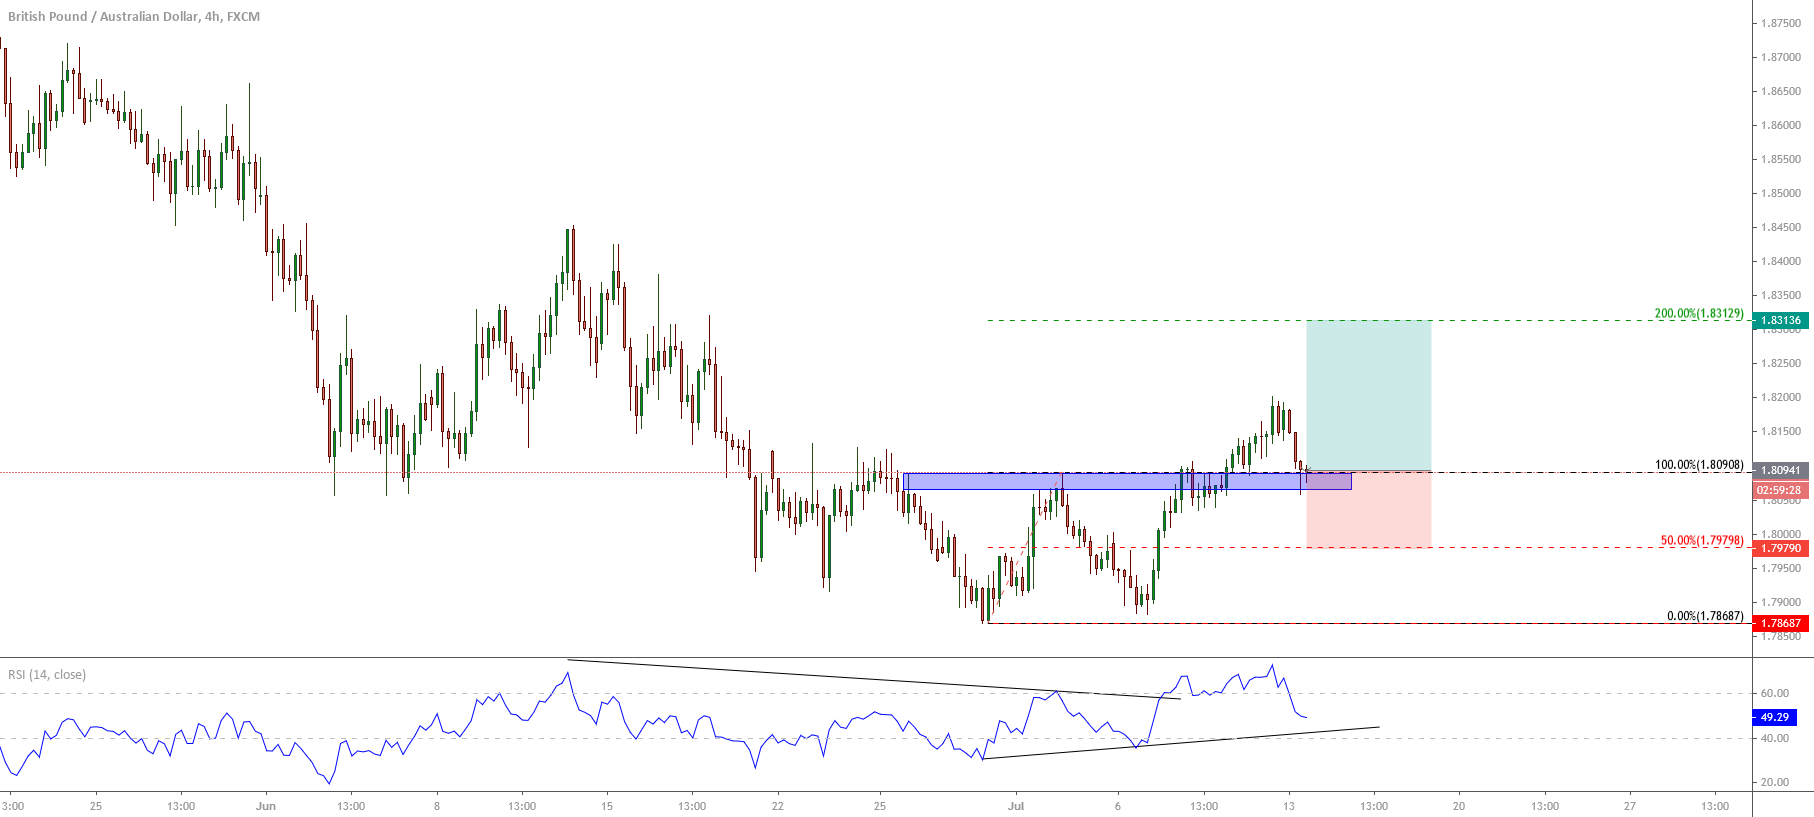
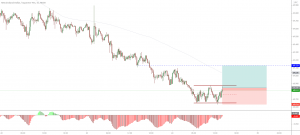
The GBPAUD cross in its 4-hour chart illustrates the double bottom pattern’s throwback, which activated once the price action surpassed the 1.8090 level.
The chartist formation characterized by having two valleys and one peak found its first valley at 1.7868 on June 30th, where developed a bounce that carried it until 1.8090 on July 02nd. The following valley that found support at 1.7882 created a bearish failure, from where the price action started to develop a bullish move. This intraday rally drove GBPAUD to reach a new short-term higher high, reflecting its movement on the RSI oscillator, which surpassed the level-70, giving an additional signal of potential recovery.

The current retracement, which corresponds to a throwback, lead us to conclude that the price action could develop a new rally with a potential profit target located at 1.8345.
Our invalidation level locates at 1.7981, which corresponds to 50% of the bottom formation range.
Chart

Trading Plan Summary
- Entry Level: 1.8096
- Protective Stop: 1.7981
- Profit Target: 1.8345
- Risk/Reward Ratio: 1.9
- Position Size: 0.01 lot per $1,000 in trading account.
Check out the latest trading signals on the Forex Academy App for your mobile phone from the Android and iOS App Store.


One reply on “GBPAUD Activates a Double Bottom Pattern”
what went wrong in this technical analysis of double bottom.
did not work?.. 2nd biggest forex academy big pip loss. (-116.3)