
Overbought and oversold, how can you tell when the market will reverse?
Thank you for joining this forex academy educational video.
In this session, we will be looking at when a currency pair is overbought or oversold and how to take advantage of this.
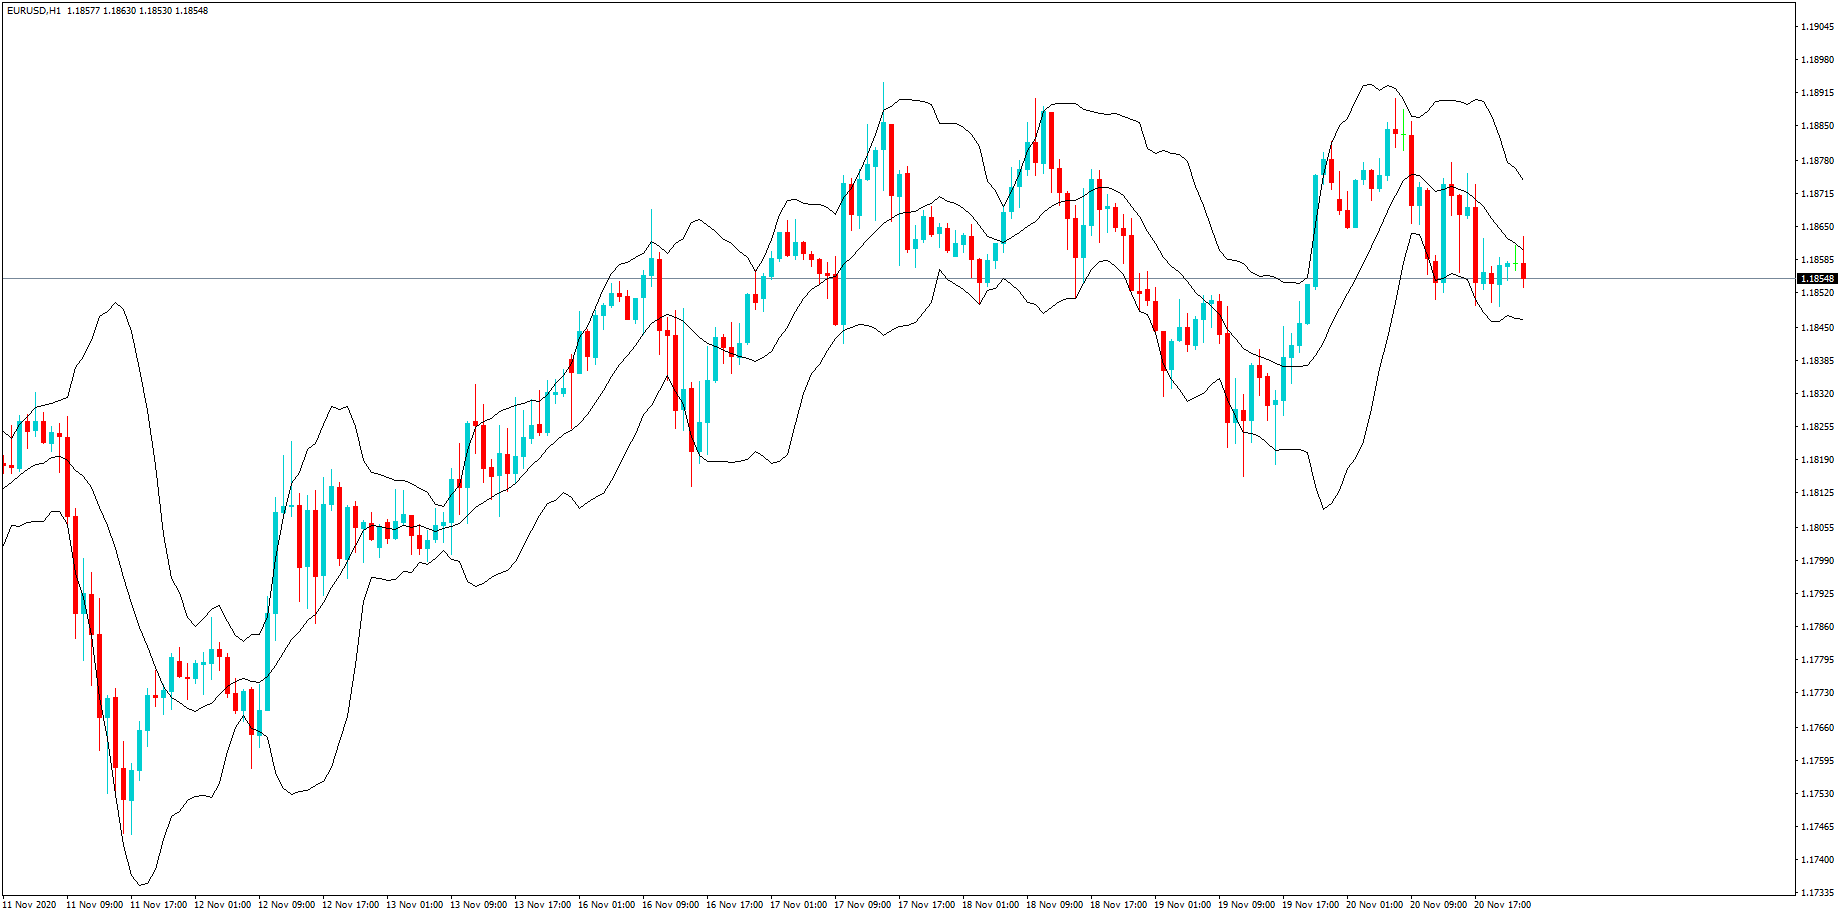
To try and gauge the best way wait to take advantage of when a market is overbought or oversold, we must first take a look at the biggest by volume currency pair traded in the forex market: the Euro against the US dollar, a so-called major currency pair. And this is a one-hour chart of recent price action.
To establish when a pair is oversold or overbought, there are a multitude of tools available. We will focus on one oscillator and price patterns.
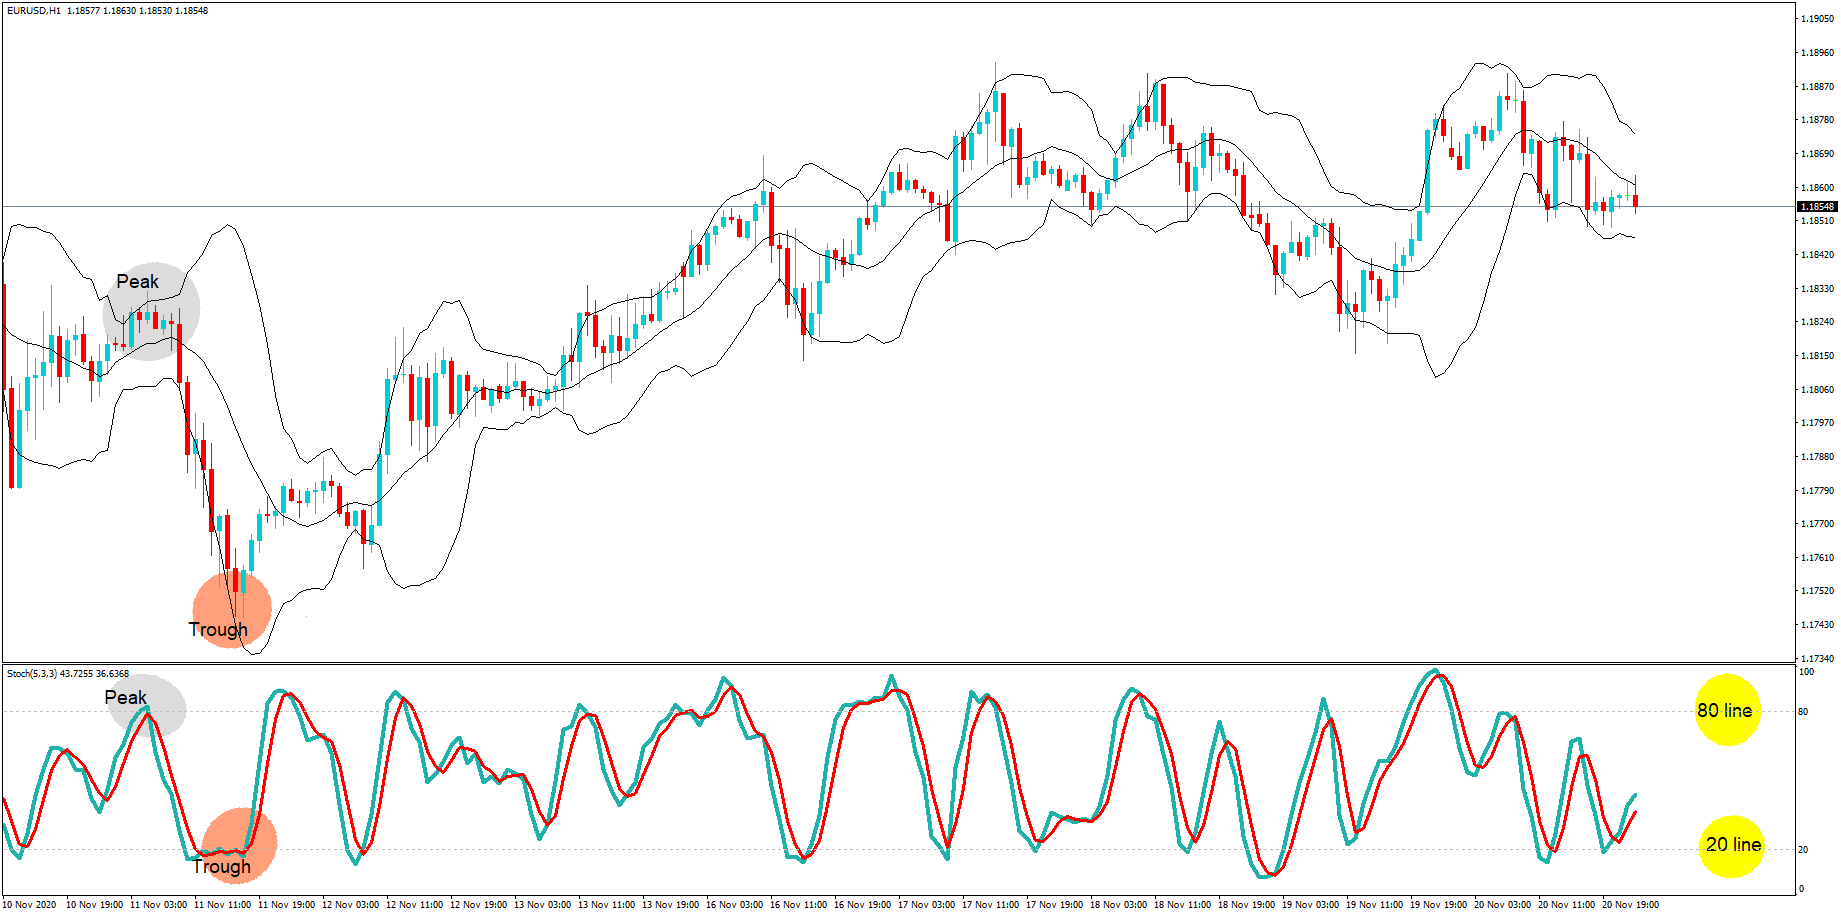
First of all, we have the stochastic oscillator. This tool consists of two moving averages that crossover at certain points, and when they move up and cross the 80-line, an asset is said to be overbought, and when the moving averages move lower and under than the 20-line, it is said to be oversold.

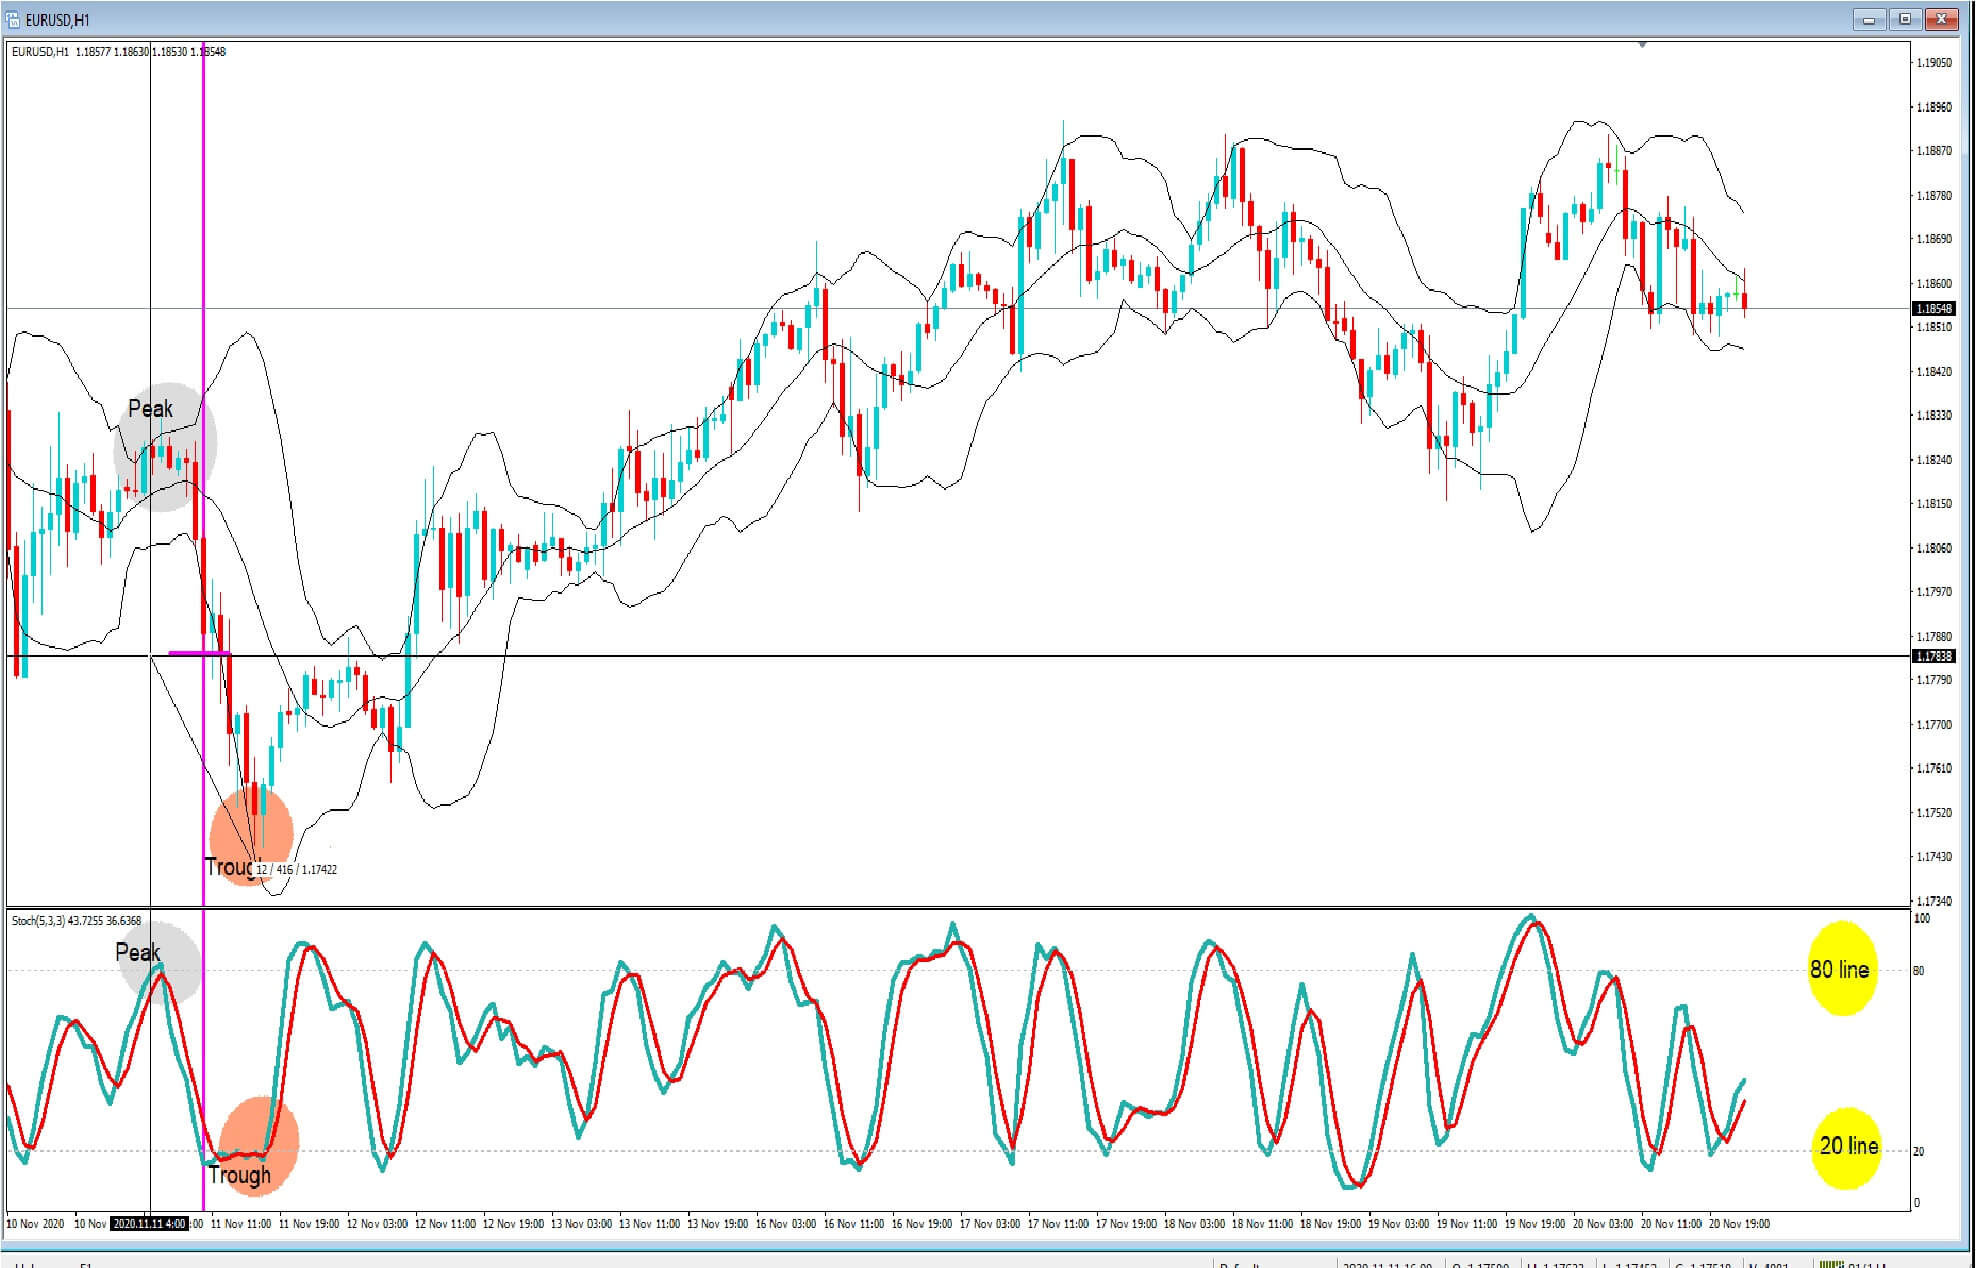
One of the problems with the stochastic oscillator, as we can see here, if we draw a magenta coloured vertical line, the market is actually oversold at the halfway point between the peak and the trough of this move. The pair continues to move lower after it is oversold. This is common with the stochastic.
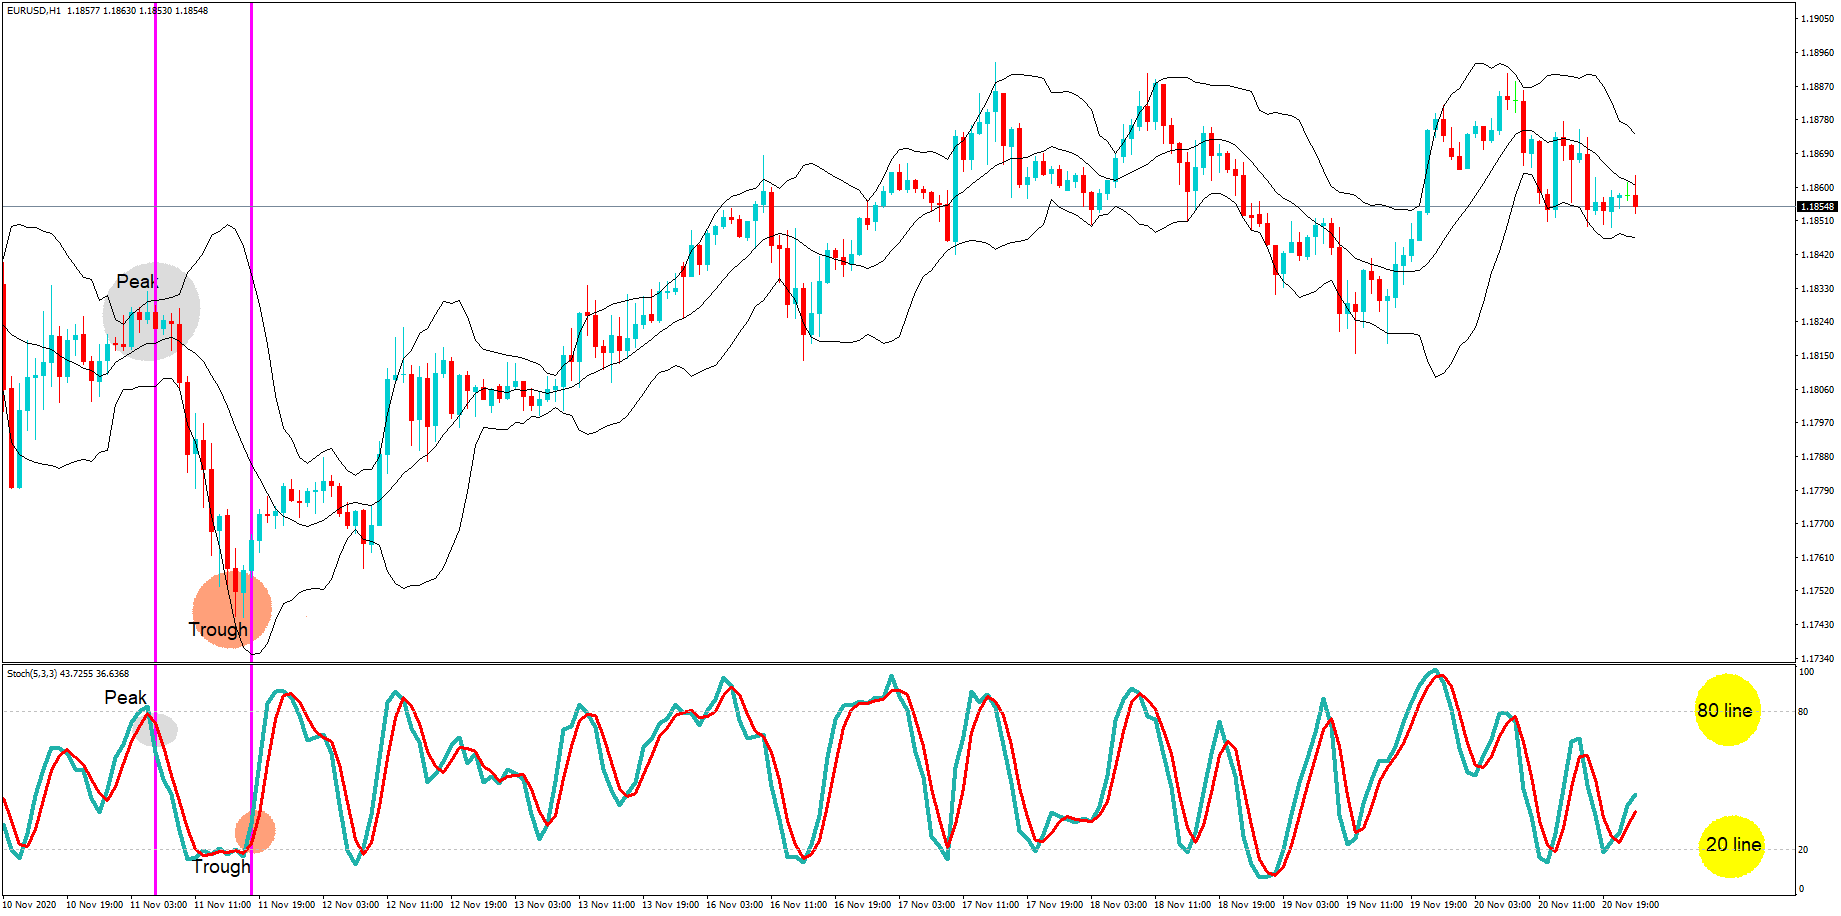
…in this example, it has moved lower by a further 41 pips after showing as oversold, before price action eventually does turn around and move higher, and it is then when the stochastic begins to comply with the price action.
One way that professional traders will guard against using the stochastic oscillator to get into a trade too early is to wait until the indicator has gone above the 80 and its moving averages have crossed over and moved under the line before they enter a short trade, or have moved under the 20 line, crossed over, and moved up above the line before they will enter a long trade.
Professional traders will very rarely use a single indicator such as the stochastic on its own to enter a trade.
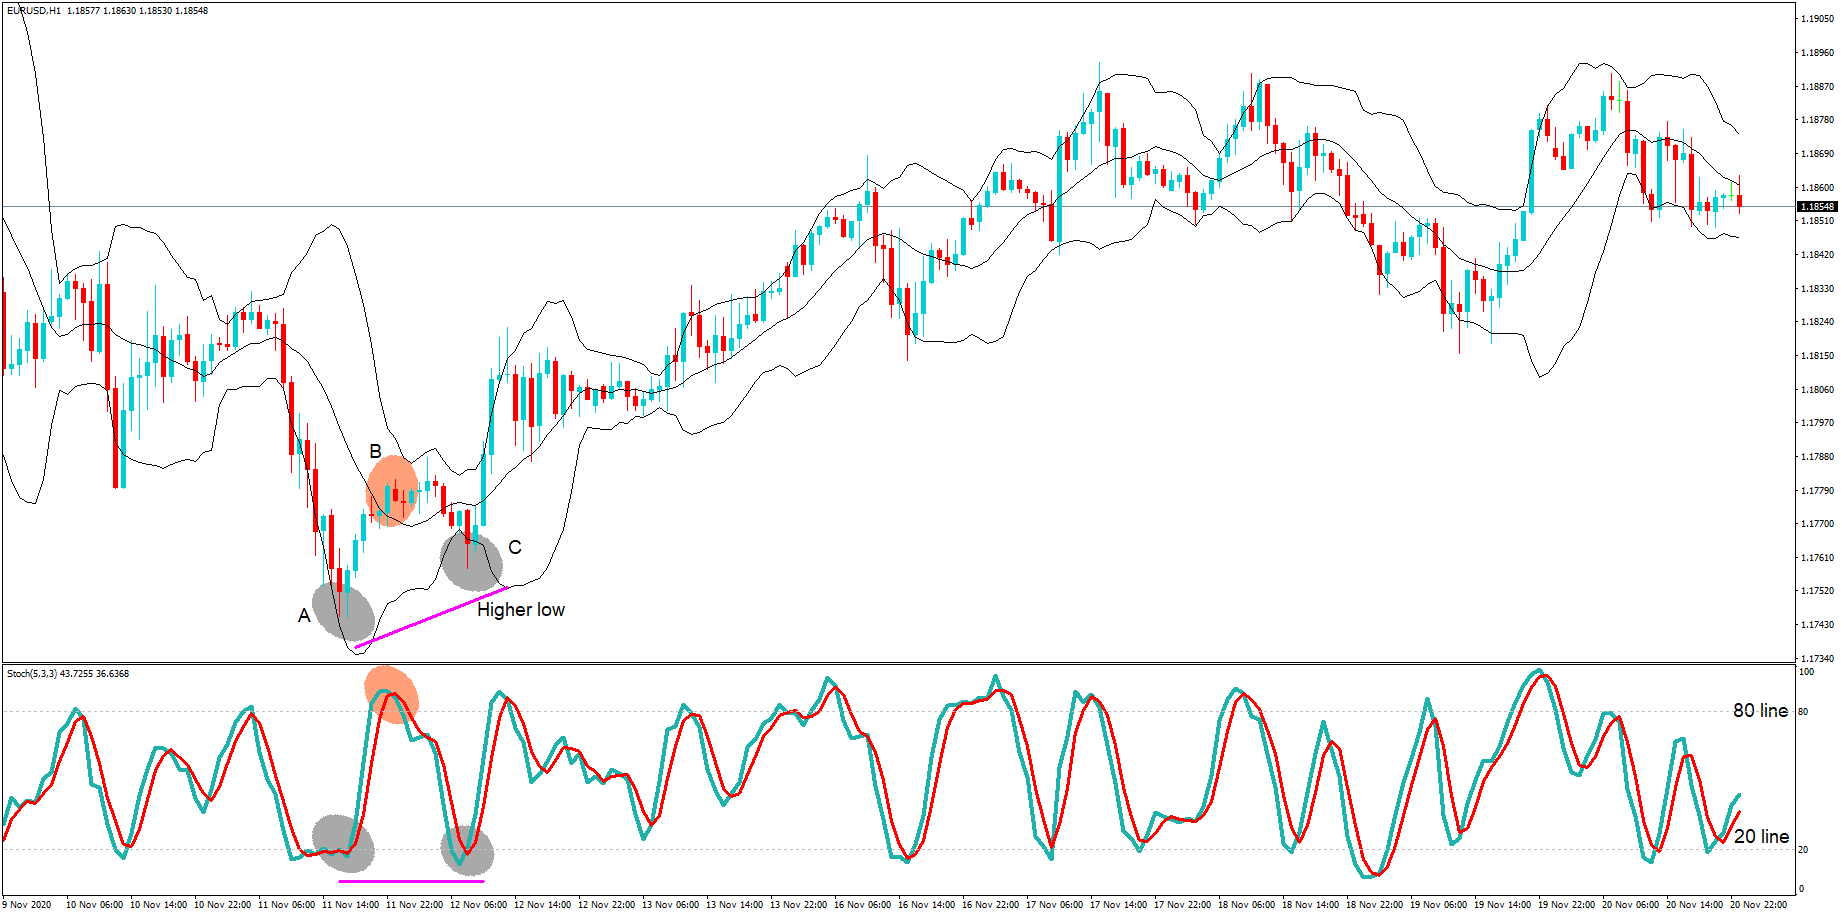
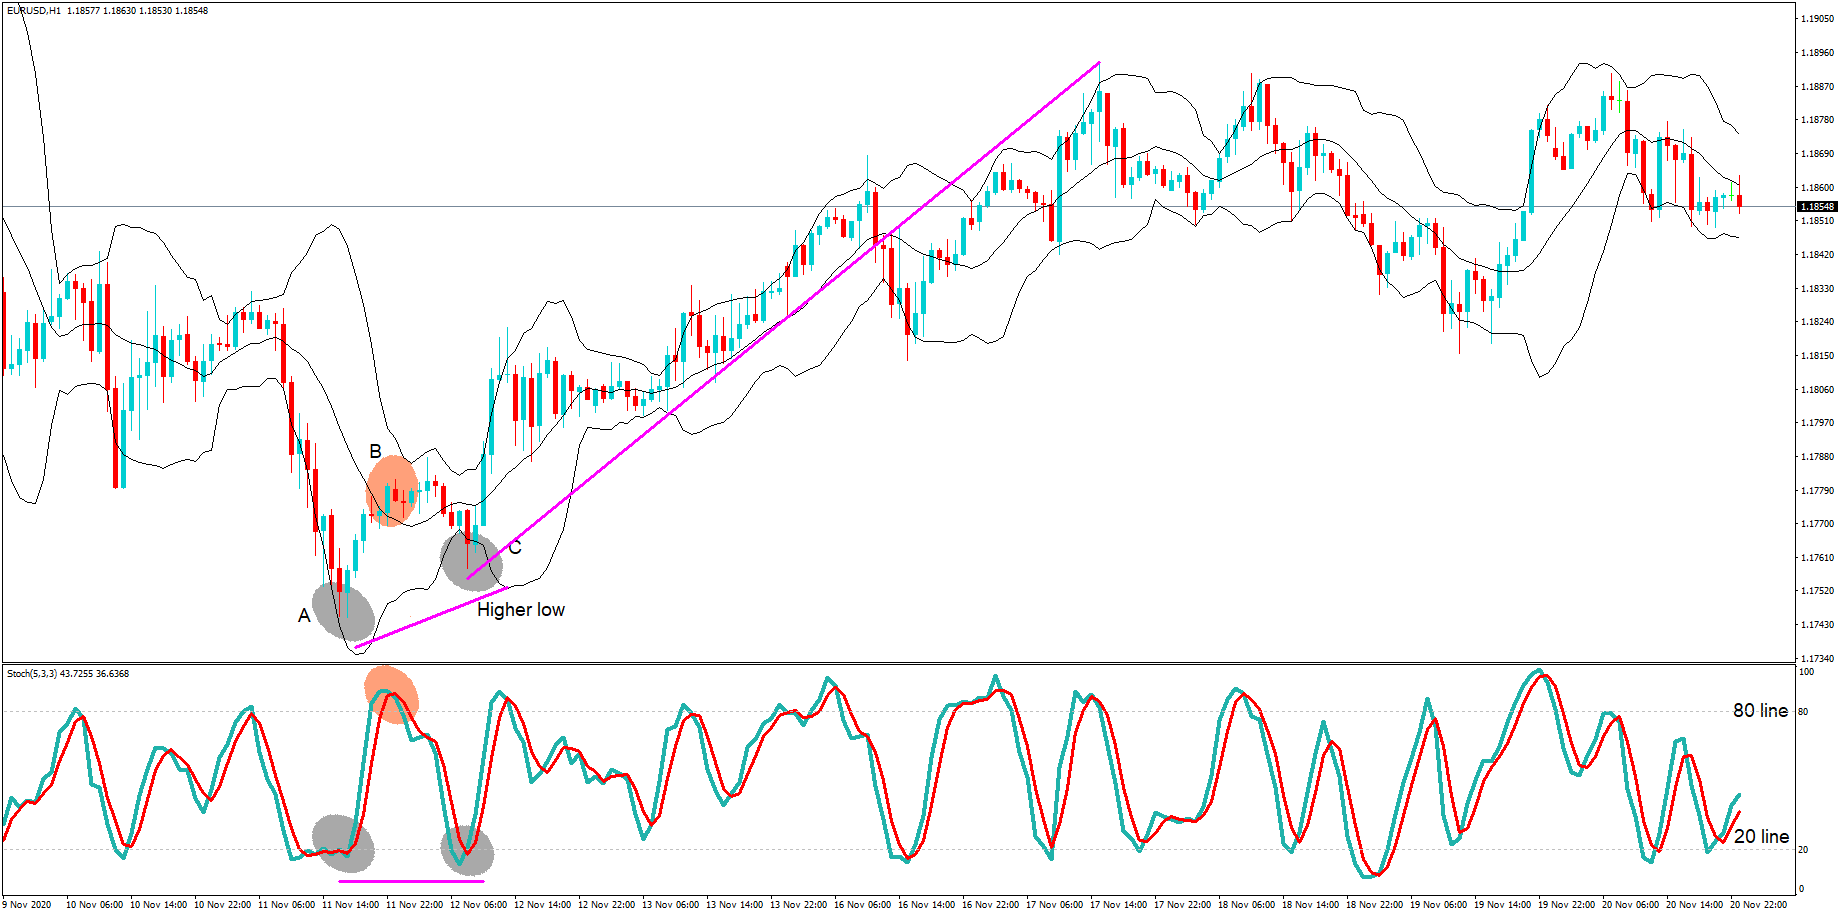
In this A B C scenario, we have more clues about potential future price direction. First, we have the stochastic showing oversold at position A, and when price action reverts higher to position B, price action appears to stay inflated and ignores the stochastic, initially. However, when price moves lower at position C, we have a divergence in the stochastic and price action, where the stochastic has moved lower to the 20% line, and price action at position C has not moved lower to the level at position A. It has formed a higher low, and this is an indication in itself that price action may be fading to the downside, especially when coupled with the hesitation to move lower at position B, and whereby a bear candle spike outside of the Bollinger band at position C is another hint that price action may move back inside the bands, because, as you will probably know, 95% of price action will revert inside the Bollinger bands if it spikes outside.
This setup, simply by using the stochastic to show oversold, where its moving averages have moved under the 20 line, then crossed over and moved higher than the 20-line, plus divergence in price action, and a higher low set up, and a candle spike outside the Bollinger bands has been the set up for this bull trade which saw 140 pips to the upside.
Simply look out for this setup in reverse to take on a bear trade.


One reply on “Forex – Overbought & Oversold – Easy Market Reversal Strategy!”
Wow! I’m so impressed I think next month I will venture to a real account straight