The cryptocurrency market has been trying to establish its position after the pullback that happened on Wednesday and Thursday. Bitcoin is currently trading for $10,260, which represents a decrease of 1.34% on the day. Meanwhile, Ethereum recovered from its big drop and gained 7.3% on the day, while XRP gained 2.67%.
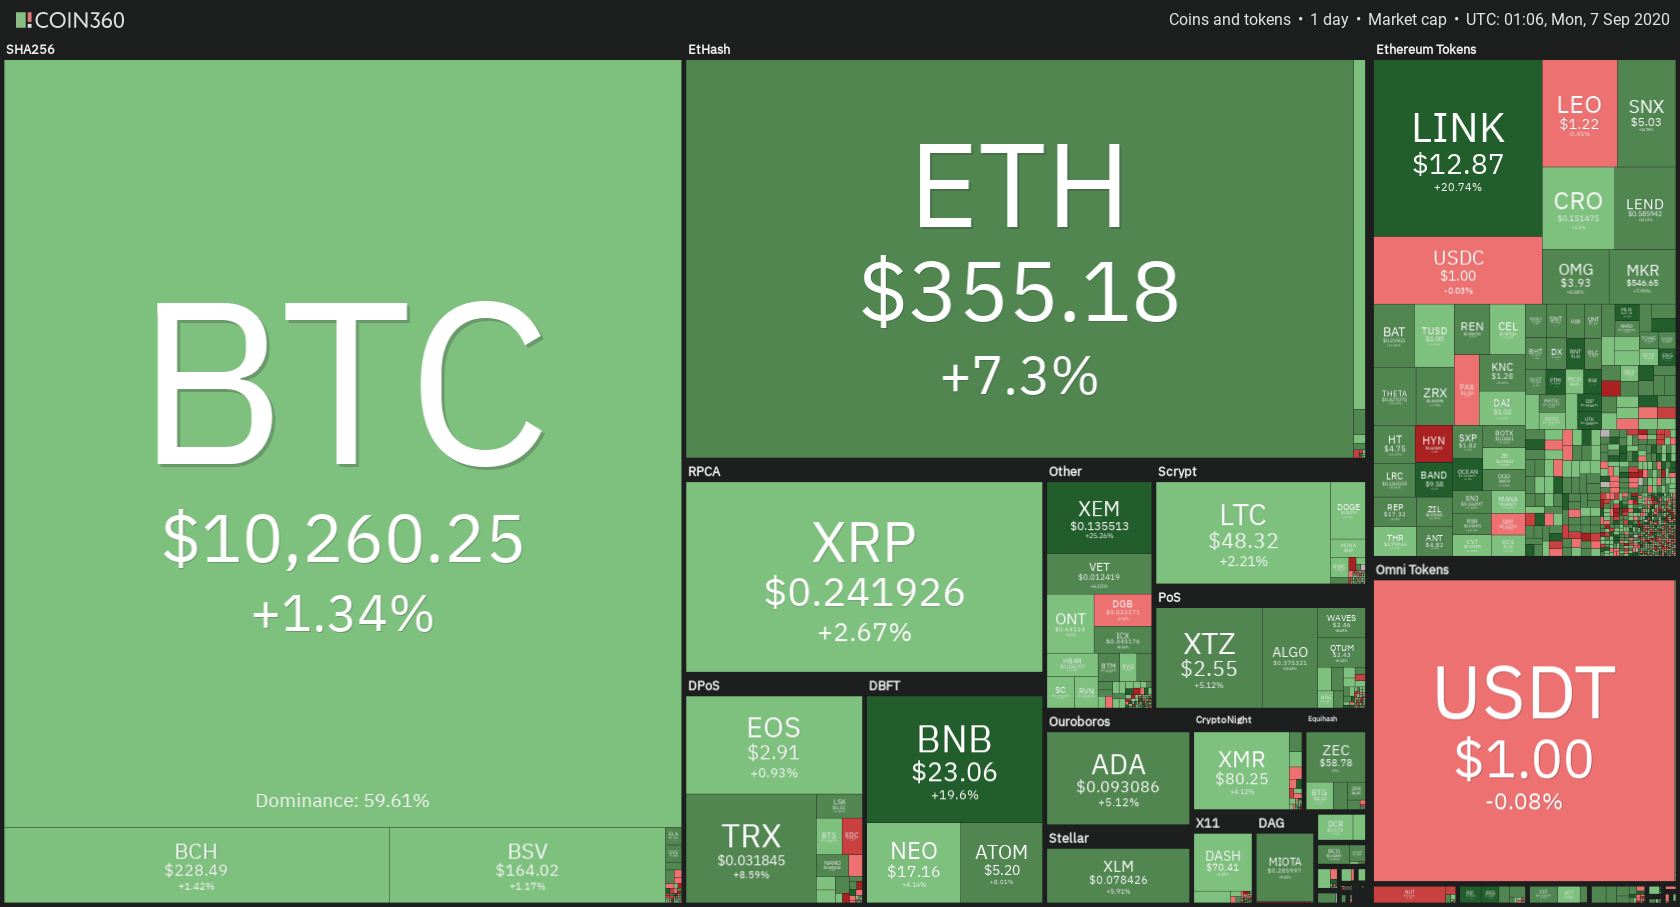
Daily Crypto Sector Heat Map
When taking a look at the top100 cryptocurrencies, SushiSwap gained 79.68% on the day, making it the most prominent daily gainer. UMA (31.22%) and Flexacoin (26.59%) also did great. On the other hand, the HedgeTrade lost 20.50%, making it the most prominent daily loser. It is followed by Hyperion’s loss of 15.70%. The rest of the market was either in the green or lost sub-1% of its value.
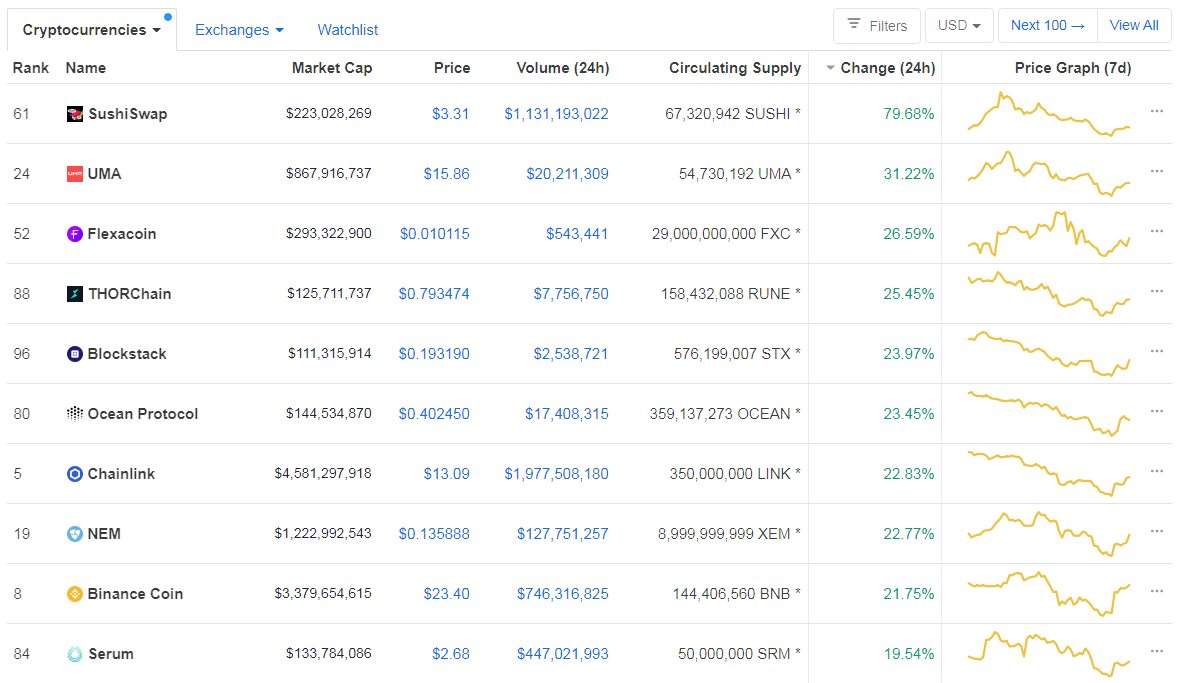
Top 10 24-hour Performers (Click to enlarge)

Bottom 10 24-hour Performers (Click to enlarge)
Bitcoin’s dominance level has gone up slightly, with its value is currently at 59.61%, which represents a 0.32% difference to the upside when compared to when we last reported.

Daily Crypto Market Cap Chart
The crypto sector capitalization has gone down slightly in the past 24 hours. Its current value is $331.58 billion, which represents a decrease of $3.07 billion when compared to our previous report.
_______________________________________________________________________
What happened in the past 24 hours?
_______________________________________________________________________
- Binance launches ‘centralized’ automated market maker pool for liquidity providers (The Block)
- Brazil will likely have a CBDC ready in 2022, says central bank president (The Block)
- Curve fork Swerve crosses $380M in total value locked within 12 hours of launch (The Block)
- Ampleforth Extends Yield Farming Incentives on Uniswap (Cryptobriefing)
- Chainlink Endures Spam Attack: Congestion, High Fees (Cryptobriefing)
- Bitcoin and Ethereum Show Signs of Recovery Despite Recent Correction (Cryptobriefing)
- New Litecoin update shows MimbleWimble is on track (Cryptoslate)
- Peter Schiff: ‘I was wrong about Bitcoin’ (Cointelegraph)
- DeFi experts say that Ethereum 2.0 is not the answer to high gas fees (Cointelegraph)
- Dash introduces protocol versioning in update (Cointelegraph)
_______________________________________________________________________
Technical analysis
_______________________________________________________________________
Bitcoin
After failing to break the $12,000 mark, BTC bears have taken over the market, causing the price to plummet, reaching as low as $10,000. The largest cryptocurrency by market cap took the weekend to consolidate and establish its presence above $10,000. However, the $10,360 resistance level proves its strength once again, making Bitcoin’s rebound towards the upside that much harder.
If the bulls fail to break the $10,360 level and sustain it, the bears will most likely make one more attempt to bring the price down. In this case, a drop to the 200-day SMA ($9,080) is likely. However, if BTC manages to bounce off the current level and rise above $10,500, a move to $11,000 is likely.
Traders should pay close attention to Bitcoin’s price movement around the $10,360 level, as the next move will determine its short-term future.
BTC/USD 4-hour Chart
Technical factors:
- Price is well below its 50-period and 21-period EMA
- Price is at its middle Bollinger band
- RSI is recovering from being in the oversold territory (38.77)
- Volume is descending (from extremely high)
Key levels to the upside Key levels to the downside
1: $10,360 1: $10,015
2: $10,500 2: $9,870
3: $10,850 3: $9,600
Ethereum
Ethereum had a similar weekend as Bitcoin, as its price consolidated and tried to establish itself above the most recent low of $310. While its price did get stuck at the $360 resistance level, it increased in value much more than Bitcoin, most likely due to the growing popularity of DeFi.
With all being said, Ethereum’s short-term future will be decided by the popularity of DeFi and the problems it will encounter with extremely high Gas fees.
Traders should pay attention to how ETH handles the $360 level.
ETH/USD 4-hour Chart
Technical Factors:
- The price is well below its 21-period and 50-period EMA
- The price is near its middle Bollinger band
- RSI is neutral and recovering from being oversold (40.82)
- Volume is descending (from high)
Key levels to the upside Key levels to the downside
1: $371 1: $360
2: $400 2: $340
3: $415 3: $300
Ripple
While XRP suffered the same fate as Bitcoin and Ethereum in terms of price movement, the third-largest cryptocurrency by market cap did have slight differences in the move towards the downside. XRP had several bull comebacks that tried to push the price back up, but failed due to the overall bearishness of the market.
XRP is now consolidating between the $0.235 and $0.2454, with low volume and no signs of future movement (unless the technicals change drastically).
XRP traders should watch out for any form of break of the immediate support/resistance levels.
XRP/USD 4-hour Chart
Technical factors:
- The price is well below its 21-period and 50-period EMA
- Price is near its middle Bollinger band
- RSI is recovering from being oversold (40.84)
- Volume is low (back from elevated)
Key levels to the upside Key levels to the downside
1: $0.2454 1: $0.235
2: $0.266 2: $0.227
3: $0.285 3: $0.221
Related posts
 Daily Crypto Review, Mar 16 – Bitcoin under $5,000, how far down can we go?
 Daily Crypto Review, Mar 20 – Cure for Coronavirus found? Crypto surging, Bitcoin above $6,000
 Daily Crypto Review, Dec 09 – Bitcoin Drops to $18,000; Crypto Market Tumbles
 Daily Crypto Review, Dec 15 – Bitcoin Whales Stopping the Push Towards $20k; XRP on the Downturn
One reply on “Daily Crypto Review, Sept 7 – Peter Schiff: “I Was Wrong About Bitcoin”; Bitcoin Facing $9,000 or Recovering?”
Interesting week ahead