
The crypto sector had quite a bad day as almost every single cryptocurrency ended up in the red. Bitcoin is currently trading for $11,376, which represents a decrease of 4.26% on the day. Meanwhile, Ethereum lost 6.82% on the day, while XRP lost 9.33%.
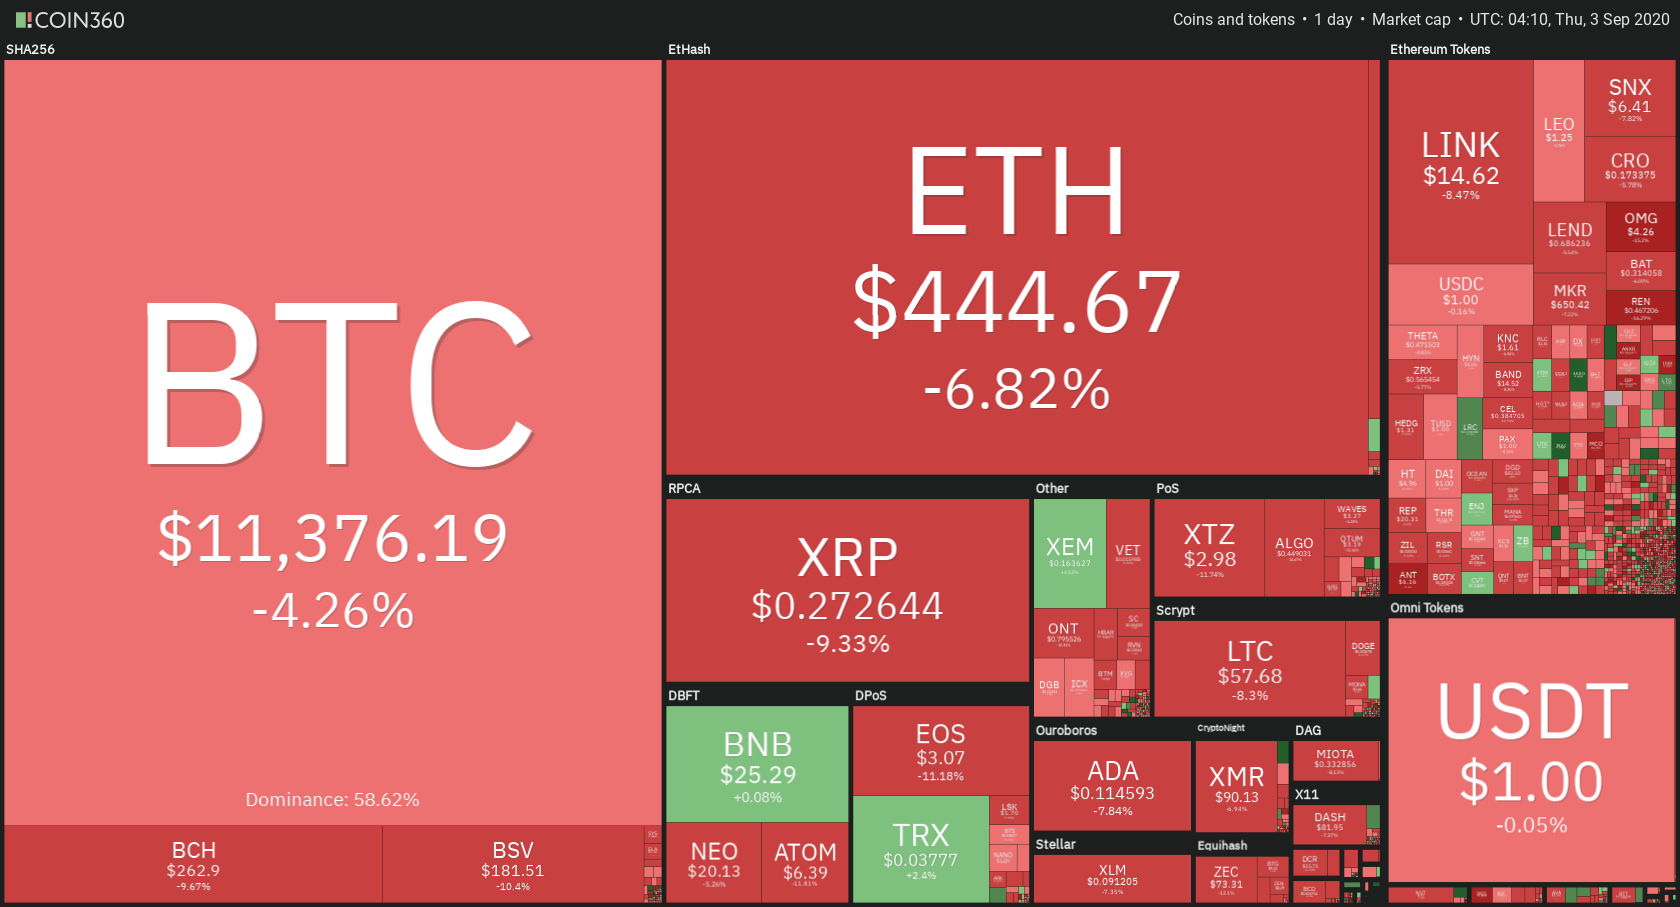
Daily Crypto Sector Heat Map
When taking a look at the top100 cryptocurrencies, Kusama gained 24.25% on the day, making it the most prominent daily gainer. UMA (13.51%) and JUST (9.08%) also did great. On the other hand, the Ampleforth lost 26.14%, making it the most prominent daily loser. It is followed by OMG Network’s loss of 15.44% and Aragon’s drop of 15.44%.
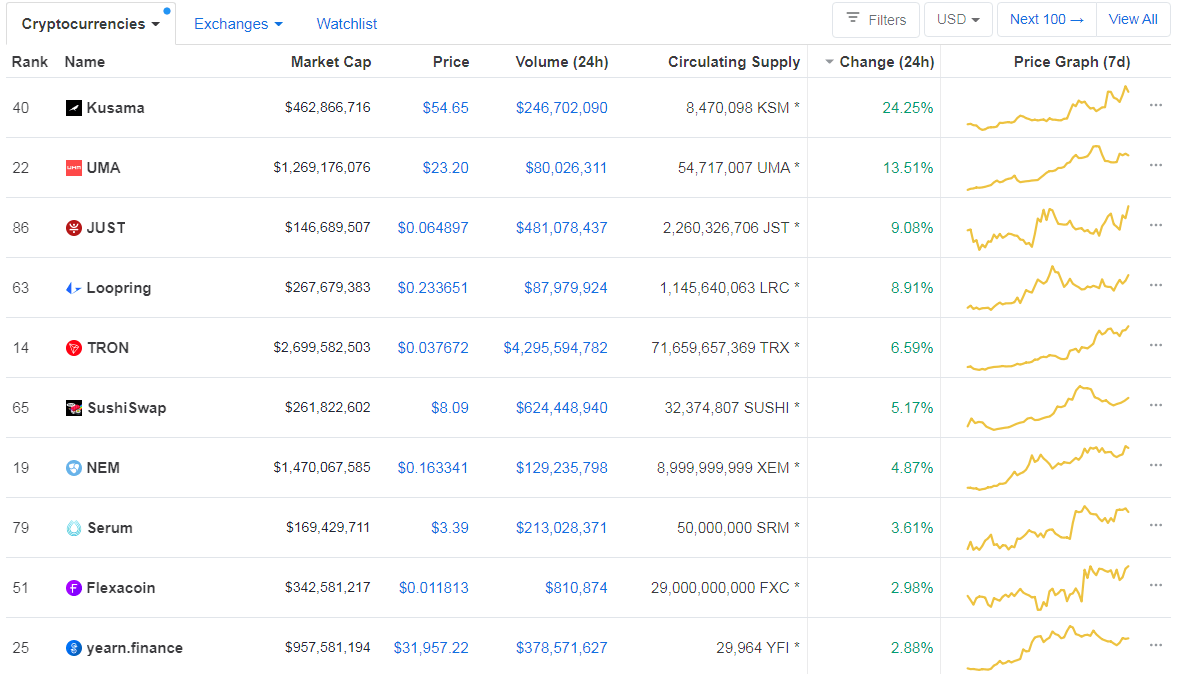
Top 10 24-hour Performers (Click to enlarge)

Bottom 10 24-hour Performers (Click to enlarge)
Bitcoin’s dominance level has gone up slightly, with its value is currently at 58.62%, represents a 0.48% difference to the upside when compared to when we last reported.

Daily Crypto Market Cap Chart
The crypto sector capitalization has decreased significantly over the course of the day. Its current value is $375.41 billion, which represents a decrease of $15.64 billion when compared to our previous report.
_______________________________________________________________________
What happened in the past 24 hours?
_______________________________________________________________________
- DeFi Flippening Comes to Exchanges as Uniswap Topples Coinbase in Trading Volume (Coindesk)
- WSJ: Robinhood facing SEC investigation over dealings with high-frequency trading shops (The Block)
- Bitcoin dominance falls as Ethereum, DeFi dominate the crypto market (Cryptoslate)
- DeFi newbie Sushiswap locks up $1 billion, SUSHI pumps to ATHs (Cryptoslate)
- DeFi Lending Project Teller Finance Taps Chainlink for Unsecured Loans Product (Cryptobriefing)
- Polkadot-Based DeFi Project Plows Ahead, $205 Million Staked on Stafi (Cryptobriefing)
- yEarn’s Ethereum Vault Offers Lucrative Gains for Holding ETH (Cryptobriefing)
- Vitalik Buterin reveals why a 51% attack on ETH 2.0 ‘would not be fatal’ (Cointelegraph)
- Indian prime minister the latest victim of crypto scam Twitter hack (Cointelegraph)
- Vienna and Singapore stock exchanges embrace Bitcoin and Ethereum (Cointelegraph)
_______________________________________________________________________
Technical analysis
_______________________________________________________________________
Bitcoin
Bitcoin’s push towards the upside yesterday culminated by the cryptocurrency price reaching the $12,000 mark before triggering a bear push. The largest crypto by market cap couldn’t keep its price above the level, which triggered massive bearish volume that brought the price down as low as $11,150. Bitcoin is currently consolidating right below $11,460, which it is testing and trying to get past. However, this level has proven to be a strong resistance point at the moment.
Traders should pay attention to Bitcoin’s price movement around $11,460.
BTC/USD 4-hour Chart
Technical factors:
- Price is below its 50-period and 21-period EMA
- Price is just above its lower band
- RSI is stable (38.13)
- Volume is coming back to normal after a massive spike
Key levels to the upside Key levels to the downside
1: $11,630 1: $11,460
2: $12,015 2: $11,090
3: $12,330 3: $10,855
Ethereum
Ethereum had a similar day to Bitcoin, with its price plummeting and reaching as low as $418 after failing to break $496 to the upside. The second-largest crypto by market cap is currently near the $445 level, which is resisting any current pushes towards the upside that Ethereum makes at the moment.
With all this being said, Ethereum is still looking extremely bullish as DeFi’s volume and the number of users is reaching its all-time highs. Traders should look for a break from the $445 level.
ETH/USD 4-hour Chart
Technical Factors:
- The price is at its 21-period and below 50-period EMA
- The price is just below the middle band
- RSI is neutral (52.47)
- Volume is descending (from extremely high)
Key levels to the upside Key levels to the downside
1: $445 1: $415
2: $496 2: $400
3: $360
Ripple
XRP was no exception when it comes to today’s price movement. The third-largest crypto by market cap crashed, at one point reaching sub-$0.266 levels. However, the price recovered, and XRP is currently consolidating at the $0.272 level. However, unlike Bitcoin and Ethereum, which seem ready to test its resistance levels, XRP’s low volume as well as price position signal that there is almost no chance it will move towards the upside on its own.
Traders should look at XRP’s next move, which will be triggered by a volume spike.
XRP/USD 4-hour Chart
Technical factors:
- The price is below its 21-period and 50-period EMA
- Price is just above its lower band
- RSI is stable and leaning towards the oversold area (39.55)
- Volume is slightly below average
Key levels to the upside Key levels to the downside
1: $0.285 1: $0.266
2: $0.31 2: $0.2454
3: $0.32
Related posts
 Daily Crypto Review, Mar 27 – XRP recording double-digit gains as Ripple Labs donates $200,000 to fight COVID-19
 Daily Crypto Review, Jun 15 – Bitcoin Under $9,000; What Happens Next?
 Daily Crypto Review, Jun 22 – COVID-19 Test Results Stored on the Blockchain; Ethereum Chasing $240
 Daily Crypto Review, Jun 24 – Italy Ready For The Digital Euro; Ethereum Rushing Towards Next Resistance Level
One reply on “Daily Crypto Review, Sept 3 – DeFi Flippening: Unifi’s Volume Topples Coinbase”
Tough couple of days im sure its just a retracement for the next pump