
The cryptocurrency sector has lost some value as Bitcoin failed to break $11,000. Bitcoin is currently trading for $10,660, representing a decrease of 1.68% on the day. Meanwhile, Ethereum lost 1% on the day, while XRP gained 0.76%.
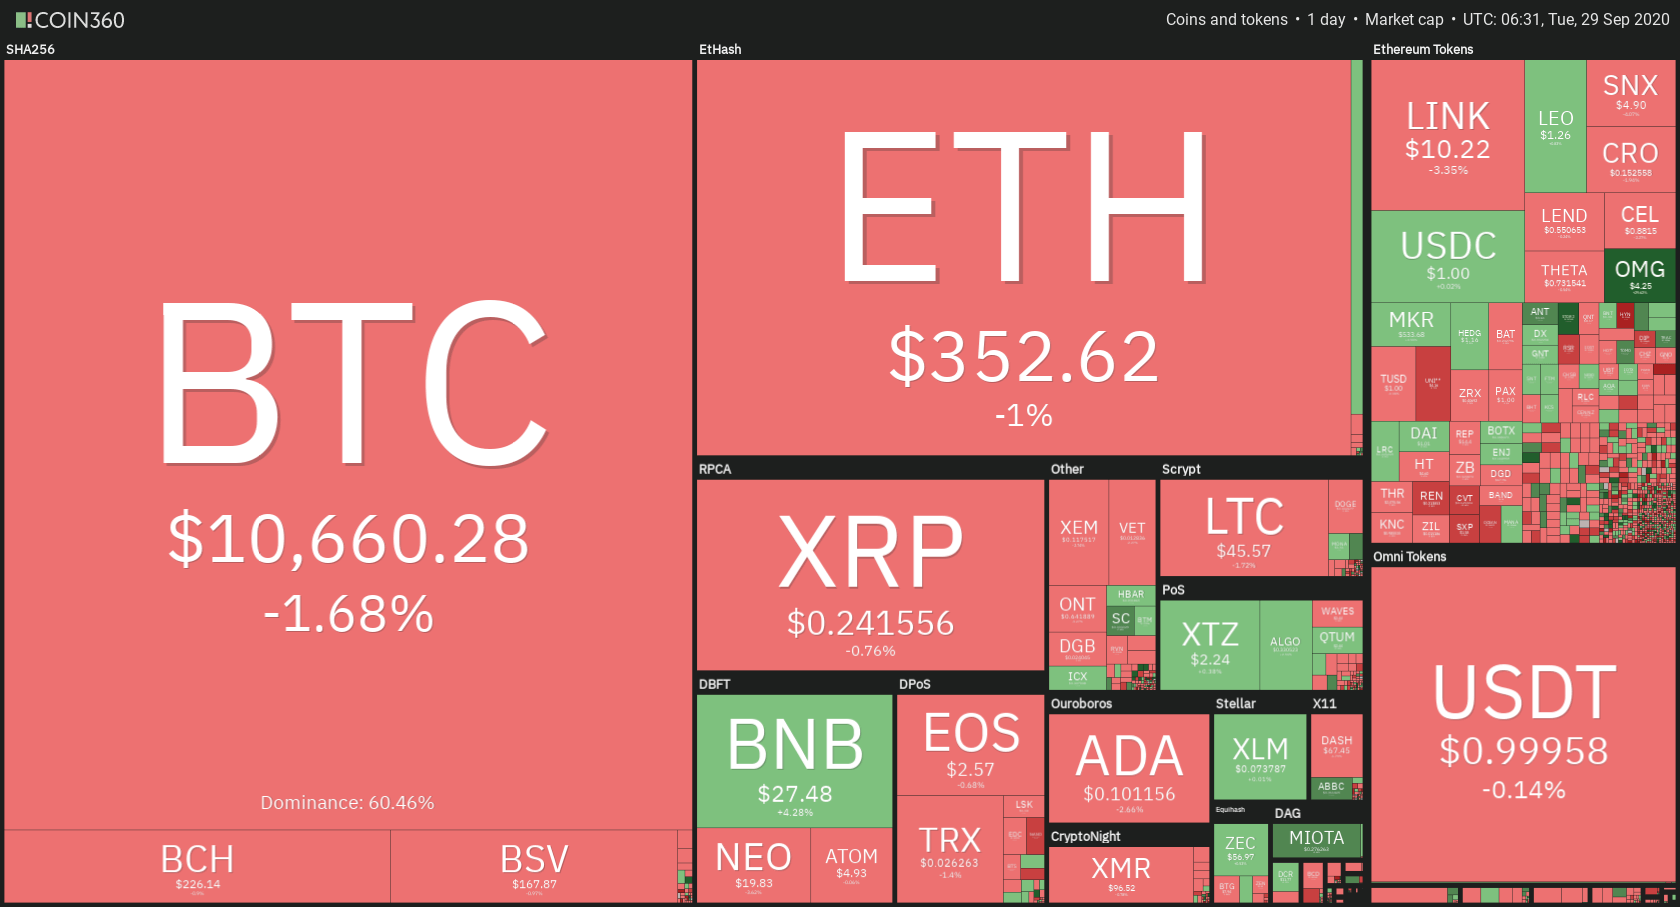
Daily Crypto Sector Heat Map
If we look at the top100 cryptocurrencies and their gains and losses, OMG Network gained 27% on the day, making it the most prominent daily gainer. ABBC Coin (18.7%) and Storj (16.95%) also did great. On the other hand, DeFi projects took a hit as Uniswap lost 16.2%, making it the most prominent daily loser. It is followed by DFI. Money’s loss of 13.47% and Ocean Protocol’s loss of 12.4%.
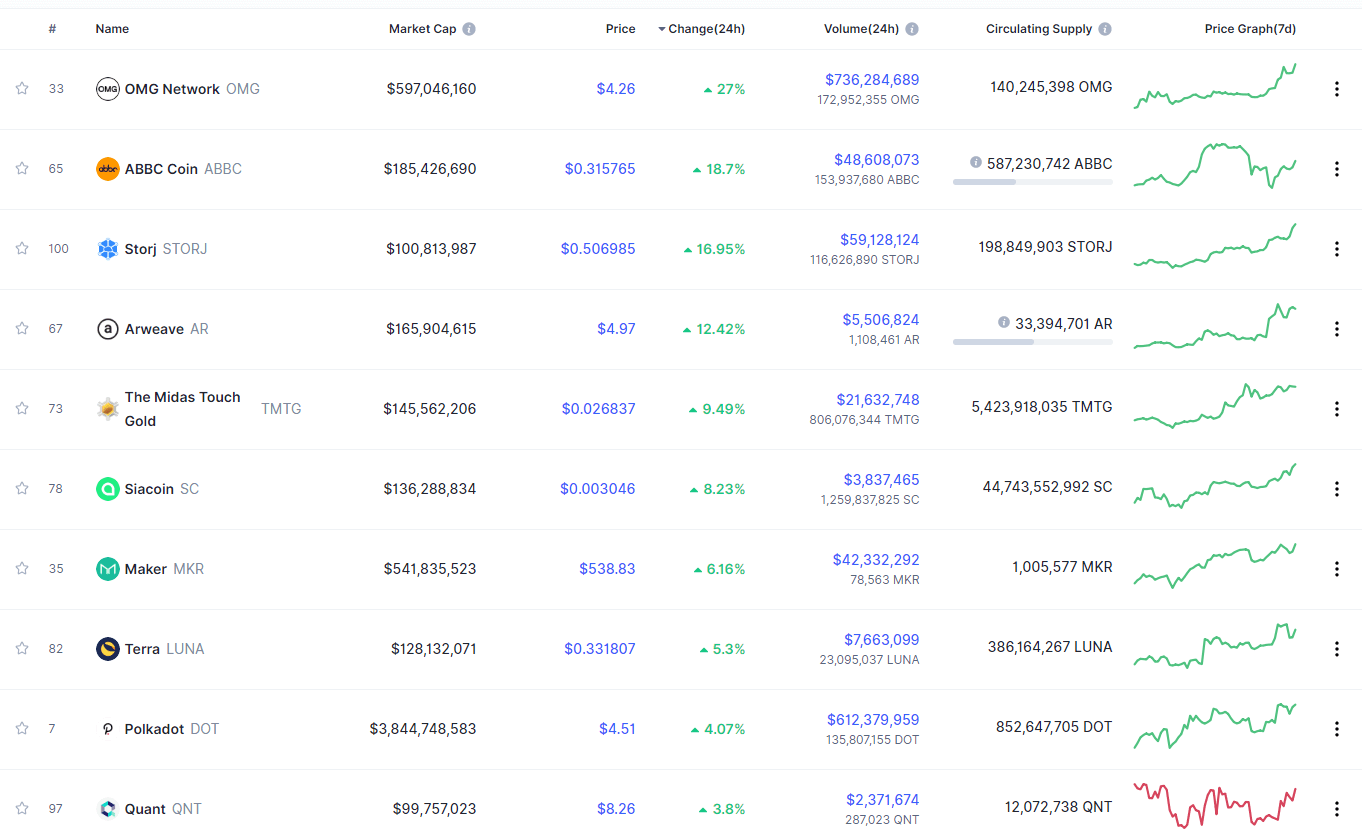
Top 10 24-hour Performers (Click to enlarge)

Bottom 10 24-hour Performers (Click to enlarge)
Bitcoin’s level of market dominance decreased slightly since our last report, with its value currently being at 60.46%. This value represents a 0.29% difference to the downside when compared to when we last reported.
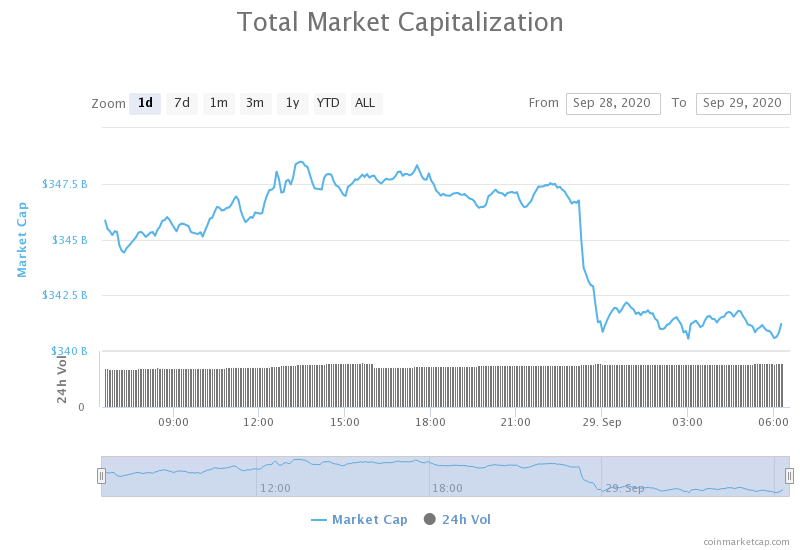
Daily Crypto Market Cap Chart
The crypto sector capitalization has lost in value over the course of the past 24 hours. Its current value is $343.89 billion, which represents a decrease of $5.5billion when compared to our previous report.
_______________________________________________________________________
What happened in the past 24 hours?
_______________________________________________________________________
- Grayscale Investments now controls 2.4% of the current BTC supply (Cointelegraph)
- Ethereum cumulative fees in 2020 eclipsed Bitcoin’s for the first time (Cointelegraph)
- One of Hal Finney’s lost contributions to Bitcoin Core to be ‘resurrected’ (Cointelegraph)
- The Inevitable Marriage of Yield Farming and NFTs, Explained (Coindesk)
- Cardano Announces More Upgrades; ADA Looks Ready to Take Shelter (Cryptobriefing)
- DeFi’s Favorite Stablecoin is Backed by More than 60% Centralized Assets (Cryptobriefing)
- This DeFi trend suggests crypto will reach a market cap in the trillions in the future (Cryptoslate)
- Wall Street’s credit default swaps have found their way to DeFi (The Block)
- Avalanche, the latest staking network to launch, already has more than $1 billion staked (The Block)
- Binance unveils a new ‘decentralized’ stablecoin system, Venus (The Block)
_______________________________________________________________________
Technical analysis
_______________________________________________________________________
Bitcoin
Bitcoin failed to end the day above the large triangle formation (and the 38.2 Fib retracement level), which caused its price to push back inside the body of the triangle. The move towards the upside exhausted the buyers as they couldn’t get past the 50-day moving average as well as the Fib retracement level.
BTC/USD 1-day Chart
If we zoom in to the 4-hour chart, we can clearly see that this was a fakeout that exhausted the buy-side even further. While it is unknown where Bitcoin’s next move will be, traders should look at the triangle and check for where BTC exits it.
BTC/USD 4-hour Chart
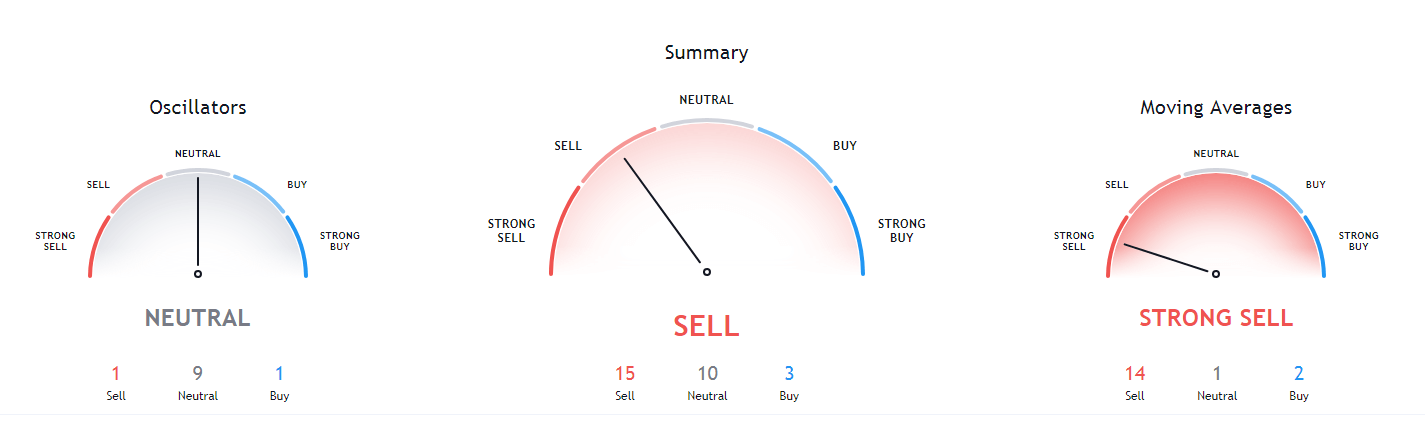
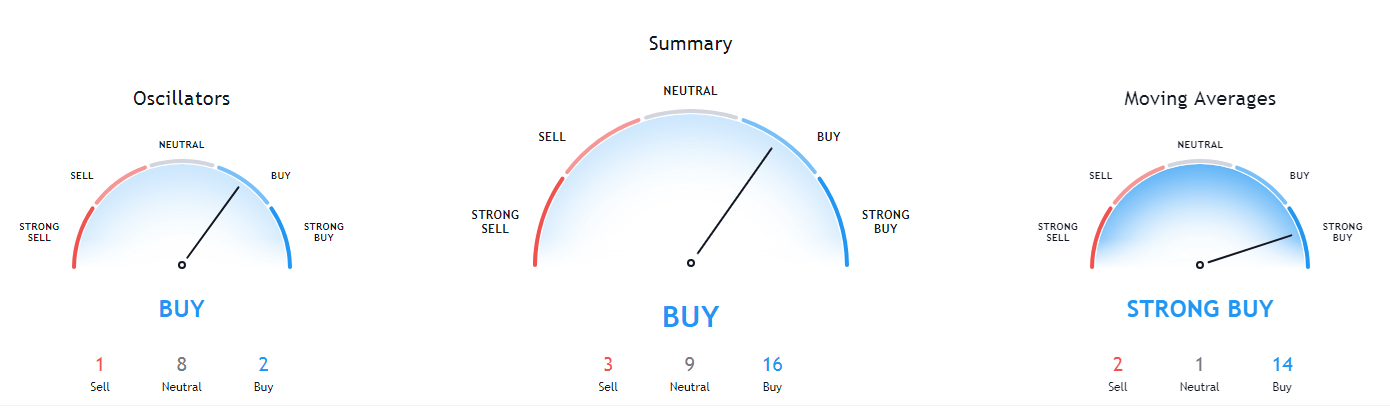
Bitcoin’s short-term technicals have changed its position from a “buy” to a “sell.” When comparing the technicals, we can see that the longer time frame we pick, the more bullish the Bitcoin overview is.
BTC/USD 4-hour Technicals
Technical factors (4-hour Chart):
- Price is slightly below its 50-period EMA and below its 21-period EMA
- Price is below its middle Bollinger band
- RSI is neutral (47.23)
- Volume is average
Key levels to the upside Key levels to the downside
1: $10,850 1: $10,630
2: $11,000 2: $10,500
3: $11,090 3: $10,015
Ethereum
Ethereum has been in a state of constant price growth since Sept 24, with the price posting higher and highs as well as higher lows. This time, while the movement towards the downside was a bit sharper than usual, Ethereum has still posted a higher low, indicating it’s not as bullish as many people think. However, this move towards the downside stopped Ethereum from moving above the dreaded $360 resistance level, once again fulfilling the words of the majority of Options traders, which called for ETH trading between $340 and $360 until the end of October.
ETH/USD 4-hour Chart
While Ethereum’s 4-hour and 1-day technicals turned slightly more bearish and are tilted towards the sell-side, its longer-term overview is extremely bullish. When talking about weekly or monthly technicals, the sentiment is heavily tilted towards the buy-side.

ETH/USD 4-hour Technicals
Technical Factors (4-hour Chart):
- The price is at its 50-period and its 21-period EMA
- The price is at its middle Bollinger band
- RSI is neutral (51.26)
- Volume is average
Key levels to the upside Key levels to the downside
1: $360 1: $340
2: $371 2: $300
3: $400 3: $289
Ripple
Not much has happened for XRP in the past 24 hours regarding price movement. The $0.2454 level stopped out any push from the bull-side, making XRP stagnant just below this resistance level. However, this made it almost clear that the 5th leg of the Elliot impulse wave did end with XRP’s move towards $0.219 (the circled candles). We can expect XRP to trader between the $0.235 support level and $0.2454 resistance level for some time.
XRP/USD 4-hour Chart
Ever since XRP left the Elliot wave pattern behind it, its short-term overview has turned bullish. However, its overview changes to bearish and then extremely bearish the longer we go in time (daily, weekly, monthly overview).
XRP/USD 4-hour Technicals
Technical factors (4-hour Chart):
- The price is above both its 50-period EMA and its 21-period EMA
- Price is slightly above its middle Bollinger band
- RSI is neutral (55.23)
- Volume is stable and average
Key levels to the upside Key levels to the downside
1: $0.2454 1: $0.235
2: $0.266 2: $0.227
3: $0.27 3: $0.221
Related posts
 Daily Crypto Review, May 8 – Bitcoin Contesting $10,000 as Halving Nears – What’s Next?
 Daily Crypto Review, May 11 – Bitcoin Hours from its Halving Event; Traders Entering the “Greed” Stage
 Daily Crypto Review, May 12 – Bitcoin Halving Fundamentals and the Crypto Market Price Reaction
 Daily Crypto Review, Sept 16 – Ethereum Facing a 35% Drop; Bitcoin Remains Bullish
One reply on “Daily Crypto Review, Sept 29 – Bitcoin’s Fail to Break $11,000 Causes a Red Day for Crypto: What’s Next?”
Such a large consolidation must be a big move coming soon