
The cryptocurrency sector was mostly trading sideways over the weekend, with a sudden burst towards the upside in recent hours. Bitcoin is currently trading for $10,877, representing an increase of 1.14% on the day. Meanwhile, Ethereum lost 0.59% on the day, while XRP gained 0.18%.
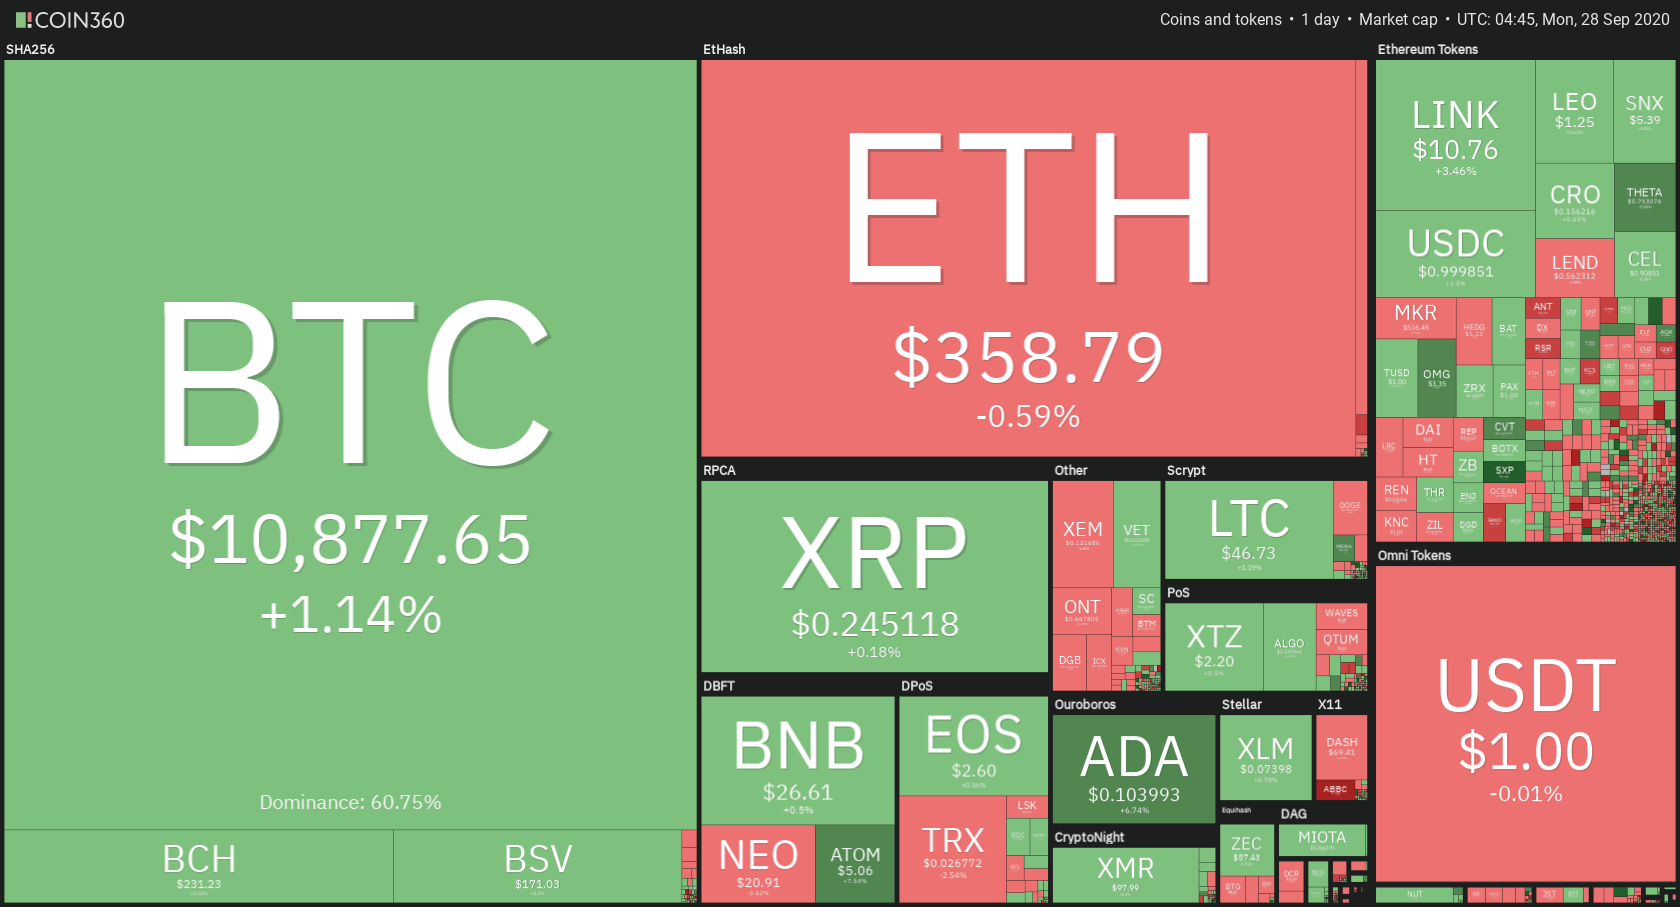
Daily Crypto Sector Heat Map
If we look at the top100 cryptocurrencies, Arweave gained 36.17% on the day, making it the most prominent daily gainer. Swipe (21.16%) and CyberVein (12.64%) also did great. On the other hand, ABBC Coin lost 18.37%, making it the most prominent daily loser. It is followed by DFI.Money’s loss of 10.91% and Reserve yearn.finance’s loss of 10.43%.
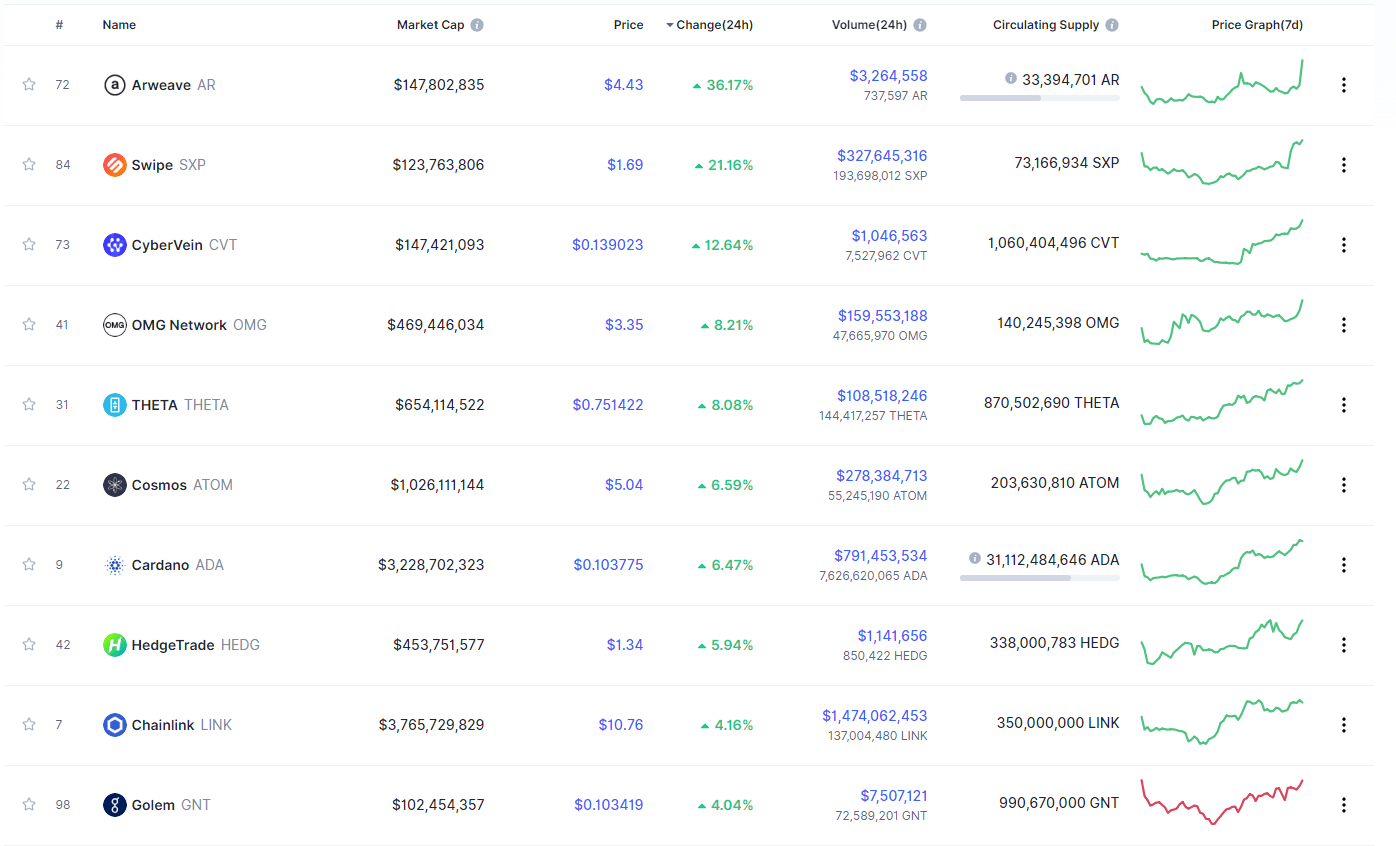
Top 10 24-hour Performers (Click to enlarge)
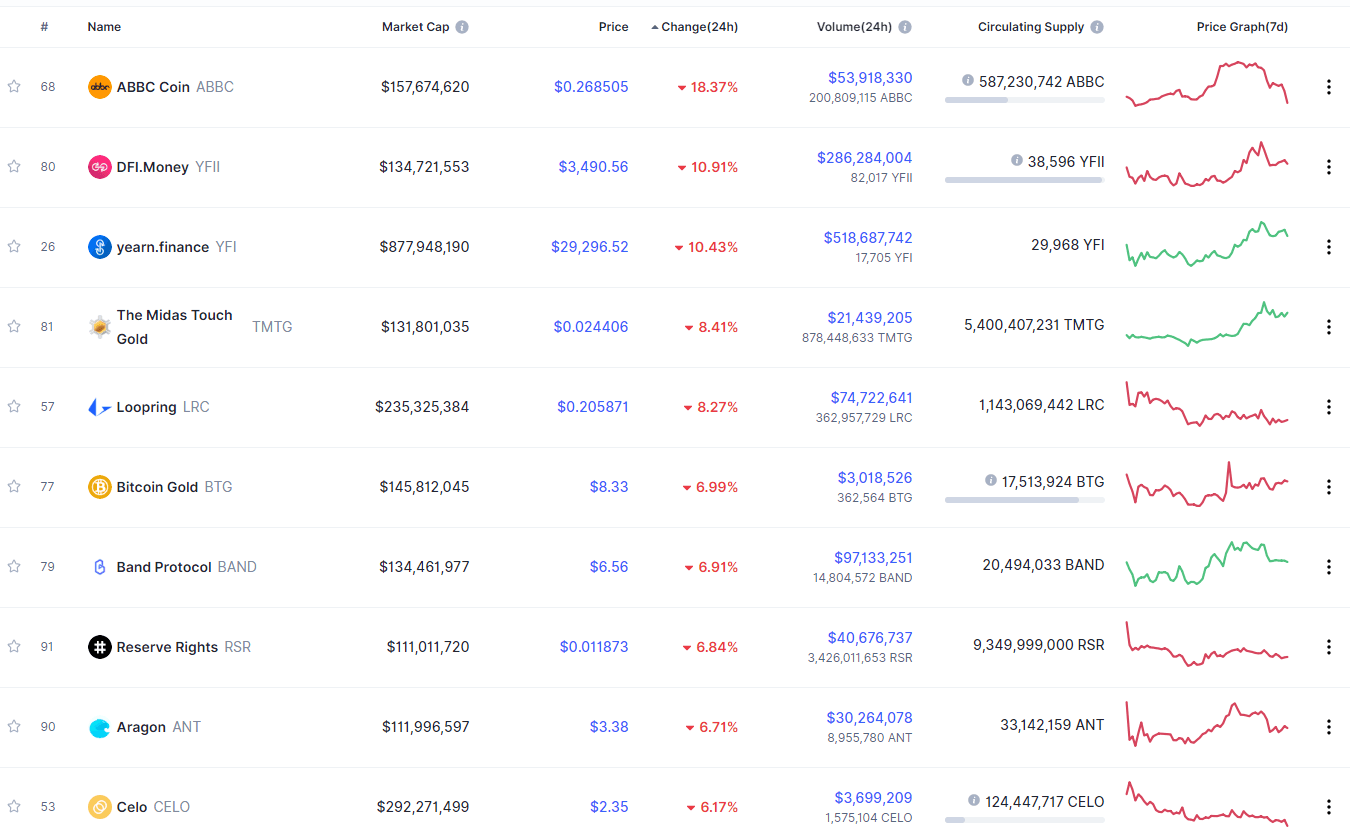
Bottom 10 24-hour Performers (Click to enlarge)
Bitcoin’s level of market dominance decreased slightly since our last report, with its value currently being at 60.75%. This value represents a 0.72% difference to the downside when compared to when we last reported.

Daily Crypto Market Cap Chart
The crypto sector capitalization has increased in value over the weekend. Its current value is $349.48 billion, which represents a decrease of $13.19 billion when compared to our previous report.
_______________________________________________________________________
What happened in the past 24 hours?
_______________________________________________________________________
- Only 2.5 million BTC left to mine (Cointelegraph)
- Bitcoin Sets Record 63 Straight Days Closing Above $10,000 (Coindesk)
- OneCoin investors accuse BNY Mellon of playing role in $4 billion Ponzi scheme (The Block)
- DeFi protocol Aave launches new governance framework on mainnet (The Block)
- SEC issues a no-action letter in response to the digital asset securities questions (The Block)
- DeFi protocols break $10 billion in total value locked (The Block)
- IRS Asks a Simple “Yes or No” Question to Deal With Crypto Tax Evaders (Cryptobriefing)
- KuCoin’s Hot Wallet Private Keys Stolen, Estimated $150 Million in Damages (Cryptobriefing)
- Analytics firm: Bitcoin investor sentiment reaches 2-year low as momentum stalls (Cryptoslate)
- LEND, the DeFi darling up 5,000% in 2020, is about to undergo a critical upgrade (Cryptoslate)
_______________________________________________________________________
Technical analysis
_______________________________________________________________________
Bitcoin
Bitcoin has spent the weekend preparing for a move towards the upside, which happened in recent hours. While the move did break the large triangle to the upside, it stopped at the 38.2% level, which it is now fighting for. Only a daily close above this level would mean that the bulls have taken over the market, while anything else is far less bullish.
BTC/USD 1-day Chart
If we zoom in to the 4-hour chart, we can see that the largest cryptocurrency by market cap got stopped out (for now) at the 38.2% Fib retracement level. The next couple of hours will be crucial in determining Bitcoin’s short-term future and its sentiment.
BTC/USD 4-hour Chart
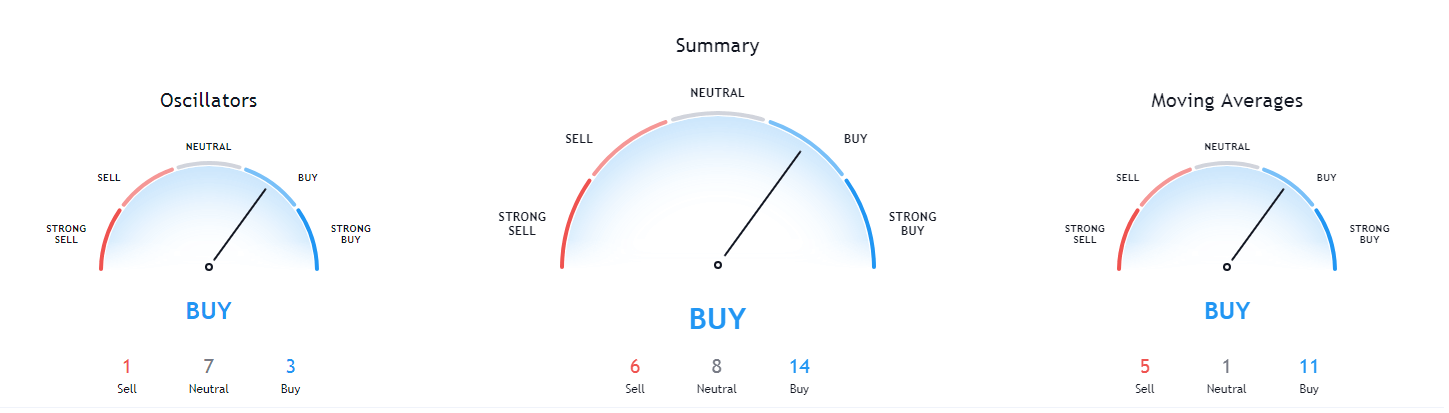
Bitcoin’s short-term technicals tilted even more towards the bull side over the weekend. On the other hand, its long-term technicals are still bullish on all time-frames.
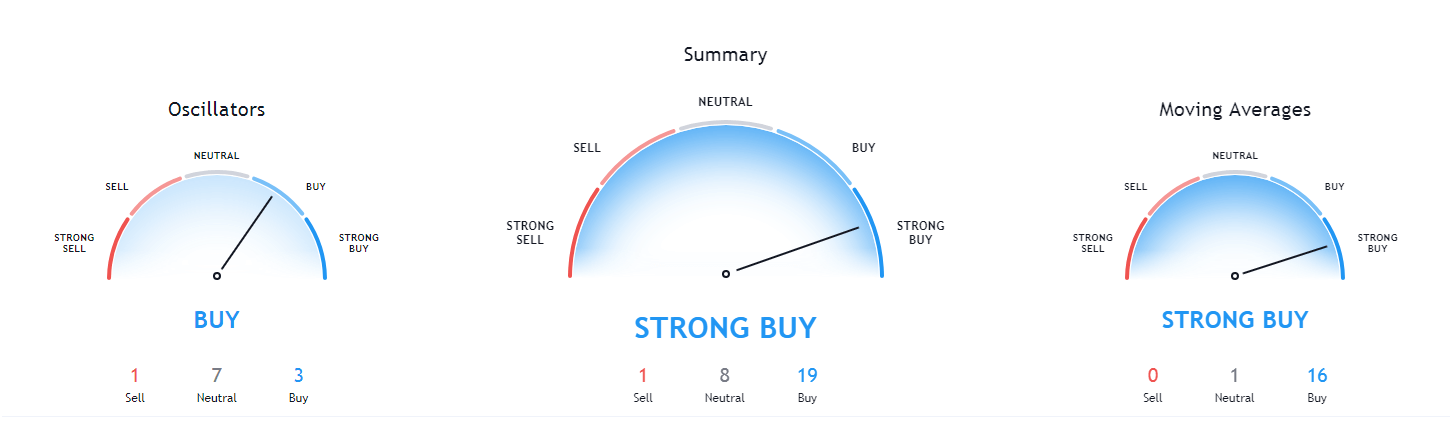
BTC/USD 4-hour Technicals
Technical factors (4-hour Chart):
- Price is above both its 50-period EMA and 21-period EMA
- Price above its top Bollinger band
- RSI is static but close to being overbought (62.31)
- Volume is steady with a few spikes
Key levels to the upside Key levels to the downside
1: $10,850 1: $10,630
2: $11,000 2: $10,500
3: $11,090 3: $10,015
Ethereum
Unlike Bitcoin, Ethereum didn’t have a strong move towards the upside, but rather kept its trading within a range, bound by $360 to the upside and $340 to the downside. As we said in our previous post, options traders bet on Ethereum having over 55% chance of staying below $360 and above $340 in the next month, with only around 20% of them betting on ETH breaking the $360 mark in October.
ETH/USD 4-hour Chart
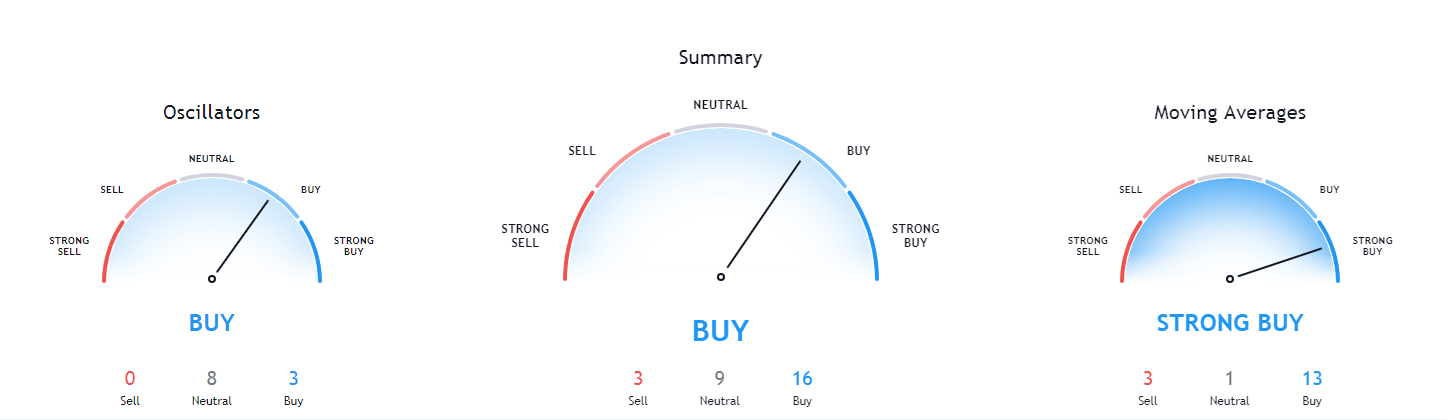
While Ethereum’s 4-hour technicals are tilted towards the buy-side, its 1-day technicals are bearish. When talking about weekly or monthly technicals, the sentiment is tilted towards the buy-side heavily.
ETH/USD 4-hour Technicals
Technical Factors (4-hour Chart):
- The price is above its 50-period and its 21-period EMA
- The price ascension is stopped by its top Bollinger band
- RSI is neutral (57.76)
- Volume is below average
Key levels to the upside Key levels to the downside
1: $360 1: $340
2: $371 2: $300
3: $400 3: $289
Ripple
XRP’s price movement has surprised traders as they expected it to push more towards the downside and continue its Elliot impulse wave 5th leg movement. However, it seems that XRP wanted to move towards the upside and pushed towards its $0.2454 resistance (unsuccessfully).
Traders are calling for two scenarios, with one being that XRP hasn’t finished its Elliot impulse wave pattern yet and that it will revisit the $0.21 lows before doing anything else. However, many traders are now saying that the impulse wave has ended with XRP reaching $0.219 instead of $0.21 and that it is now moving freely and trying to push above its resistance levels. While both sides have their reasoning, the large ascending support level (red line) is tipping the scales in favor of XRP, already ending its Elliot wave structure.
XRP/USD 1-day Chart
If we zoom in to the 4-hour chart, it’s even more apparent that the Elliot impulse wave has finished, and that XRP is now moving towards its support/resistance levels without such a strong pattern behind it.
XRP/USD 4-hour Chart
XRP’s 4-hour sentiment has turned bullish after (most likely) finishing its Elliot impulse wave pattern. Not only that, but its slightly longer time-frames are also tilted towards the buy-side, which is a healthy change when compared to last week. However, its monthly overview is still looking bearish (though not as much as before the weekend).
XRP/USD 4-hour Technicals
Technical factors (4-hour Chart):
- The price is above both its 50-period EMA and its 21-period EMA
- Price is slightly below its top Bollinger band
- RSI is neutral (59.22)
- Volume is stable and average
Key levels to the upside Key levels to the downside
1: $0.235 1: $0.227
2: $0.2454 2: $0.221
3: $0.266 3: $0.214
Related posts
 Daily Crypto Review, Apr 16 – China launched Digital Yuan; Cryptos pushing up after retesting lows
 Daily Crypto Review, May 6 – China’s Digital Yuan to Fully Replace Cash? Former BoC President Discusses
 Daily Crypto Review, August 17 – DeFi Craze Continues: More BTC Tokenized Than Mined
 Daily Crypto Review, Sept 3 – DeFi Flippening: Unifi’s Volume Topples Coinbase
One reply on “Daily Crypto Review, Sept 28 – XRP Exiting Bearish Structure and Aiming for $0.245; Bitcoin Eyeing $11,000”
hopefully nice push up on BTC this week