
The cryptocurrency market managed to stay relatively healthy over the weekend as most cryptos tried to consolidate rather than move. Bitcoin is currently trading for $10,343, which represents a decrease of 0.85% on the day. Meanwhile, Ethereum lost 5.22% on the day, while XRP lost 2.06%.
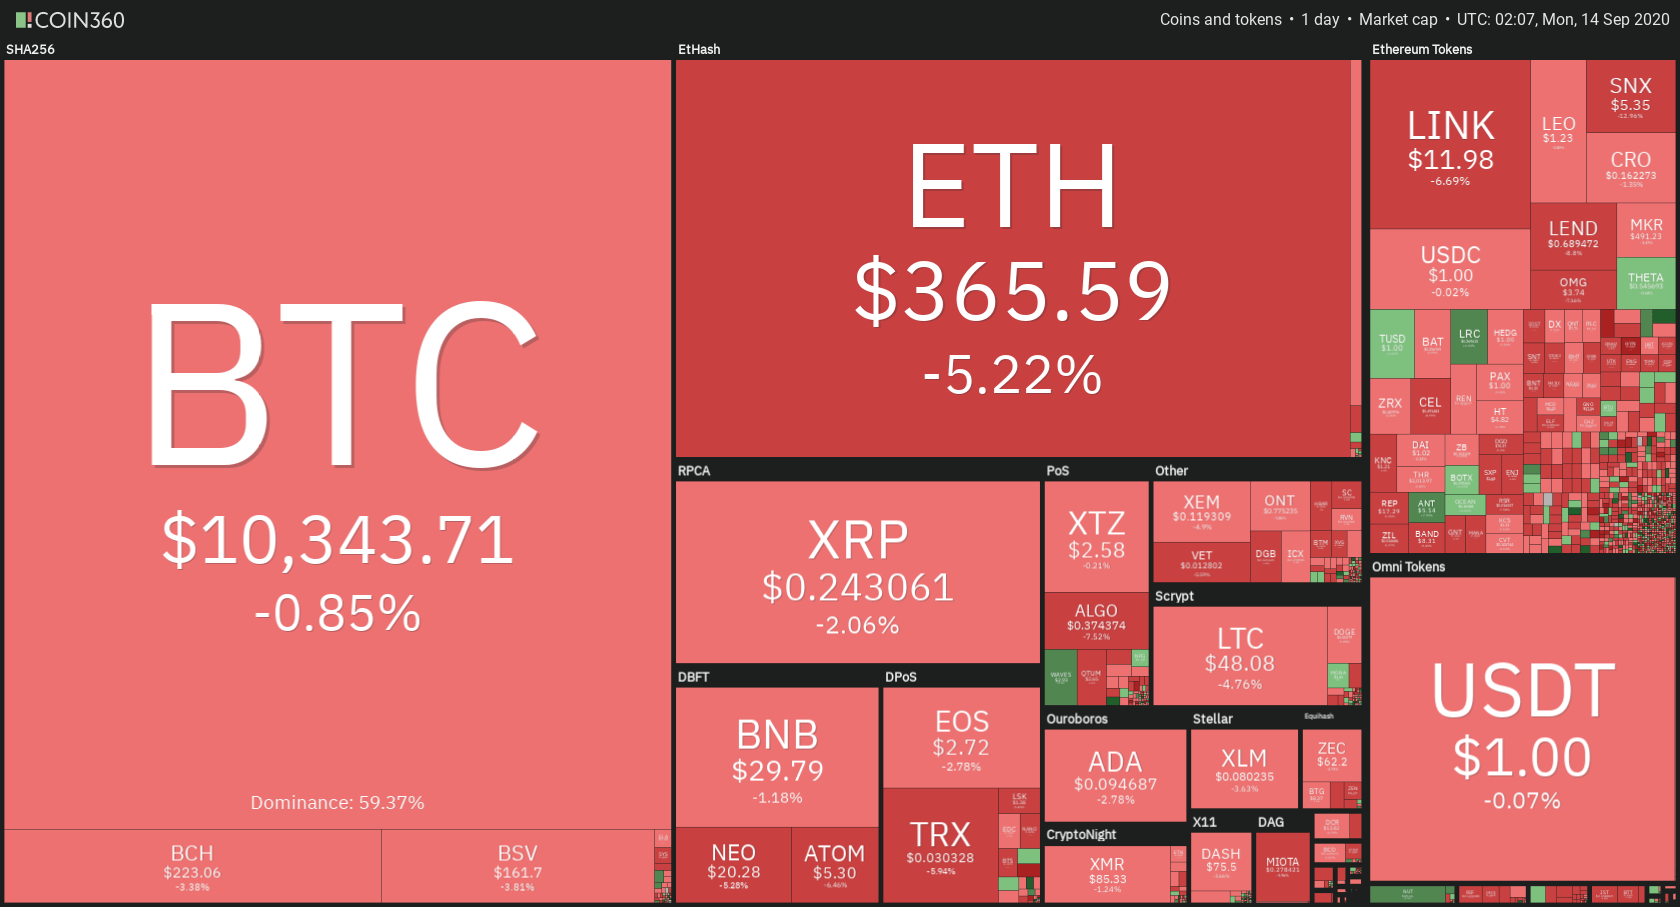
Daily Crypto Sector Heat Map
If we take a look at the top100 cryptocurrencies, Flexacoin gained 13.18% on the day, making it the most prominent daily gainer. OKB (13.14%) and Waves (12.08%) also did great. On the other hand, the NXM lost 18.45%, making it the most prominent daily loser. It is followed by DFI. Money’s loss of 17.46% and yearn .finance’s loss of 16.42%.
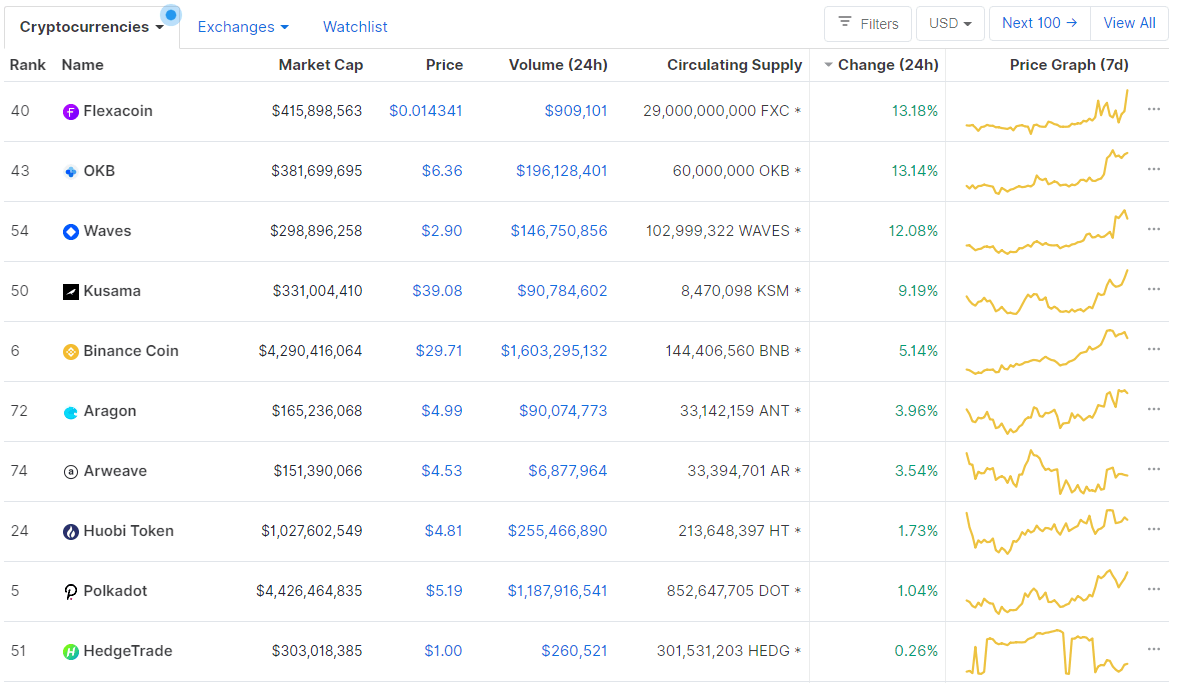
Top 10 24-hour Performers (Click to enlarge)
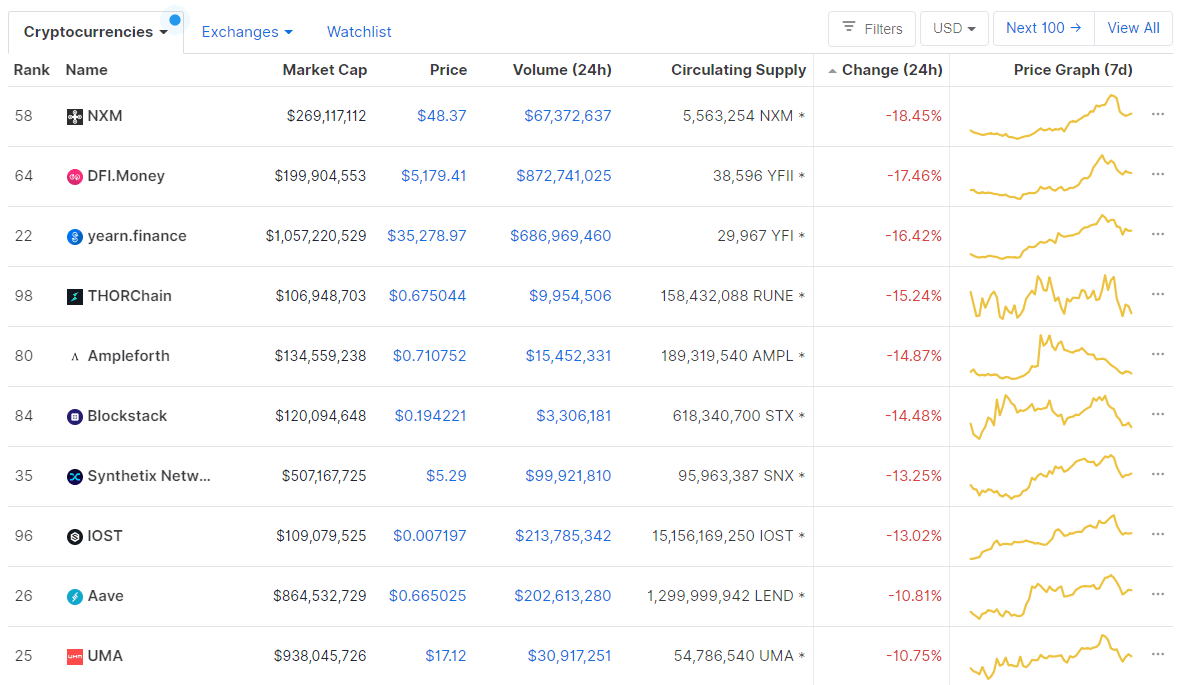
Bottom 10 24-hour Performers (Click to enlarge)
Bitcoin’s dominance level experienced an increase since our last report, with its value currently being at 59.37%. This value represents a 4.93% difference to the upside when compared to when we last reported.
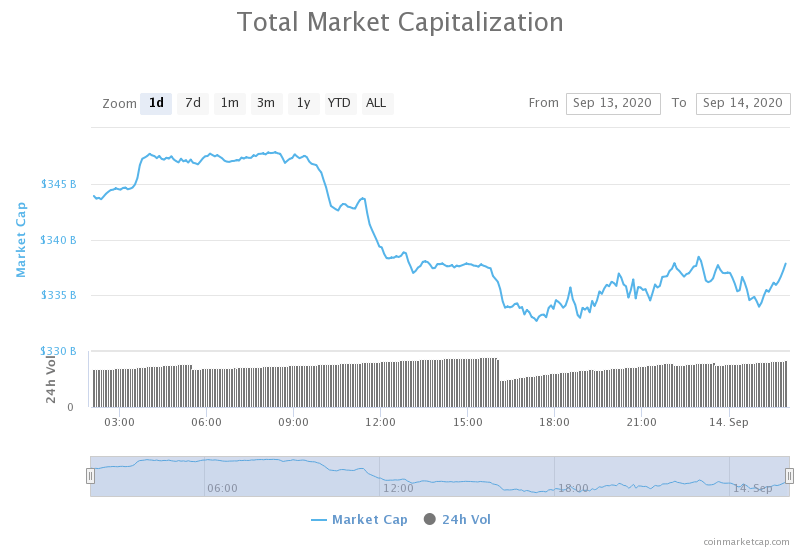
Daily Crypto Market Cap Chart
The crypto sector capitalization has gone slightly down in the past 24 hours. Its current value is $335.90 billion, which represents a decrease of $2.27 billion when compared to our previous report.
_______________________________________________________________________
What happened in the past 24 hours?
_______________________________________________________________________
- Binance CEO wants more Ethereum-based DeFi projects to join his platform (Cointelegraph)
- Bitcoin price abruptly drops 3% after miner outflows hit 5-month high (Cointelegraph)
- Uniswap Takes Lead Over SushiSwap Less Than 24 Hours After SUSHI Rewards Drop (Coindesk)
- Growing Bitcoin Hashrate Points to Further BTC Gains (Cryptobriefing)
- Bitcoin Makes Headway Implementing Smart Contracts, ‘Most Complicated’ Part of Upgrade Complete (Cryptobriefing)
- Gemini Bitcoin Exchange Brings First DeFi Token Listing to New York (Cryptobriefing)
- Crypto.Com Has Launched a DeFi Exchange Based on Uniswap (Cryptobriefing)
- European Union official pledges action on stablecoins after calls for new curbs (The Block)
- Coinbase CEO renews critique of Apple, says tech giant preventing its app from enabling DeFi access (The Block)
- Crypto trading volumes for August saw the biggest month-over-month increase since early 2018 (The Block)
_______________________________________________________________________
Technical analysis
_______________________________________________________________________
Bitcoin
Bitcoin has spent the weekend steadily and slowly increasing and trying to reach past $10,500. While it has gotten past the $10,360 level once, it fell under it once the move couldn’t carry enough momentum to pass $10,500 as well. Bitcoin is currently fighting for the $360 level, with its price being right below it.
Our prediction regarding the price movement stays the same as Bitcoin did not move much over the course of the weekend. If Bitcoin doesn’t pass the $10,360 line soon, we should look for support at $9,600, and ultimately at the 200-day SMA ($9,080).
It is also important to note that, as the price movement has been muted for such a long time, it is extremely likely that, once the price moves past $10,360 or below $10,000 (with confidence), we might see a massive surge in volume extending that move. This will be a great opportunity for traders to trade on the way down, as well as the pullbacks.
BTC/USD 4-hour Chart
Technical factors:
- Price is below the 50-period EMA and right at the 21-period EMA
- Price is right at middle Bollinger band
- RSI is neutral (50.27)
- Volume is stable (slightly below average)
Key levels to the upside Key levels to the downside
1: $10,360 1: $10,015
2: $10,500 2: $9,870
3: $10,630 3: $9,600
Ethereum
Ethereum’s price movement in the past couple of days looks exactly like Bitcoins in direction, but with much higher volatility. The second-largest crypto by market cap took the weekend to push towards $400, which ended unsuccessfully. As the move could not carry the momentum forward, bears took over and brought the price to its current position, where it is bound in a narrow range by $360 to the downside and $371 to the upside.
Ethereum’s volatility certainly comes from people investing in DeFi as Ethereum was never as volatile as it is now. However, its moves are still following Bitcoin. This volatility might be a good opportunity for traders to push for some trades.
ETH/USD 4-hour Chart
Technical Factors:
- The price is right above its 21-period and its 50-period EMA
- The price is at its middle Bollinger band
- RSI is neutral (49.14)
- Volume is low and stable
Key levels to the upside Key levels to the downside
1: $371 1: $360
2: $400 2: $340
3: $415 3: $300
Ripple
XRP has not been much different from the aforementioned two cryptocurrencies. The third-largest cryptocurrency by market cap is still trading within a range bound by $0.235 to the downside and (more importantly) $0.2454 to the upside. XRP did have one a short period where it spiked above the resistance level, but the price quickly dwindled back down to its original level.
XRP is now fighting for the $0.2454 level, trying to surpass it. However, the extremely low volume shows us that this is will most likely not happen. Traders might have the opportunity to trade the pullback.
XRP/USD 4-hour Chart
Technical factors:
- The price is just above its 21-period EMA and just below its 50-period EMA
- Price is right above its middle Bollinger band
- RSI is neutral (51.35)
- Volume is extremely low, but stable
Key levels to the upside Key levels to the downside
1: $0.2454 1: $0.235
2: $0.266 2: $0.227
3: $0.285 3: $0.221
Related posts
 Daily Crypto Review, Mar 17 – Bitcoin back up above $5,000 as bulls gather up
 Daily Crypto Review, Apr 3 – Bitcoin over $7,000? Is the downtrend finally over?
 Daily Crypto Review, Oct 2 – Trump Tests Positive for COVID-19; Crypto and Stocks Negatively Affected
 Daily Crypto Review, Oct 6 – XRP Gains Over 10% As It Announces The Launch Of A New Crypto Exchange
One reply on “Daily Crypto Review, Sept 14 – The EU Regulating Stablecoins; Crypto Market Preparing For a Move”
definitely feel a big move coming in crypto