The cryptocurrency market has experienced large volatility in the DeFi sector, while the rest of the market was relatively stable. Bitcoin is currently trading for $10,301, which represents a decrease of 0.68% on the day. Meanwhile, Ethereum lost 0.11% on the day, while XRP lost 0.73%.
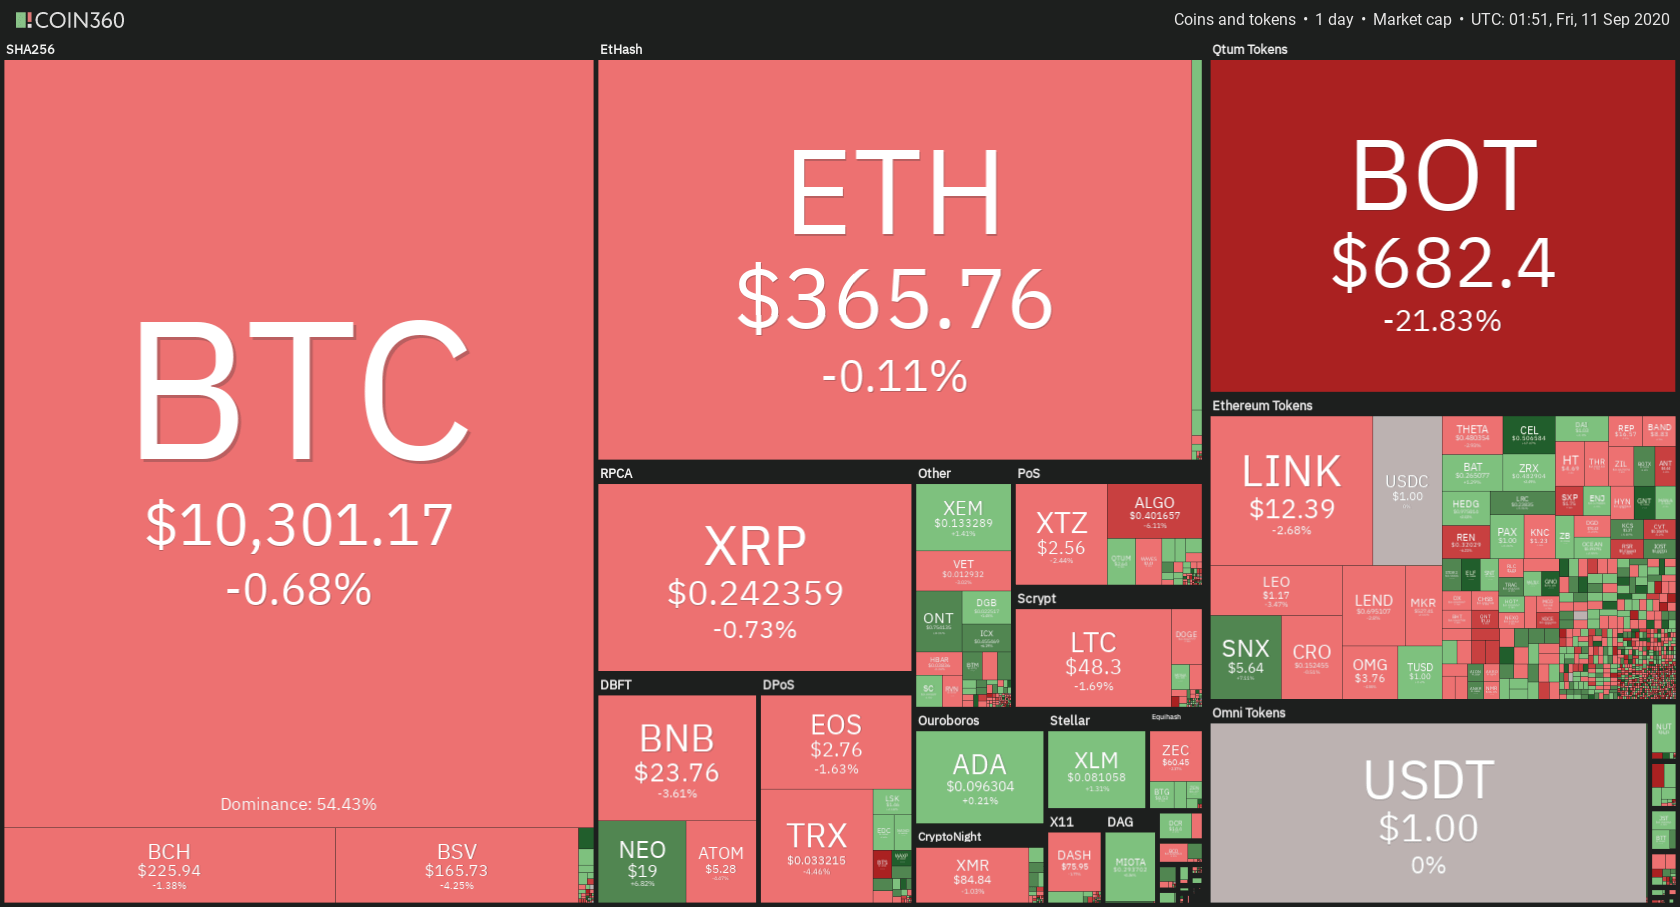
Daily Crypto Sector Heat Map
If we take a look at the top100 cryptocurrencies, aelf gained 152.47% on the day, making it the most prominent daily gainer. Flexacoin (45.07%) and Ampleforth (35.77%) also did great. On the other hand, the SushiSwap lost 14.95%, making it the most prominent daily loser. It is followed by Elrond’s loss of 7.82% and Serum’s loss of 6.08%.
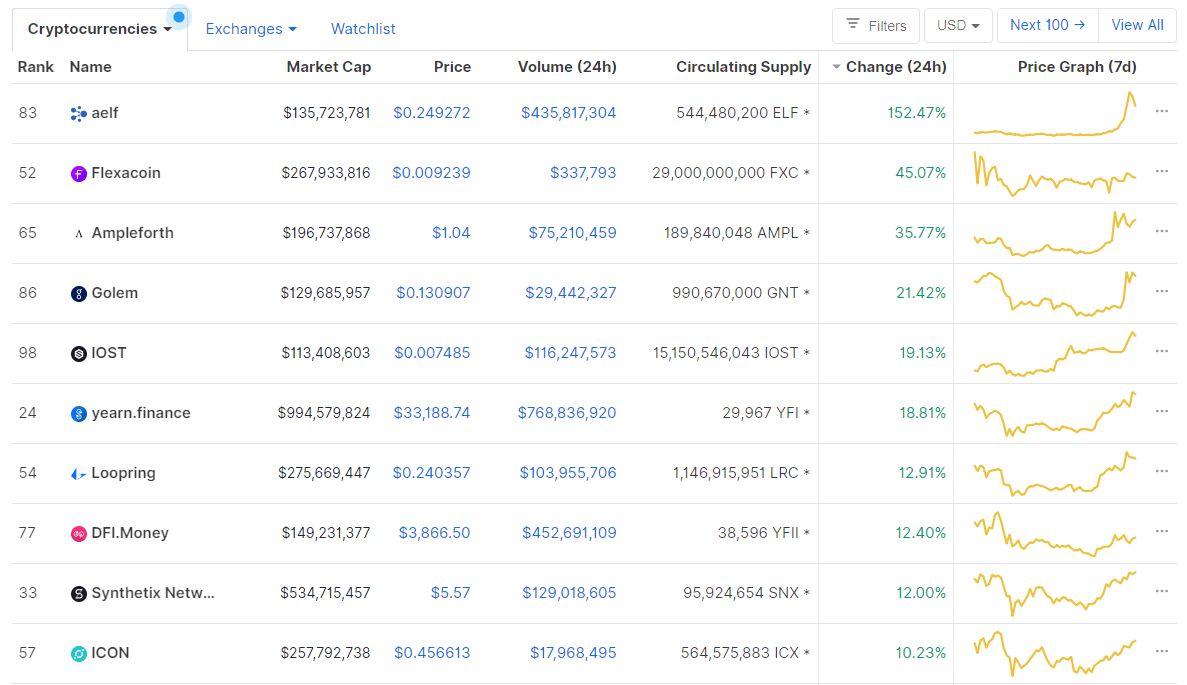
Top 10 24-hour Performers (Click to enlarge)
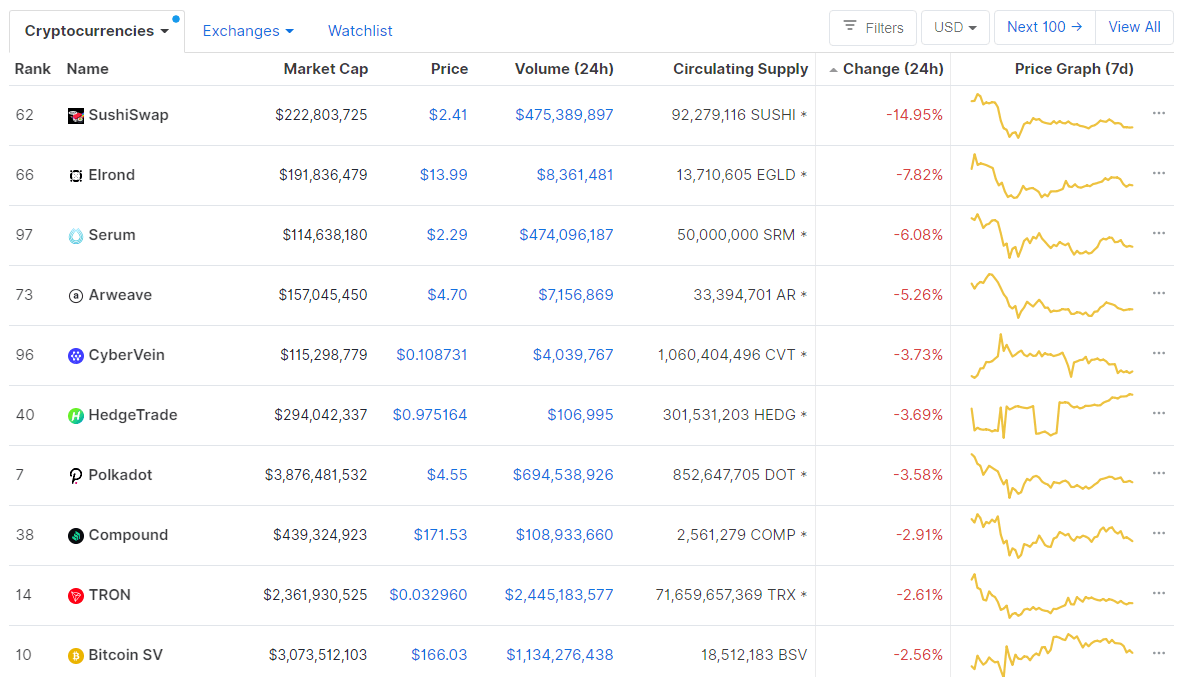
Bottom 10 24-hour Performers (Click to enlarge)
Bitcoin’s dominance level experienced a massive drop since our last report, with its value currently being at 54.44 9.29%. This value represents a 4.85% difference to the downside when compared to when we last reported.
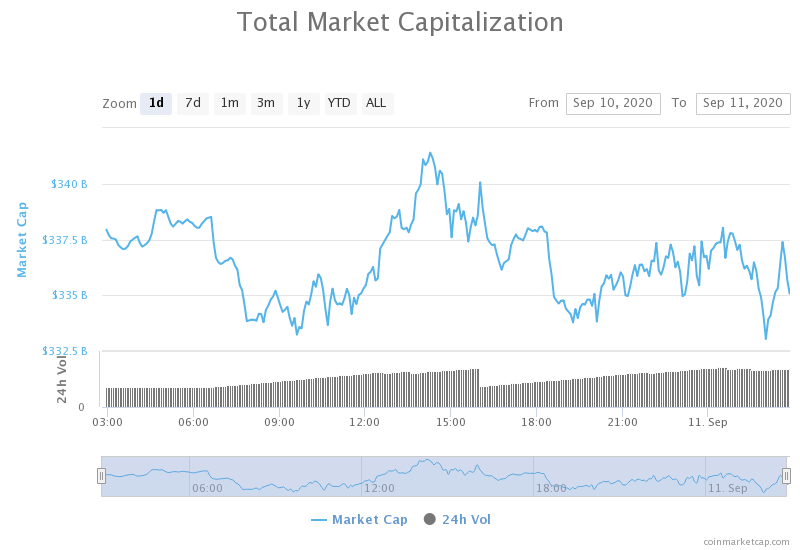
Daily Crypto Market Cap Chart
The crypto sector capitalization has gone up in the past 24 hours. Its current value is $337.66 billion, which represents an increase of $5.84 billion when compared to our previous report.
_______________________________________________________________________
What happened in the past 24 hours?
_______________________________________________________________________
- Binance puts up $100 million to attract DeFi projects to its new blockchain (The Block)
- Mapping out Coinbase’s acquisitions and investments (The Block)
- SushiSwap to Overthrow Uniswap? FTX Owner Stages $1 Billion Liquidity Heist (Cryptobriefing)
- Coinbase Lists yEarn Finance, YFI Pumps by 15% (Cryptobriefing)
- Crypto analyst says: Ethereum DeFi is a “once-in-a-decade” investment opportunity (Cryptoslate)
- Jack Dorsey: Bitcoin is the “best manifestation” of a native digital currency (Cryptoslate)
- Ether Traders May Be Hedging Against DeFi Slowdown: Analyst (Coindesk)
- Beijing pulls ahead of Shenzhen as China’s top blockchain city (Cointelegraph)
- Bitcoin hashrate remains strong during monsoon season (Cointelegraph)
- Bitcoin on-chain volume hits a 1-year high with only 3.6% coming from exchanges (Cointelegraph)
_______________________________________________________________________
Technical analysis
_______________________________________________________________________
Bitcoin
Bitcoin has spent another day trying to push past the $10,360 resistance. However, every attempt in the past few days ended up in BTC passing the level, but then coming back under it due to being unable to confirm its position above. While the resistance level weakens each time Bitcoin attempts to pass it, it brings more bears to the game as most people intuitively trade in the direction opposite to the most recent failed attempt.
If Bitcoin doesn’t pass $10,360 soon, we should look for support at $9,600, and ultimately at the 200-day SMA ($9,080).
BTC/USD 4-hour Chart
Technical factors:
- Price is below the 50-period EMA and right above the 21-period EMA
- Price is slightly closer to the middle than the top Bollinger band
- RSI is neutral (49.57)
- Volume is stable
Key levels to the upside Key levels to the downside
1: $10,360 1: $10,015
2: $10,500 2: $9,870
3: $10,630 3: $9,600
Ethereum
Ethereum has, unlike Bitcoin, managed to gain some value as it reached past its $360 level. However, the move has ended and Ethereum is now stuck in a narrow range between $360 to the downside and $371 to the upside. The second-largest cryptocurrency by market cap has repeatedly tried to get past it, but with no success.
Ethereum’s break above $371 should establish a short-term bullishness, while a break below $360 is not as relevant, and we may look for $340 as the next support.
ETH/USD 4-hour Chart
Technical Factors:
- The price is above its 21-period while it is currently crossing the 50-period EMA
- The price is near its top Bollinger band
- RSI is neutral (52.77)
- Volume is low and stable
Key levels to the upside Key levels to the downside
1: $371 1: $360
2: $400 2: $340
3: $415 3: $300
Ripple
XRP failed to break its immediate resistance of $0.2454, which triggered a small pullback. The third-largest cryptocurrency by market cap doesn’t seem like it will be able to break this level any time soon unless it gets a massive influx of bulls. Unlike the aforementioned two cryptocurrencies, XRP is a bit more stable, and failing to push above a resistance level doesn’t necessarily mean that it will attempt a move towards the downside.
XRP/USD 4-hour Chart
Technical factors:
- The price is just below its 21-period EMA and well below its 50-period EMA
- Price is sitting at the middle Bollinger band
- RSI is neutral and descending (47.20)
- Volume is low and stable
Key levels to the upside Key levels to the downside
1: $0.2454 1: $0.235
2: $0.266 2: $0.227
3: $0.285 3: $0.221
Related posts
 Daily Crypto Review, July 8 – BTC Will Never Be Private; XRP Skyrocketing
 Daily Crypto Review, Oct 28 – Bitcoin Rushing Towards $14,000; Over 50% of US Investors Interested in Crypto
 Daily Crypto Review, Nov 13 – Bitcoin Above $16,000: What’s Next?
 Daily Crypto Review, Nov 19 – Ethereum 2.0 Most Likely Not Launching on Time; Crypto Sector Consolidating
One reply on “Daily Crypto Review, Sept 11 – DeFi Sector Experiences Volatility; The Rest Of The Market Stable”
Hopefully DeFi stabilises soon!