
The cryptocurrency sector is experiencing a slow but steady increase in price as Bitcoin is moving towards the upside after the $10,360 low it hit on Oct 2. Bitcoin is currently trading for $10,613, representing an increase of 0.53% on the day. Meanwhile, Ethereum gained 0.48% on the day, while XRP gained 5.79%.
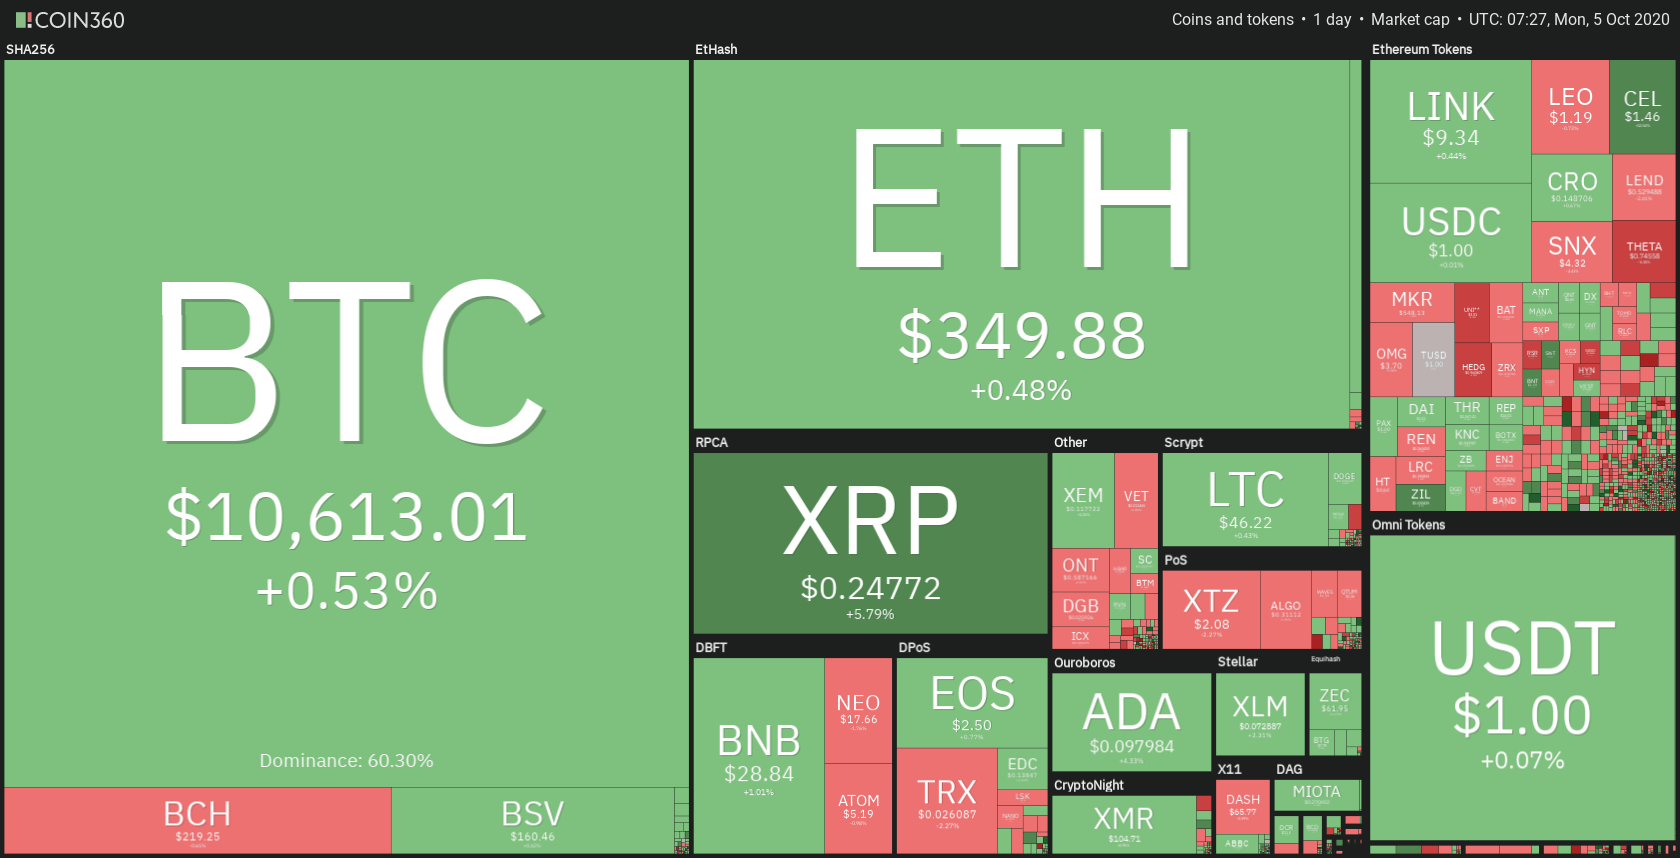
Daily Crypto Sector Heat Map
If we look at the top 100 cryptocurrencies as well as their gains and losses, Zilliqa gained 10.87% on the day, making it the most prominent daily gainer. Celsius (8.47%) and XRP (6.45%) also did great. On the other hand, SushiSwap Token lost 9.94%, making it the most prominent daily loser. It is followed by UMA’s loss of 8.93% and Bitcoin Gold’s loss of 8.64%.
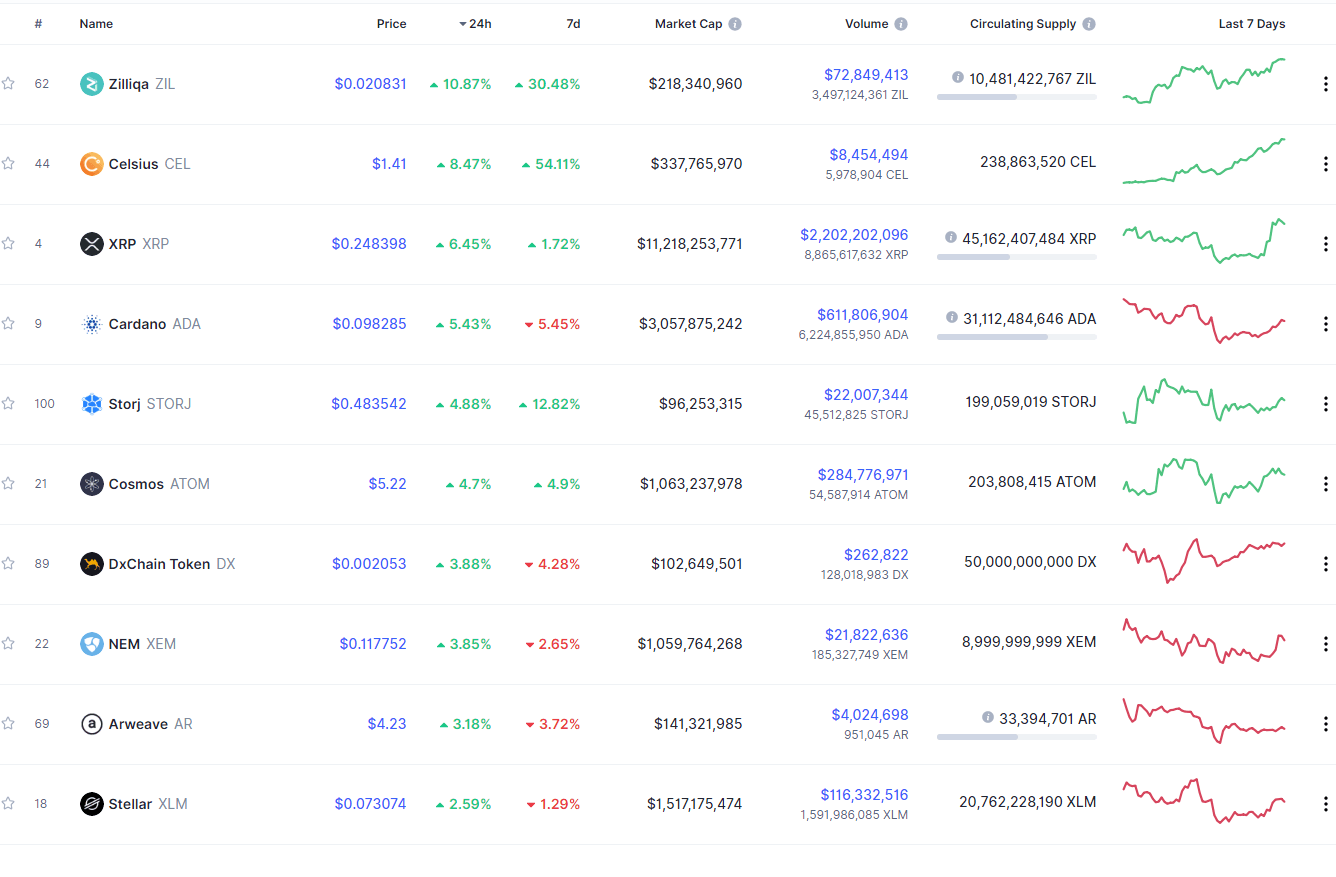
Top 10 24-hour Performers (Click to enlarge)
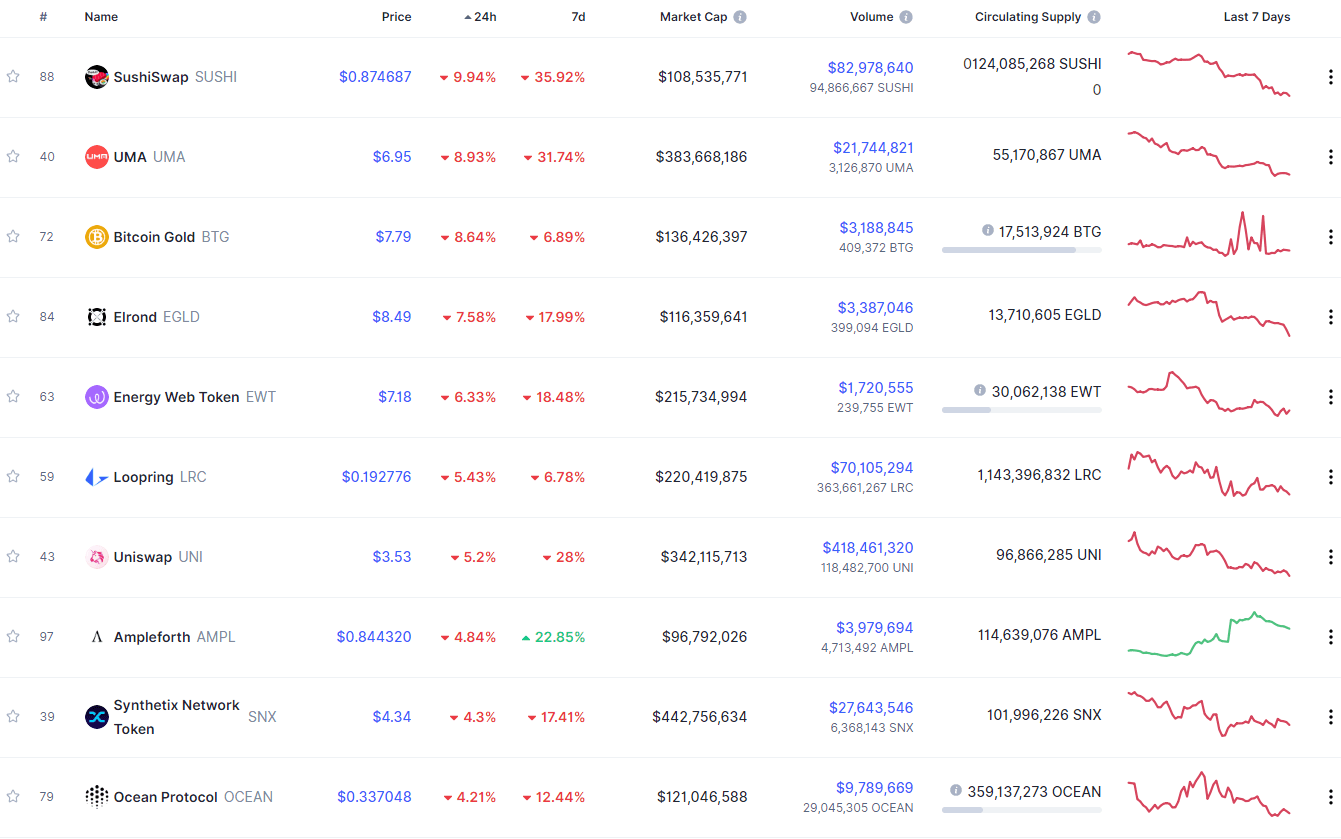
Bottom 10 24-hour Performers (Click to enlarge)
Bitcoin’s level of market dominance stayed at the same spot since our last report, with its value currently being at 60.30%. This value represents a 0.07% difference to the downside when compared to when we last reported.
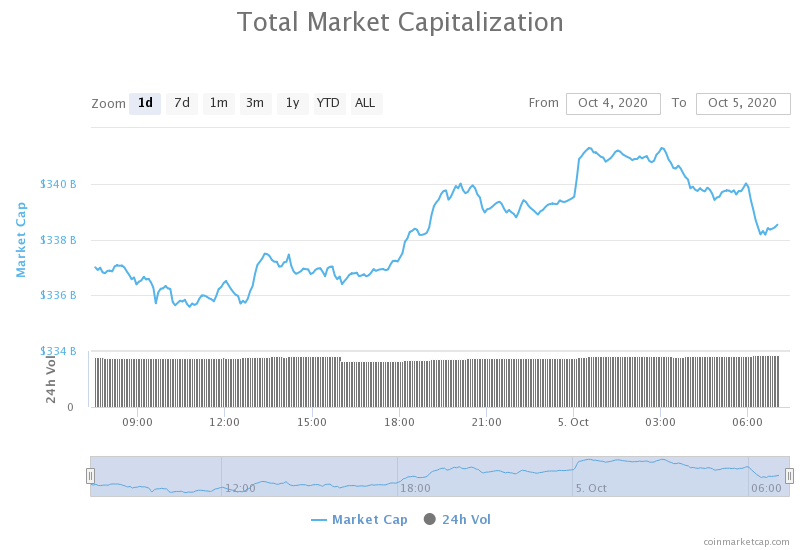
Daily Crypto Market Cap Chart
The crypto sector capitalization has gained value over the course of the weekend. Its current value is $341.26 billion, which represents an increase of $5.80 billion when compared to our previous report.
_______________________________________________________________________
What happened in the past 24 hours?
_______________________________________________________________________
- KuCoin CEO claims crypto exchange has identified suspected hackers (The Block)
- Uniswap’s monthly trade volume exceeded Coinbase’s in September (The Block)
- $242 Million in Bitcoin Flee BitMEX Following Criminal Charges (Cryptobriefing)
- You Can Now Stake Cardano and TRON on eToro’s Trading Platform (Cryptobriefing)
- An Ethereum scaling solution is near—a DeFi founder thinks it will “melt faces” (Cryptoslate)
- BitMEX Bitcoin futures have “completely unwound” as platform exodus continues (Cryptoslate)
- Bitcoin use rises in Egypt amid economic recession (Cointelegraph)
- ECB considering further digital euro study in 2021 (Cointelegraph)
- Emerging technologies can change Africa’s financial landscape (Cointelegraph)
- Dash is not a privacy coin, Dash team says (Cointelegraph)
_______________________________________________________________________
Technical analysis
_______________________________________________________________________
Bitcoin
The largest cryptocurrency by market cap has dropped in price due to the fundamentals, such as the US President Donald Trump being ill from COVID-19 as well as one of the largest trading platforms, BitMEX, being charged by the CFTC and the DOJ. However, the drop was only strong enough to push BTC to the $10,360 level, not below it. This is an extremely bullish sign as this support holding is key to the future development of Bitcoin.
Ever since then, Bitcoin has been slowly and steadily gaining in value but is being checked by the ascending trend line (pink). Traders should watch how BTC handles the trend line and if it surpasses it or keeps bouncing off of it.
BTC/USD 4-hour Chart
Bitcoin’s short-term technicals have changed to bullish over the weekend. Its longer-term technicals, however, have remained completely bullish, except for the daily outlook, which is just slightly more neutral.
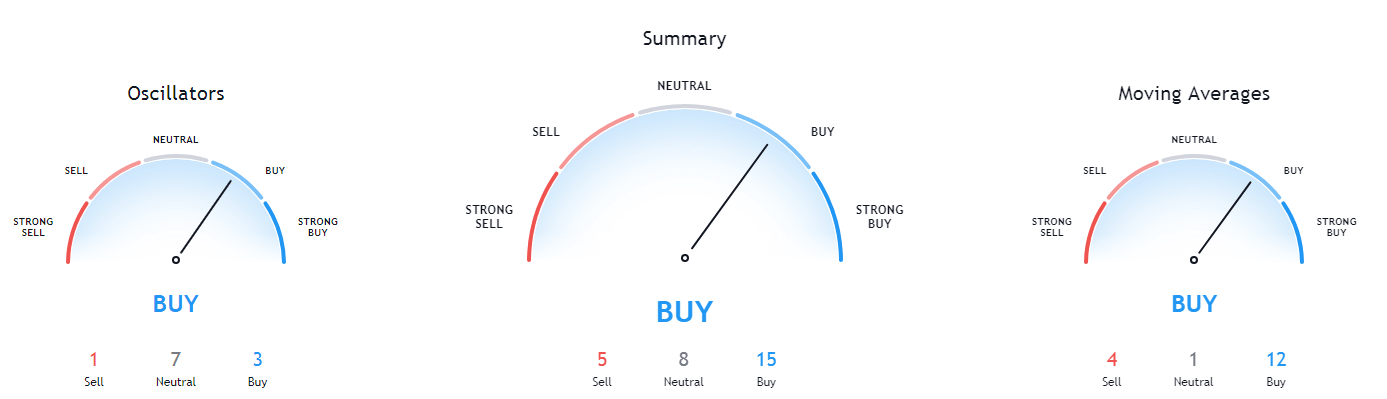
BTC/USD 4-hour Technicals
Technical factors (4-hour Chart):
- Price is above its 50-period EMA and its 21-period EMA
- Price is at its top Bollinger band
- RSI is ascending (56.69)
- Volume is below average
Key levels to the upside Key levels to the downside
1: $10,630 1: $10,500
2: $10,850 2: $10,360
3: $11,000 3: $10,015
Ethereum
Ethereum’s price has acted similar to Bitcoin’s movements, with Ether plummeting on Oct 2 and dropping to the $334 support level. However, bulls have taken over the market, and Ethereum has been slowly rising in the past couple of days. The prediction that options traders made regarding Ether trading below $360 and above $340 during October is still valid, and even more likely.
Traders should pay attention to any increase in volume, as that will spark the next move. The current volume is unable to bring any volatility to Ethereum.
ETH/USD 4-hour Chart
Ethereum’s 4-hour outlook has changed to slightly bullish, while its 1-day overview remains tilted towards the sell-side. However, its long-term overview seems extremely bullish, as its weekly or monthly technicals are both heavily tilted towards the buy-side.
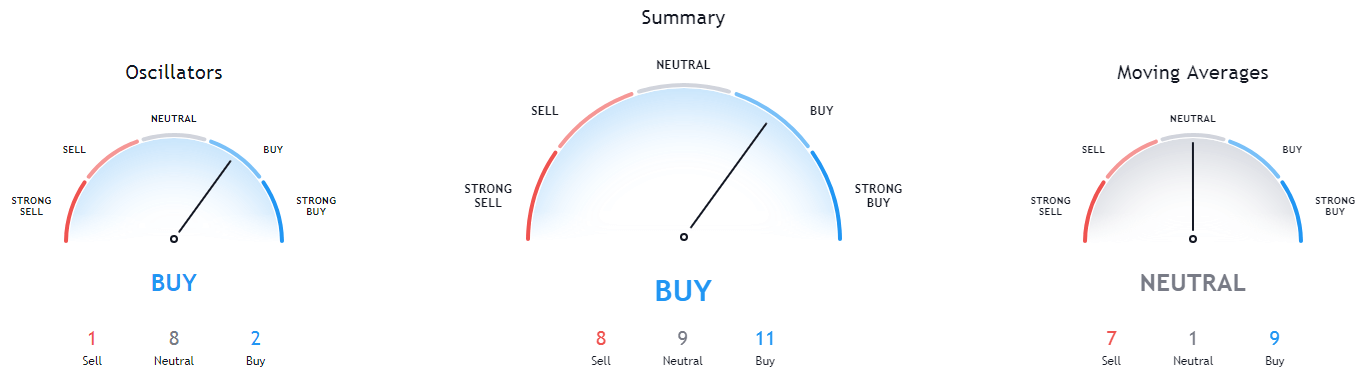
ETH/USD 4-hour Technicals
Technical Factors (4-hour Chart):
- The price is right below its 50-period and right above its 21-period EMA
- The price is slightly above its middle Bollinger band
- RSI is neutral (50.85)
- Volume is below average
Key levels to the upside Key levels to the downside
1: $360 1: $334
2: $371 2: $300
3: $400 3: $289
Ripple
XRP has had an amazing day and even managed to get in the top3 daily gainers section. The third-largest cryptocurrency by market capitalization started off the weekend with its price dropping and hitting $0.228. However, the price quickly recovered and hovered below the $0.235 level until it finally broke. The push towards the upside was strong and with high volume, which helped XRP reach as high as $0.254.
XRP is now trying to consolidate above the $0.2454 level, which traders should pay attention to. An additional spark of volatility might be good for trading, regardless of XRP’s direction.
XRP/USD 4-hour Chart
XRP technicals are now quite uniformed and bullish, with both short-term and long-term technicals being completely tilted towards the buy-side. However, its monthly outlook still remains bearish.
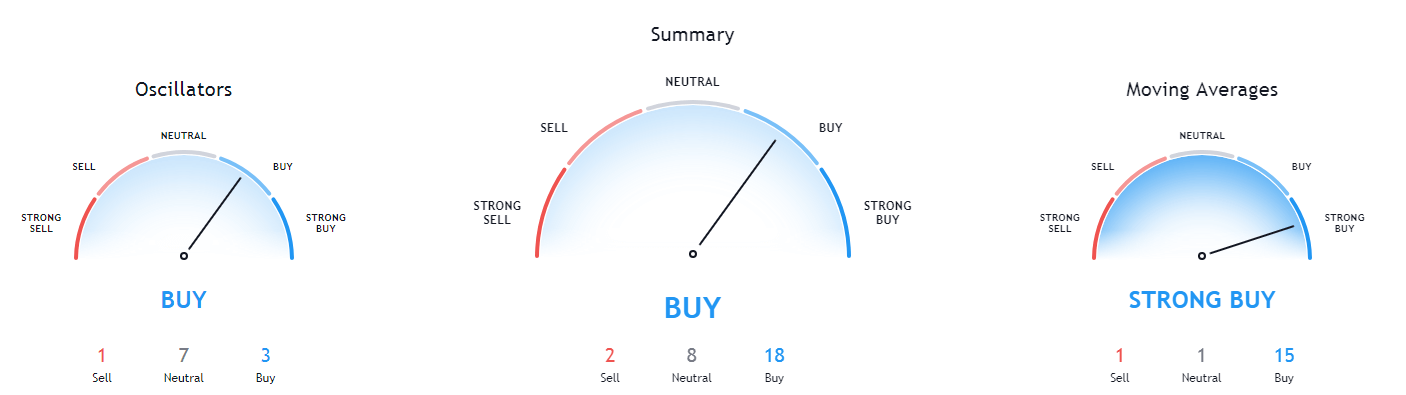
XRP/USD 4-hour Technicals
Technical factors (4-hour Chart):
- The price is above both its 50-period EMA and its 21-period EMA
- Price is at its top Bollinger band
- RSI is heading towards the oversold territory (67.36)
- Volume is above average
Key levels to the upside Key levels to the downside
1: $0.2454 1: $0.235
2: $0.266 2: $0.227
3: $0.27 3: $0.221
Related posts
 Daily Crypto Review, July 8 – BTC Will Never Be Private; XRP Skyrocketing
 Daily Crypto Review, Oct 28 – Bitcoin Rushing Towards $14,000; Over 50% of US Investors Interested in Crypto
 Daily Crypto Review, Nov 13 – Bitcoin Above $16,000: What’s Next?
 Daily Crypto Review, Nov 19 – Ethereum 2.0 Most Likely Not Launching on Time; Crypto Sector Consolidating
2 replies on “Daily Crypto Review, Oct 5 – XRP Skyrockets and Gains Over 9%; Uniswap’s Volume Trumps Coinbase”
Such large volumes in crypto in general
nice analysis, thank you