
The crypto market was mostly bearish over the course of the day, with XRP losing the most out of the top cryptocurrencies. Bitcoin is currently trading for $11,341, which represents a decrease of 0.5% on the day. Meanwhile, Ethereum lost 0.44% on the day, while XRP lost 5%.
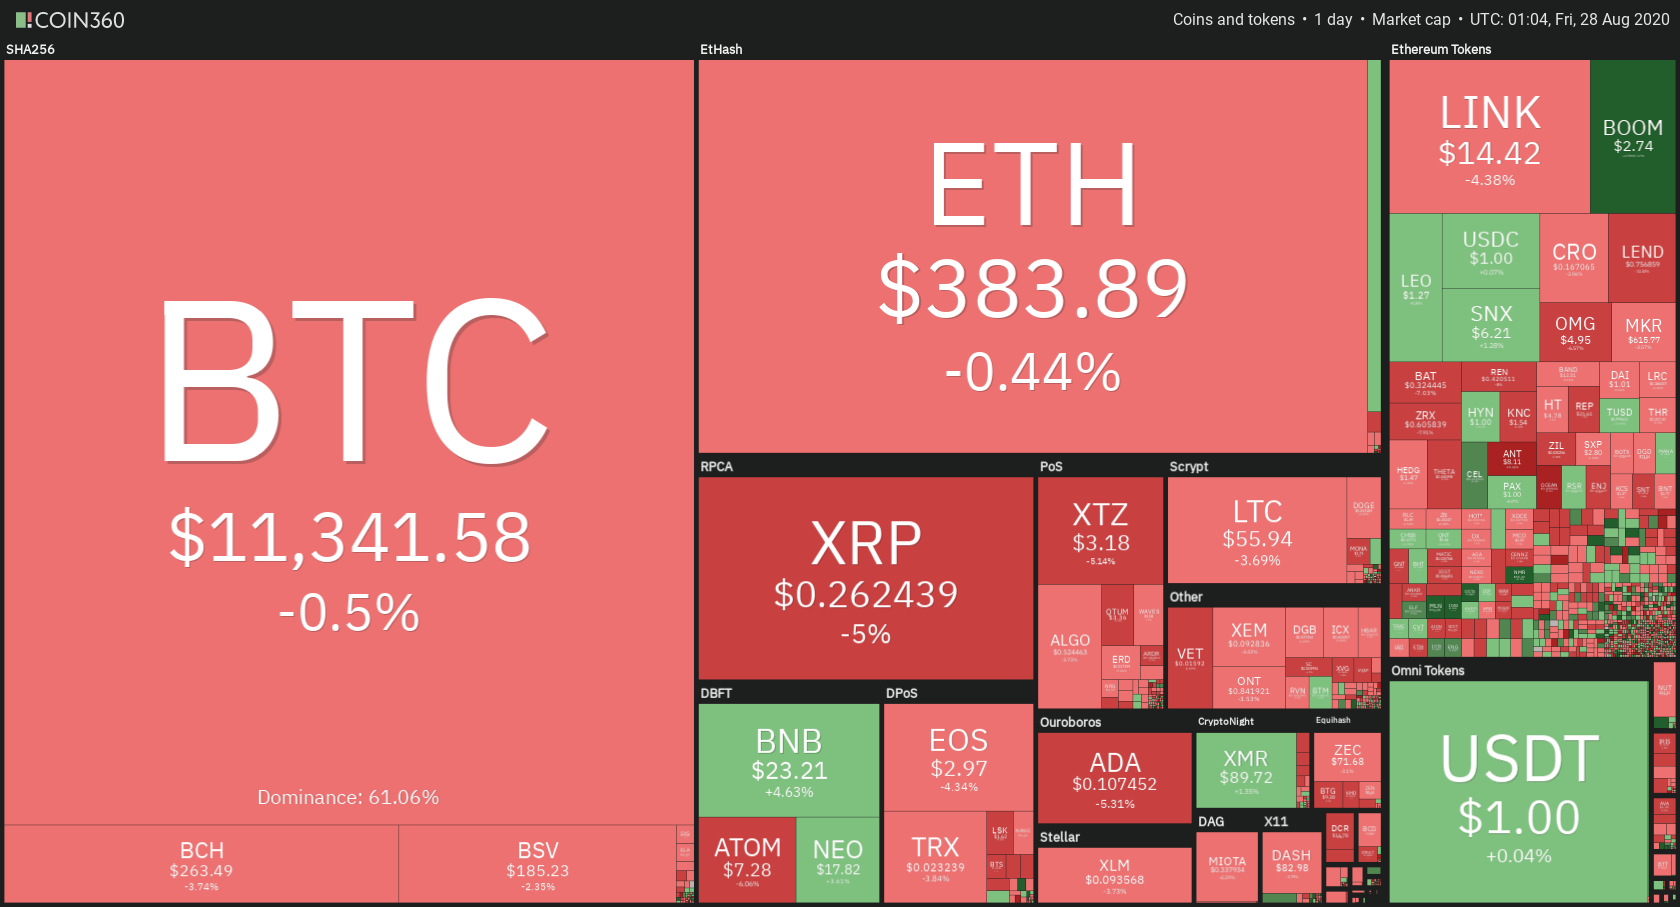
Daily Crypto Sector Heat Map
When taking a look at top100 cryptocurrencies, Numeraire gained 29.44% on the day, making it the most prominent daily gainer. Serum (23.05%) and Uma (21.68%) also did great. On the other hand, Aragon lost 17.67%, making it the most prominent daily loser. It is followed by Kusama’s loss of 12.20% and Qtum’s drop of 11.12%.
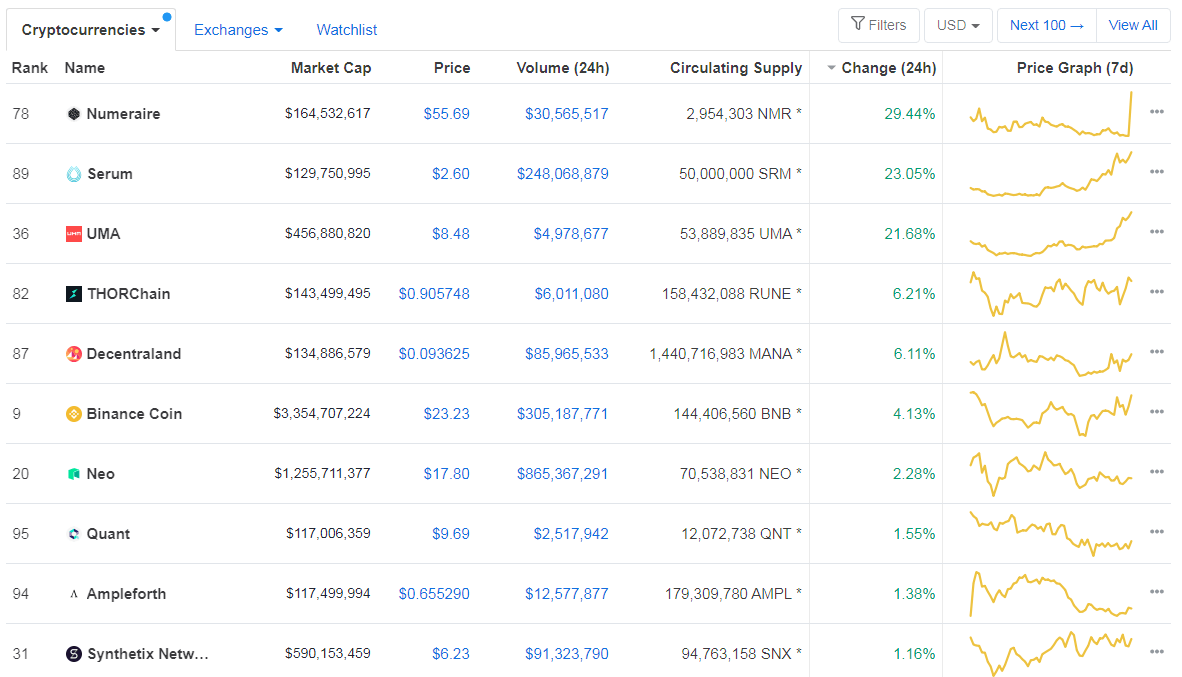
Top 10 24-hour Performers (Click to enlarge)
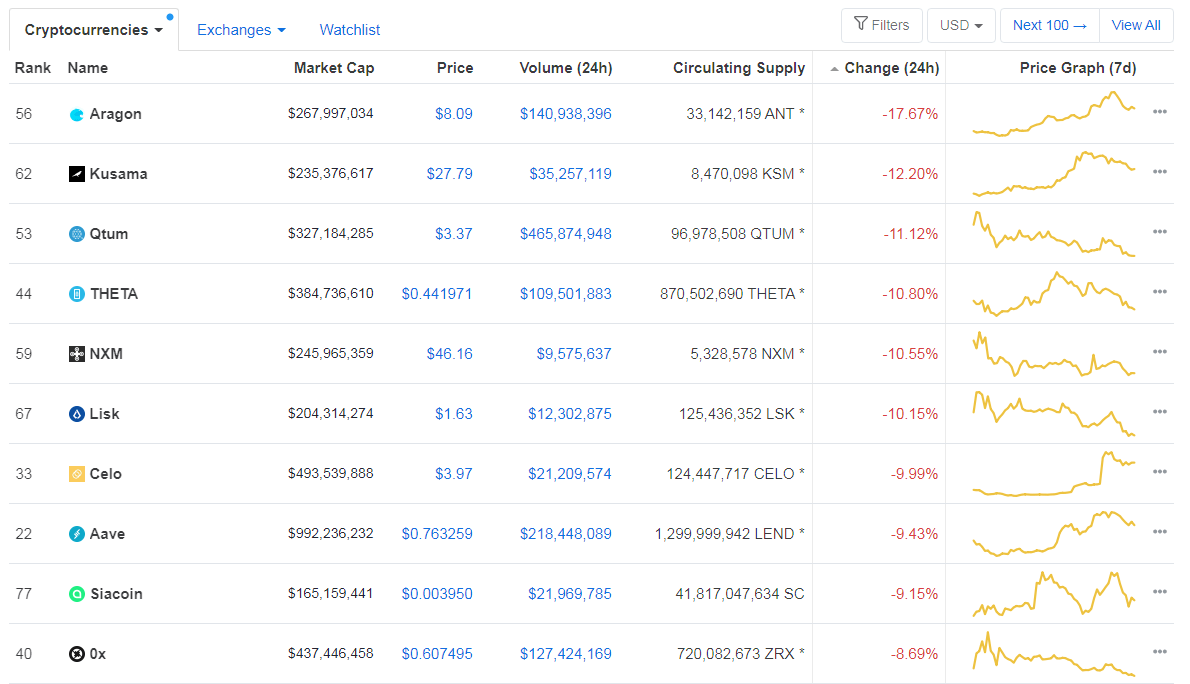
Bottom 10 24-hour Performers (Click to enlarge)
Bitcoin’s dominance level has gone up quite a bit from when our previous report, with its value currently at 61.06%. This value represents a 0.71% difference to the upside when compared to our last report.
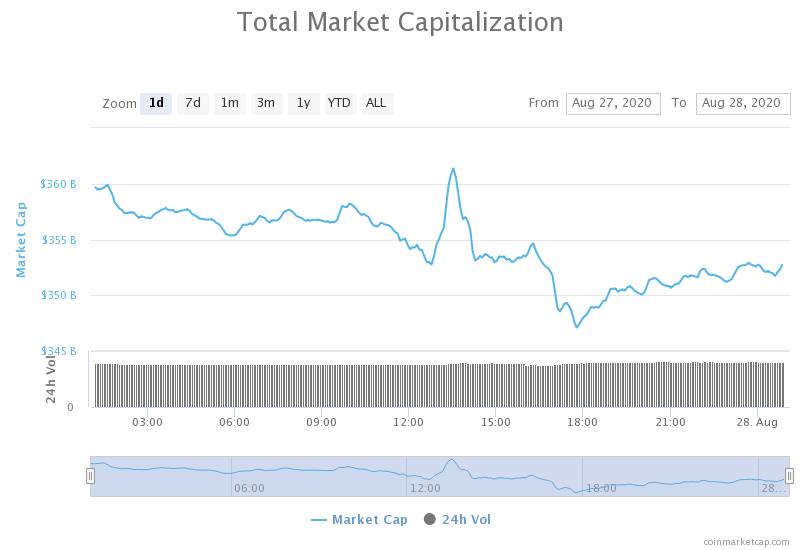
Daily Crypto Market Cap Chart
The cryptocurrency market cap has decreased slightly over the course of the day. Its current value is $353.48 billion, which represents a decrease of $6.8 billion when compared to our previous report.
_______________________________________________________________________
What happened in the past 24 hours?
_______________________________________________________________________
- New Fidelity Fund Brings Passive Bitcoin Investing to Institutions (Cryptobriefing)
- Coinbase, Circle unveil new upgrades to USDC stablecoin (The Block)
- Analyst: Tether (USDT) is maybe doing more to skirt capital controls than Bitcoin (Cryptoslate)
- Darknet marketplace “Empire” exit scams with $30 million in Bitcoin (Cryptoslate)
- Report indicates banks launder more money than Bitcoin and other cryptos (Cryptoslate)
- Aave (LEND) becomes first Ethereum DeFi token to hit $1 billion valuation (Cryptoslate)
- Miners’ Bitcoin Holdings Reach Two-Year High to Almost 2M (Coindesk)
- Chainalysis Report Shows Healthy Crypto Usage in Venezuela (Coindesk)
- Youtube’s Whac-a-Mole Approach to Crypto Scam Ads Remains a Problem (Coindesk)
- Bitcoin price to $500,000: Winklevoss twins lay out ultimate bullish case (Cointelegraph)
_______________________________________________________________________
Technical analysis
_______________________________________________________________________
Bitcoin
Bitcoin was extremely volatile in the past 24 hours, with its price ranging from $11,110 to $11,600. The largest cryptocurrency by market capitalization is still below the $11,460 resistance level and seems like its preparing a move (most likely to the downside).
The price of Bitcoin has declined by more than 6% in the last three days and that along with the fact that $700 million Bitcoin futures expiry is approaching, traders are nervous and have a bearish scenario in mind. Many technical analysts believe that Bitcoin has two paths ahead at the moment: $16,000 or $9,600.
Traders should take a look at Bitcoin’s movement around $11,460 before trading.
BTC/USD 4-hour Chart
Technical factors:
- Price is below its 50-period EMA and 21-period EMA
- Price is below its middle band
- RSI is neutral but leaning towards oversold (41.82)
- Volume is average (one-candle spike)
Key levels to the upside Key levels to the downside
1: $11,460 1: $11,090
2: $11,630 2: $10,855
3: $12,015 3: $10,500
Ethereum
The second-largest cryptocurrency by market capitalization continued its path above the descending trend line. While being above this line is a positive thing, Ethereum is still losing value as it’s gripping the line and following it down. If ETH decides to test the upside, it will encounter some turbulence way before its major resistance at $415.
If, however, Ethereum pushes towards the downside, it will fall back into the trend and possibly rush towards the bottom trend line.
Ethereum traders should look for Ethereum’s volume spike and push towards the upside.
ETH/USD 4-hour Chart
Technical Factors:
- Price is currently below its 21-period and 50-period EMA
- Price is slightly below the middle band
- RSI is neutral (45.39)
- Volume is very low (With volume spike when the trend line was retested)
Key levels to the upside Key levels to the downside
1: $415 1: $400
2: $445 2: $360
3: $496 3: $340
Ripple
XRP had an incredibly bad day, as bears took over the market and pushed its price down. The third-largest cryptocurrency by market cap dropped under the $0.266 support, and then immediately tried to head back up (without any success). While the price is still near the $0.266 level, it is unlikely that XRP will confidently move above it unless Bitcoin pulls the whole crypto market up by a sudden move to the upside.
XRP traders should look for how the cryptocurrency reacts to the $0.266 level and trade-off of that info.
XRP/USD 4-hour Chart
Technical factors:
- The price is below its 21-period and 50-period EMA
- Price is slightly above its lower band
- RSI is at the oversold line (30.19)
- Volume is unstable and cycling between average (low) and extremely high volume candles
Key levels to the upside Key levels to the downside
1: $0.285 1: $0.266
2: $0.31 2: $0.2454
3: $0.32 3:$0.235
Related posts
 Daily Crypto Review, Feb 10 – Bitcoin fighting to regain $10,000 after a sudden crash occurs
 Daily Crypto Review, Feb 17 – Altcoins take a dive as Bitcoin drops under $10,000; Craig Wright suing BTC and BCH?
 Daily Crypto Review, May 28 – “We Are All Satoshi” – Craig Wright Exposed?
 Daily Crypto Review, Jun 19 – Bitcoin Mid-Term Bullish vs. Bearish Outlook – Explained
One reply on “Daily Crypto Review, August 28 – Bitcoin Bearish as XRP Plummets”
XRP dropping hard