
Almost every single cryptocurrency in the top100 ended up in the red today, as Bitcoin fell below $11,630. Bitcoin is currently trading for $11,334, which represents a decrease of 2.34% on the day. Meanwhile, Ethereum lost 3.84% on the day, while XRP lost 2.57%.
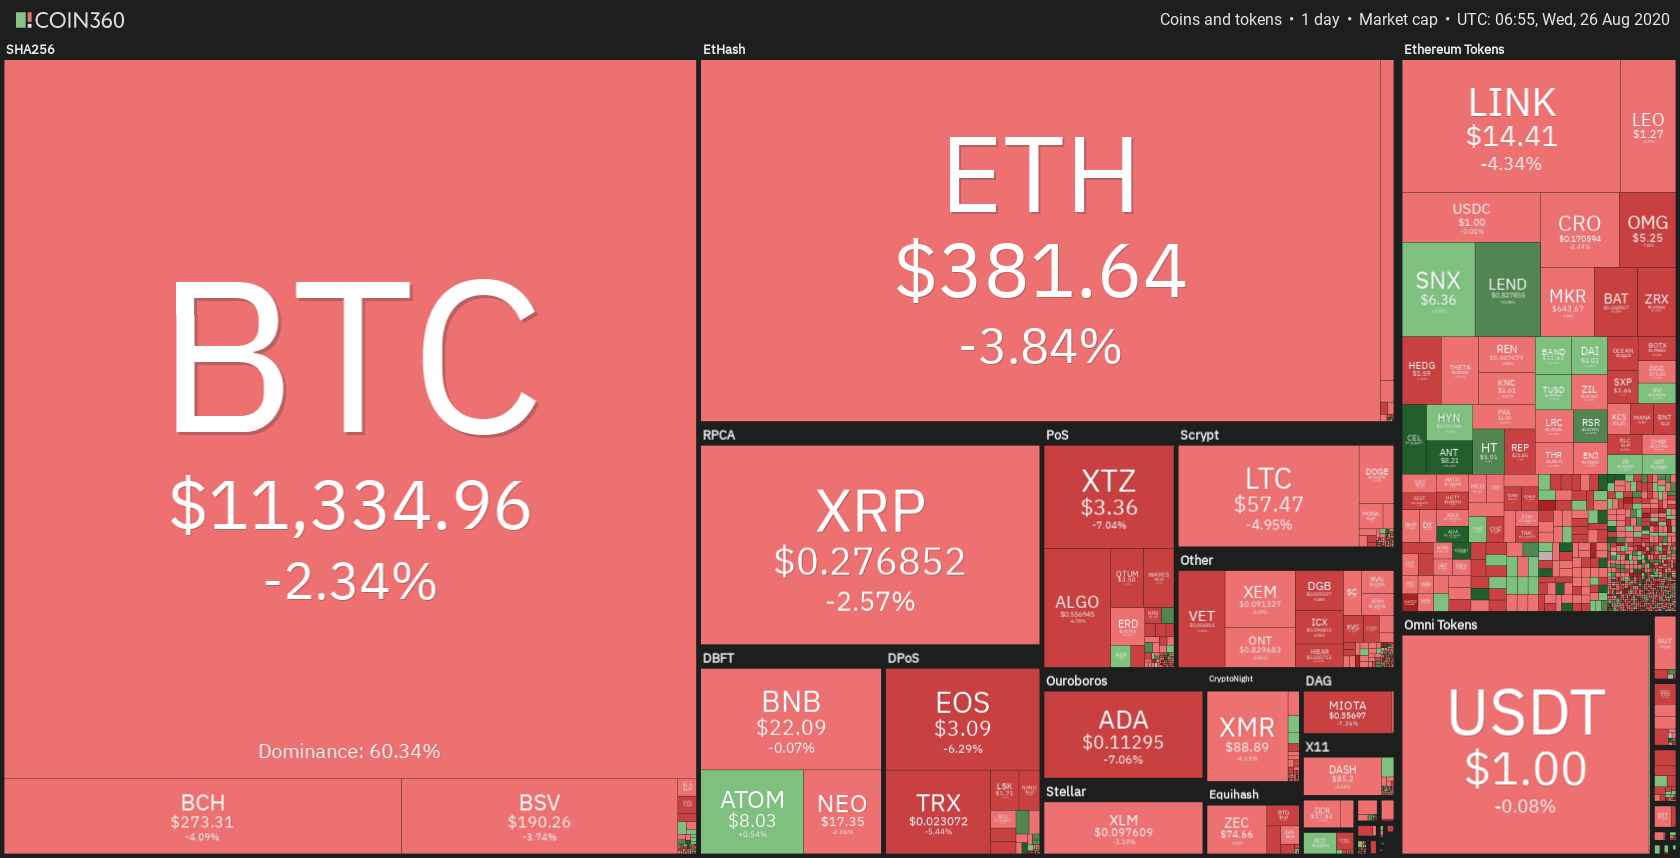
Daily Crypto Sector Heat Map
When taking a look at top100 cryptocurrencies, Kusama gained 35.49% on the day, making it the most prominent daily gainer. Aragon (18.33%) and The Reserve Rights (14.61%) also did great. On the other hand, Flexacoin lost 12.17%, making it the most prominent daily loser. It is followed by Ocean Protocol’s loss of 10.15% and Verge’s drop of 9.60%.
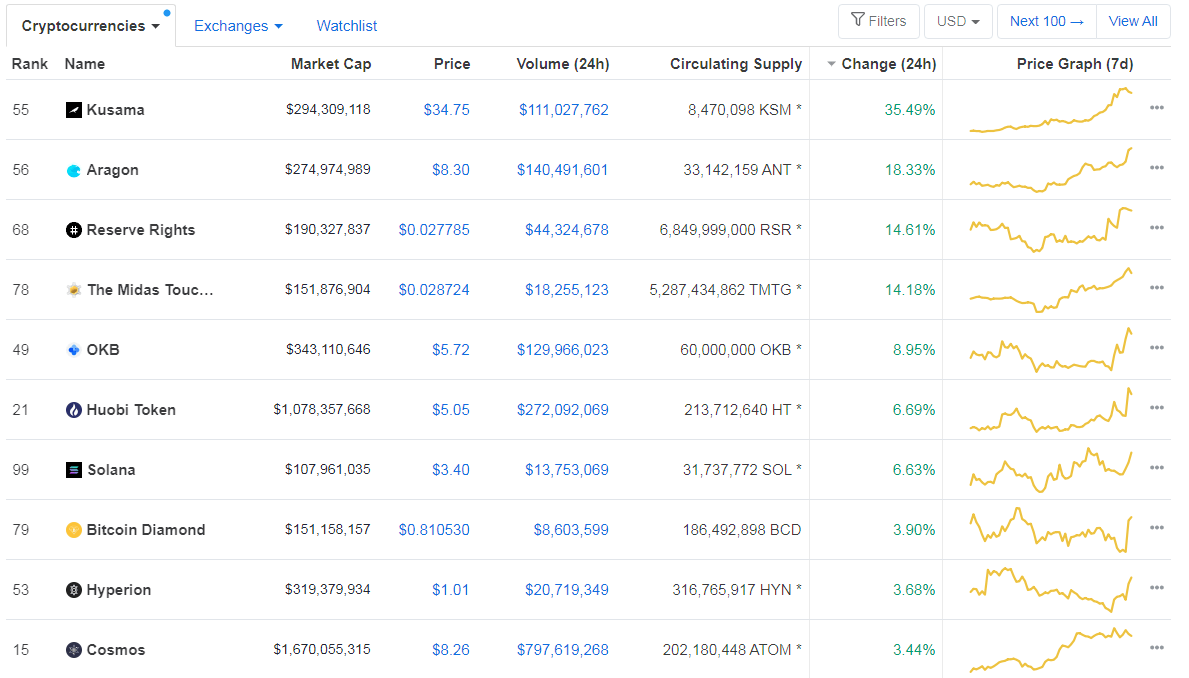
Top 10 24-hour Performers (Click to enlarge)
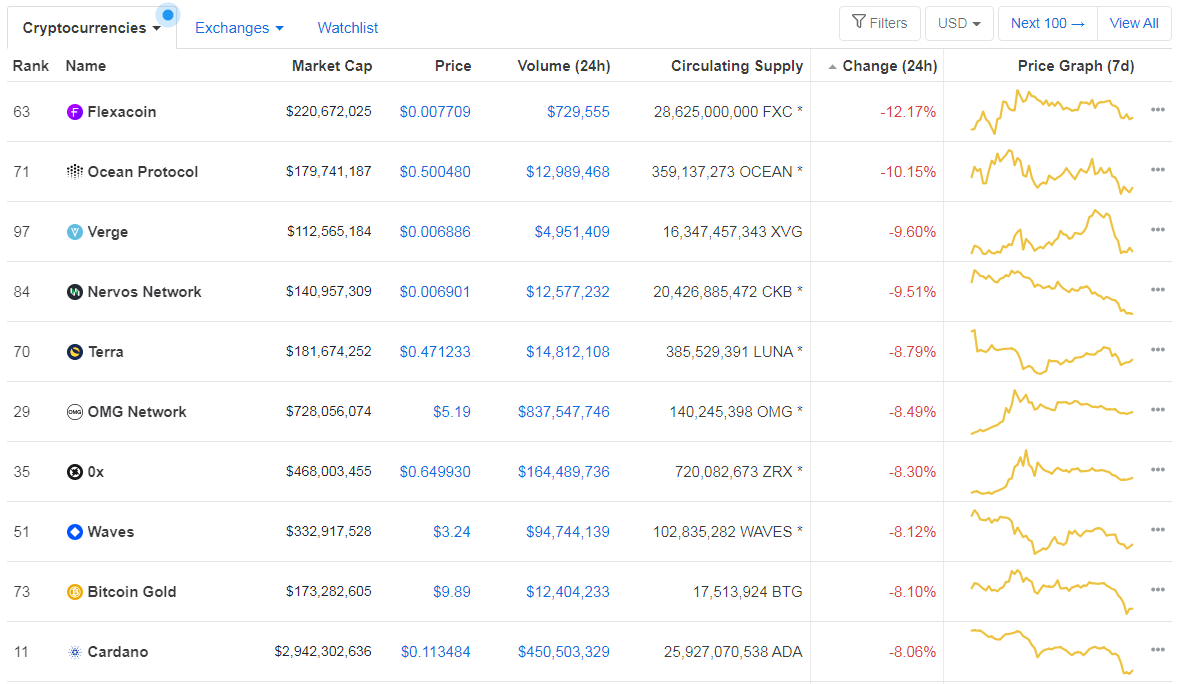
Bottom 10 24-hour Performers (Click to enlarge)
Bitcoin’s dominance level has increased slightly, with its value currently at 60.34%. This value represents a 0.3% difference to the upside when compared to our last report.

Daily Crypto Market Cap Chart
The cryptocurrency market cap decreased significantly over the course of the day. Its current value is $335.82 billion, which represents a decrease of $33.15 billion when compared to our previous report.
_______________________________________________________________________
What happened in the past 24 hours?
_______________________________________________________________________
- The IRS has sent another round of letters warning US crypto holders about their taxes (The Block)
- $150 million deal: FTX acquires Blockfolio in bid to expand retail footprint (The Block)
- Expect volatility: Bitcoin futures open interest surges to a new all-time high (Cryptoslate)
- Bitcoin mining reaches its largest difficulty ever, here’s what it means (Cryptoslate)
- Another Bitcoin Lightning Startup Is Working With Visa to ‘Fast Track’ Card Payments (Coindesk)
- Wirecard scandal fallout sees 50% of German staff laid off (Coindesk)
- Tether tops Paypal and Bitcoin for average daily transfer value (Cointelegraph)
- Ripple faces a lawsuit in Australia over ‘PayID’ branding (Cointelegraph)
- Rushed upgrade made 12% of Ethereum clients unusable (Cointelegraph)
_______________________________________________________________________
Technical analysis
_______________________________________________________________________
Bitcoin
Bitcoin has experienced yet another price drop in the past 24 hours. As we mentioned in our previous article, the largest cryptocurrency by market cap was preparing a move to either side and that the direction of the move will decide BTC’s faith in the short-term. As we can see, Bitcoin decided to go towards the downside and quickly dropped below its $11,630 and $11,460 support levels. It got stopped, however, by both the $11,090 and the descending trend line, which Bitcoin created ten days ago.
Traders should take a look at how Bitcoin resolves its current position and trade after they get more info.
BTC/USD 4-hour Chart
Technical factors:
- Price is below its 50-period EMA and its 21-period EMA
- Price is at its lower band
- RSI bounced off of the oversold line (32.84)
- Volume has increased
Key levels to the upside Key levels to the downside
1: $11,460 1: $11,090
2: $11,630 2: $10,855
3: $12,015 3: $10,505
Ethereum
Ethereum also had a bad day, with bears dominating its price movements. The second-largest cryptocurrency by market cap has, over the course of the day, dropped back into the descending trend it just briefly escaped the day before. Ethereum’s position within the descending trend was confirmed after a small price spike couldn’t get past the trend’s upper level.
Ethereum traders should look for how ETH handles being in the level, and how it exits it.
ETH/USD 4-hour Chart
Technical Factors:
- Price is currently below its 21-period and its 50-period EMA
- Price is at its lower band
- RSI is leaning towards oversold (37.87)
- Volume is normal (but the past 24h saw a surge in volume at one point)
Key levels to the upside Key levels to the downside
1: $415 1: $400
2: $445 2: $361
3: $496 3: $340
Ripple
XRP suffered from the same fate as BTC and ETH, with bears taking over the market and its price dropping in the past 24 hours. The third-largest cryptocurrency by market cap fell below $0.285 after not being able to properly confirm its position above it, and almost reached the $0.266 support in the process. XRP is now stabilizing at around $0.275 with low volume and volatility.
XRP traders should look for how the cryptocurrency reacts when it reaches its immediate support/resistance levels.
XRP/USD 4-hour Chart
Technical factors:
- Price is below its 21-period and its 50-period EMA
- Price is slightly above its lower band
- RSI stable, but leaning towards the oversold area (38.10)
- Volume is below average and stable (except a two-candle spike during the price drop)
Key levels to the upside Key levels to the downside
1: $0.285 1: $0.266
2: $0.31 2: $0.2454
3: $0.32 3:$0.235
Related posts
 Daily Crypto Review, Sept 21 – Crypto Market is Preparing For a Bearish Move; UNI Token Booming
 Daily Crypto Review, Sept 24 – Bitcoin Following Gold: $9,300 On The Horizon
 Daily Crypto Review, Oct 22 – PayPal to Enable its Users to Buy and Sell Crypto; Bitcoin Skyrockets to $13,000 as a Response
 Daily Crypto Review, Oct 27 – Bitcoin Preparing For a Retracement; XRP Tumbles on the Daily
One reply on “Daily Crypto Review, August 26 – Bitcoin in a Downtrend; Altcoins Following Bitcoin”
Hopefully a big push after these retracements