


Cryptocurrencies spent most of the weekend recovering from the bearish move, which occurred late Friday and early Saturday. Bitcoin is currently trading for $11,731, which represents an increase of 1.11% on the day. Meanwhile, Ethereum gained 0.8% on the day, while XRP gained 1.71%.
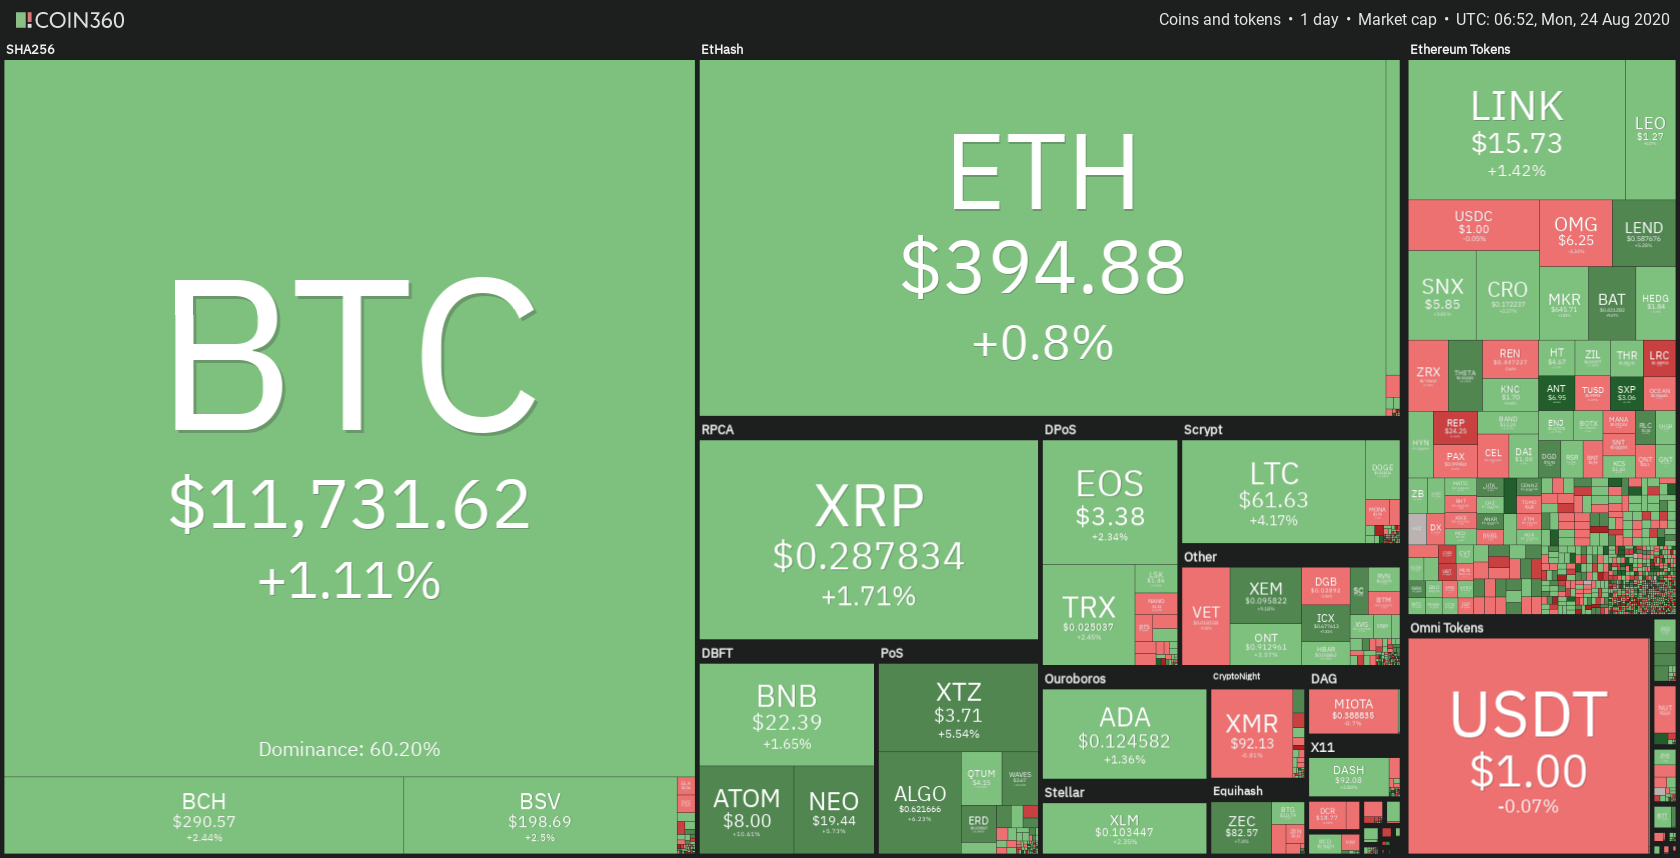

Daily Crypto Sector Heat Map
When taking a look at top100 cryptocurrencies, Cosmos gained 29.48% on the day, making it the most prominent daily gainer. IRISnet (21.33%) and The Midas Touch (18.49%) also did great. On the other hand, yearn.finance lost 8.32%, making it the most prominent daily loser. It is followed by Ren’s loss of 7.36% and Komodo’s drop of 6.67%.
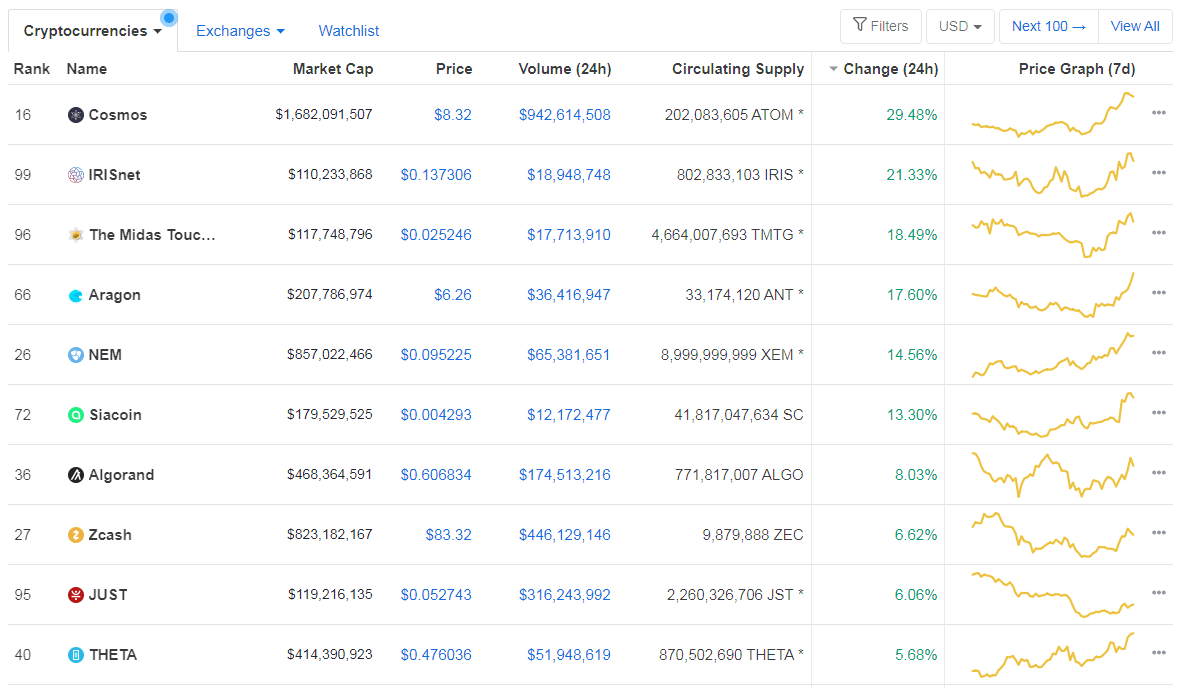
Top 10 24-hour Performers (Click to enlarge)
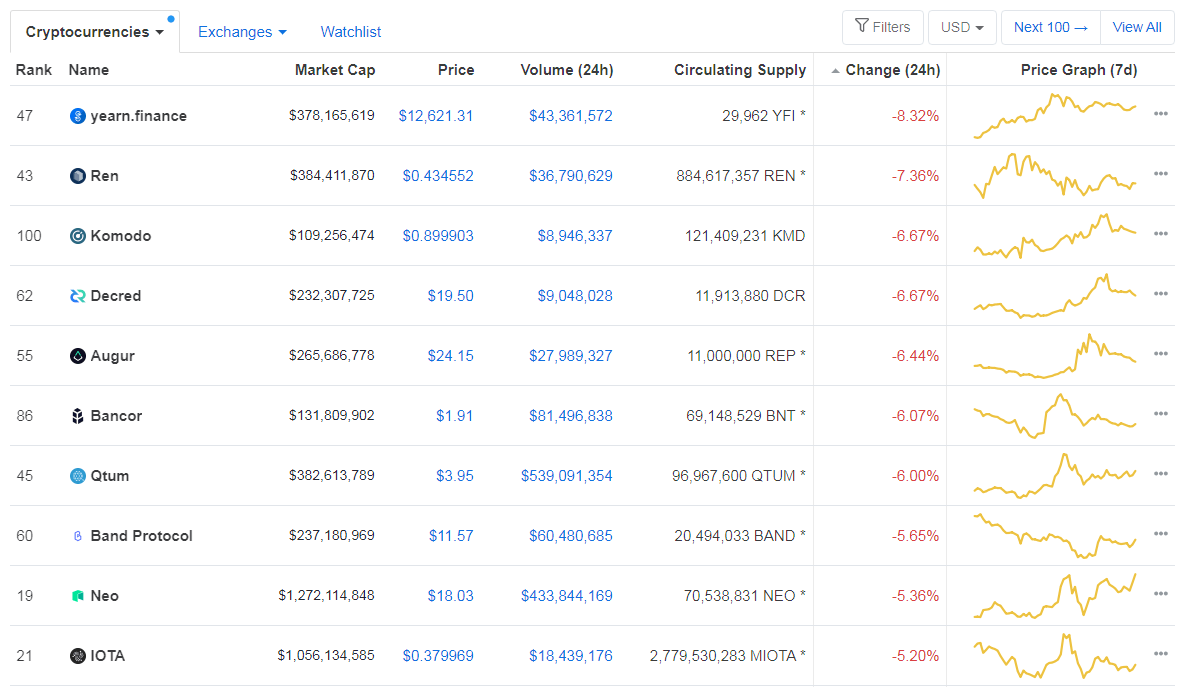
Bottom 10 24-hour Performers (Click to enlarge)
Bitcoin’s dominance level has increased slightly and passed the 60% mark to the upside, with its value currently at 60.20%. This value represents a 0.46% difference to the upside when compared to our last report.
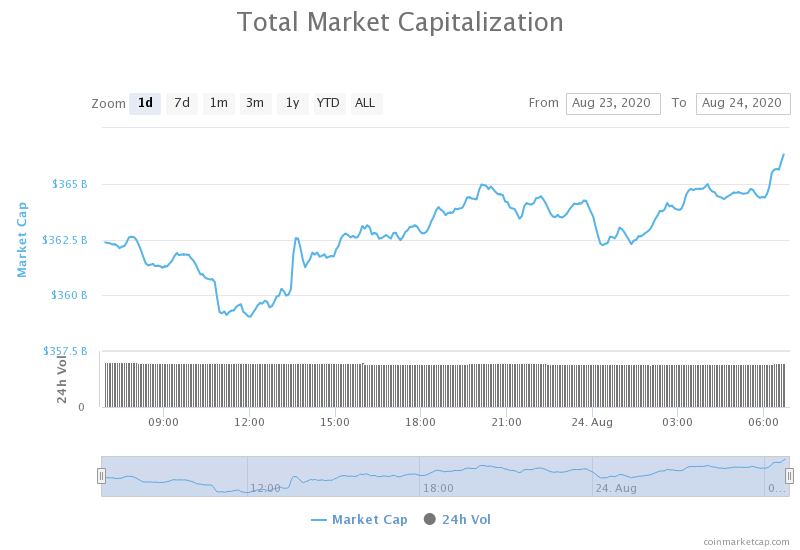
Daily Crypto Market Cap Chart
The cryptocurrency market cap experienced a decrease in value over the course of the weekend. Its current value is $362.71 billion, which represents a decrease of $10.46 billion when compared to our previous report.
_______________________________________________________________________
What happened in the past 24 hours?
_______________________________________________________________________
- yEarn Finance Is Officially the Youngest DeFi Billionaire (Cryptobriefing)
- The Amazon of Crypto? XRP Price Hinges on Ripple’s Ability to Improve Its Image (Cryptobriefing)
- Maduro Regime Blocks Bitcoin Exchange from Distributing $18M to Health Workers (Cryptobriefing)
- IOTA is Running Out of Money: Will the Tangle Survive? (Cryptobriefing)
- The founder of Curve now controls 71% of the protocol’s voting power (The Block)
- CBDCs need the private sector to be competitive, announces Ukrainian central bank official (The Block)
- ‘Warren Buffett’ Index Predicts Stocks Crash — How Will Bitcoin React? (Cointelegraph)
- Bitcoin.com Wallet Upgrade Allows Users Access to Interest Earnings (Cointelegraph)
- Researcher Re-mines Satoshi’s Bitcoin Blocks To Discover His Secrets (Cointelegraph)
- Buy Bitcoin Before’ Major Banking Crisis’ — ‘Rich Dad Poor Dad’ Author (Cointelegraph)
_______________________________________________________________________
Technical analysis
_______________________________________________________________________
Bitcoin
After a failed breakout of the ascending triangle, Bitcoin’s price started moving down until it reached $11,460 on Saturday. After reaching that level and not being able to pass it to the downside, Bitcoin bounced and started moving up slowly. The whole weekend was rather slow in terms of volatility, but extremely important in terms of where Bitcoin will end up. The fight for $11,630 was successful, and BTC is now above it, with the potential of going further up. However, the move to the upside will not go far with this volume, as it is way too low for any significant movement.
BTC traders should look for a trade near the $11,900 level, which might act as resistance.
BTC/USD 4-hour Chart
Technical factors:
- Price is above its 50-period EMA as well as its 21-period EMA
- Price is slightly above its middle band
- RSI is neutral (54.45)
- Volume is below average
Key levels to the upside Key levels to the downside
1: $12,015 1: $11,630
2: $12,300 2: $11,460
3: $12,900 3: $11,090
Ethereum
Ethereum’s weekend was also spent in recovering from the bearish moves that occurred in the previous week. The second-largest cryptocurrency by market cap managed to stabilize at below-$400 levels, which it is now trying to pass to the upside. However, the moves which occurred in the past week created a downward-facing trend, which is creating resistance towards the upside, which Ethereum is struggling to pass with low volume, which it now has.
Ethereum traders can look for a trade after Ethereum breaks the trend (to any side).
ETH/USD 4-hour Chart
Technical Factors:
- Price is currently above its 21-period and below its 50-period EMA
- Price is at its middle band
- RSI is neutral (49.72)
- Volume is below average
Key levels to the upside Key levels to the downside
1: $415 1: $400
2: $445 2: $361
3: $496 3: $340
Ripple
XRP’s chart looks no different than Bitcoin’s and Ethereum’s chart. The third-largest cryptocurrency by market cap spent the weekend recovering from what was lost during the bearish moves that occurred throughout the week. XRP stabilized at $0.28 and then gathered the strength to push past it. While the price is currently above the $0.285 level, it is not certain that it will stay that way. XRP would need a confirmation move in order to turn $0.285 into true support.
XRP traders can look for after XRP confirms its position, or after it drops below $0.285.
XRP/USD 4-hour Chart
Technical factors:
- Price is currently above the 21-period and below the 50-period EMA
- Price is slightly above the middle band
- RSI is neutral (51.50)
- Volume is stable and below average
Key levels to the upside Key levels to the downside
1: $0.31 1: $0.285
2: $0.32 2: $0.266
3: $0.332 3:$0.2454

Related posts


One reply on “Daily Crypto Review, August 24 – YFI The Youngest DeFi Billionaire; IOTA Going Bankrupt”
Eventful period!