
The cryptocurrency market had an interesting weekend, with Bitcoin pushing towards 12,000 and actually passing it at the time of writing. Bitcoin is currently trading for $12,003, which represents an increase of 2.24% on the day. Meanwhile, Ethereum gained 0.18% on the day, while XRP lost 0.11%.
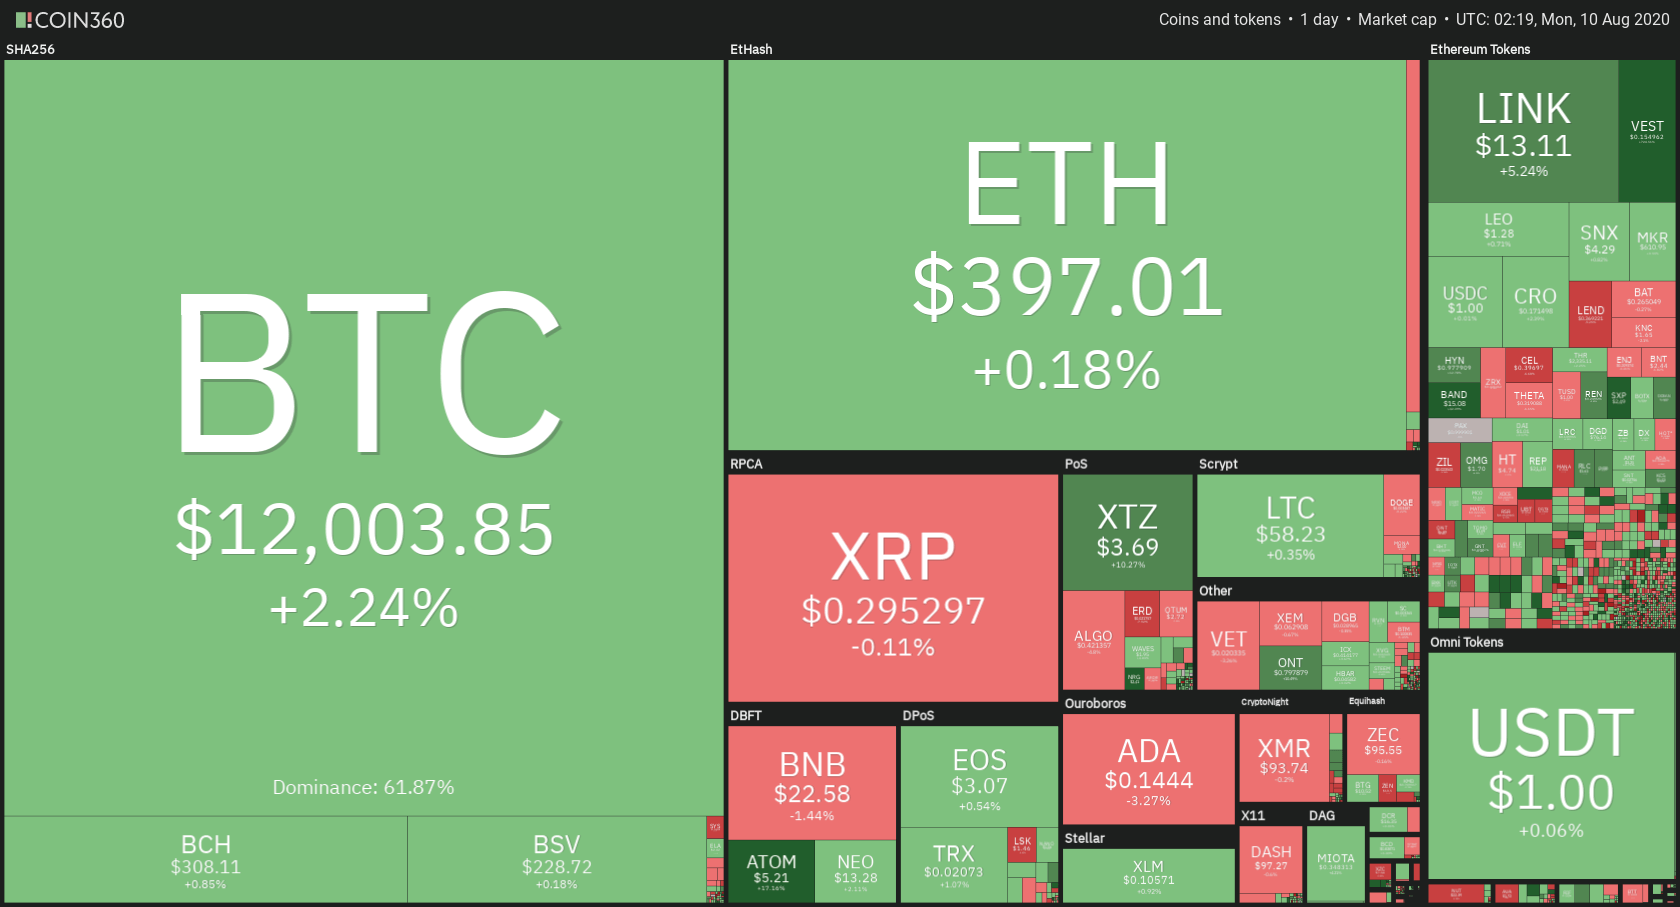
Daily Crypto Sector Heat Map
When talking about top100 cryptocurrencies, Balancer gained 45.17% on the day, making it the most prominent daily gainer. Band Protocol (32.27%) and Nervos Network(26.64%) also did great. On the other hand, Flexacoin lost 16.27%, making it the most prominent daily loser. It is followed by Decentraland’s loss of 9.91% and Elrond’s loss of 6.81%.
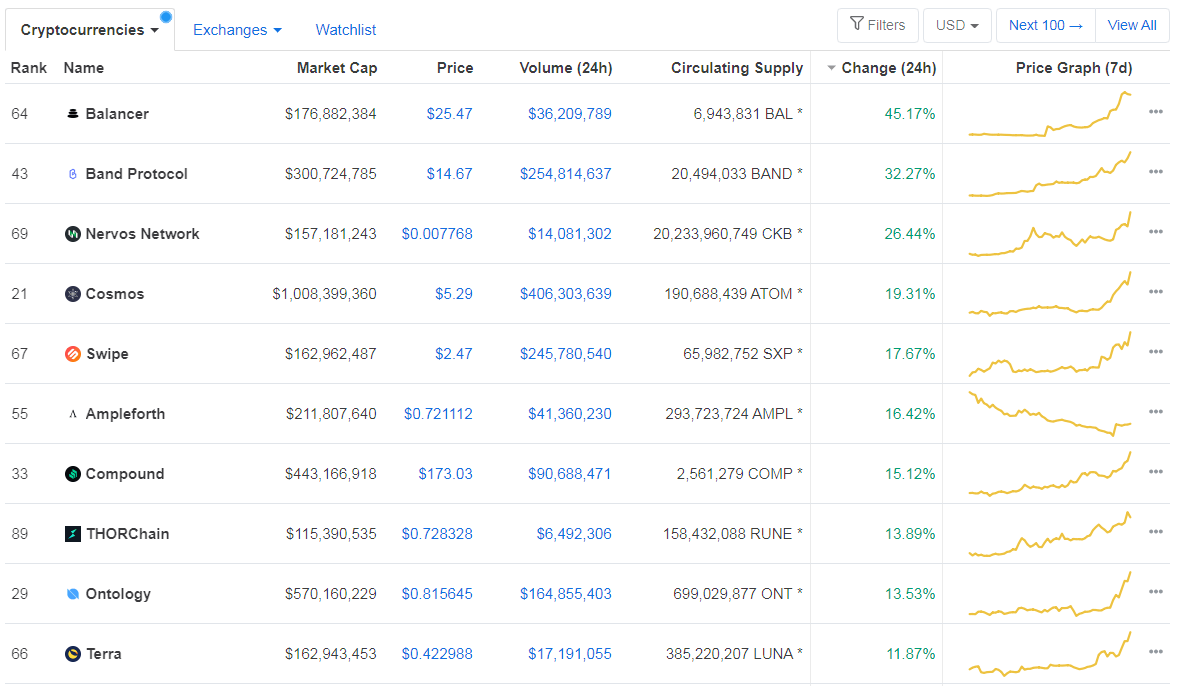
Top 10 24-hour Performers (Click to enlarge)

Bottom 10 24-hour Performers (Click to enlarge)
Bitcoin’s dominance level has increased slightly since we last reported, with its value currently at 61.78%. This value represents a 0.28% difference to the upside when compared to Friday’s value.
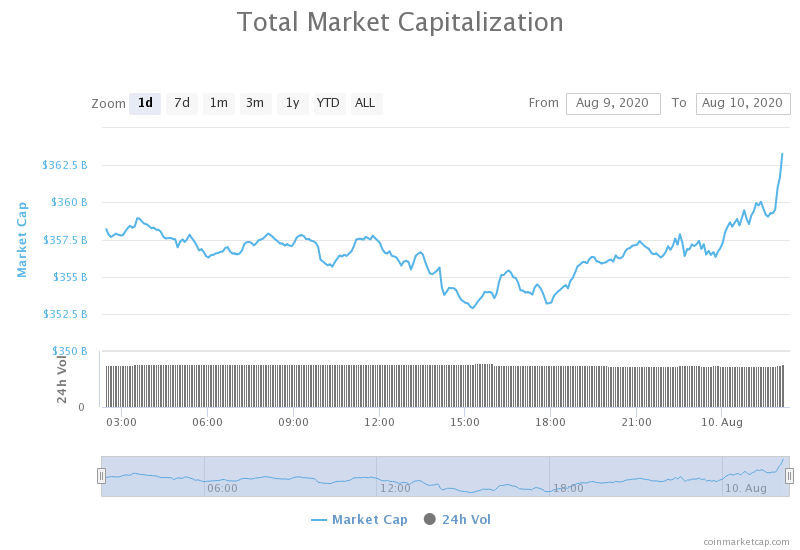
Daily Crypto Market Cap Chart
The cryptocurrency market capitalization has increased since we last reported. Its current value is $362.67 billion, which represents an increase of $3.77 billion when compared to Friday’s value.
_______________________________________________________________________
What happened in the past 24 hours?
_______________________________________________________________________
- Global Stocks in ‘Bubble Territory’ — But Bitcoin Traders Aren’t Fazed (Cointelegraph)
- BAND Token is Now Available for Trading on Huobi Global (Cointelegraph)
- More Than 10,000 New Blockchain Companies Established in China in 2020 (Cointelegraph)
- China’s Mining Dominance Unlikely to Last: Lopp (Cointelegraph)
- German fintech company Wirecard possibly robbed before its collapse (The Block)
- Fintechs are moving into bitcoin, but expect crypto startups to stay on their home turf (The Block)
- Trump vs Biden, who’s better for Bitcoin and crypto? (Cryptoslate)
- A $20m decentralized Chainlink (LINK) short was just liquidated on Aave (Cryptoslate)
- Bitcoin Cash Holders Dump BCH as Chain Split Fears Build (Cryptobriefing)
- Chainlink Screams Sell Despite New Highs (Cryptobriefing)
_______________________________________________________________________
Technical analysis
_______________________________________________________________________
Bitcoin
Bitcoin has spent the weekend pushing towards $12,000 and finally passing it in a major push just a couple of hours ago. However, the price didn’t fully (or at all) establish itself above the major mark. Bitcoin will need to confirm its position above $12,000 (and confidently) before being considered as officially above it. For now, this level is still a resistance level.
BTC traders should look for an opportunity to make a trade when BTC confirms its position above or below $12,000.
BTC/USD 4-hour Chart
Technical factors:
- Price is currently above its 50-period EMA, as well as its 21-period EMA
- Price above its top B.B.
- RSI is elevated (65.89)
- Volume elevated (on the increase)
Key levels to the upside Key levels to the downside
1: $12,000 1: $11,630
2: $12,330 2: $11,460
3: $13180 3: $11,090
Ethereum
Unlike Bitcoin, Ethereum spent the weekend without much movement towards the upside. However, the second-largest cryptocurrency by market cap did fall back to the $361 level and tested its support, which held up quite nicely. Once the price bounced back to its previous highs, it continued slowly moving towards the upside, but without any real strength. Ethereum still has a way to go before it reaches past $400.
Traders should look for a trade opportunity when Ethereum increases its volume.
ETH/USD 4-hour Chart
Technical Factors:
- Price is above its 21-period EMA and its 50-period EMA
- Price is slightly below its top B.B.
- RSI is elevated (58.51)
- Volume increasing slightly
Key levels to the upside Key levels to the downside
1: $400 1: $361
2: $415 2: $340
3: $496 3: $302
Ripple
XRP had quite a turbulent weekend, with its price failing to stay above the previously broken triangle formation levels. This happened as, even though XRP managed to break the triangle formation to the upside, it did not reach past the $0.31 resistance level. Instead, bears stepped into the market and brought the price down to below $0.285 levels (at one point). However, the $0.285 level held up and XRP has confirmed its position above this support.
Traders can look for an opportunity to trade when XRP reaches the $0.31 mark and decides if it will reach above it or fall below once again.
XRP/USD 4-hour Chart
Technical factors:
- Price is above its 21-period and 50-period EMA
- Price is slightly above its middle B.B. (20-period SMA)
- RSI is neutral (51.45)
- Low volume
Key levels to the upside Key levels to the downside
1: $0.31 1: $0.285
2: $0.32 2: $0.266
3: $0.3328 3: $0.245
Related posts
 Daily Crypto Review, May 19 – Bitcoin Not Producing Enough Blocks?
 Daily Crypto Review, May 25 – Bitcoin Under $9,000; Goldman Sachs Hosting a Conference Call on Crypto
 Daily Crypto Review, May 29 – Bitcoin above $9,500; Goldman’s Criticism vs. Grayscale’s Optimism
 Daily Crypto Review, Sept 11 – DeFi Sector Experiences Volatility; The Rest Of The Market Stable
One reply on “Daily Crypto Review, August 10 – Chainlink Surpasses LTC’s Market Cap Despite Major Bearish Signals”
mixed messages…wonder whats going on