Categories
Forex Basic Strategies

Trading The Forex Market Effectively Using ‘Renko’ Charts

Introduction

If you are a Forex trader, you can agree-many winning strategies exist out there. And Renko charts are among the handy weapons you can deploy to your advantage. This write-up will help you grasp handy tips to get your feet wet, as well as scaling your trading into a profitable trajectory.

Renko charts are not very popular as bars or candlesticks among traders. However, they can be very profitable when a trader uses them correctly. Renko chart trading is a robust way to analyze price trends, and even superb when you combine it with another tool to confirm entry and exit positions.

What Is Unique With Renko?

Well, Renko charts only show you the price movements of an underlying asset without factoring in time and volume. The formation of a Renko bar or body is in one direction. And it forms only when prices move by a predefined amount in pips. You can adjust the number of pips per block to suit your needs or trading strategy.

Also, a subsequent Renko bar can only form either adobe or below a previous one. It’s that model that shows you the price direction with unique preciseness.

Their naming arises from Japanese “Renga,” which means brick. Therefore, Renko charting arises from a series of blocks. In the light of Forex trading, the charting of the blocks moves up or down with prices.

Advantages of Trading Forex using Renko charts

  1. Renko charts are simple in both ease of interpretation and use.
  2. Great for determining the levels of support and resistance.
  3. Traders can adjust the block sizes to suit their trading needs.
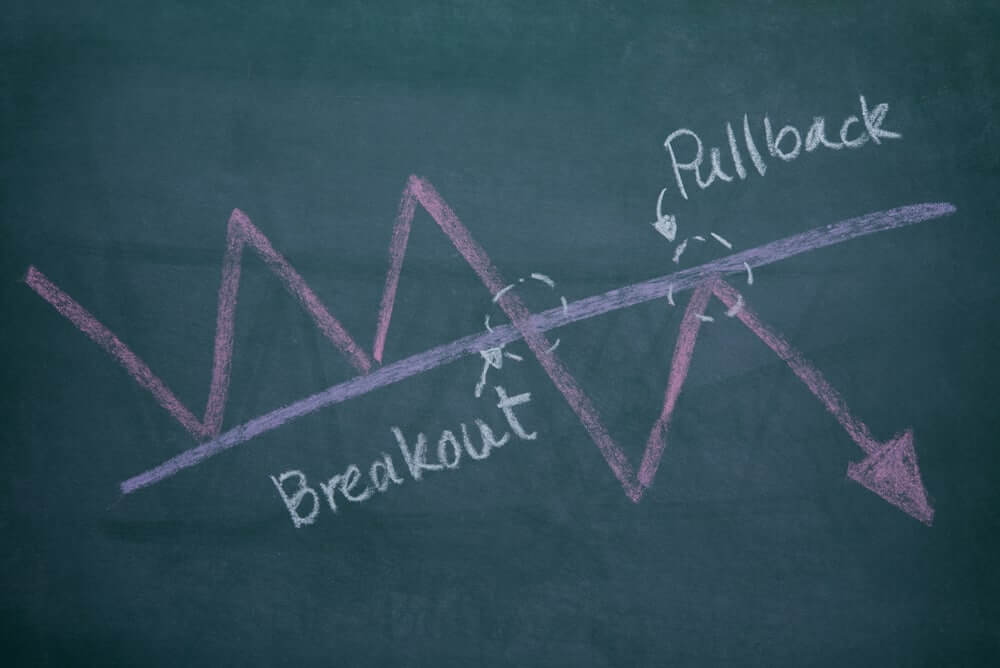
  4. Renko charts are great at signaling price breakout or reversal.
  5. Ideally, Renko charts only show you how prices are moving.

Overall, Renko charts give traders an edge with overly volatile commodities like Oil and Gold. The charting digs deeper into the pricing histories. The charting model behind Renko builds on plotting price on the -Y-axis Vis a Vis time.

Renko beats conventional price-charting by removing insignificant price movements.

There are three metrics that Renko shades off from ordinary price action. And they are:

  • Any false price breakouts
  • The candle-wicks
  • The price volatility

Ideally, it pays attention to the critical metrics: support, resistance, and the trend.

Whenever prices move, Renko converts that into a commensurate block on the chart. And every block forms after price confirmations. The reality is, Renko charts do not work with partial blocks. They have to be wholesome and in line with the set numbers per single block.

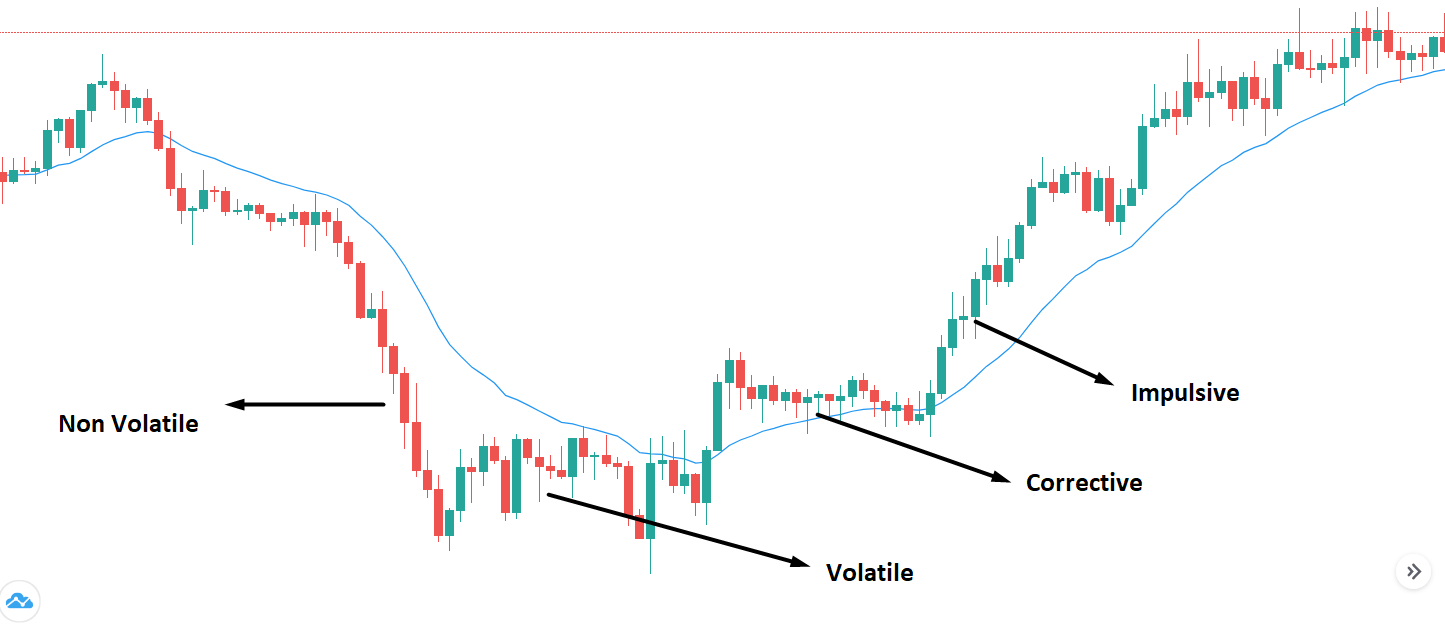
As a trader, it makes great sense if you’re able to sift out short-term fluctuations out of a price chart. Beauty is Renko charting is a great tool at that. Price volatility is the greatest enemy for many traders, especially if you can only bring in a small trading margin.

While most traders can establish trends from normal price- charting, Renko charting is another wholesome set of trading tools to help you sharpen your decisions while trading.

More Pointers with Renko Charts

As indicated earlier, Renko charting creates blocks after by concurrently establishing the closing positions of a previous block. Next, subsequent blocks can only form either below or above a previous one.

Using the precedence above, Renko charting brings you a precise tool into your trading arsenal to help you view trends more clearly. Along with that, it’s also important to calculate the most appropriate block size – in line with the asset you target to trade.

Calculation of Renko blocks

There are two documented methods for the determination of the optimal sizes of Renko blocks.

First is the ATR or Average True Range. It relies on the ART indicator to determine the height of an ordinary candlestick.

Second is the model where a trader provides a predefined value for the size of a block.

So, new blocks only form when price movements meet the minimum value set for a block.

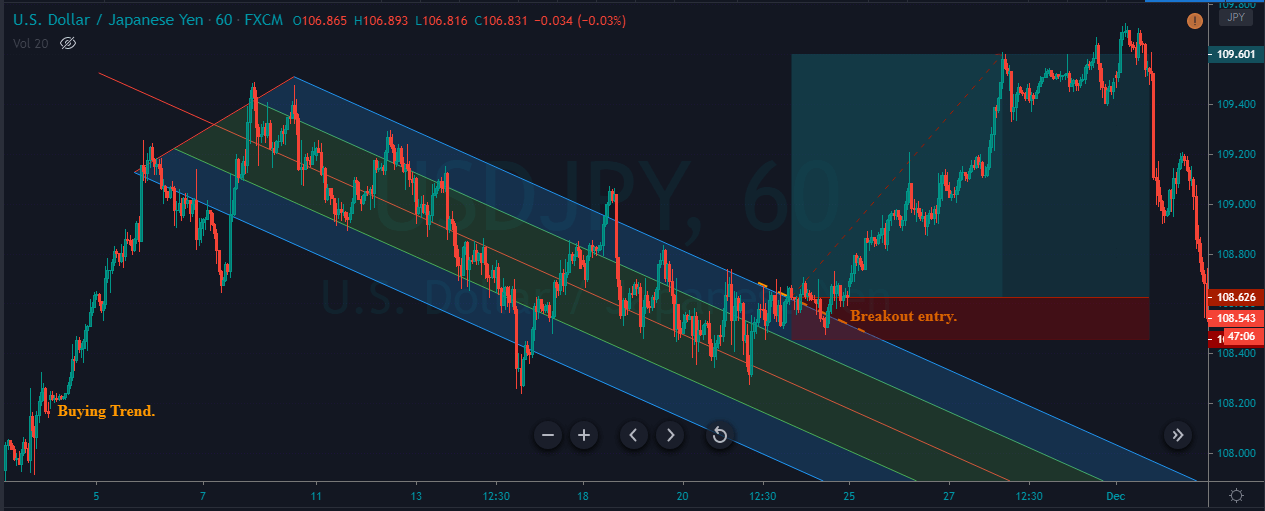
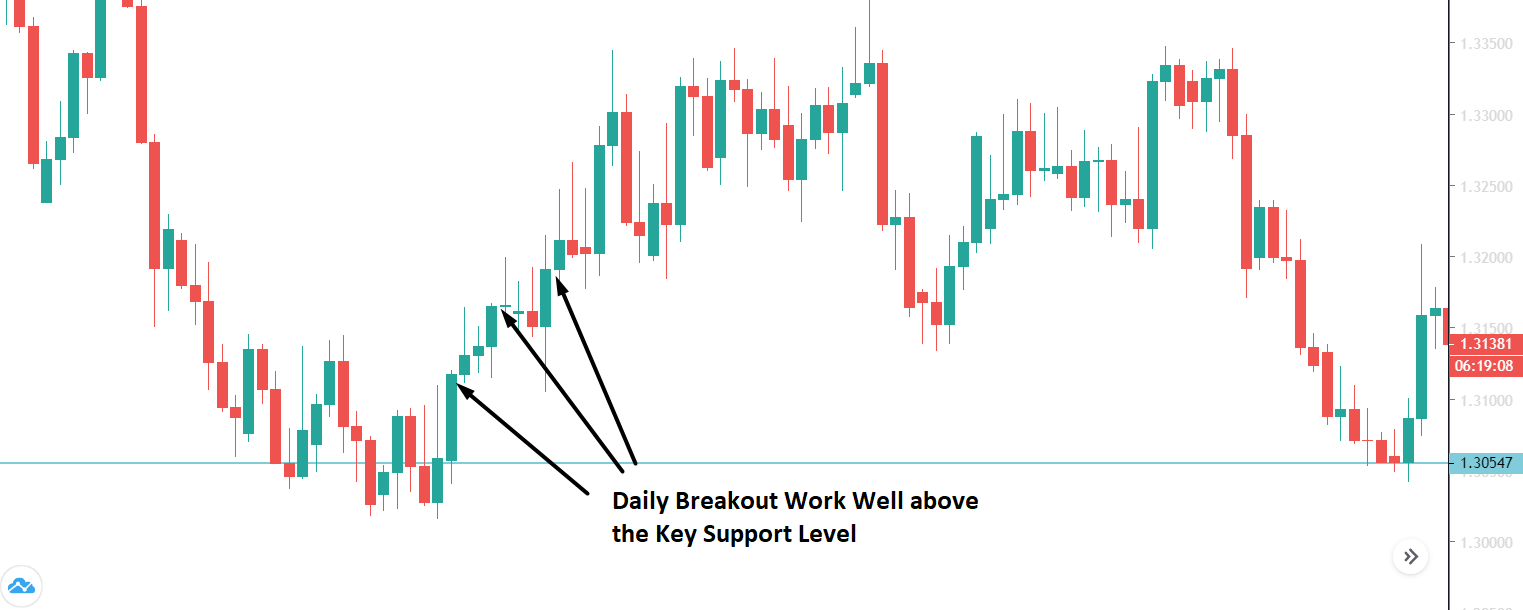
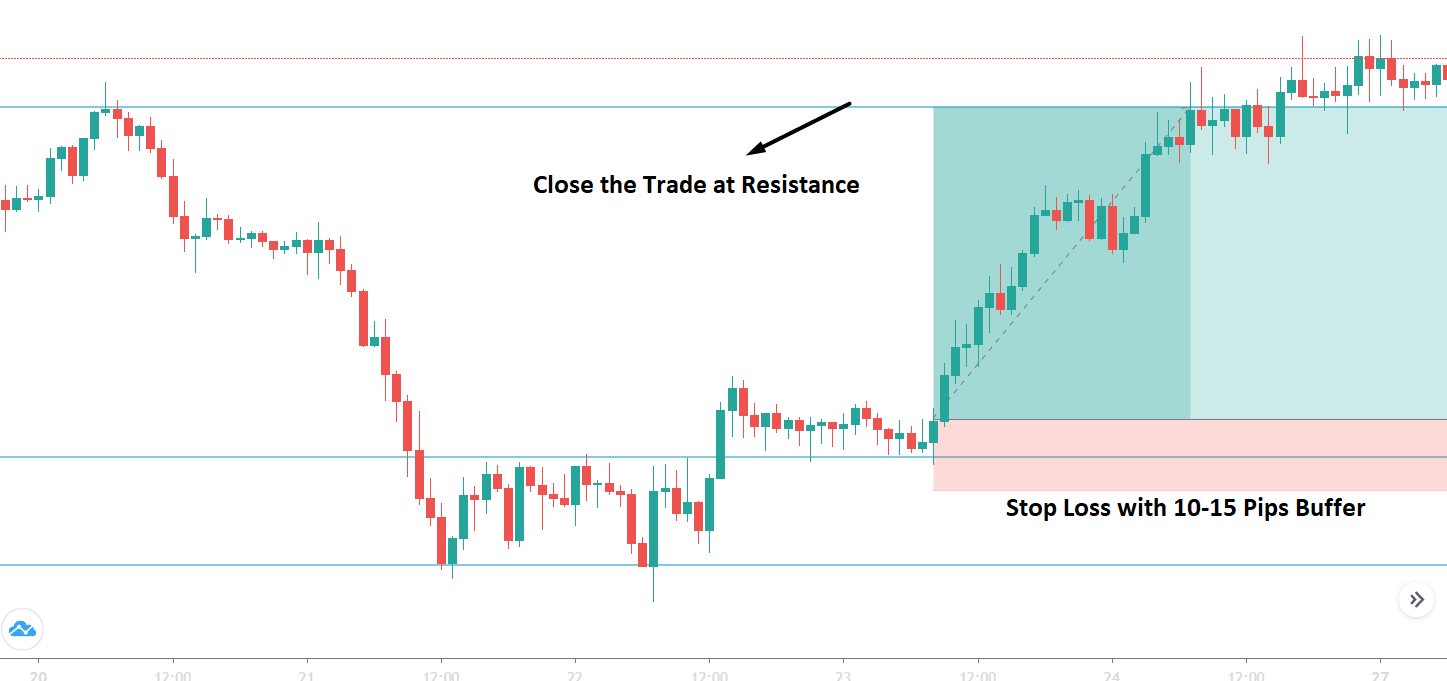
Sniffing a Buy Opportunity with Renko Charts

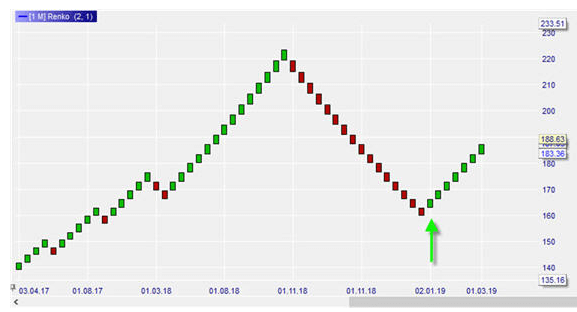
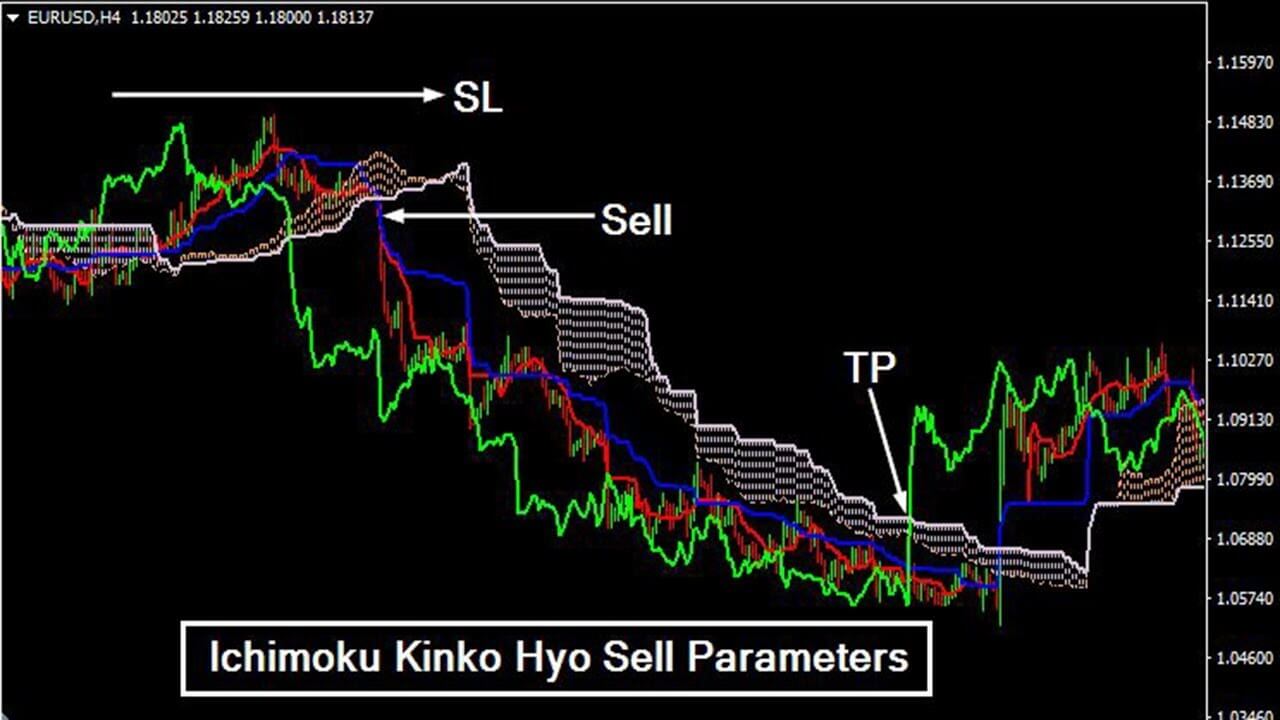
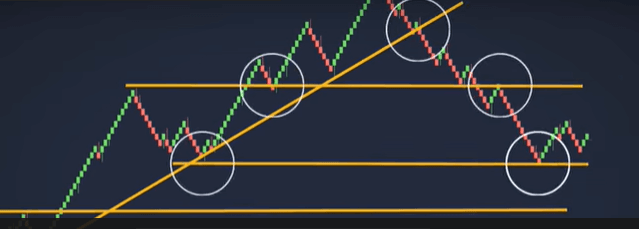
Image credits: best-trading-platforms.com

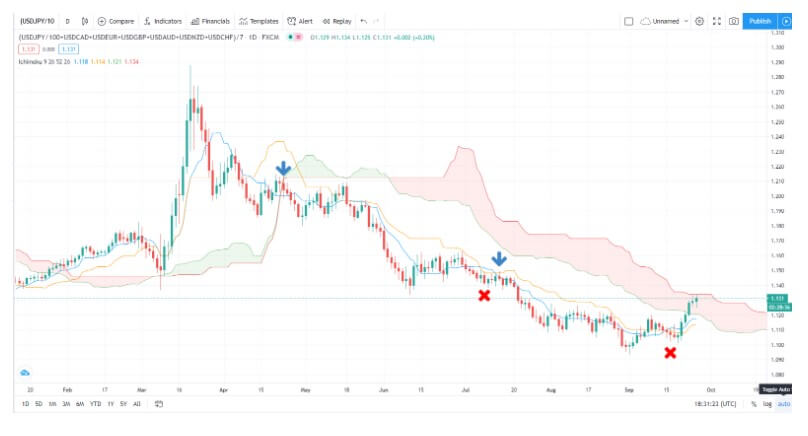
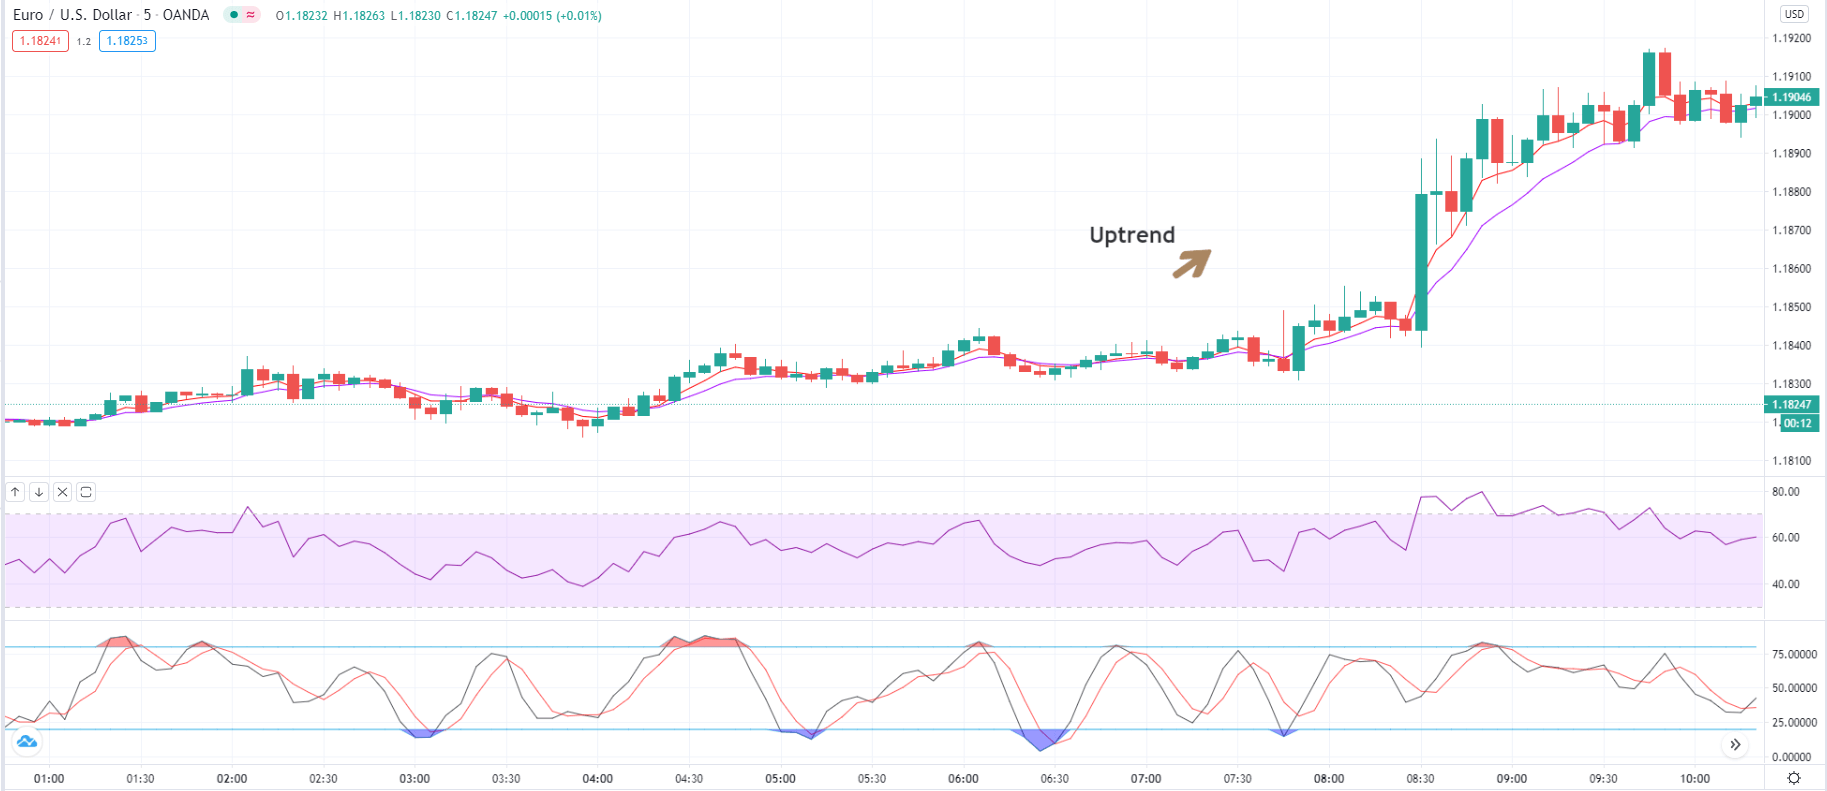
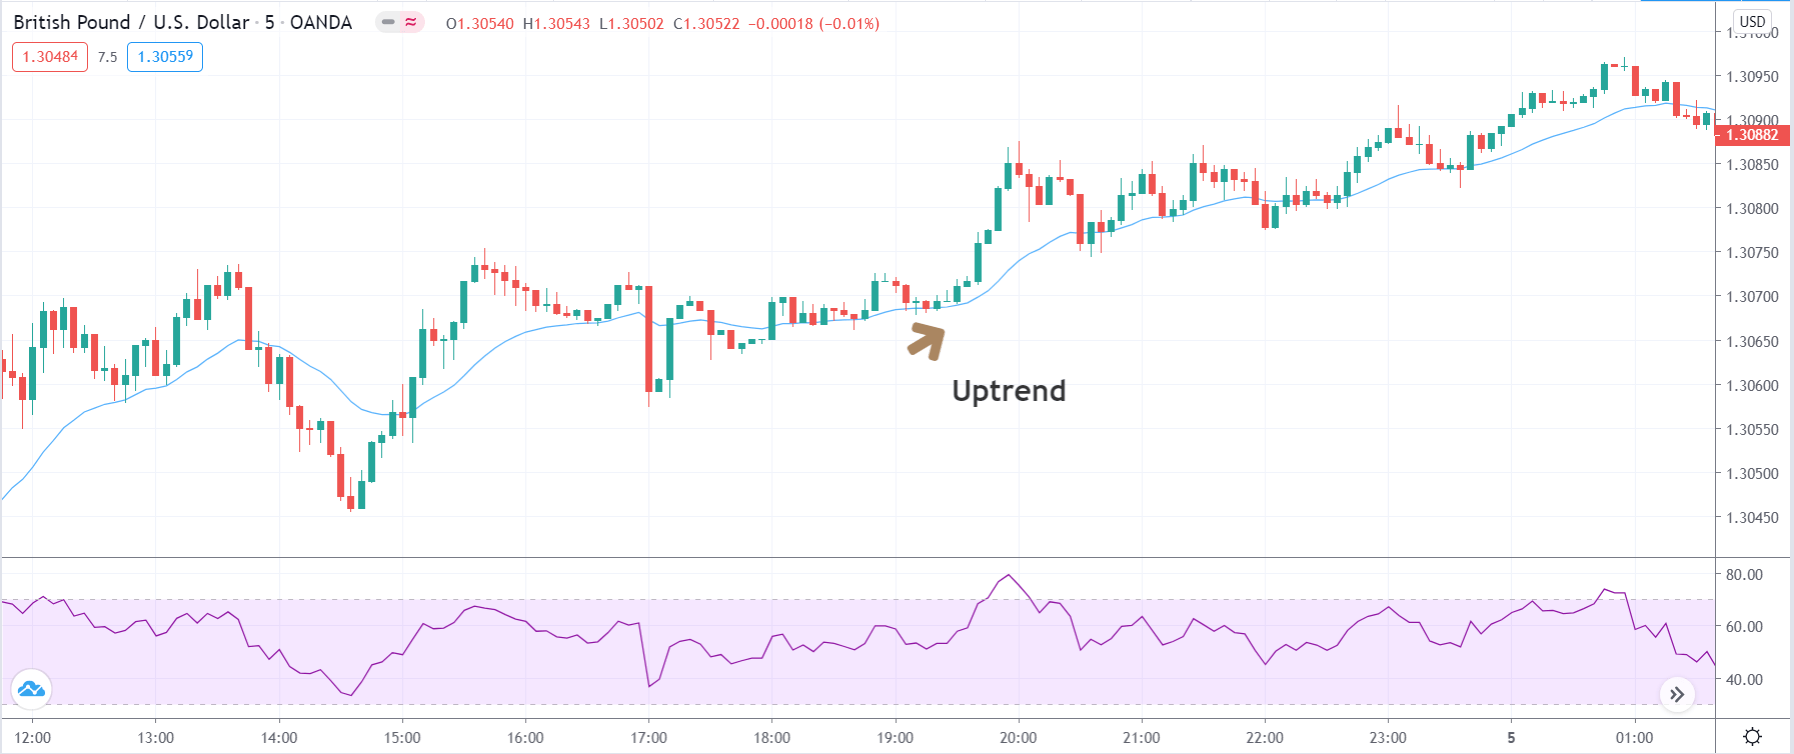
Renko charts help traders spot trend directions very clearly. And there are two ways to spot an opportunity to go long. Using the image above, a monthly view of a stock’s prices is visible. Simple, green bricks signify uptrends, while the ref ones signify the downtrend.

Primarily, the years 2017 and 2019 are trends – good opportunities to go long (buy). Towards the end of 2018, there’s a trend reversal (bricks turn red- the opportunity for buyers to exit and pocket profits)

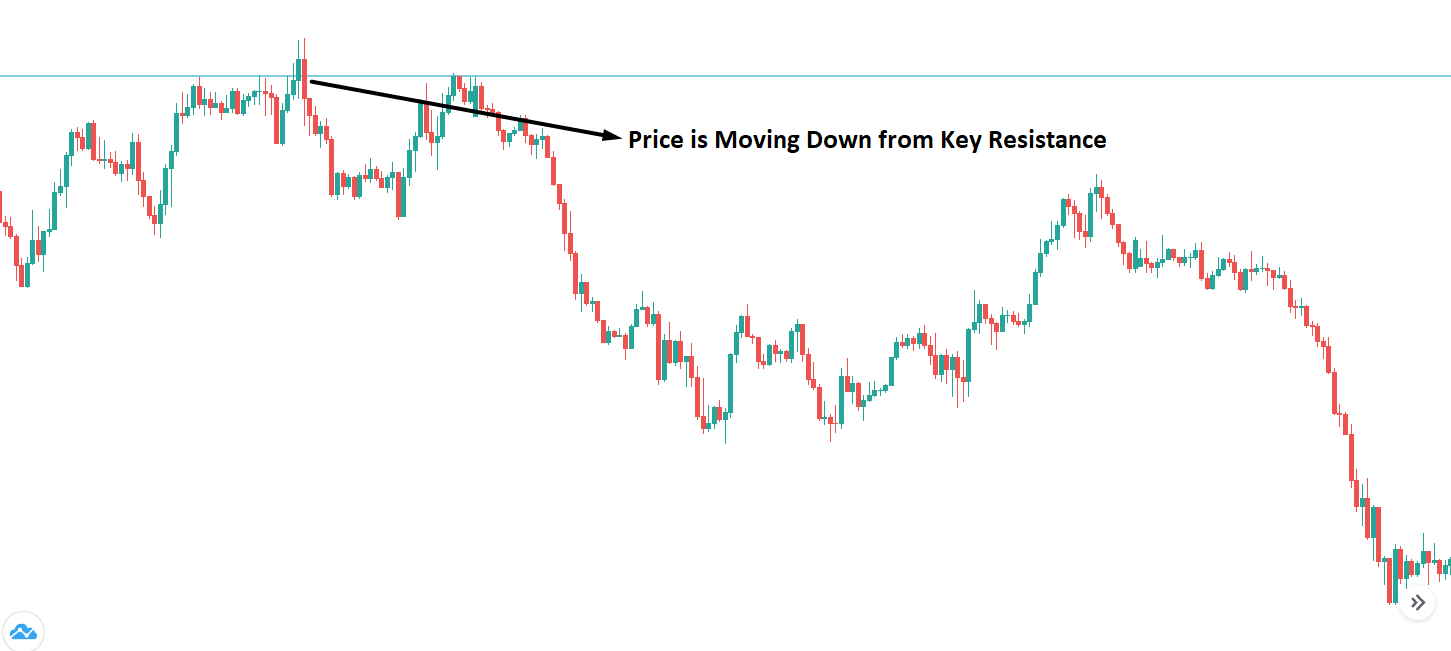
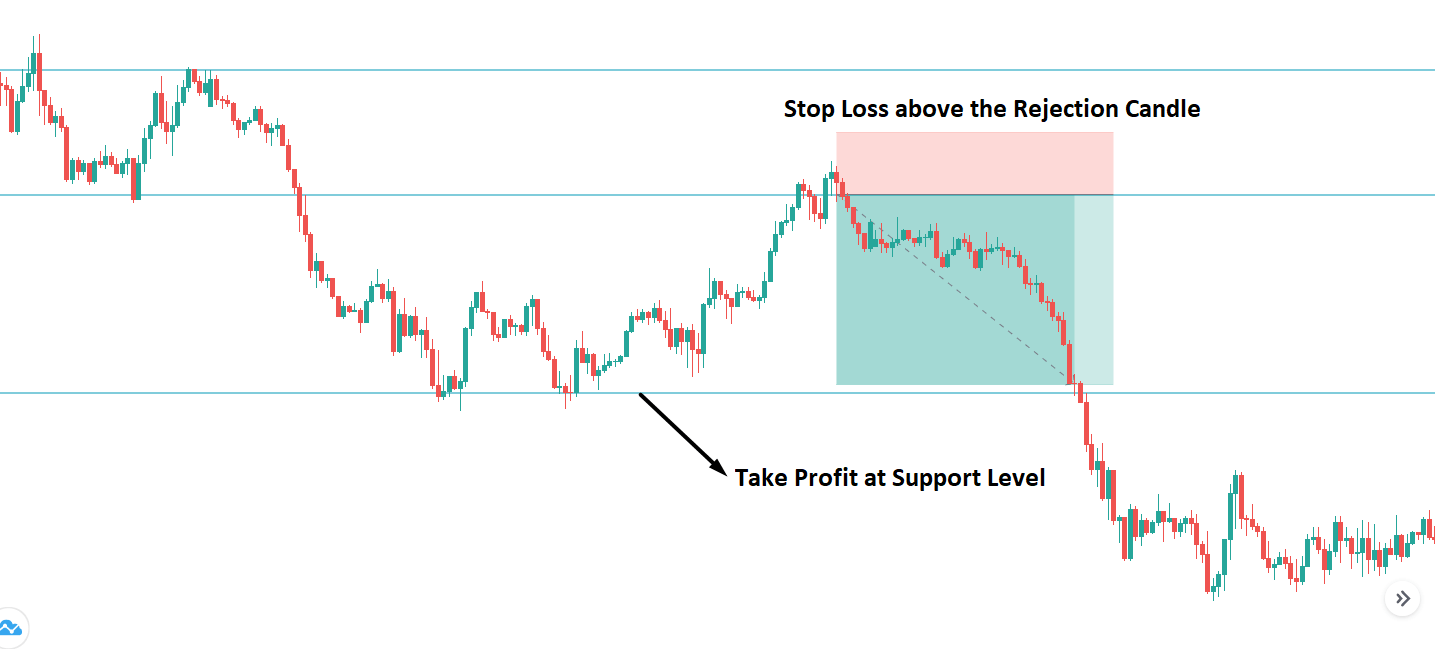
Also, the same trend reversal creates an opportunity for traders to go short and also take profits. Look at 2019 also; the green bricks signify the continuity of the uptrend.

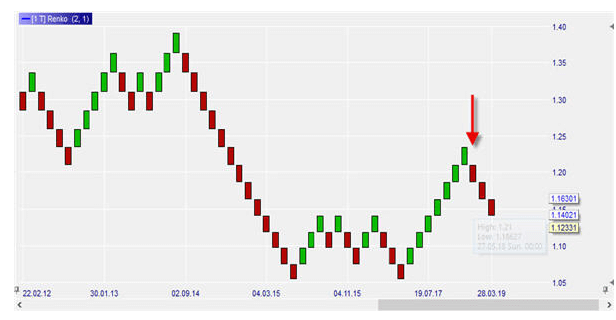
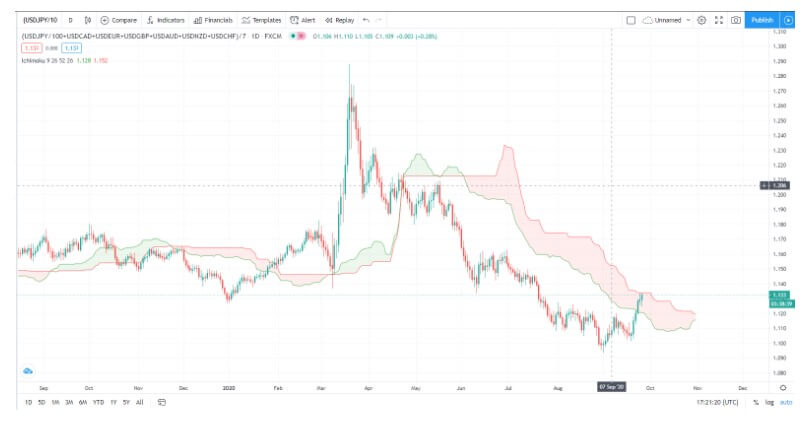
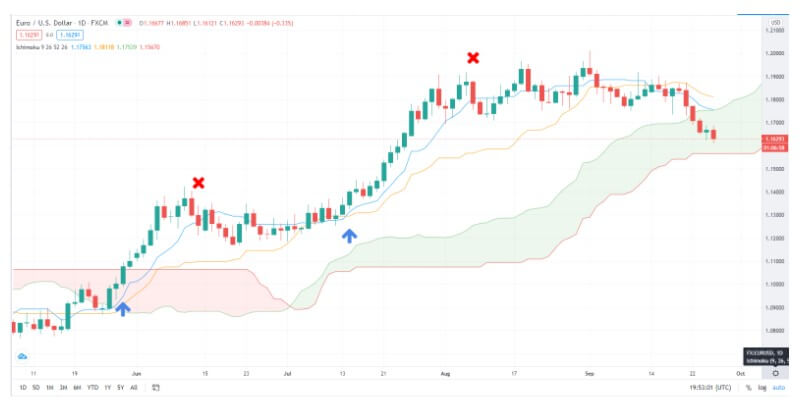
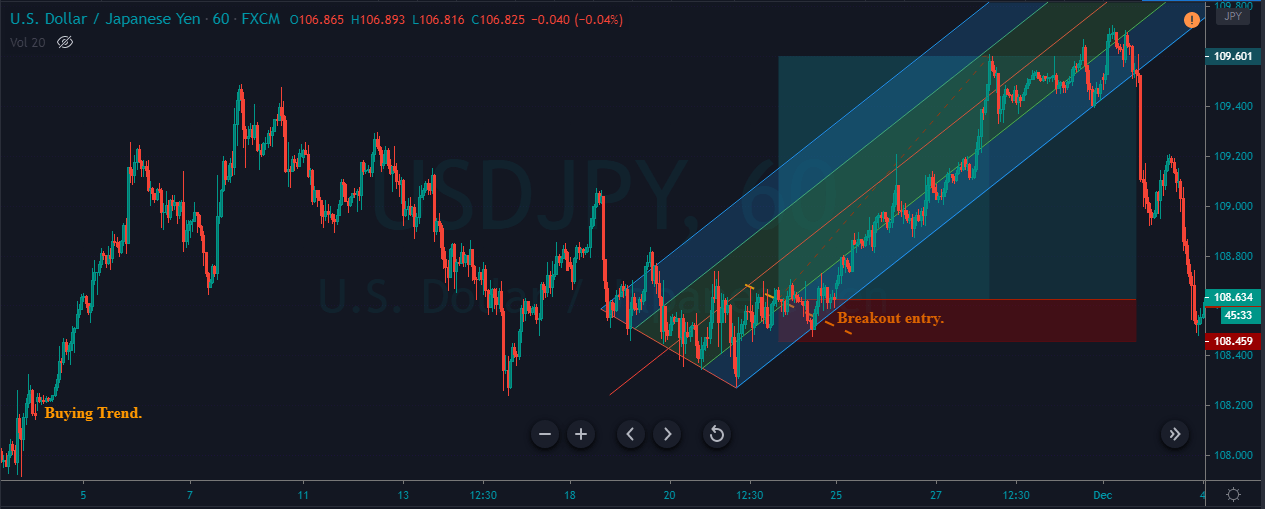
Image Credits: best-trading-platforms.com

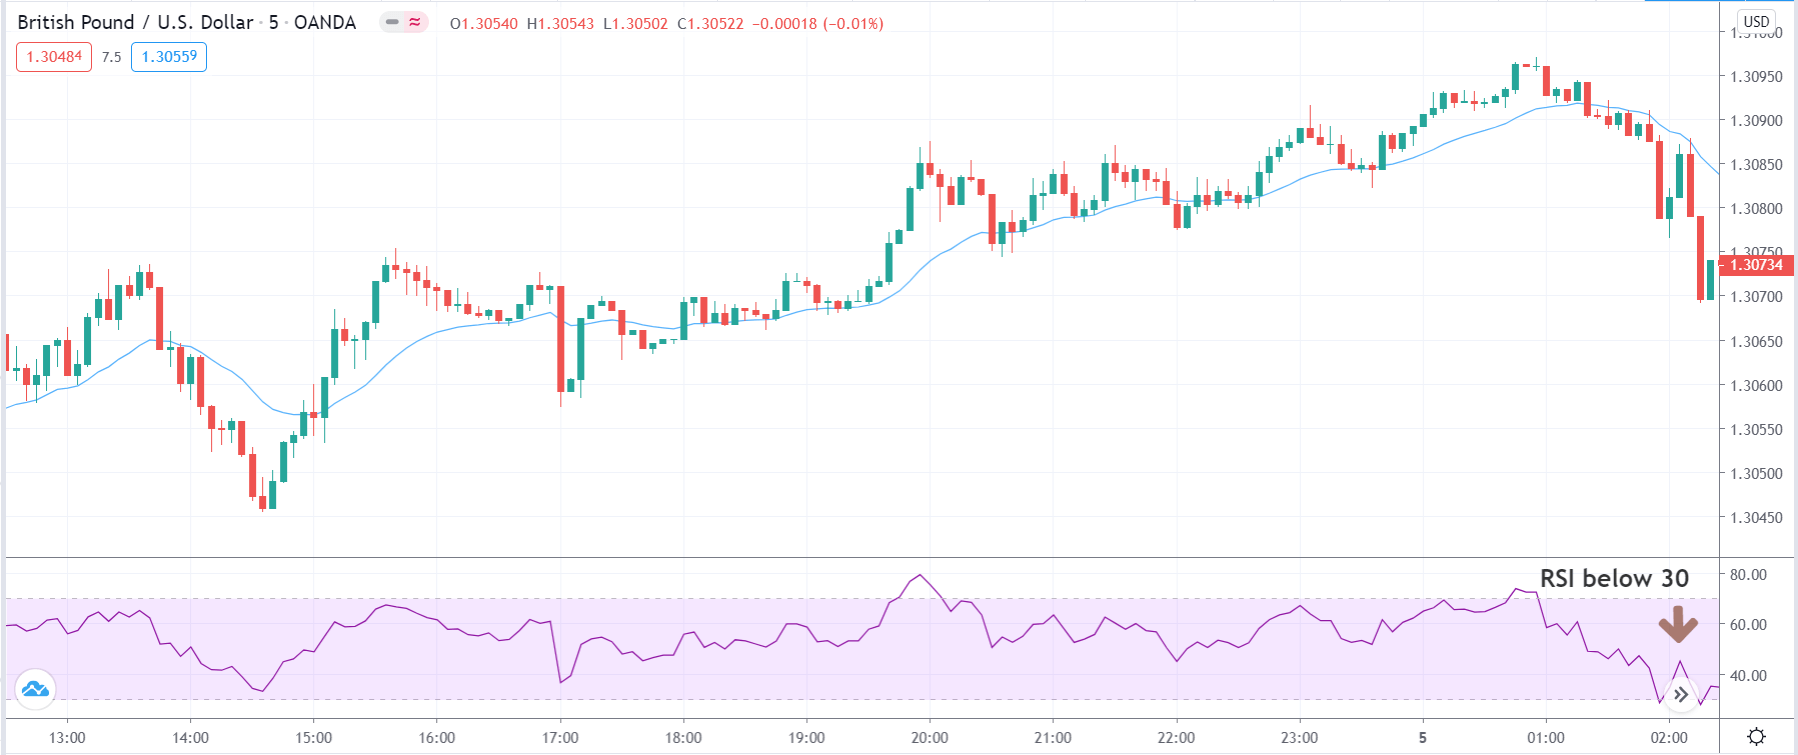
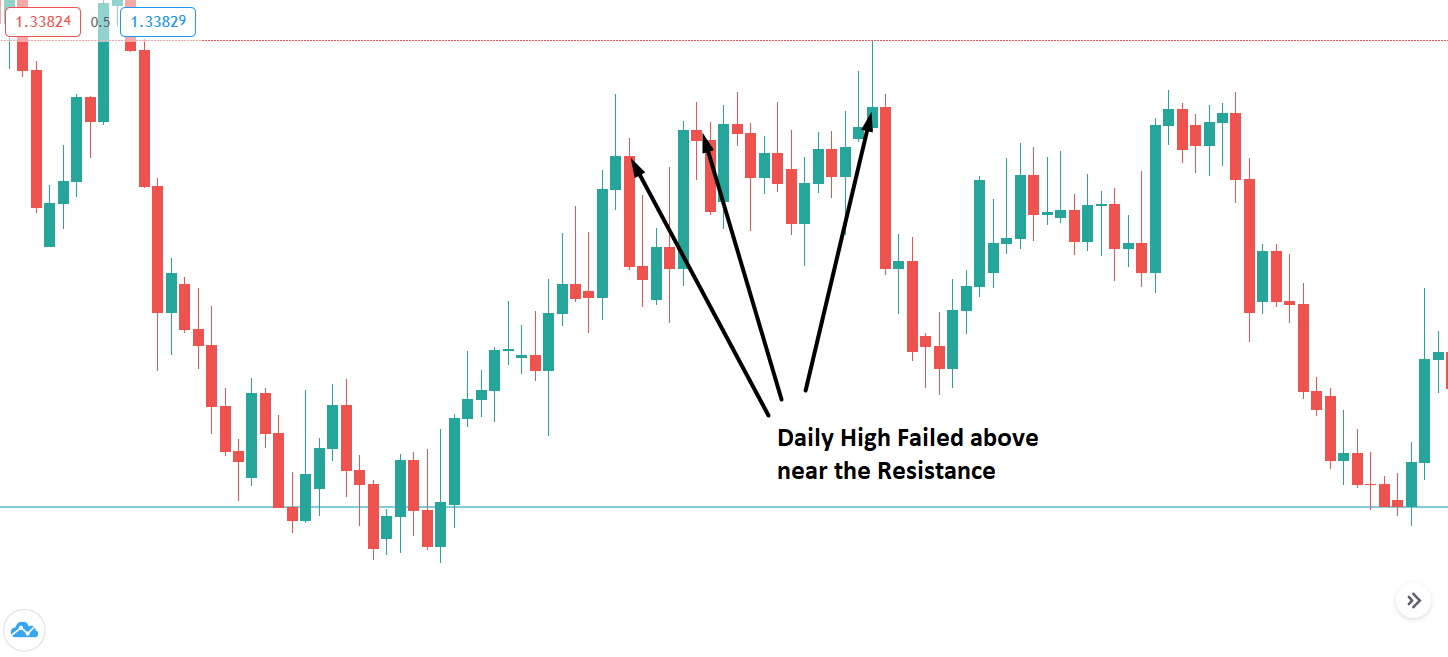
Look at the figure above, the EUR/USD pair oscillations ranging from 1.0500 – 1.1500 from 2015 through to -2016. Also, notice the uptrend starting from 2017 but with a reversal along the way. Uptrends are opportunities to go long, while downtrends are opportunities to go short.

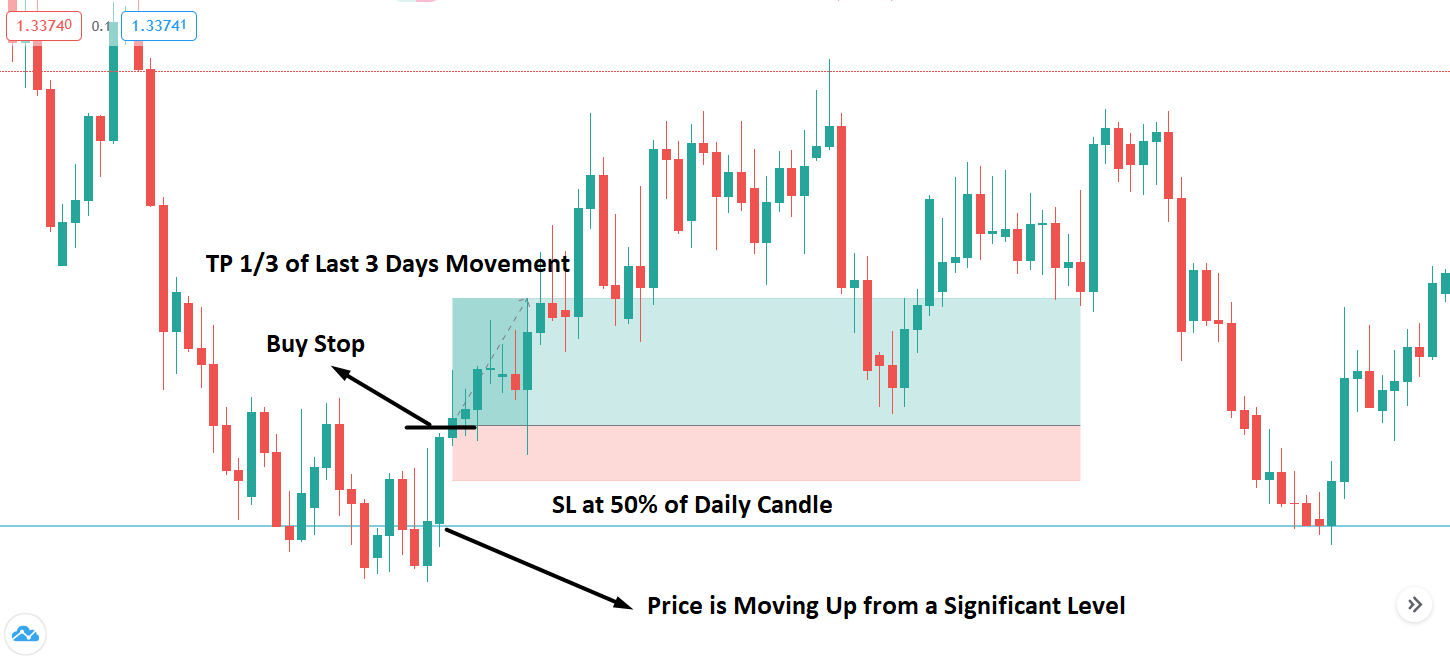
Pro Tip: If you are looking to upscale your trading success, Renko charts greatly help. However, ensure that aside from mastering them, it’s excellent to confirm the trends, support, and resistance levels using one or more indicators.

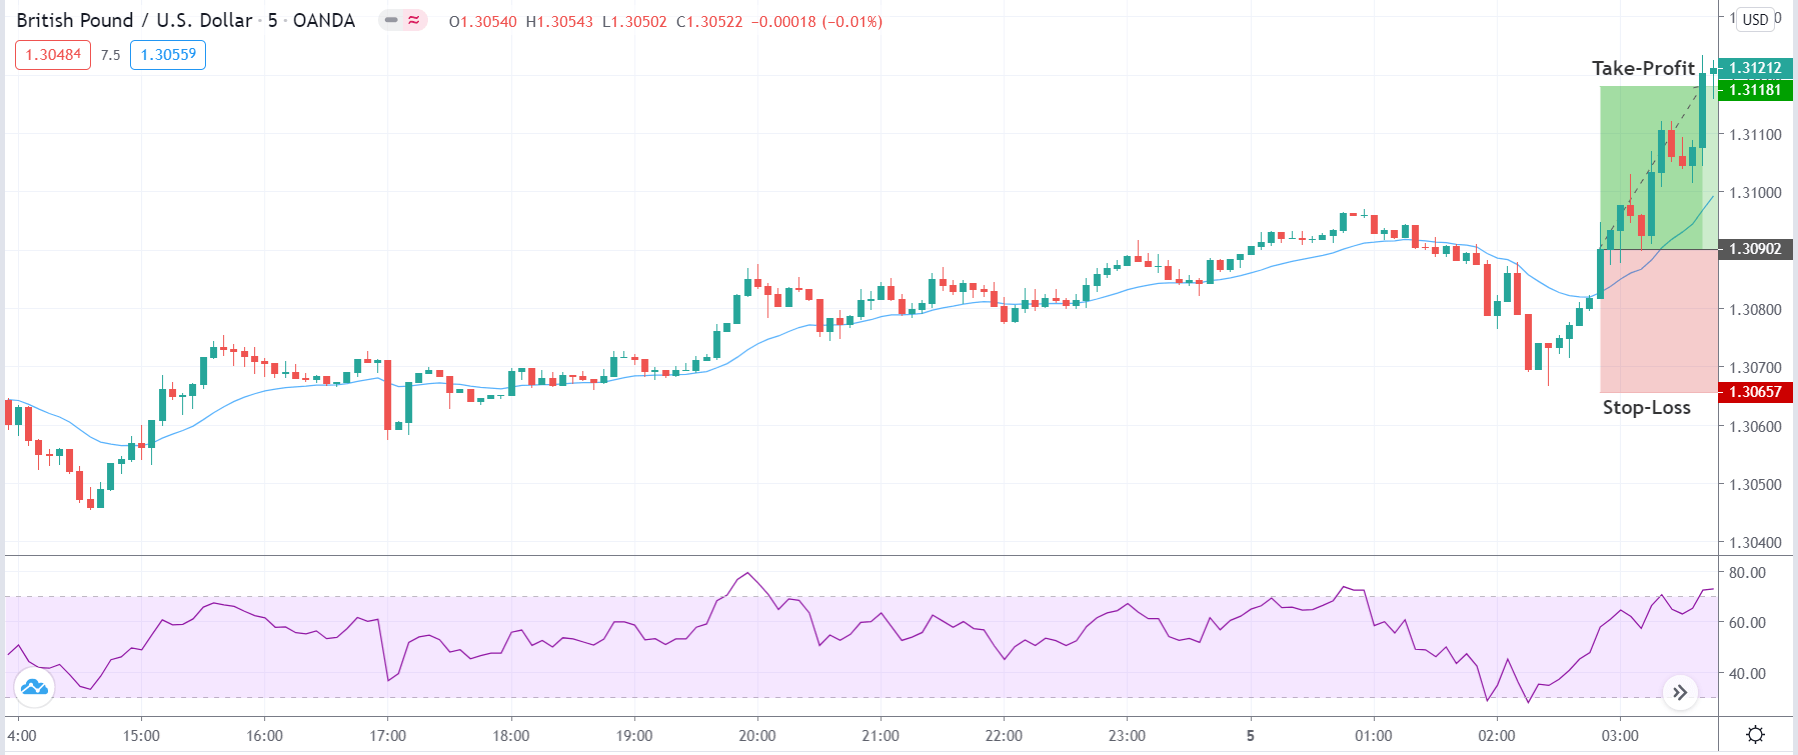
Keep in mind that trading success arises from careful analysis of entry and exit positions. Upfront, it may seem cumbersome – taking time to do the due diligence in the analysis. Utmost, do not trade with emotions. Renko charts and many other tools will help you sharpen your analysis.

The preciseness and effectiveness of a strategy arise from long spells of practical use. Renko is a super-tool for scalping when you compare it to classical price charting or bar or candlesticks.

Other handy trade signal tools to combine with Renko Charts

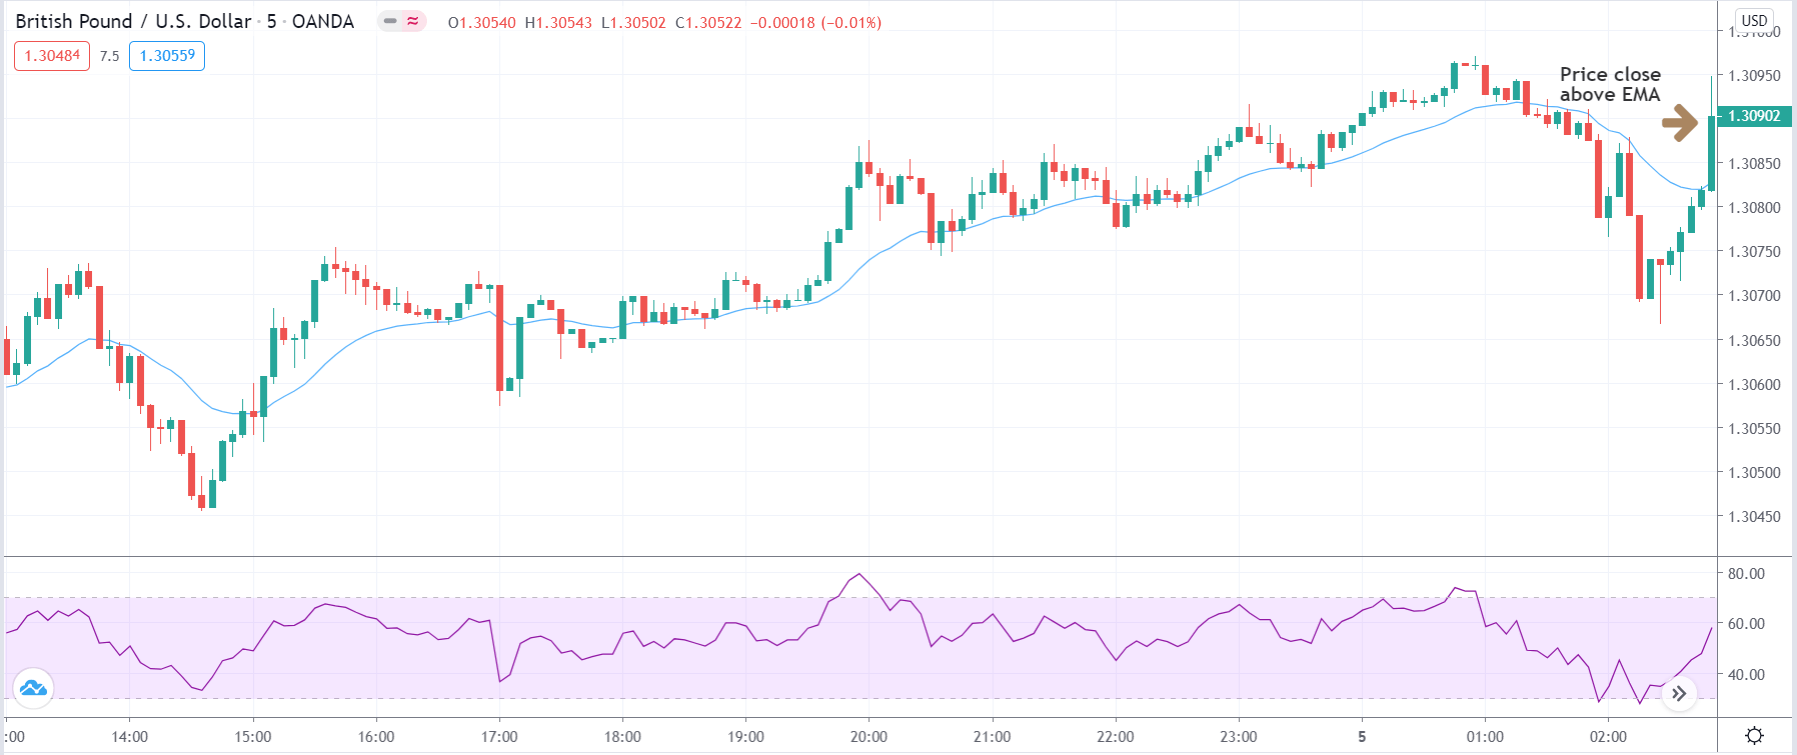
  • Simple Moving Averages -SME Enter trades with three bars in the direction of the trend and 10 SME sloping downwards or upwards. (This will help you avoid false breaks in a reversal against the trend)
  • On Balance Volume –OBV Enter trades when you confirm the trend and SME as tally that with OBV indicator’s direction.

Parting Shot

Renko charting brings in more preciseness for your trend confirmation in line with price action and the trend. It helps you filter out the noise with volume and time and leaves you with price direction only. For successful scalping, incorporating Renko is a better way to go about it. Renko charts help you keep the focus on the trend for position trades and note it’s the reversal in good time to exit.

Categories
Forex Basic Strategies

The Most Reliable 5-Minute Forex Scalping Strategy

Introduction

Scalping is a type of trading that involves placing many trades in a single day to profit from minor price changes in the Forex market. Traders who use this strategy are known as scalpers. It is crucial to have a robust exit strategy for scalpers to earn large gains from small market moves.

Scalping strategies are mostly applied to the intraday markets, and the trade holding duration can vary from a few seconds to minutes. For novice Forex traders, this type of trading is not recommended as scalping involves a fast-paced activity that requires precision in timing and execution.

We must always use a smaller timeframe such as a 5-min or 1-min for scalping the Forex market. We can use various reliable indicators for scalping, but in this article, we’ll learn how to scalp the 5-minute timeframe using Bollinger Bands.

Why Bollinger Bands?

Bollinger Bands is a technical analysis tool that was developed by John Bollinger. This indicator is composed of three lines as follows – A Simple Moving Average, which is the Middle band, the Upper Band & the Lower Band. The usage of Bollinger Bands indicator goes like this – the closer the price action moves to the upper band, the more overbought the market. Likewise, the closer the price moves to the lower band, the more oversold the market. The bands in this indicator widen and contract based on the market volatility. They expand when the market activity is increased and contract in choppy or less volatile markets. Let’s use this indicator in the 5-min timeframe to identify potential trading opportunities.

Scalp Trading With Bollinger Bands

We must go long when the price hits the lower band and look out for short-selling opportunities when prices hit the upper band. This is the traditional way of trading the market using Bollinger bands which is still being used by scalp traders across the world. The reason why this strategy is famous is because of its ease of usage and its ability to milk quick buck from the market.

Scalping Ranges – Example 1

In the below price chart, you can see that we have taken five buying and four selling trades in the EUR/NZD Forex pair. In this example, we have applied this strategy in a ranging market. When the price approached the support line, and when it also hit the upper Bollinger band, it is an indication for us to go long. Similarly, when the price goes near the resistance line in a range, it is an indication for us to close our long positions and look for selling opportunities.

By doing this, we have been continuously engaged in the market and made some consistent profits overall.

Example 2

Below is another example of scalp trading the Forex market when it is in the consolidation phase. Typically in a range, both the parties have equal strength. Also, it is a known fact that it is comparatively hard to trade the consolidation markets than the ranging markets. However, using this strategy, we have managed to take five buying and three selling trades in the GBPJPY Forex pair.

Scalpers typically go long or short when the price approaches the upper or lower range lines. This is the right approach, but by pairing that strategy with an indicator like Bollinger band can drastically increase the probability of those trades. The USP of the Bollinger band indicator is that it works well in all the types of market situations. It really doesn’t matter whether you scalp the ranges, channels, or even trends; this strategy will always provide reliable trading opportunities.

Example 3

In the below price chart, the price was dragging towards the upside, indicating a buying momentum, but it ended up forming a channel. In a channel, both parties hold equal power and us being scalpers; it is easy to make money from both sides. Below we can notice that if we go either long or short, we can make an equal amount of money if we are right. This is the major benefit of using Bollinger bands in channel conditions.

Scalping Trends – Example 1

Below is the price chart of the AUD/JPY currency pair in an uptrend. As you can see, during the pullback phase, the market gave us the first buy trade. When the price action approached the upper Bollinger band, the price immediately moved in the opposite direction. As a scalper, prepare your mind for these kinds of quick moves. Follow the rules of the strategy to the point, and if any trade goes three to four pips against you, immediately exit and wait for the next opportunity.

Our third buy trade also performed, but it didn’t go for bigger targets. Instead, the price action immediately reversed, which end up generating a sell signal. The next buy trade was also ended u with minor profits. For scalpers, even a profit of 8 to 10 pips can be considered good in a single trade.

Example 2

Below is an example of buying and selling trades in an uptrend in the AUD/JPY pair. We are saying this pair is an uptrend after analyzing its higher time frame. In the lower timeframe, the market may seem to be ranging, but since we know that this pair is up-trending overall, we must consider buying opportunities over sell signals.

The markets gave us five buying and three selling trades in this pair. Even though we have identifies many sell signals, we recommend not to enter those unless you have confirmation. Always remember that trend is your friend and trade according to the trend. This is the essence of scalp trading the trending markets. Therefore, when scalping trends, always go for bigger targets by following the trend. Also, expect less accuracy on counter-trend trades.

Conclusion

It requires a lot of practice to master scalping. Since the time frame is small, you must be quick in everything you do while scalping. Also, talking additional confirmations is not possible in this form of trading because of its swift nature. Please practice these strategies on a demo account before you apply them on the live markets. All the best. Cheers!

Categories
Forex Ichimoku strategies

Ichimoku Kinko Hyo Strategy for a Takeaway

Ichimoku is a popular indicator made by Japanese experts decades ago, yet, as with other products made in Japan, it is still usable today. It is a composite indicator with several elements that are made to ensure high probability signals. However, some prop traders analyzed each element separately to determine if their roles are performing well. This article will explain the elements, describe the default way of using it, and present two beginner-friendly strategies useable right away. Ichimoku can be used in many different ways, it is far more complex than Moving Averages opening the doors for many interpretations and strategies.

Indicator Theories

There are many theories about the indicator, going very deep in its meaning even creating exclusive fan trader groups. To beginners, this might be overwhelming and unnecessary to know. The opinions presented here about the indicator and its elements are just for reference, your trading and decisions should be your own. A lot of research was done by traders about Ichimoku summarized in this article, giving you a good starting point in understanding the trend following strategies. 

If you are a beginner, then definitely you do not need to concern yourself with the mathematical background of each element, what they account in measurements, history, MA names translations, and so on. Practical application is what matters in the end, your end balance, and other, theoretical information is not going to add value at this point. Therefore, we will focus on what you do to use Ichimoku effectively in two ways. 

Indicator Elements

This indicator has five different parts. They can be grouped by their action. Moving Average crossovers is the dominant category. Two Moving Averages, Tenkan-San and Kijun-Sen are fast and slow MAs that generate the main trend confirmation signal. These do not move smoothly as classic MAs, they have their calculations causing this, but this is not a con. A second category also has two elements that make the Ichimoku Cloud – Senkou Span A and B. The cloud is a filter. It represents an area of lower quality signals generated by the fast and slow MA crossovers, therefore you should not trade.

If the price is above or below the cloud, you are safe to take the MA crossover signals. Some traders complicate the role of could elements, paying attention to the width, slope, and so on, but this is unnecessary. The last piece is the Chikou Span. This element does not have an obvious, clear role. Some traders use it while others just do not see where it fits. When you test an indicator or experiment, you try to give some meaning to it in conjunction with the price action, taking various patterns as a signal in some way. Imagination can take you to see a pattern but testing will prove if that idea is consistent and worthy. However, the factor Chinkou Span represents can be worthy or not to you. 

Kumo Cloud

Let’s start with the Kumo Cloud part. Ichimoku is already integrated into the MT4/5 platform by default, no need to install it from other sources. The image below is showing only the Ichimoku cloud without the other elements on the tradingview.com platform. Note that the USD (USD index) is inside the cloud after a rally in a long downtrend, each candle is one day. This moment is not good for trading the USD in any currency pair since the price is in the cloud. So Ichimoku has a filter, a rare element in an indicator. For beginner traders, this is very important. When we first start trading forex, we take all the signals we can from an indicator, even though we know not all are going to be good. We also do not know which one is fake and we do not have any money management plan. Ichimoku is showing you how to discipline yourself and wait for high probability trades, a very important lesson when creating your first system and a trading plan. 

There are other ways to use the cloud but for now, we will stick with its filtering role. The cloud color change and switches are some other signals that are also going to be analyzed in another article about this indicator. Now, the Kumo Cloud has another function, not only does it tell you to stop trading that pair or asset, but it also tells you to trade only in one direction if the price is not inside it. Therefore, you enter only short trade signals if the price is below the cloud and only long if above. Now, because of these rules, a lot of your trades are not going to be eligible. Suddenly, trading you used to know as fun is becoming boring. It is now a waiting game. If you are a trader looking for fun, excitement, forex will not give you that for free. If making money is exciting to you, this waiting game for high probability trades sounds great, but do not get emotional when losing streaks come. When you get a bit more experienced, you can try to trade signals inside the cloud at half the risk you normally would. The trading system can get more advanced as you build it to the point even these trade entries end up good enough. 

Trade Entries

Talking about the trade entries, Ichimoku has an interesting MAs crossover solution but also price combo signals. In the picture below we have the same chart but with the Tenkan-San and Kijun-Sen present. We have added arrows for entry signals and exit markers when the MAs crossed back again. As you can see, we have only traded short trades once the price broke out the Kumo Cloud down, ignoring all long signals – when the faster blue MA crossed the slower orange MA up. All signals gave us successful trades if we are to short the USD with the best-performing currencies in this period.

Even though we are using the USD Index, you can apply any asset here. Ichimoku settings are by default. Train your discipline by following the signals to the letter including the rules of the cloud. Add on money management, where you put your Stop Loss and Take Profit, and how big are your positions. After this practice, your understanding of trends and trading will sip into your mindset. Now, every system you come up with will have these values in the core, your ascension to a professional level is now not in question. 

Put this Ichimoku trading strategy to all 28 currency pairs having the major 8, test all signals on a demo account, see if it works. If you keep it on a daily timeframe, the signals will be more consistent but you will have to trade for a longer time.

Money Management

Money management is one of the top priorities in trading, above technical systems like Ichimoku. If you are struggling to create one, this indicator can also help you with that. For simplicity’s sake, you can always set your risk per trade to 1% of the account balance. Stop Loss placement can be put on the slower Ichimoku MA at the moment of the trade entry. When you are winning, if you wait for the faster MA to cross the other the exit might not be optimal. A better position can be when the price crosses the faster MA. This can also be your Take Profit in a form of a trailing stop. In the picture below we see Ichimoku in action on a daily EUR/USD chart.

Added arrows mark the moment when the price broke out of the cloud and when the MAs had a long signal. This trend lasted for about 10 days until the price closed below the fast blue Ichimoku MA. We have marked this moment with a cross, here you exit a position. If you were to exit when the MAs cross again you would take considerable drawdown risk, even though the position would have been a bit better on both long trades. The second long trade is a continuation. MAs crossed again and we have a green light to enter. This trend was even better. Ichimoku is not only an effective tool but also a great teacher of trading. As a bonus, it spurs ideas on how you interpret patterns into signals. You are probably thinking about using the slower MA as the exit moment instead of the faster, or look for a signal when the MAs broke out of the cloud. All of these are legitimate options. At the end of the day, you need to test them all. Still, have in mind improving technical analysis is not your priority, money management rules and psychology is. 

Chikou Span

The final element of the Ichimoku and the most mysterious is the Chikou Span. The line lags 26 periods, it is not drawn at the current period, it is shifted. It represents the exact price action except it is shifted back 26 periods, it is not a Moving Average. Chikou Span’s classic use is as a filter. When the line is in the cloud, 26 periods before, you do not enter a trade if there is a signal currently. 

In the picture below we have Gold on a daily with a complete Ichimoku indicator on default settings. The usual MA cross gives us a signal to short the Gold, the price went out of the cloud and the Chikou Span line colored black is also out of the cloud. We have everything set up to short here, the entry moment is marked with an arrow, and the Chikou Span is checked. 

Chikou Span can also sometimes be above the cloud when you have a short signal. This is also a case when signals are filtered. Sometimes this filter can cause you to miss good trends and sometimes it keeps you out of fake signals. Some traders do not see it as an effective tool while others rely on it every time. Again, what every trader needs to do is test it out. Not only every trader is different and has different systems, but also they trade different assets, some of which Chikou Span is a very useful filter. This element can be interpreted in your own way, you do not have to blindly follow classic views. 

A Final Word

Ichimoku is fantastic for beginners. It has money management levels, filters, effective confirmation elements, and trains discipline. Furthermore, the ideas that it can spur create motivation to dive deep into forex trading. Just take caution not to get overexcited, when you meet a losing streak your morale can take a hit to avert you from trading completely. Since Ichimoku is already integrated into the MT4, there is no effort barrier to start trading the right way.

Do not think if you trade Ichimoku only will get you to the professional level. You will have results, but beginners need to understand that having a break-even result at the end of the year is a success. Most traders are bust because of bad money management (if any) and no discipline, while Ichimoku traders have learned how to stay above. The rules you set before testing are permanent. Think about how do you want to use the elements of this indicator, if the Chikou Span is good enough, where are your Take Profit and Stop Loss levels, how much to risk, how will you measure volume or volatility since Ichimoku does not cover this category, and so on.

Set everything up and then start executing without deviations. After testing is done, analyze your trades, try to cut the losers first with some measure or a tool, and then try to catch more winners with other methods. This indicator has so many traders and there are so many methods to use it. Some professional traders just use one or two elements and add other tools that improve on it, creating a unique system. The second Ichimoku article will present other aspects of this indicator you can also take and apply to your trading right away. 

Categories
Forex Basic Strategies

Ever Heard Of The Andrew’s Pitchfork Forex Trading Strategy?

Introduction

Pitchfork is a technical indicator developed by Alan Andrews. This indicator consists of three parallel lines- These three lines help us identify the possible support and resistance levels. They also do help us in recognizing potential breakout and breakdown levels. With this, we can identify possible trading opportunities in the Forex market. Long term investors use this indicator to identify and gauge the overall cycles that affect the activity of the underlying currency pair.

Three lines of Andrew’s pitchfork tool are as follows. The first one is the median trend line in the center, and the two equidistant trend lines on each side. Moving from left to right of the chart, these lines are drawn by selecting the three points, which are usually a reaction of highs and lows. As long as price action holds inside the Andrew pitchfork tool, it indicates that the trend is in place. Reversals occur when the price breaks the pitchfork.

Andrew’s pitchfork indicator can be used on all the timeframes, and it works on every single chart. Note that this indicator works very well on all types of securities, such as stocks, cryptocurrencies, futures, or the Forex market.

Picking The Three Points

The first step to know before using Andrew’s pitchfork tool is to select the three points for drawing the trend lines. The first point that we chose must be either a high or low that occurs on the price chart. Once that point is chosen, we must identify the trough and peak to the right and left sides of this point. This must be a pullback, which is opposite in the direction of the ongoing trend. Once these points have been isolated, the indicator is placed on the price chart. The two prongs formed by the peak and trough serves as a support and resistance of the trend as shown below.

Trading Strategies Using The Andrew Pitchfork Tool

Mini Median Method

This one is the most basic and popular strategy used by the traders to trade the market using the Pitchfork indicator. We must place the Andrew Pitchfork tool in a strong ongoing trend and look for the buy/sell opportunities.

In the below image, we marked a few trading opportunities presented by this indicator.  We can see that when the price hits the lower line of the tool, we went long. Likewise, we have activated sell trades when the price action hits the median line. This strategy is basic, but it provides a good risk to reward ratio trades in a strong trending market.

In case of a buy entry, exit your position when the price hits the median line. Conversely, take sell when price reverses at the median line, and we can book our profit at the lower line. Place the stop loss a few pips above your entry and ride the move.

This approach works best for aggressive traders who prefer to pull the trigger when prices reach any significant level. So, if you are an aggressive trader, you can go with this approach. But if you are a conservative/confirmation trader, follow the next strategy.

For Conservative Traders

Most conservative traders do not prefer taking many trades in a single day because they tend to seek extra confirmation before pulling the trigger. This Pitchfork strategy is for them.

When the price action approaches the lower line of the indicator, wait for the price action to hold there to take entry. The holding confirms that the price action respects the dynamic support line, and going long from here will be a good idea.

As you can see in the below price-chart, the USDJPY was in a strong uptrend. We have identified three opportunities to go long, but out of three, only two trades were held at the lower support line to confirm the entry. Both of our trades worked very well, and they went on to make a brand-new higher high.

By using this approach, we can safely trade the market. We must always go for smaller stops because the holding at any significant area confirms the power of buyers.

Breakout Trading

Breakout trading is a popular way to trade the markets. Most of the highly successful traders, market technicians, chartists, banks, hedge fund managers use this approach to trade the Forex market. In this strategy, let’s understand trading the breakouts successfully by using the Andrew Pitchfork tool.

The idea is to find a strong trending market first and wait for the price to pullback. When the price gives enough pullback, place the Andrew pitchfork tool on price action and wait for the breakout in the ongoing trend direction. When the breakout happens, take the trade in the direction of the ongoing trend.

As you can see in the below image, the USDJPY was in an uptrend, giving quite deeper pullbacks. When we got enough pullback, we applied the tool on the price action, and when the breakout happened, we went long. Look for the breakouts only in the direction of the ongoing trend.

The chart below represents our buy entry and risk management in this pair. We went long when the breakout happened, and the stop-loss order was placed just below the breakout line.

There are several ways to book our profits. We can use indicators like RSI and Stochastic to confirm our exits. Here we have used the pitchfork itself to book our profit in the above-discussed trade. When we activate a trade at the breakout, the first thing we must do is to apply the Andrew Pitchfork tool in the direction of our trade and wait for the price action to break the tool to book the profits.

In the below image, we applied the tool when our trade took off, and at around 109.60, the price strongly broke the Andrew pitchfork tool. This is an indication for us to close our whole buying position. Also, you can notice that after our exit, the price action blasted to the south.

Conclusion

Just like other trading tools, Andrew pitchfork is not perfect. We need to have strong knowledge of the money management techniques in place before using this tool on live markets. If you are a novice trader, it is advisable to gain experience by experimenting with this tool on the demo account. Using this tool first hand, we are sure that you will discover various ways of using this tool. This will enhance your ability to understand the market better. Cheers!

Categories
Forex Basic Strategies

Successfully Scalp Forex Pairs with these Two Tools

Introduction

Scalping is a short term trading style, and it is quite popular among professional Forex traders. This type of trading is more concise than day trading, which involves traders placing buy/sell orders throughout the trading day. But Scalping is different. Scalpers believe that making money from the small price action moves is easier than waiting for the considerable moves.

For scalping, our focus should be mostly on technical analysis rather than fundamentals.  By using technical analysis, traders use historical price information to predict the future price movement. To be successful in scalping, traders must have live feeds, direct access to the broker, and have the stamina & patience to sit in front of the computer and place as many trades as possible in smaller time frames to make money.

Scalping typically requires smaller timeframes such as a 5-minute, 15-minute, or even 1-minute charts. Some traders also use the tick chart or 30-seconds chart to scalp the Forex market. However, it requires an advanced skill set to be successful at this because the lower the timeframe is, the faster it moves. In this article, Let’s learn how to scalp the 1-minute Forex charts using Pin bars and Trend lines.

Pin Bars

Pin Bar is a candlestick pattern that consists of only one candle, which represents a sharp reversal. There are two types of Pin Bar.

  1. The Bullish Pin Bar’s closing price is higher than the candle’s opening price, and the candle’s wick must be two to three times longer than the real body.
  2. The Bearish Pin Bar’s closing price is lower than the candle’s opening price, and the tail of the candle must be two to three times longer than the real body.

Trend Lines

Trend lines act as an essential tool for analysts while performing technical analysis. These lines are a visual representation of support and resistance levels in any trading timeframe. Traders apply these trend lines on the price charts to get a clear picture of the ongoing trend to make an accurate trading decision. Also, the trend lines on the highs and lows of the price chart create a channel.

Trading Strategy – Pin Bars + Trendlines

The one-minute trading timeframe volatiles a lot, and this small timeframe never moves in a single trend. We will always see the transitions from buy trend to sell and sell trend to buy in less than a couple of minutes. This is the essence of trading the lower timeframes. Therefore, before trading the one-minute timeframe, it is advisable to let go of all of your rigid trading beliefs.

Most of the scalpers fall into their ego and deny to close their losing positions. If you fall into this trap, then scalping is not for you. You must have a strong mindset and follow the rules like world-class traders to scalp the Forex market successfully.

Buy Examples

As you can see in the below image of the GBP/CHF Forex pair, the price was in an uptrend. Whenever the price approached the trend line, buyers immediately came back and printed a Pin bar candle, which is an indication to go long.

In this example, the market gives us three buying opportunities, and all the three trades performed well. When you take an entry at the pin bar formation, and the very next candle goes against you and closes below the pin bar, it is an indication for you to close your positions and wait for the next signal. On a one-minute time frame, always go for 2-3 pip stop loss and 6-7 pip targets only.

Below is another buying example in the GBP/AUD Forex pair. Here, the market gave us only one trading opportunity. As the price chart implies, the buyers were in complete control, and the price action is moving calmly. This means that there is a very less chance of spikes or fake outs. It is always advisable to find the less volatile currencies and try not to scalp the opening hours of the market.

Sell Examples

In the below USD/CHF 1-minute Forex chart, the overall trend was down. We can see the price printing the pin bars twice in a downtrend, which indicates us to go short. There are various ways to close your positions. We can choose any significant support/resistance area to book profit or close our positions when the price action starts to lose its momentum.

Some scalpers prefer to ride longer moves based on the market circumstances, while some like to close their positions after making 5 to 6 pips. So exiting completely depends on your trading style.

Below is another selling example of this strategy in the USD/CHF Forex pair. When price approached the trend line in a downtrend, we can see the market printing Pin Bars. This shows that the price action is ready to print brand new lower lows. Activate your trade when the market gives both the signals. In healthy market conditions, expect brand new lower lows or higher highs, and please avoid trading choppy market conditions.

Conclusion

Scalping proved to be a great way to make profits in a very short time. Make sure to understand that it requires a lot of hard work, patience, and dedication to master trading the lower timeframes. The more the trades you get into, the more the amount of money you will make. Scalping can be very difficult in the beginning, but with some practice and a right strategy, you will get the hang of it.

It is hard to scalp the 1-minute chart by using price action alone. Most of the highly successful scalpers use some indicators and candlestick patterns to confirm the market trend. Using the pin bars and trend lines on the 1-minute chart will help you filter out the bad trading signals, and this will drastically enhance the odds of your trades. Cheers!

Categories
Forex Basic Strategies

Top 3 Terrific Ways To Trade Price Channels Like A Pro

Introduction

A price channel is a state of the market that slopes up or down bounded by a trendline above and below the asset’s price. The upper trend line acts as a resistance to the price, while the lower trend line acts as support. The price channel helps traders maintain the focus on the price alone, unlike the other trading tools, which are plotted directly over the price chart. In an uptrend, as long as the price advances and moves within the channel, the underlying asset trend is considered bullish. The break below the channel line is a sign of the trend being reversed. Two main components of the price channel are the Main Trend Line & the Channel Line.

Main Trend Line – It takes a minimum of two to three points on the price chart to draw the trend line. The line sets the tone for the price slop as well as the trend. To draw a bearish trend line, we need at least three reaction points at the highs. To draw a bullish trend line, we also need two to three reaction lows on the price chart.

Channel Line – After drawing the main trend line, we draw the channel line parallel to the main trend line. For drawing the channel line, we also need two to three reaction highs and reaction lows in accordance with the trend. This channel line also acts as a support in an uptrend and resistance in a downtrend.

Trading Strategies To Trade The Price Channel

Trends + Channel

Channels are perfect to trade the pullback markets. It is advisable to look for the price channel that is sloping at a healthy angle. Don’t try to trade the steep or flat channels as they won’t provide good trading opportunities.

Firstly find a trending market and mark at least two reactions of highs and lows. For taking buy entries, wait for the price to touch the channel line and for selling trades, wait for the prices to touch the main trend line. Remember not to trade both buy and sell opportunities in an up-trending market. This approach is used by amateur traders who fail most of the time as we are going against the flow.

The price chart below indicates the price channel on the AUD/NZD forex pair.

The price gave the first selling opportunity on the 16th of May and the second trade was around 19th May. These trades printed a brand new lower low, and we closed our trades when the prices broke the channel.

Reversals + Channels 

In this strategy, we need two timeframes to find accurate trading opportunities. Look for an uptrend on the higher timeframe and then see the same chart on a lower timeframe. On the lower timeframe, let the price to pull back enough. When the prices gave enough pullback, draw the price channel on that pullback. If the prices break below the channel line (in an uptrend) and get knocked back immediately, it is a sign for us to go long. When this happens, we can expect a brand new higher high.

As you can see in the image below, the pair was in an overall downtrend. During the pullback phase, price action tries to break the price channel but get knocked back immediately. It means that some buyers are trying to take the price higher, but the aggressive sellers are grabbing the opportunity to fill a few more orders. After the fake-out, prices held inside the price channel for a bit, and after a few hours, we witnessed a brand new lower low.

Breakouts + Channel

Breakout trading is the most common yet effective approach to take high probability trades. Firstly, find an up-trending market and draw a price channel. Wait for the price to approach any significant level and break below the price channel to take the trade. When the price action goes below the channel line, it is a sign for us to go short. Similarly, in a downtrend, draw the price channel and let the price approach any significant level to take the breakout trade. After the breakout, go long and place the stops just below your entry. If the price holds after the breakout, it is a great sign to take the trade.

The image below represents a sell trade in the GBP/AUD Forex pair. As you can see, the prices were in an uptrend, and when the sellers broke below the price channel, we took a sell trade. We choose a smaller stop-loss order as the channel line also acts as dynamic support to the prices. For booking profits, a higher timeframe support area was a perfect place.

Conclusion

Trading Channels are effective as they provide numerous trading opportunities when the market is moving in that state. You can use all the mentioned ways stated above to trade a channel or use the method that best works for you. When trading, the channel always trade with the trend. Do not over trade whatsoever. If you get used to it, sooner or later, you will blow your trading account. Don’t do this. Instead, always follow the trend. The trend is your friend. Let the market pullback to the channel line to trade with the trend. Another approach is to wait for the prices to break the channel to trade the reversals. These simple approaches are healthier ways to grow your trading account while trading channels. All the best!

Categories
Forex Basic Strategies

Combining The ‘Rail Road’ Trading Pattern With Pivot Points To Generate Accurate Trading Signals

Introduction

In the previous set of articles, we discussed strategies based on most of the technical indicators in forex. But there is one technical indicator that was not covered extensively and, i.e., the ‘Pivot Points’ indicator. Traders do not use it extensively because they don’t know the right way of using it and are not aware of their strength.

Today, we solve this problem by discussing a mostly based strategy on the Pivot Points indicator. By now, we all know that a technical indicator should never be in isolation. Therefore, the ‘Pivot Points’ indicator is combined with some very powerful chart patterns and key technical levels to improve the probability of successful trades.

‘Pivot Points’ are nothing but potential support and resistance levels that will help us determine the same, even it is established. The pivot point’s parameters are usually taken from the previous day’s trading range to calculate today’s pivot points. The simplest way of plotting the pivot point indicator on the chart is by selecting the indicator from the broker’s charting software.

The main pivot point (PP) is the central pivot based on which all other pivot levels are calculated. Calculating the central pivot point is pretty simple. We just have to add yesterday’s high, low, and close and then divide that by 3, a simple average of the high, low, and close. We don’t have to worry about the calculations as the software does all that for us and gives it readymade.

The only thing we have to remember is that if the price is trading above the central pivot point, it signals a bullish trend. If the price is below the central line, it is considered a bearish trend.

Time Frame

The strategy works well on small time frames such as 15 minutes, 3 minutes, and 1 minute. It would not be wrong to classify the above strategy as a ‘Scalping Strategy.’

Indicators

We use just one technical indicator for the strategy and, i.e., ‘Pivot Points.’ We could also use the Simple Moving Average (SMA) to get a clear idea about the market trend.

Currency Pairs

The strategy is only applicable to major currency pairs of the forex market. EUR/USD, USD/JPY, GBP/USD, GBP/JPY, AUD/USD, EUR/GBP, and NZD/USD are preferred currency pairs.

Strategy Concept

The ‘Pivot Point’ strategy is based on the concept that when price respects any of the support and resistance levels of the ‘Pivot Point’ indicator, they tend to become ‘true’ S/R levels that can be relied upon. When price re-tests these ‘true’ support and resistance levels, it moves in the direction as anticipated. The above logic works greatly in favor of traders and thus increases the probability of making a profit. However, there are some rules we need to follow to execute the above strategy successfully. Let’s discuss these rules in detail.

Trade Setup

To explain the strategy, we will be executing a ‘long’ trade in EUR/USD currency pair using the strategy’s rules. Here are the steps to execute the strategy.

Step 1: Firstly, we have to plot the pivot point indicator on the chart with its default settings. As this is mostly an intraday strategy, we start each day as fresh using the partitions made by the pivot point indicator. The below image exactly shows how the beginning of a new day would look like on the pivot points.

Step 2: Next, we need to wait for the price to touch any support and resistance levels as plotted on the chart by the pivot point indicator. Not all touches are going to be important to us. Only the price touches that cause major price movement in the market will be considered as significant. For instance, if the price touches R1, R2, R3, R4, or R5 and goes down to the central line (PP), this shall be considered ‘true’ resistance. Likewise, if the price touches S1, S2, S3, S4, and S5 and goes back up to the central line, this shall be considered ‘true’ support.

The below image shows how price touches S1 and travels close to the central line. Hence, this can be considered as ‘true’ support. The further price travels, the stronger is going to be the ‘support.’

Step 3: After establishing ‘true’ support and resistance levels, we wait for the price to return to this level and show a suitable price action pattern before we can actually enter into a trade. Once the price touches established ‘support’ or ‘resistance,’ we need to watch for the formation of the ‘Rail-Road Track’ candlestick pattern on the chart. The ‘Rail-Road Track’ is essential because it confirms the respective level. We still don’t enter for a trade. The next step explains the rule of ‘entry.’

Step 4: To be sure that the support or resistance is holding, we enter only after the price starts moving in the direction we expect to move. For example, in the case of ‘true’ support, we enter ‘long’ when the price moves a further higher from the ‘support.’ Similarly, in the case of ‘true’ resistance, we enter ‘short’ when the price moves further lower from the ‘resistance.’

Step 5: In this step, we define the take-profit and stop-loss levels for the trade. The stop-loss is placed below the ‘support’ from where the price had bounced off, in case of a ‘long’ position. On the other hand, it is placed above the ‘resistance’ from where the price had collapsed. The ‘take-profit’ is set at the opposing ‘support’ and ‘resistance’ level as indicated by the pivot point indicator.

Strategy Roundup

The pivot point strategy is like a complementary tool to the traditional S/R strategy that can be used to improve the results. Since we are dealing with really small time frames, the probability of ‘successful trades’ can be ‘low.’ However, that shouldn’t be a concern for us as the risk to reward (RR) of trades executed using the above strategy is above average. This will ultimately put us in a profitable position.

Categories
Forex Basic Strategies

The Best Tools to Trade Pullbacks Effectively

A Pullback is a pause, retracement, or consolidation of a price from the most recent peak during an ongoing trend. The pullback is widely seen as a trading opportunity after the underlying asset experienced a large upside or downside move. For example – Any forex pair is in a strong uptrend, and some healthy news came, and price action dropped back to the most recent support area that indicates the professional traders are booking the profits.

Pullbacks happen all the time, and if you learn how to trade them successfully, it can be a great skill as a trader. Trading the pullback is the easiest way to trade the market, sometimes you will recognize the high probability pullback trades and sometimes extreme volatile pullbacks, and you can enhance your repertoire and find many higher probability trades. If you are new in the market, then pullback trading is a fantastic and easy way to find superior risk-to-reward ratio trades. In this article, we will explore five trading strategies that provide excellent pullback trades.

Pullback Trading Strategies

Two-Legged Pullback To The MA 

Al Brooks popularized the concept of two legs pullback in his price action books. He explained most of the time, price action print two legs to reach the moving average. We backtested his strategy and found out that his techniques work very well in the trending market, but sometimes in the strong trending market, you will only witness one leg.

This is because most market operators are in a hurry to move the market; this may be because of any fundamental news. To filter out all the low probability trades, it is advisable to find a trending market and then wait for the price action to print the two legs towards the moving average, and when all the moves complete, take the buy entry.

The image below represents the buying trade in the EURGBP forex pair. The moving average indicates the buying trend in the currency. Price action pulled back to the moving average, prices responded from the moving average and goes a bit higher and end up printing the second leg. The second leg goes down to the moving average, but the strong buyers smack back up and close above the moving average. Furthermore, the price slows down a bit, and we took buying entry with the stops below the entry, and for taking profit, we choose the brand new higher high.

Candlestick Pattern + MA

This method will use the bullish engulfing candlestick pattern with a moving average to successfully trade the market.

Here we need two ingredients.

  1. Price action pullback to the moving average.
  2. The market forms a bullish engulfing pattern.

First of all, look for the strong trending market and wait for price action to approach the moving average. At this stage, if the price action prints the engulfing pattern,  it’s the right time for you to go for a buy entry. Otherwise, no entries are allowed for you. An  Engulfing Pattern indicates the sellers try to print the brand new lower low, but because of dynamic support of moving average prices pulled back and buyers end up eating all the sellers. As a result, we witnessed the Bullish Engulfing pattern.

The image below represents the buying trade in the EURNZD forex pair. As you can see, at the end of the downtrend, price action goes above the moving average, and we witnessed the engulfing pattern. The trading pattern closed above the moving average, which was a confirmation of buyers came back to the show and were expecting the brand new higher high.

Trendlines + Channel Trading

This one is the simple trading approach, which is not much popular, but it often generates wonderful trading results. First of all, you must draw the trend line to the ongoing trend, and when the price action pulls back enough, then draw the price channel to identify the oversold and overbought area. When price action approaches the trend line as well as the lower line of the price channel, it is an indication to go long.

The image below represents the buying entry in the AUDCHF forex pair. The trend line was the indication that the buyers are leading the show. During the pullback phase, when enough sellers approach the trend line and the lower channel line, it gave the strong buying candle. The reason we got the strong candle is because for the support and resistance trader, the zone was a dynamic support area to go long.

RSI + Stochastic Indicator

In this approach, we are using the two oscillators to trade the pullbacks. Stochastic and RSI both are oscillators, and they both oscillate between the significant levels. In an uptrend, wait for the price action to pull back. When the stochastic and RSI gave the oversold signal, it is a perfect time to go for a brand new higher high.

The image below indicates the buying trade in the AUDCHF forex pair. The pair was overall in an uptrend, and during the pullback, both of the indicators were showing the oversold signals, and the reversal at the oversold area was a great sign to go long. When both oscillators indicate the same sign, there is no point in going for more significant stops. When both oscillators gave the reversal signal at the significant resistance level, that’s a perfect time to close your trade.

Conclusion

All the pullback strategies share the same goal, which is to time the market. The better you master the skill of timing before the take-off, the more profits you will make. If you are a newbie trader, then master these strategies first on the demo and then apply to the live market because trying any of these strategies in the live market is dangerous without having any experience.

So never try anything on the live account. Instead, practice them on demo first and then make a profit on a live account. When you master these strategies, then you can very easily design a pullback strategy for yourself. Whichever strategy fits nicely into your trading approach, master it.

Categories
Forex Basic Strategies Forex Daily Topic

Trading The Forex Market Like A Pro Using The Williams %R Indicator

Introduction

In the forex market, the Relative Strength Index (RSI) is the most sought after technical indicator for measuring overbought and oversold conditions in the market. However, there are times when RSI can give misleading signals. To overcome some of these limitations of RSI, we use William’s %R (Williams Percentage Range) to help us identify when an asset is oversold or overbought.

Having determined that the asset has moved too much in one direction, we can position ourselves on the other side of the market after suitable confirmation. In today’s article, let’s discuss a strategy based on William’s %R indicator to identify when the market has become overbought or oversold. Let us first get into the specifications of the strategy.

Time Frame

The strategy works well on higher time frames such as ‘Weekly’ and ‘Daily.’ Therefore, the strategy is suitable for swing and long-term traders.

Indicators

We use the following indicators in the strategy:

  • William’s %R
  • Simple Moving Average (standard setting)

Currency Pairs

The strategy applies to all currency pairs listed on the broker’s platform, including major, minor, and exotic pairs. This is one of the distinguishing features of the strategy.

Strategy Concept

The William’s %R indicator usually ranges between 0 to -100, where a reading of 0 to -20 tells us that the asset is overbought. On the other hand, if %R falls in the range of -80 and -100, the asset is said to be oversold. As with other technical indicators, %R generates accurate trading signals when used in conjunction with other analytical tools such as chart patterns and systems.

Just because an asset may appear overbought and oversold based on the %R, this doesn’t necessarily mean that the price will reverse. Hence, we include a few concepts of the chart pattern and price action to confirm that the reversal is real. The more we wait, the higher the confirmation. But this reduces the risk-to-reward (RR) ratio moderately. This depends more on the type of trader if he is more conservative or aggressive.

In the strategy, we firstly establish a trend that is mostly in the overbought or oversold situation. This means William’s %R should indicate an overbought situation of the market for a major part of the trend during an uptrend. On the other hand, in a downtrend, William’s %R should indicate an oversold market situation for a major part of the trend. When the trend remains in the overbought or oversold condition for most of the time, the reversal tends to be sharp in nature.

This is why the above condition is important for the strategy. Next, we wait for the ‘Bullish Engulfing’ pattern to appear on the price chart, in a reversal of a downtrend. Likewise, in a reversal of an uptrend, we wait for the ‘Bearish Engulfing’ pattern to appear on the chart. This is the first sign of reversal. The reversal is confirmed when the price starts moving above the moving average, in a downtrend, and below the moving average, in an uptrend.

Stop-loss for the trade will be placed below the ‘engulfing’ pattern in a ‘long’ position and above the ‘engulfing’ pattern in a ‘short’ position.

Trade Setup

In order to explain the strategy, we will be executing a ‘long’ trade in EUR/USD currency pair using the below-mentioned rules. Here are the steps to execute the strategy.

Step 1: The first step of the strategy is to identify the major trend of the trend. An easy to determine trend is if the price is below the simple moving average, the market is in a downtrend, and if the price is above the simple moving average, the market is in an uptrend. Here we need to make sure that William’s %R indicates an overbought/oversold market situation for the major part of the trend.

The below image shows an example of a downtrend that is oversold.

Step 2: The next step is to wait for the market to present the ‘Engulfing’ pattern on the chart. In a downtrend, the ‘Bullish Engulfing’ pattern indicates a reversal of the trend, while in an uptrend, the ‘Bearish Engulfing’ pattern indicates a reversal of the trend. If the second of the engulfing pattern closes above the MA in a reversal of the downtrend, the reversal will be more prominent. Similarly, if the second candle closes below the MA in a reversal of the uptrend, the reversal can be resilient.

Step 3: The rule of entering the trade is fairly simple. We enter ‘long’ when the price starts moving further above the moving average after the occurrence of an ‘engulfing’ pattern. Similarly, we enter ‘short’ when the price starts moving further below the moving average after the occurrence of the ‘engulfing’ pattern.

Step 4: Lastly, we need to determine the stop-loss and take-profit for the trade. In a ‘long’ position, stop-loss is placed below the ‘Bullish Engulfing’ pattern. In a ‘short’ position, it is placed above the ‘Bearish Engulfing’ pattern. The take-profit is set at a point where the resultant risk-to-reward (RR) ratio of the trade will be 1.5. However, partial profits can be taken at the opposing ‘support’ and ‘resistance’ levels that might be a hurdle for the price.

In our example, the risk-to-reward (RR) ratio of 1.5 was achieved after a period of one month since traded on the ‘Daily’ time frame.

Strategy Roundup

William’s %R is a very powerful indicator that helps us identify opportunities during a reversal phase of the market. It is important to note that %R should never be used in isolation. Combining the %R indicator with chart pattern, price action, and market trend gives us an edge in the market, which is difficult to get when applied individually. Trade executed using the above strategy can longer than expected to give desirable results since it is based on a higher time frame.

Categories
Forex Basic Strategies

Reliable ‘ADX’ Trading Strategy To Trade Forex Major Currency Pairs

Introduction 

We have talked a lot about trading strategies involving MACD, RSI, Volume and Stochastic. However, we haven’t covered much about the ADX indicator and its application. Today’s strategy is based on the ADX, which will help us in measuring the strength of a trend on any given time frame. The Average Directional Index (ADX) is a tool that is designed to measure the strength of a trend. When ADX is used in combination with other trading strategies, we get a complete understanding of the market trend and its efficacy.

Learning how to use the ADX is very easy. It ranges from a scale 0-100, 100 indicating a strong trend and 0 indicating a non-existent trend. If the ADX is close to 0, we can expect a sideways action in the market, meaning the market will neither go up or down but stay around the same value for some time. Remember, ADX will tell us about the strength of the trend. It does not guide us in the future direction of the market. For that reason, it is necessary to use concepts of market trend, retracement, and other technical indicators. ADX values of 50 and above are considered high, while ADX values of 20 and below are considered low. Weak trends are indicated by values of 20 and below.

Time Frame

The strategy works well on most time frames, including 15 minutes, 1 hour, 4 hours and Daily. However, we do not recommend applying the strategy on very low time frames due to market noise and liquidity issues.

Indicators

We use the Average Directional Index (ADX) and Simple Moving Average (SMA) indicators in the strategy.

Currency Pairs

The strategy is applicable on most currency pairs listed on the broker’s platform. However, it is advised to apply the strategy on major currency pairs only.

Strategy Concept

The ADX indicator ensures that we only trade when there is a strong trend in the market, regardless of the time frame. Here, even before looking at the candlesticks, we wait for the ADX indicator to show a reading above 60. A reading above 60 signals a strong trend and the likelihood of a trend continuation. We all know that the trend is our friend, but without gauging the strength of the trend, it can be dangerous to be a part of that trend. This is why we use the ADX indicator for trend trading.

The ADX is only limited to understanding the strength of the trend. However, in order to trade a ‘trend’, we also need to look at price action and trend continuation pattern in the market. Therefore, we use the concept of retracement and moving average to time our ‘entries.’ As this a trend trading strategy, we cannot use the rules for catching a reversal in the market.

We determine the take-profit and stop-loss levels based on ‘highs’ and ‘lows’ of the trend and retracement. Let us, straight dive, into the rules of the strategy.

Trade Setup

In order to explain the strategy, we will be executing a ‘long’ trade in USD/CAD currency pair using the rules of the strategy. Here are the steps to execute the strategy.

Step 1: Firstly, we have to plot the ADX and moving average indicators on the chart with their default setting. Before we actually look at the price action of the market, we have to watch the ADX indicator and its indication. Once the ADX crosses above 60, we look at the trend market and wait for an appropriate retracement.

Step 2: After gauging the strength of the trend using the ADX indicator, we need to wait for a suitable price retracement. The retracement, in other words, indicates a halt of the major trend of the market. In an uptrend, if price falls below the moving average and stays there, we say that the market has entered into retracement mode.

In a downtrend, if price rises above the moving average and stays there, we say that the market has entered into retracement mode. At this point, we are not sure if this is a retracement of the trend or is a start of the reversal. In order to confirm that it is a retracement, we again use the ADX indicator and check its reading. An ADX reading below 20 indicates that the ‘halt’ is actually a retracement of the major trend and not reversal.

Step 3: Now that we have got a confirmation from the ADX indicator that the market has gone into retracement mode, we should know how to enter the market. We go ‘long’ in the market when price crosses above the moving average and stays there for at least 4 or 5 candles. Similarly, we go ‘short’ in the market when price crosses below the moving average and stays there for at least 4 or 5 candles. As we just saw, the rule for entering a trade in this strategy is pretty simple and not complex at all.

Step 4: The last step of the strategy is to determine stop-loss and take-profit levels for the trade. We set take-profit near the ‘higher high’ of the uptrend while ‘long’ in the market and near the last ‘lower low’ of the downtrend while ‘short’ in the market. Stop-loss is placed below the previous ‘low’ of the retracement in an uptrend and above the ‘high’ of the retracement in a downtrend.

Strategy Roundup

The new ADX strategy gives very useful information which most of the times we never pay attention to. There are not many indicators which truly tell about the strength of the trend. ADX is one such indicator which tells if the trend is moving in strong fashion or not. At the same time, it is important to consider the strength of the pullback using price action and ADX indicator. Best profits come from catching strong trends, and this strategy helps us in accomplishing that.

Categories
Forex Basic Strategies Forex Daily Topic

Trade Ranges Like A Pro with this Effective Forex Trading Strategy

Introduction

The market does not move in random directions. It either trends or consolidates. As many would not know, the market is like a closed circle, and the same states keep repeating over and over again. Thus, in trading, one must learn how to become pro at reading these market states.

On that same note, we shall be going over an effective strategy when the market is in a consolidation/ranging state. However, before jumping right into the strategy, it is important to understand the basics and related concepts.

What is a consolidation phase in a market?

There are several ways to comprehend the consolidation phase of the market. There is logical reasoning behind the occurrence of this state, and is not simply a random pattern that shows up quite often.

The consolidation state is that phase of the market when the market moves in a sideways direction. This state is also referred to as a range. The reason for its occurrence is related to the strength between bulls and bears.

Comprehending a Range

There are two parties in the market – the bulls and the bears. Their strength is what describes the state of the market. In a trending market, either of the parties is powerful. For instance, if the market is going up, it simply means that the bulls control the market. In a consolidation state, both bulls and bears show equal strength. The bulls show strength by pushing the market higher, while the bears show power by taking the price right back down. As a result, the prices in both directions – which we refer to as a range.

How to draw a range?

To trade this range strategy, it is vital to understand how a range is drawn. A range is made up of two levels:

  • Support
  • Resistance

Thus, drawing the correct support and resistance levels will result in a perfect range.

Another point considered is the size of the range. The larger the range, the better. The other small consolidations in the market are ignored. Following is an example of how we pick an ideal range.

In the above example, both are ranges as the market is moving in a sideways direction. However, we do not consider range-1 as a range for our strategy. This is because a single line going up and down fails to depict the market’s price action.

Supply and Demand Range Strategy

What is the usual approach to trading a range? It is to buy at the support and sell at the resistance. But we’re going to step the game a little bit. The supply and demand range strategy uses the same principles of a typical range, in addition to other factors.

Step by step procedure to trade the Supply and Demand Range Strategy:

  1. Find a legitimate range in the market. Mark the Support and Resistance levels appropriately.
  2. Determine the direction of the market prior to the range.
  3. Find a potential supply/demand level.
  4. Get in when the market breaks through the range and reaches the supply/demand zone.

Buy Example

Consider the below chart of GBPCHF on the 4H timeframe. We see that the market has been ranging between 1.1902 and 1.1800. Observe that the support and resistance levels have been marked by cutting off the false market breakouts.

To trade this market, our job is not simply to hit the buy at the support and sell at the resistance. As mentioned, we take into account the preceding direction and the supply and demand levels around it.

The direction of the market prior to the range was an upside, indicating that the bulls were in control previously. A point to note is that, despite the market being in a range, it does not change the fact that the bulls are still powerful. Thus, we rather look for buying opportunities than shorting signals.

To do so, we wait for the price to drop below the bottom of the range and hold at any one of the demand zones. Once the market begins to reverse its direction from south to north around the demand zone, we can go long. The same scenario has been illustrated in the chart below.

Placements

Stop Loss – Well below the demand zone would be decent.

Take Profit – Top of the range would be an ideal spot to take profits.

Sell Example

Consider the chart of CAD/JPY on the 15min timeframe shown below. The recent market price action depicts that the market is moving sideways. The market’s overall trend is down, indicating that the bears are in control of the market.

Since the scenario is opposite to the previous example, we wait for the market to break through the resistance and reach any potential supply level. In the below example, we can see that the price broke through the resistance twice reacted off from the supply, as shown. Thus, we can look for entries when the market begins to switch direction to the downside.

Placements

Stop Loss – Above the supply zone

Take Profit – Bottom of the range

Conclusion

The only way to trade a range is not by buying and selling from the top and bottom of the range. It can be professionally traded with the application of other factors. And this range strategy particularly dealt with the strength of the bulls and bears and the concept of supply/demand.

We hope you were able to comprehend our Supply and Demand Range strategy. Do test them out for yourself and let us know your results in the comments below. Happy trading!

Categories
Forex Ichimoku strategies Forex Trading Strategies

Breakdown of the Ichimoku Strategy

Trading only with the Ichimoku will not get you to the top trading levels, but some parts of this indicator are worth analyzing as one of the best you can find according to certain professional technical traders. Taking elements from Ichimoku and applying it to your system is a good idea. Very often taking certain elements with a specific role from other systems and adapting them to your system advances trading to another level in terms of technical precision. However, these improvements are a priority only when you develop money management and a trader’s mindset.

Ichimoku allows a beginner to develop all of it. It has enough parts to cover the most important trading aspects and it is also a base for money management. Of course, developing a proper mindset takes time, and only if you have the discipline not to deviate from the plan. Ichimoku system or indicator will not get you far, at least not into the pro trading level, yet on the other hand, it presents a great path for learning. In our previous Ichimoku article, we have discussed the best ways to use it. Now we are going to see how good it is when each element is separately analyzed. Collectively we already know Ichimoku is a good indicator, but can it be better or can you use some parts of it that are just great on its own for something else?

The synergic effect all these elements create can be broken if you tamper with them, but does it mean a system is great only if its elements are great separately? According to technical prop traders, this holds true, players make the team, however, bad players are unlikely to make a great team however good they are when playing together. So let’s break down the Ichimoku, see how good the elements are. 

The Chinkou Span element is not used very often and is unique to the rules of the Ichimoku system. It is unusual in many ways since it is just a price level line shifted 26 periods back and yet it is used as a trade filter in conjunction with the Ichimoku cloud. Whatever your decision on using it is, Ichimoku trading will still be good enough provided you stick with the plans. According to professional traders, when you trade with it for a long time, you will want to move on and improve. A lot is missing with Ichimoku, forex areas you want to cover and implement into the system. Similarly to playing chess, when you start without any plan or strategy, anyone can beat you. When you follow a structure or a strategy, suddenly you can beat anyone you know. The basic strategy you have will not work against professionals, of course. This is the same feeling we get trading with Ichimoku only after some time. 

Ichimoku indicators are quite old, made in 1930. They still work but makes you wonder is it possible nothing better has been made for almost a century and can new, better indicators be applied instead. When you test new indicators you will see they are not very good, more often they are abysmal when it comes to signals and filters. But occasionally you will find great ones worth keeping. Technical traders say some people hate indicators because they never went on the quest to find the ones worth in gold. Note though, the awesome indicators you find may not play well when you plug them into your system. Creating this algorithm is a lot of trial and error work that not many will want to pursue.

Even though the indicator is great but does not fit however you tweak it, keep it. Systems evolve with your improvement and research, and it may not take a while for this great indicator finds its role in a new system version of yours. Now, Ichimoku has not evolved for a long time, forex has changed, computers have changed, people too, it is interesting how it still works to a certain limit. Additionally, forcing you to use the Ichimoku indicators combination only is a very limiting view and practice. It will not get you far. 

Opinion presented in this article should not concern you, especially if you already have a system that brings profits consistently. It is for those who are still building their system. Ichimoku Indicators are all based on lines calculated based on the price movements. Some will call these secondary indicators, primary is the price action. These lines create a cloud, MA crossing signals, and the Chikou Span on its own. Some people create mystery about the secrets of Chinkou Span, but there are no secrets, if traders do not see how it fits their systems it does not mean there is a secret ( and also profitable?) meaning.

It is common to see people making something more interesting by stirring up a mystery, hype, or other unproven claims. Mysticism explains nothing, however, this trend was popular since the 80s and it was carried over to healthcare, conspiracies, lifestyle, diets, mental practices, and to forex trading too. There is no room for these interpretations for professional traders. Everything technical traders do have a number, a measure, or evident meaning. Ichimoku indicator and especially Chikou Span attract esoteric interpretations you should ignore. There are so many ways Ichimoku can be interpreted and this is not the one you need even though they are popular. 

Since we are going to measure the performance of every Ichimoku element separately, let’s see how Chikou Span goes on a daily chart. You can use this line in the basic already explained way or have some other interpretation with the price, for example. If we look at Chikou Span only, when the price is below the line 26 periods before we trade only shorts, and when it is above only long trades. So it is still a filter indicator and there are even more ways to use it. Try to test is with your favorite trend confirmation indicator.

Does Chikou Span filter bad trades, make your confirmation indicator better? If the answer is yes then you may have an element worth your while. However, according to the testing made by other prop traders, the results are not good and pale to other filtering methods. It should eliminate losers and keep the good as much as possible. Unfortunately, Chikou Span filtered too many winners and not enough losers whatever method we have used. So we are eliminating this element from our list, we will have to find other filters. But let’s move on to other arts of Ichimoku.

Ichimoku Cloud is formed by Senkou span A and B. The cloud is the purpose of these two lines. Traders also have many ways to what they pay attention to and how they interpret signals or filtering with the clouds and the lines. There are three main ways. The first one is the classic way, take only shorts if the price is below the cloud and vice versa. The second one is using the cloud extension. If you have noticed, the cloud goes beyond the current asset price, into the future.

Since we have it in the future, it can also mean it is plotting a prediction of how the price can behave. The cloud has a bullish and bearish color, usually marked by green and red shade. The cloud will shift bullish and bearish shades telling traders there is a price momentum shift probably too. The third most common use of the cloud is as a dynamic Support and Resistance. Traders will interpret any price breakouts out of the cloud as a signal to enter a trade. In this case, the cloud is a signal generator and a reversal predictor, not a filter indicator. 

Now when we test the breakout way of interpreting the cloud we do not have consistent results. There are many cases when the price closed and broke through the cloud only to reverse. Some of the breakouts are false, some are good, overall not good enough compared to other tools. So this method is not classic but it does not mean it is better either. However, you will need to test this out yourself. As for the reversals, we found it is hard to define a reversal signal as the price can enter and get out of a cloud multiple times in a couple of days. This problem is especially apparent when in ranging areas, where reversals should work better than in trending. Whatsmore, reversal strategies are not as good as trend following according to many studies. We will eliminate the breakout way of how the cloud is interpreted and move on to the cloud predictor way.

Whenever the Kumo Cloud turns its colors, this is a signal the price is going that direction. When we have a future shift and see the cloud in front of the current price, we can use it as a predictive signal whenever it switches colors. Is it accurate in predictions? According to our tests, its performance as a trend confirmation or prediction is abysmal. It even feels like the prediction part of the cloud is there just because the cloud is used as a filter in a classic way, and the rest of it is just the result of the code. It was never meant to be a confirmation or prediction tool.

It would be great to have something that predicts the price, even with average accuracy, but we have not found a way to have anything remotely useable. A combination with other indicators could make it better, and it can be your quest to find it. Just do not invest too much effort into something it is unlikely to get better. We say this because no indicator can predict the effect of the big banks, news events, and other catalysts. The only way to partly predict this is by having insider bank information. Let’s move on to the next way. 

We have only left the classic Ichimoku cloud role interpretation. While trading this way, one cannot notice trades are far apart if we trade only when the cloud filter allows for it, without any other rule, such as when the price breaks through the cloud. Now, this is great for training your discipline but it definitely filters out trends that make a difference to the balance have you taken the trades filtered. On some occasions, only two to three trades can happen on a particular currency pair in one year. This is not optimal if you want to forward test some system, it would take you a long time to have a good trading sample. When you get advanced, the Kumo cloud is not good enough. If you are a beginner, the cloud and complete Ichimiku will teach you a lot of essential skills. 

After all said and done, the cloud and all of its interpretations do not have a place in prop traders’ algorithms. Moving on to the last pieces of Ichimoku, the MAs. In the article about crossovers we have presented the drawbacks and how MAs can be used more effectively. If we take the classic Ichimoku approach and wait for the MA crossover as a trade entry signal, they tend to lag too much, similarly to the other MAs types. This is not about the settings, it is inherent to crossovers no matter what settings you set. If we take the price instead of one MA and use it as the signal generator when the price close-crosses the MA, we have a whole new result. We can take the faster MA out and use only Kijun-Sen.

What we get is very good entries but not quite in line with our usual Take Profit and Stop Loss levels according to the ATR. There is simply too much drawdown. However, Kijun-Sen can play a critical role if we follow our system structure. Kijun-Sen is a top-rated Baseline element to some prop traders. On its own, it can generate consistent results if each crossover is taken as an entry. This means it is a very good candidate for our system that can refine the signals once use in conjunction with other elements. 

Kijun-Sen is the element we can take out of the Ichimoku. We have described the Baseline in another article, according to one trader’s ranking, Kijun-Sen is top 100 indicator in the baseline category. You do not need to adjust the settings if you follow our structure on the daily chart. The baseline is also the core for our money management, it is the starting point for our ATR measurements and it is involved in some of the trading rules. Now you have something for a takeaway, still do not stop your search for better tools. Kijun-Sen will up your odds tremendously, still, it may not be enough for the elite rank. 

Finally, you can trade Ichimoku, test it, see it in different ways, even find something we did not, there is nothing obligatory in this article. Ichimoku has a forced group of indicators, it will force you to trade its way even though it has limited performance. Later on, when you need to advance, you need to make your system. Kijun-Sen based indicator already exist, some of them have some addons that may or may not improve its effectiveness. One example of such an indicator is Jurik Smoother Kijun-Sen by Mladen, available for free. It is available on various popular trading websites.

Categories
Forex Basic Strategies

Turtle Soup +1 Forex Strategy

Important decision-makers are accountable. The decision to conclude a transaction is the trader’s prerogative, which must take into account the behavior of market professionals and crowds. Many players prefer to wait for the end of the trading day. Therefore, traders who use the strategy Turtle Soup have time to think about an exchange with a more balanced approach. An operation is transferred the next day of negotiation and this strategy, which is updated and is called “Turtle Soup+1”.

The creator of the “Turtle Soup+1” strategy is Linda Raschke. She highlighted the following conditions necessary to build a trading system:

– The market falls to a bottom of 20 bars.

– The previous 20-bar background must have formed at least 3 trading sessions before (for the daily chart).

In this scenario, the trader has the opportunity to:

– Place an order pending to be able to buy in the previous minimum level of 20 bars lower on the second day after the formation of a new bottom of 20 bars.

– Place a stop protection order at the new minimum level of 20 bars lower or at the minimum of the next day, depending on which of them is lower.

– Set a portion of the winnings in 2-6 trading days and use a floating stop order to control the rest of the position.

In early May, in the daily chart of USD/JPY appeared the necessary conditions to implement the strategy «Turtle Soup+1»: a minimum of 20 bars were formed and the previous minimum of 20 bars was created 5 days before. A trader waits for the closing and places a pending purchase order the day after the formation of the new minimum of 20 bars. The activation of the pending order allows us to place a stop order at the minimum level minus a few points and observe the market reversal. After 2 days part of the position closes and the market grows 4.5 figures.

Having a reserve time allows the trader to analyze the situation in different periods of time. In the USD/JPY daily chart RSI was moved to the oversold zone, which may be a confirmation signal of a correction or a reversal of a bearish trend.

Everything that is fair to the bearish market in Forex is also applied in a bullish situation. The algorithm for implementing the “Turtle Soup+1” strategy in bullish conditions is as follows:

– The market is growing at a peak of 20 bars.

– The previous peak of 20 bars must have formed at least 3 trading sessions before.

– Place an order pending sale at the previous maximum level of 20 bars on the second day after the formation of a new peak of 20 bars.

– Place a stop protection order at the new maximum level of 20 bars or at the maximum of the next day, depending on which of them is higher.

– To fix a part of the profits occurs in 2-6 trading days.

– A floating stop is used to control the rest of the position.

A good example is a situation that occurred on the USD/CAD chart. The distance between the new and previous maximum of 20 days is 8 bars, the opening of the position is made the day after the formation of the pattern.

By taking time out, a trader can move to a shorter time frame and see a clear divergence MACD, which is an important investment signal in technical analysis.

In my opinion, the strategy “Turtle soup+1” is more interesting than “Turtle Soup”. It does not require an instant reaction and a trader has time to think well about a transaction. On the other hand, a trader always has the possibility of failing a trade while waiting for the second bar to form, which follows the end of 20 days.

Categories
Forex Basic Strategies

Understanding The Higher Time Frame Reversal Strategy That Is Based On Market Volatility

Introduction

Volatility tends to run in cycles where we usually witness a period of high volatility that is followed by periods of low volatility. This cycle can be observed in almost any market. Let us consider the Forex market, where when a currency pair is strongly trending in one direction, the traders tend to show a strong preference for that currency over another.

During such trends, the market is volatile because the price is on the move. After a point of time, the currency pair will reach a point where the participants feel the exchange rate is fairly overvalued. At this point, the trend pauses and enters into a consolidation. Eventually, when this period of consolidation ends, the market reverses and may start to trend in the other direction. In today’s article, we discuss a trading strategy that will help us grabbing this reversal.

Time Frame

The volatility strategy is best suited for trading on higher time frames, such as the 4 hours and Daily time frame.

Indicators

The indicators that will be used in this strategy include 20-period EMA, Average True Range (ATR) and Bollinger Band Width, with their default settings.

Currency Pairs

The strategy can be used on all currency pairs listed on the broker’s platform. However, we still would recommend applying the strategy on major currency pairs due to higher volatility.

Strategy Concept

Many traders use the exponential moving average (EMA) for identification of the trend and as an indication of volatility. If the price is above the 20-period EMA, the market is said to be in an uptrend. Whereas if price below the 20-period EMA, the market is said to be in a downtrend. As the pair starts to consolidate, the 20-day EMA becomes relatively flat and starts moves in a sideways manner.

The flat 20-period EMA is an indication that the trend has paused and that the market could reverse in direction. In order to confirm that this consolidation is a potential trade setup, we’ll refer to two indicators. The first of these is ATR, which is a measurement of the average trading range of a currency pair, using the default parameter of 14 periods. If we see the ATR indicator falling, it means the ‘range’ is shrinking, and volatility is decreasing.

Bollinger bands are also used to measure volatility. Bollinger bands split open when volatility is high and converge when volatility falls. Instead of using the Bollinger bands themselves, we use the Bollinger band width indicator, which is nothing but a measurement of the space between Bollinger bands. When we see the Bollinger band width indicator dropping, it confirms that the currency pair is in a period of consolidation and that the volatility is falling.

The reduced volatility does not necessarily mean a reversal or a breakout on the other side. We confirm this by adding a trend line and using the EMA for entering the trade. Let us discuss in detail about implementing the above concept in the form of steps.

Trade Setup

In order to explain the strategy, we have considered the Daily chart of USD/CAD where we will be illustrating a ‘long’ trade. Here are the steps to execute the strategy.

Step 1: First, we identify the trend of the market on the trading time frame using the 20-period EMA. This should be easy as it only requires us to see where the price has been trading with respect to the 20-period EMA. Longer, the price stays below or above the moving average, stronger is the trend.

As we can see in the below image, the price stays below the 20-period EMA for a very long period of time; hence, the market is in a strong downtrend.

Step 2: Next, we wait until the trend pauses and starts to consolidate. This is confirmed when both ATR and Bollinger band width starts moving in the same direction. That means, in an uptrend if ATR and Bollinger band width starts rising together, the market has entered into a phase of consolidation. Likewise, in a downtrend, if ATR and Bollinger band width starts falling together, the market has entered into a phase of consolidation. These are the early signs of reversal and that we should pay attention to the market from here on.

The below image shows how the market moves sideways when ATR and Bollinger band width start falling. Let us proceed to the next step.

Step 3: Here, we need to wait for the market to turn on the other side and start moving in the opposite direction. Once that happens, we plot a trendline in the direction of the reversal. The reversal is confirmed when the market respects the trendline and makes a ‘higher low’ or ‘lower high.’ When the market reverses from an uptrend, it should make a lower high at the trendline and in a reversal of a downtrend, it should make a ‘higher low’.

However, we enter the market only when the price closes beyond the moving average, i.e. above the EMA for a ‘long’ and below the EMA for a ‘short.’

In the case of USD/CAD, we can see in the below that the market makes a higher low and respects the trendline confirming a reversal. We have entered ‘long’ right at the close of the price above the EMA.

Step 4: Now, let us determine the stop-loss and take-profit levels of the trade. The stop-loss is placed just below the lowest or above highest point from where the market reverses. In a ‘long’ trade, it will be below the ‘lower low’ while in a ‘short’ trade, it will be above the ‘higher high.’ ‘Take-profit’ is set at a price where the resultant risk-to-reward (RR) of the trade is 1:2.

Strategy Roundup

The ‘Volatility’ strategy occurs over and over again and works well because of the recurring cycle of volatility. Although the above example shows a trade setup on the daily time frame chart, similar setups occur in other time frames as well. Note that the logic behind the setup and the market’s tendency to break out after a consolidation holds true in both long and short time frames.

Categories
Forex Basic Strategies

Pairing Significant S&R Levels With RSI Indicator To Generate Accurate Trading Signals

Introduction

In the previous set of articles, we discussed strategies based on trend continuation or trend reversal. Let us change the subject a little bit and discuss a strategy based on ‘Support and Resistance.’ Although we all know how to trade support and resistance, there is always a problem of consistency when it comes to trading using the conventional support and resistance strategy. We have a look into some of these issues by designing a strategy that provides not only decent risk-to-reward (RR) but also a high probability of success.

Markets are continually changing due to changes in market participants, global politics, and economic events. This means if we continue to trade the usual way, we could be in trouble. It is necessary that, along with markets, we, too, change our trading strategy in order to adapt to the changing market environment.

Time Frame

The strategy works well on the 1-hour, 4-hour, and ‘Daily’ time frame. Therefore, the strategy is suitable for the swing to long-term traders.

Indicators

We make use of only one technical indicator in the strategy, and that is the Relative Strength Index (RSI) with its default settings.

Currency Pairs

The strategy is suitable for trading almost all currency pairs listed on the broker’s platform. One thing we need to ensure before choosing a currency pair is that it should be volatile.

Strategy Concept

‘Cup and Handle’ is a powerful candlestick pattern that shows the prevalence of bullish strength in the market. It is a very reliable pattern that offers excellent trading opportunities. ‘Cup’ formation indicates that the price was unable to make a proper ‘lower low’ on the higher time frame due to a strong buyer who took the price up. The ‘handle’ indicates that the market was unable to reach the previous ‘low’ due to weak sellers where eventually buyers bought at a higher price and are in the process of making a new ‘higher high.’

The logic behind the formation of the ‘Cup and Handle’ pattern makes it one of the most powerful patterns. But the pattern alone is not the basis for the strategy; we also use the RSI to take the highest probability trades. We apply the concept of ‘Cup and Handle’ pattern and RSI indicator at a long-term ‘Support’ level to execute low-risk ‘long’ trades.

The same concept applies when taking ‘short’ trades at long-term ‘Resistance’ level. Here we should look for the formation of the ‘Inverse Cup and Handle’ pattern at ‘Resistance.’ ‘Cup’ here indicates that the price was unable to make a proper ‘higher high’ on the higher time frame due to strong seller who crashed the price. The ‘handle’ indicates that the market was unable to reach the previous ‘high’ due to weak buyers where eventually sellers sold at a lower price and are in the process of making a new ‘lower low.’ We use the RSI indicator to take the highest probability trades by looking for ‘overbought’ and ‘oversold’ situations in the market.

Trade Setup

In order to use the strategy, we have considered the 4-hour chart of AUD/USD, where we will be illustrating a ‘long’ trade using the rules of the strategy.

Step 1:
The first step is to identify long-term support and resistance levels. By long-term we mean, support and resistance levels on the 1-hour time frame and above. Note that the greater number of touches, the stronger is the support or resistance. We would recommend at least three touches at the support or resistance to calling it a strong one. To raise the odds in our favour, we can look for trading at support level in an uptrend and resistance in a downtrend.
The below image shows long-term support being formed in the AUD/USD pair on the 4-hour chart.

Step 2:
Once we have identified the critical technical level, we will wait for the price to present the ‘cup and Handle’ pattern at support and ‘Inverse Cup and Handle’ pattern at resistance. Here we should make sure that when the price at support, the RSI indicates an oversold (below 30) situation in the market at least once and then shows up the pattern. On the other hand, when the price is at resistance, the RSI should cross above the level of 70, indicating an overbought situation and then show up the ‘Inverse cup and handle’ pattern.

Step 3:
After ensuring that the pattern is formed at the right place along with suitable indications from the RSI, we now discuss how to enter the trade. In a ‘cup and handle’ pattern, we enter ‘long’ right at the price break out above the ‘high’ of ‘cup’ pattern. In an ‘inverse cup and handle’ pattern, we enter ‘short’ when ‘price’ breaks below the ‘low’ of the ‘cup’ pattern.
The below image shows an example of we enter for a ‘buy’ at ‘support.’

Step 4:
After entering, it is essential to determine the stop-loss and take-profit levels for the trade. One of the primary reasons behind low risk-to-reward (RR) ratio is late ‘entry.’ Stop-loss is placed below the ‘low’ of the ‘handle’ pattern in a ‘long’ position and above the ‘high’ of the ‘handle’ pattern in a ‘short’ position. The strategy essentially says to enter when prices have travelled a decent amount of distance from support or resistance, which considerably reduces the risk-to-reward (RR) ratio.
The below image shows the result of the trade executed using the above strategy where the resultant risk-to-reward (RR) of the trade is 1:1.

Strategy Roundup

Although the ‘Cup and Handle’ pattern is a bullish continuation pattern, if we understand the logic of the pattern and apply at key technical levels, it can provide excellent opportunities for short as well as long-term traders. Using the RSI indicator along with the pattern gives an extra edge to the strategy, which makes it highly suitable in changing market environment.

Categories
Forex Basic Strategies

Filtering The Most Profitable Trading Signals Using The ‘Zig-Zag’ Forex Trading Strategy

Introduction

In today’s article, we discuss a strategy that is based on the unfamous zig-zag indicator. The zig-zag indicator serves to shows changes and continuation in trends that occur in price movements. Usually, this indicator is used by traders to look for reversal points in the market. But in today’s strategy, we will use the zig-zag indicator to trade the continuation of a trend. However, if we think a little deep, this type of trading is also a form of ‘reversal trading’ where we will be finding the reversal points in a smaller trend within the larger trend.

At first glance, the indicator appears very simple but is not easy to understand by novice traders. The trading strategy that uses this indicator is not special because it uses this indicator, but since we are imparting various other concepts of technical analysis such as chart patterns, trend lines, and price action. But using this indicator alone too can generate good trading signals provided the trader is having good skill of this indicator properly.

Time Frame

The ‘zig-zag’ strategy can only be applied to the ‘Daily’ time frame. Hence, this strategy is not for intraday and short-term traders. We need to have a longer time horizon to trade using this strategy.

Indicators

We use two technical indicators in this strategy

  • Simple Moving Average (20-period)
  • Zig-Zag (default setting)

Currency Pairs

We can apply the following strategy on both minor and major currency pairs. Liquidity and volatility will not be a major issue here as we are trading on higher time frames.

Strategy Concept

We are basically using the zig-zag indicator to identify classic chart patterns of technical analysis and trade them. The indicator is very effective in reducing the noise by helping the technical trader in viewing the larger picture and general market direction. Here, we look for appropriate chart patterns and associated price action indications within the context of a trend.

When these patterns are formed just anywhere on the chart, they do not hold much value as there is no logic to that. Once we identify a trend using the simple moving average (SMA), we wait for trend continuation signs provided to us by the zig-zag indicator and the chart pattern. The formation of the chart pattern is the first sign of trend continuation. Once price action develops and the market moves in the direction of the major trend, we look for ‘entry’ signals and then only enter into a trade.

One of the astounding features of this strategy is it’s risk-to-reward (RR) ratio. Trades executed this strategy have high risk-to-reward (RR) because we are trading with the major trend and the need for a smaller stop-loss. Not only is ‘RR’ of trades high, but also the probability of winning is much higher in this strategy due to stricter rules and time given for a trade setup to be formed. Now that we got a gist of the strategy, let us find out the actions required to execute the strategy.

Trade Setup

In order to execute the strategy, we have considered the ‘Daily’ chart of the USD/JPY currency pair, where we will be illustrating a ‘short’ trade. Here are the steps to execute the strategy.

Step 1: Firstly, we have to identify the trend of the market on the ‘Daily’ chart. This can easily be done with the help of the simple moving average (SMA) indicator. If the price stays below the SMA for a long period of time, we say that the market is in a downtrend. And if it remains above the SMA for a sufficient period of time, we say that the market is in an uptrend. It is worthwhile to note that zig-zag is not being used for establishing the trend.

The below image shows that the market is in a strong downtrend in the case of USD/JPY.

Step 2: After identifying the trend of the market, we wait for the market to form a ‘head and shoulders’ pattern in a down-trending market and an ‘inverse head and shoulders’ pattern in an up-trending market. Here’s where the application of the zig-zag indicator comes into the picture. The chart pattern should essentially be indicated by the zig-zag pattern—the lines of indicator show the ‘real’ formation of the pattern in the market. In addition to this, we plot a trendline that connects the ‘lows’ (head and shoulders) or ‘highs’ (inverse head and shoulders) of the pattern as indicated by the indicator. This completes the execution of 80% of the strategy’s rules.

Step 3: We enter the market for a ‘buy’ or ‘sell’ after the price breaks the trendline and ‘tests’ it on the other side. In simple words, in a ‘head and shoulders’ pattern, we enter for a ‘sell’ when price breaks the ‘support’ trendline and re-tests after making a ‘lower low.’ While in an ‘inverse head and shoulders pattern,’ we enter for a ‘buy’ when price breaks the ‘resistance’ trendline and re-tests after making a ‘higher high.’

The below image shows how a ‘short’ entry is taken.

Step 4: Now, let us determine the stop-loss and take-profit levels for the strategy. When ‘short,’ we place a stop-loss above the right shoulder of the ‘head-and-shoulder’ pattern. Similarly, when ‘long, stop-loss is placed below the right shoulder of the ‘inverse head-and-shoulder’ pattern. Take-profit will be set at the ‘lower low ‘of the major downtrend and at the ‘higher high’ of the major uptrend. The risk-to-reward (RR) of trades executed using this strategy will be at least 1:1.5.

The below image shows the result of sample trade executed using the zig-zag strategy.

Strategy Roundup

Even though the above strategy takes a lot of time to present a potential trade, the risk-to-reward and probability of winning of these trades are worth waiting for. There are many applications of the zig-zag indicators. Traders make use of other technical indicators like the Stochastic Oscillator and Relative Strength Index (RSI) together with the zig-zag indicator to locate the overbought and oversold conditions of the market.

Categories
Forex Basic Strategies

Generating Profitable Forex Signals Using The ‘Indicator-Price Action’ Combo Strategy

Introduction

Few strategies discussed previously focussed on chart patterns and indicators. Now let us a strategy that is based on two of the most powerful indicators in technical analysis. We already know how to trade using these indicators separately. But using any technical indicator in isolation will not generate a great amount of profit.

Therefore, it becomes necessary to combine at least two indicators and use them in conjunction to produce signals. In today’s article, we not only combine two indicators but also provide a price action edge to it that will make this one of the best strategies of all time. This particular strategy gives traders an insight into both volatility and momentum in the forex market.

The two indicators we will using are Bollinger Band (BB) and MACD. Using the two indicators together can assist traders in taking high probability trades as they gauge the direction and strength of the existing trend, along with volatility. Let us find out the specifications of the strategy and how we imbibe concepts of price action here.

Time Frame

The strategy is designed for trading on longer-term price charts such as the 4 hours and ‘Daily.’ This means the strategy is suitable for the swing to long-term traders.

Indicators

As mentioned earlier, we use Bollinger Band and MACD indicators in the strategy with their default settings.

Currency Pairs

We can apply this strategy to both major and minor currency pairs. However, pairs that are not volatile should be avoided.

Strategy Concept

In this strategy, we first identify the trend of the market and see if the price is moving in a channel or not. When looking for a ‘long’ setup, the price must move in a channel below the median line of the Bollinger band. The lesser time price spends above the median line of the Bollinger band better for the strategy.

The reason behind why we chose to have the price below the Bollinger band is to verify that the price is moving into an ‘oversold’ zone. When price moves into the zone of ‘overbought’ or ‘oversold,’ it means a reversal is nearing in the market. Similarly, in a ‘short’ setup, the price should initially move in an upward channel above the median line of the Bollinger band. This indicates that the price is approaching an ‘overbought’ area.

The MACD indicator shows when a true reversal is taking place in the market. The histogram tells about the momentum and strength of the reversal. Depending on the level of the bars, we ascertain the strength of the reversal. Not only is the strength of the reversal important, but also the ’highs’ and ‘lows’ it makes. Once price crosses previous highs and lows, we enter the market at an appropriate ‘test.’ Let us understand in detail about the execution of the strategy.

Trade Setup

In order to execute the strategy, we have considered the 4-hour chart of the GBP/JPY pair, where we will be illustrating a ‘long’ trade. Here are steps to execute the strategy.

Step 1: Firstly, we have to identify the trend of the market. In a ‘long’ trade setup, we need to look for series of ‘lower lows’ and ‘lower highs’ below the median line of the Bollinger band, and in a ‘short’ trade setup, we need to look for series of ‘higher highs’ and ‘higher lows’ above the median line of Bollinger band. When this is confined in the channel, the trend becomes very clear, and reversal can easily be identified.

Step 2: We say that an upward reversal has taken place when we notice a bullish crossover in MACD along with a positive histogram. While in an uptrend, we say that a reversal has occurred when we notice a bearish crossover in MACD along with a negative histogram. Once reversal becomes eminent in the market, it is necessary to confirm that the reversal is ‘true,’ and thus, we could take a trade in the direction of the reversal.

The below image shows a downtrend reversal, as indicated by MACD.

Step 3: In this step, we should make sure that the price makes a ‘high’ that is above the previous ‘lower high,’ in an upward reversal. While in a downward reversal (reversal of an uptrend), the price should make a ‘low’ that is lower than the previous ‘higher low.’ When all these conditions are fulfilled, we can say that the reversal is real, and now we will look to trade the reversal.

We enter the market for a ‘buy’ or ‘sell’ when price ‘tests’ the median line of the Bollinger band after the reversal and stays above (‘buy’) or below (‘sell’).

Step 4: Finally, after entering the trade, we need to define appropriate levels of stop-loss and ‘take-profit’ for the trade. The rules of stop-loss are pretty simple, where it will be placed below the lowest point of the downtrend in a ‘long’ position and above the highest point of the uptrend in a ‘short’ position. ‘Take-profit’ will be set such that the risk-to-reward (RR) of the trade is at least 1:1.5. Once the price starts moving in our favor, we will put our stop-loss to break-even and extend our take-profit level.

Strategy Roundup

The combination of the Bollinger band and MACD is not suitable for novice traders. Since it involves complex rules and indicators, we need prior experience of using the indicators and charts before we can apply the strategy successfully. Traders should pay attention to every rule of the strategy to gain the maximum out of it. As there many rules and conditions, there is a tendency among traders to skip some rules, but it is not advisable.

Categories
Forex Basic Strategies

Learning To Trade The ‘Make Your Wish’ Forex Trading Strategy

Introduction

The ‘make your wish’ strategy is based on one of the most popular candlestick patterns, i.e., the Shooting Star. As we all are aware that it looks similar to an inverted hammer, we try to develop a strategy that gives us the ability to capture small bearish reversal in the market. This pattern can prove to be a very “dangerous” pattern if developed at the right location.

Once we comprehend the importance of shooting stars, we discover that one candle pattern has such a power that it can signal the reversal of a strong bullish trend. Very few people take the risk of trading reversal, as this type of trading has badly hurt the trading accounts of many.

Today’s strategy will address this issue and will show how we can catch a falling knife without cutting off our fingers. The ‘make your wish’ can help us spot the top of the market and how to trade it properly. As Shooting stars are believed to make our wishes come true, we have named this strategy as ‘Make Your Wish,’ hoping that the strategy makes our wish of winning come true.

Time Frame

This strategy can only be traded on very short-term price charts such as 5 minutes or 1 minute. Hence, this is a perfect, intraday trading strategy.

Indicators

We make use of just one technical indicator in this strategy, and that is the Chaikin Oscillator.

Currency Pairs

The most suitable currency pairs are EURUSD, USD/JPY, GBP/USD, AUD/USD, GBP/AUD, USD/CAD, GBP/JPY, and CAD/JPY. Minor and exotic pairs should completely be avoided.

Strategy Concept

The ‘make your wish’ strategy is a very simple and effective technique to use in the forex market. Since most traders are interested in day trading and scalping, there isn’t a better strategy to use for that. The strategy is based on the simple concept that when the market moves sharply in one direction, it needs to ‘pullback’ at some of the time that will lead to a decent retracement in the price to the next technical level. The ‘shooting star’ helps us identifying the time when retracement will start.

Here, we take advantage of this retracement and try to particulate in the short-term reversal of the market. As this can involve high risk, we cannot solely rely on a candlestick pattern and use a technical indicator to give us the extra confirmation. We use the ‘Chaikin Oscillator, ’ which is designed to anticipate directional changes in the market by measuring the momentum behind the movements. Anticipating change in direction is the first step to identifying a change in the trend. But this also isn’t enough for forecasting a reversal, which we shall in detail in the future course of the detail.

The risk-to-reward (RR) of the trades will not be high as we are trading against the trend of the market, which may not be suitable for high ‘RR’ seekers. But at the same time, the probability of success is high for trades executed using this strategy.

Trade Setup

In order to execute the strategy, we have considered the 5-minute chart of where we will be illustrating a ‘long’ trade. Here are the steps to execute the strategy.

Step 1: Firstly, we identify the trend of the market by plotting a trendline. If the price bounces off from the trendline, each time it comes close to it, we can say that the market is trending. Here we should make sure that the price is not violating the trendline multiple times. This also means that there are no deeper retracements in the trend, which is desired for the strategy. The trendline is plotted by connecting the ‘highs’ and ‘lows’ of the market.

The below image shows that GBP/AUD is in a strong uptrend.

Step 2: Next, we wait for the ‘Shooting star’ candlestick pattern to appear in the trend. Once the pattern shows up on the chart, we look at the Chaikin oscillator and make a note of its reading. When this ‘rejection’ pattern appears in an uptrend, it indicates a reversal of the trend if the Chaikin oscillator starts moving lower and slips below the ‘0’ level.

When this ‘rejection’ pattern appears in a downtrend, it indicates a reversal of the trend if the Chaikin oscillator starts moving upwards and moves from negative to positive territory. When both these criteria are fulfilled, reversal is imminent in the market. But we cannot enter the market as yet.

The below image shows how the pattern emerges on the chart along with a falling Chaikin oscillator.

Step 3: It is important to note that we enter the market soon after the appearance of the pattern. After the formation of the pattern, it is necessary to wait for a ‘lower high’ in case of an uptrend reversal and a ‘higher low’ in a downtrend reversal.

The below image shows the formation of  ‘lower high’ after the appearance of the ‘shooting star’ pattern, which is the final confirmation for entering the trade.

Step 4: Now, let us determine the stop-loss and take-profit levels for the strategy. Setting the stop-loss is pretty simple, where it is placed above the ‘lower high’ in a ‘long’ trade and below the ‘higher low’ in a ‘short’ trade. The take-profit is set at a price where the distance of take-profit from the point of ‘entry’ is equal to the distance of ‘stop-loss.’ That means the risk-to-reward (RR) of trades executed using this strategy is not more than 1:1. The reason for low RR is because we are trading against the trend of the market. Hence there is a possibility that the market might start moving in its major direction.

Strategy Roundup

A lot of traders warn against reversal trading, but finding top and bottom in the market and trading reversal can be done successfully if we have a proven methodology like the ‘make your wish’ strategy. We need to take into consideration all the rules outlined in this strategy guide other than just looking for the ‘shooting star’ pattern.

Categories
Forex Basic Strategies

The Amazing Combination of ‘EMA & RSI’ While Trading The Forex Market

Introduction

Previously, we discussed several trading strategies that involved a combination of different indicators, but the number did not exceed two or three. In today’s article, we present a trading system that is based on five different Exponential Moving Averages, combined with the Relative Strength Index (RSI). This strategy will make a lot of sense to traders who are at an intermediate level of trading. It is totally mechanical in nature and requires a thorough understanding of technical indicators of MT4 or MT5.

Time Frame

The strategy can almost be used on any time frame, but a larger one is preferred, 1 hour or higher. This means the strategy is not suitable for trading during the day.

Indicators

As said, we will use five different Exponential Moving Averages and one Relative Strength Index (RSI). This is the reason we need to be well versed in the technical indicators.

Currency Pairs

This strategy can be used with any currency pair. Also, with few commodities as well. Liquidity will not be an issue here since we are trading on the higher time frames.

Strategy Concept

Firstly, we use 80-period EMA to identify the major trend of the market. If the price is above 80 EMA, we say that the market is in a bull market, while if it is below the 80 EMA, the market is in a bear market. Secondly, we use the 21-period and 13-period EMA to point out the current trend direction, meaning, the current minor trend within the major trend. If the EMA with a shorter period is above the one with the longer period, we have a minor bull trend, and vice versa.

Third, we use the other two EMAs with even shorter ‘periods’ in conjunction with the Relative Strength Index (RSI) to generate entry signals. These are the 3-period EMA and 5-period EMA. The crossing of these two EMAs supported by the appropriate value of RSI, tells us whether to go long or short in the currency pair.

However, a more conservative approach would be by ignoring the entry signals, which are in the opposite direction of the major trend. Therefore a ‘long’ entry signal would be generated when the 3-period EMA penetrates the 5-period EMA from below and starts moving higher. Also, the 80-period EMA must be below the price action discussed above, and RSI must have a value exceeding 50. We execute the trade once the signal bar closes beyond the 5-period EMA.

Conversely, a ‘short’ entry will be taken when the 3-period EMA penetrates the 5-period EMA from above and continues lower. This must be coupled with an RSI value below 50, and 80-period EMA be above the price action.

Trade Setup

In order to explain the strategy, we have considered the 4-hour chart of USD/CAD, where we will be applying the rules of the strategy to execute a ‘long’ trade.

Step 1

Since this a trend-based strategy, the first step is to identify the major direction of the market using the 80-period EMA. It is important that the price remains above the EMA for at least four consecutive higher highs and higher lows before we can call it an uptrend. Likewise, the price should be below the 80-period EMA for a minimum of 4 lower lows and lower highs.

The below image shows a clear uptrend visible on USD/CAD on the 4-hour chart.

Step 2

Once we have identified the trend, we need to wait for a price retracement that could give us an opportunity to enter the market and ride the trend. We need to evaluate if this a true retracement or the start of a reversal. In this step, we should wait until the price develops a ‘range’ or the 80-period EMA becomes flat. This partially confirms that the retracement is real, and the price could be making a new ‘high’ or ‘low.’

In the example we have taken, we can see how the price starts to move in a ‘range’ along with the flattening of the EMA. Next, let us discuss the ‘entry’ part of the strategy.

Step 3

We shall enter the market for a ‘buy’ when all the smaller EMAs cross the 80-period from below. The 3-period EMA should penetrate the 5-period EMA and start moving forward to generate a reliable ‘buy’ signal. Along with this, at the entry bar, the RSI should be above the 50 levels, and both the 3 and 5 periods EMA should cross the 13-21 EMA channel. Once all of these conditions are fulfilled, we can take a risk-free entry into the market. The same rules apply while taking a ‘short’ trade but in reverse.

The below image clearly shows the ‘entry’ where all the conditions mentioned above are met.

Step 4

Once we have entered the trade, we need to determine the stop-loss and take-profit levels. For this strategy, the take-profit and stop-loss are placed in such a way that the resultant risk-to-reward of the trade is 2.5. The RR is derived mathematically, where we have taken into consideration the possibility of a new ‘high’ or ‘low’ as we are trading in a strong trending environment.

Accordingly, we have set the take-profit and stop-loss in our example, as shown below.

Strategy Roundup

Combining two or more technical indicators has always proven profitable for traders. The above-discussed strategy considers the trend of the market, momentum, strength of the retracement, and shift of ‘highs’ and ‘lows,’ which makes it an amazing strategy to be used while trading part-time or full-time. Since there are many rules and requirements for the strategy, the probability of occurrence of trade-setup is less, but once formed, it can provide amazing results.

Categories
Forex Basic Strategies

A Brand New Forex Trading Strategy By Combining The ‘Flag & Pennant’ Patterns

Introduction

Until now, we discussed a bunch of trading strategies that were based on numerous technical indicators. In today’s article, we discuss a strategy that is based on a candlestick pattern. Flags and Pennants are short-term continuation patterns where the market tends to continue moving in the same direction after the formation of the pattern on the chart. These patterns are found on both short-term and long-term charts.

In the case of Flag, the initial move is a sudden, sharp directional move. It is doesn’t matter where the move is formed on the chart; what matters here is the velocity of the move. If the movement is not sharp and large, the reliability of the pattern will be under question. However, it will also use the volume indicator to confirm the strength of the Flag and pattern. Let us understand all the specifications of the strategy in detail.

Time Frame

As mentioned earlier, the Pennant-Flag strategy can be traded on time frames varying from 15 min to ‘Daily.’

Indicators

The only indicator we will be is the ‘Volume’ indicator. The rest of all is based on candlestick and price action patterns.

Currency Pairs

The strategy can only be used on major currency pairs listed on the broker’s platform. Few preferred pairs are EUR/USD, USD/JPY, GBP/USD, GBP/JPY, EUR/JPY, etc.

Strategy Concept

The strategy is based on the concept of the Pennant Candlestick Pattern. A sharp thrust creates a flagpole, and then when the market begins to consolidate into an asymmetric triangle, we wait for a breakout or breakdown. The consolidation is a brief pause before a potential break on either side. If the price clears the top of the ‘Pennant,’ we look for ‘long’ trades, and if breaks below the bottom of the ‘Pennant,’ we look for ‘short’ trades.

After a large vertical flagpole and a triangular consolidation, the market might be getting ready for a further continuation. The odds of a breakout increase when this pattern is accompanied by high volume. In a bullish flagpole, we place our ‘entry’ order above the ‘high’ of the flagpole, and in a bearish flagpole, we place our order below the ‘low’ of the Flag. Of course, when we enter, we’ll need to place a stop.

The stop is calculated by measuring the number of pips that is equivalent to 35-40 percent of the flagpole. For example, if the height of the flagpole is 100 pips, the stop will be placed 25 beneath the entry point.

Finally, we will need to define exits for our trade. Our first target will be equal to the number of pips that we are risking on the trade. Another strategy is to trail the stop-loss trade and exit when the market shows signs of reversal. Let us look at the specifics of the pattern and technique to make winning trades.

Trade Setup

In order to explain the strategy, we have considered the 4-hour chart of EUR/USD, where we will be illustrating a ‘long’ trade. Here are the steps to execute the strategy.

Step 1: The first step of the strategy is to wait for a sharp, sudden, and strong candle to show up on the chart. This usually happens after a major news announcement or after the release of economic data. This candle should compulsorily be with high volume as it indicates that big players of the market created this move. If the candle is not with high volume, the move cannot be trusted upon. We could use the economic calendar to find out the exact time of news release and the event.

In the below image, we can see a large candle that popped up after a news announcement that took the prices sharply higher.

Step 2: After the sudden move, prices should necessarily move in a triangular pattern, which is shrinking in nature. Few traders also refer to this as ‘squeeze.’ This pattern should be formed on the lower time frame. Market moving in this ‘squeeze’ pattern is very important for the strategy to work at its best. This leads to the formation of a Pennant candlestick pattern. Pennants involve two parts – a vertical flagpole and a triangular consolidation. The consolidation is usually for a shorter duration of time. Once the pattern has been formed along with the necessary conditions, let us see how to enter a trade.

The below image shows the formation of a Pennant candlestick pattern on the 1-hour chart.

Step 3: The rules of ‘entry’ are pretty simple. In a bullish setup, we place a ‘long’ entry order just above the ‘high’ of the ‘flagpole’ candle formed on the higher time frame. In a bearish setup, we place a ‘short’ entry order just below the ‘low’ of the ‘flagpole’ candle. As and when the market continues to move in the direction of the ‘flagpole,’ the order will automatically be executed.

In the case of our EUR/USD example, our ‘buy’ order gets executed as soon as prices start moving higher.

Step 4: Now, let us define the exit rules for the strategy. The stop-loss is calculated by the number of pips equal to 35-40 percent of the ‘flagpole.’ Stop-loss is placed below the entry price equivalent to the pips obtained by calculation. The ‘take-profit’ is set a price where the resultant risk to reward of the trade is 1:1. Therefore, the take-profit is determined by the stop-loss. Another exit strategy is to trail the stop loss and exit after we witness a reversal pattern in the market.

Strategy Concept

The idea behind this technique is not to place most trades but to place the best trades. The most crucial aspect of the trade is the ‘Flagpole’ candle. We need to ensure that this candle is a consequence of a major news announcement and not just a normal candle. Many traders become impatient and enter even though all criteria have not been met. Patience and discipline will help us to avoid falling into this trap and keep us on the course.

Categories
Forex Basic Strategies

An Exclusive Strategy To Trade The Fiber (EUR/USD) Currency Pair

Introduction 

In the previous article, we discussed a trading strategy that was a combination of EMA and RSI. Presuming that all the readers easily understood it, we will now discuss a trading strategy that is a combination of three technical indicators. Today’s article will acquit us with another useful and reliable trading system that is based on the combination of Simple Moving Average, Stochastic Oscillator, and Relative Strength Index (RSI).

Time Frame

This strategy is only applicable on the 1-hour time frame. This is because all the indicators tend to sync in this time frame. Therefore, the strategy may not be suitable for day traders.

Indicators

The strategy consists of three indicators – a 150-period Simple Moving Average (SMA), Relative Strength Index (RSI) with period 3, and a Full Stochastic Oscillator with standard settings. The overbought and oversold levels for the indicators stand at 70-80 and 30-20, respectively.

Currency Pairs

As the name suggests, this strategy is exclusively meant for ‘EUR/USD.’ The liquidity and volatility of EUR/USD are extremely supportive of this strategy.

Strategy Concept

We first identify the direction of the market using the 150-period SMA and then establish a channel in the same direction. This is the first condition that has to be met before we can initiate a ‘trade.’ One could also this is a ‘channel’ based strategy as it involves going ‘long’ at the bottom of the channel and ‘short’ at the top once the indicators generate signals.

For a ‘long’ entry, we need to see if the Relative Strength Index drops in the oversold area. Once it drops, we look for a bullish crossover of the Stochastic lines, while they are also within their oversold zone. In simple words, we need a channel in a bull trend with both the indicators indicating that the market is oversold and with the Stochastic displaying a bull reversal.

Conversely, a ‘short’ trade is generated when the price starts moving in a downward channel in a bearish trend. The RSI and Stochastic should be in the overbought area that will later display a bearish reversal. As soon as the Stochastic fast and slow lines make a bearish crossover, we enter for a ‘sell’ on the next price bar. All of the above price action must happen below the 150-period SMA.

The strategy offers a high degree of capital protection as we place our stop-loss at the most recent ‘swing low’ or ‘swing high.’ As far as the ‘take-profit’ is concerned, we can use a fixed profit target, or we could scale out as the market approaches our target and protecting it with a trailing stop. An exit signal is also generated by the Stochastic indicator, which we will be discussing in the upcoming section of the article.

Trade Setup                     

In order to explain the strategy, we have considered the 1-hour chart of EUR/USD, where we will be applying the rules of the strategy to execute a ‘long’ trade.

Step 1: First of all, open the 1-hour chart of EUR/USD and establish the trend of the market. Plot Simple Moving Average (SMA) with a period of 150, Stochastic and Relative Strength Index with their default settings on the chart. If the price is above the 150-period SMA, we say that the market is in an uptrend. Whereas if the price is below the 150-period SMA, we say that it is in a downtrend. Next, draw a channel within the trend. It is better to have an upward channel in an uptrend and a downward channel in a downtrend.

Step 2: This is the crucial step of the strategy, where we align the three indicators together to generate a signal. After the identification of the trend and channel, we need to wait for the price to come at the extreme of the channel. In an upward channel, the price should be at the bottom of the channel, while in a downward channel, the price should be at the top.

Once the price reaches these extremes, we should watch the Stochastic and RSI. We enter ‘long’ when we notice a bullish crossover in Stochastic and an oversold circumstance of RSI (below 40). This means that the price might be putting up a ‘low’ that will result in a reversal. Similarly, we will go ‘short’ in the currency pair when we notice a bearish crossover in Stochastic along with an overbought condition of RSI (above 60).

The below image shows an example where the above step is being accomplished.

Step 3: In this step, we shall determine the Stop-Loss and Take-Profit for the trade where both these levels are derived mechanically. We place the stop-loss just below the ‘swing low’ from where the reversal took place. It will be above the recent ‘swing high’ in a ‘short’ trade. When speaking of the take-profit level, there is no fixed point for it. We take our profits when Stochastic reaches the opposite overbought/oversold level. At this point, we can either exit the trade, scale-out, or use a trailing stop. This can help in increasing the risk-to-reward (RR).

In our case, the risk-to-reward (RR) ratio of the trade was 1.5, which is above average.

Strategy Roundup

The RSI+Stochastic+SMA strategy is a reliable trend trading system that accurately pinpoints the bottom of a channel in a trend. More importantly, the strategy can provide the best-with-trend entry points that are necessary to increase the probability of winning. Since we are applying this strategy on a higher time frame, it will limit the effects of whipsaws that are encountered more often these days.

Categories
Forex Basic Strategies

Generating Reliable Trading Signals Using ‘The Power of Two’ Forex Strategy

Introduction 

In the previous article, we discussed a strategy that was based on three indicators, namely the RSI, Stochastic, and SMA. It was not only a bit complex in nature but involved many rules that had to be fulfilled before we could make a ‘trade.’ Also, the probability of occurrence of the signal was lower as it involved many indicators.

In today’s article, we will discuss a setup that is observed more often in the market and has a higher probability of success. Again, the strategy may not be suitable for day traders as it used a longer time frame for analysis. In this strategy, we will be examining the 4-hour time frame chart of the currency pairs. This is simpler than the previous strategy.

Time Frame

As mentioned in the previous paragraph, the strategy yields the best results when applied on the 4-hour time frame. However, the ‘daily’ is also a suitable time frame for the strategy.

Indicators

We will be using the Relative Strength Index (RSI), with a 14-bar period. The overbought and oversold levels stand at 70 and 30, respectively. We also apply the Bollinger Band indicator with its default settings.

Currency Pairs

This is the best part of the strategy, where we can apply on all currency pairs listed on the broker’s platform, including few minor and exotic pairs.

Strategy Concept

The strategy is based on a simple concept that the RSI is a very powerful indicator of a trend. It can accurately identify the highs and lows that will give rise to a new trend. This is combined with the Bollinger Band indicator to generate exact entry points for the strategy.

The trend becomes especially reliable when the reading of RSI makes a swift jump from an oversold level to a median level (above 50) and vice-versa. The Bollinger Band indicates the formation of a ‘low,’ after which we can execute a ‘long’ trade. Similarly, when Bollinger Band pin-points a ‘high,’ we execute ‘short’ trades in the market. The exact rules of ‘entry’ will be discussed in the next section of the article.

The risk-to-reward (RR) of the trades done using this strategy is highly appealing. This is because it employs a small stop-loss with a much higher take-profit. If the market is in a strong trending state, traders can ride their profits as long as they see signs of reversal.

Trade Setup 

In order to explain the strategy, we have considered the 4-hour chart of GBP/JPY, where we will be illustrating a ‘long’ trade. Here are the steps to execute the strategy.

Step 1

The first step is to open the 4-hour timeframe of the desired currency pair and plot Bollinger Band and RSI indicator on it. Just from the appearance and basic knowledge of trends, identify the trend of the market. This means if the market is making higher highs and higher lows, the market is in an uptrend. And if we see lower lows and lower highs on the chart, it is a downtrend. We can also take the assistance of a simple moving average (SMA) to get a clear picture of the trend.

In the case of GBP/JPY, it is evident from the below image that the market is in a strong downtrend.


Step 2

Next, we need to wait for the price to go above the highest point visible on the chart, where we will be analyzing signs of a reversal to the downside. Similarly, we need to wait for the price to go below the lowest point visible on the chart, where we will be analyzing the signs of a reversal to the upside. For example, suppose the price is near its lowest point visible on the chart. In that case, we say that market may be reversing to the upside if a bearish candle closes below the lower band of the Bollinger Band, and the immediate next candle is a bullish candle that closes above the lower band. This has to be accompanied by the RSI moving into the oversold zone (below 30).

In case of a reversal of an uptrend, a bullish candle should close above the upper band of the Bollinger band with a bearish candle that closes below the upper band. At this price, the RSI should indicate an overbought situation of the market (above 70).

Step 3

This is the easiest step of the strategy where we have to only observe the movement of price following the ‘two-candle’ pattern discussed in the previous step. Essentially, we need to see that the price starts moving in the direction of the reversal, i.e., above or below the median line of Bollinger Band. This should again be accompanied by a rising RSI for ‘long’ entry and falling RSI for a ‘short’ entry.

In the below image, we can see how the rise in price above the median line goes with a sudden rise in RSI.

Step 4

In this step, we determine the stop-loss and take-profit for the trade done using this strategy. The stop-loss is placed just below the ‘low’ or above the ‘high’ from where the market reverses. However, there is no fixed take-profit level here. We exit a ‘long’ trade once RSI goes below 50 and start moving lower. While a ‘short’ trade is exited as soon as RSI goes past the level of 50.

As we can see in the image below, the market reversed fully, and the trade turned to be extremely profitable.

Strategy Roundup

When Bollinger Band and RSI are combined to generate trade signals, we can accurately identify the market top and bottom where we take advantage of the reversal. But this can only be done efficiently after practicing well. The above strategy is suitable for swing and part-time traders.

Categories
Forex Basic Strategies

Learning The ‘Intraday Strategy’ To Trade The Forex Market

Introduction

In today’s article, we present to you a fairly simple but reliable trading strategy that can be used by all types of traders, irrespective of their style. It is believed that when markets are strongly trending in one direction, it gets impossible to catch the stalling point. It is only difficult to catch the ‘top’ or ‘bottom’ of the market, but it also carries a huge amount of risk. We are going to discuss a trading strategy that is contrary to this common belief. We shall try to catch the highest or the lowest point in the market by using some of the most powerful technical indicators and techniques.

Time Frame

The strategy can be used on the 5 minutes, 15 minutes, and 1-hour time frame chart. An intraday trader would apply the strategy on the 5 or 15 minutes chart, whereas a positional trader would open the 1-hour chart.

Indicators

We use the following indicators in the strategy:

  • 5-period Exponential Moving Average (EMA)
  • 10-period Exponential Moving Average (EMA)
  • 14-period Relative Strength Index (RSI)
  • Slow Stochastic Oscillator
  • K and D period – 3

Currency Pairs

This strategy can only be applied on major currency pairs of the forex market. Some of the preferred pairs include EUR/USD, GBP/JPY, GBP/USD, USD/CAD, USD/JPY, EUR/GBP, etc.

Strategy Concept

The rules of the strategy are quite simple and straightforward. We enter the market for a ‘long’ when the 5-period EMA crosses above the 10-period EMA after a prolonged downtrend. But this isn’t enough. Along with this, the RSI should be above the level of 50, and Stochastic slow and fast lines should move in the same direction (upward). Here we need to make sure that the Stochastic does not enter the overbought zone. Similarly, if the 5-period EMA crosses below the 10-period EMA after a prolonged uptrend, we prepare to enter ‘short.’ In this case, the RSI should be below the level of 50, and Stochastic lines should be moving downwards.

We exit the trade when 5-period EMA crosses beyond the 10-period EMA, where this is confirmed by the close of a candle beyond the latter. Another way to exit the trade is when the RSI drops below the 50 level. The several conditions which must be fulfilled in order to execute a trade make the strategy a good filter for trade entries. However, the two EMAs have a drawback as they can get choppy and generate false signals. We can avoid this by carefully monitoring the movement of EMA lines along with the other indicators. When the strategy is executed by following every rule of the strategy, wrong ‘trades’ can be eliminated to a great extent.

Trade Setup

In order to explain the strategy, we have considered the 5 minutes chart of EUR/USD, where we will be illustrating a ‘long’ trade. Here are the steps to execute the strategy.

Step 1: The first step is to identify the trend of the market and plot all the indicators on the chart, as mentioned in the above section. An easier way to identify the trend is by looking at the price concerning 5 and 10 period EMA. If the 5-period EMA is above the 10-period EMA, we say that the market is an uptrend. Whereas, if the 5-period EMA is below the 10-period EMA, the market is said to be in a downtrend.

In the example considered, it clear from the below image that the market is in an uptrend, and at the end, the trend seems to be weakening.

Step 2: This is the most critical step where we combine all the rules of the strategy. Once the trend has been identified, we should wait for a crossover of the 5-period EMA below the 10-period EMA, during the reversal of an uptrend. We say that the market has made a ‘top’ when both RSI and Stochastic lines start moving lower after the crossover. We should make sure that RSI does not move into the oversold zone. In order to catch the reversal of a downtrend, we should see a crossover of the 5-period above the 10-period EMA. At the crossover, the RSI and Stochastic lines should head upwards but so much that they move into the overbought zone.

The below image shows the crossover of both the EMAs that is accompanied by a ‘moving down’ RSI and Stochastic.

Step 3: Let us discuss the ‘entry’ of the strategy. We enter the market after a confirmation candle in the direction of the reversal. That means we enter ‘short’ after the close a bearish candle below both the EMAs. Similarly, we go ‘long’ after the appearance of a bullish candle, where the price closes above both the EMAs.

We can see in the below image that we are entering the market for a ‘sell’ right after at the close of the price below the 10-period EMA.

Step 4: In this step, we determine the stop-loss and take-profit for the strategy. The stop-loss is pretty straight forward where we place it just above the ‘highest’ or ‘lowest’ point. We take our profit and exit the position based on the signal provided by RSI. There two ways to exit the strategy. The first signal provided by the market to exit is when the crossover of the EMAs takes place. The second way to exit is when the RSI starts moving higher and crosses above the level of 50.

In the case of EUR/USD, as shown below, we take our profits when both the indicators indicated a reversal of the trend.

Final Words

The strategy actually generates various entry signals, and each of them can at least result in a profit for scalpers, by running very tight stops and keeping risk low. Thus, the strategy makes a reliable reversal trading system which relatively accurately pinpoints reversal points at the end of a trend and, more importantly, the ability to provide high risk-to-reward (RR) trades.

Categories
Forex Basic Strategies

Learning To Trade The Forex Market Using ‘2-Period RSI’ Trading Strategy

Introduction

When we look for a trade setup, most of the times we do not have an idea of the strategy, we will be using for taking a particular trade. From there, we start to pick random indicators and start trading using those indicators without a proper strategy associated with that indicator. With our 2-Period RSI strategy, we will solve this confusion by looking at the market with a systematic approach that involves using the RSI indicator. In addition to the RSI indicator, we will also use a 20-period EMA. Most importantly, we will look to take trades in the direction of the main trend.

Now that we know what our goals are, we will look into the various parameters of the strategy and understand how to apply the same.

Time Frame

This strategy works well on the 5-minutes and 15-minutes time frame. This is a perfect intraday trading strategy.

Indicators

The strategy uses RSI as its major indicator. We also use the EMA for identification of the trend. Both the indicators are applied with their default settings.

Currency Pairs

This strategy is applicable to most of the currency pairs listed on the broker’s platform. However, illiquid pair should be completely avoided.

Strategy Concept 

The concept of the strategy is very simple if we have a clear understanding of the previously discussed strategy. The basic idea of here is to trade the retracement of an established trend. Therefore, the strategy can only be used when the market is trending. Once the trend has been identified, we wait for a ‘pullback’ in the price and then take an ‘entry’ in the direction of the market after a suitable confirmation. The Relative Strength Index (RSI) is an important indicator in this strategy which helps us in measuring the over-extended phase of the retracement.

A reading above 70 indicates an over-extended ‘up’ move while a reading below 30 indicates an over-extended ‘down’ move. In an uptrend, we will look for a retracement that is overextended, implying that the RSI should be below 30. While in a downtrend, we will look for a retracement that is overextended, implying that the RSI should be above 70. The crucial part of the strategy is that we don’t enter for a ‘buy’ or ‘sell’ soon after the RSI gives an indication, but instead wait for a sign of reversal that confirms the continuation of the trend.

Trade Setup

In order to explain the strategy, we will be taking a ‘long’ trade in the GBP/USD currency pair on the 5-minutes chart using the 2-period RSI strategy.

Step 1

The first step is to identify the major direction of the market. Many technical indicators help in identification of the trend, but the one that is suitable for this strategy is the EMA. We will identify the trend of the market using the 20-period EMA, which is best suited as per the conditions of the strategy.

In our example, we have identified an uptrend whose retracement shall be evaluated.

Step 2

Next, we need to wait for the market to turn from its highest or lowest point, depending on the trend, and then check if that is a retracement or a reversal. After the price starts to pull back, we wait until the RSI shows a reading below 30, in an uptrend and above 70, in a downtrend. Once that happens, we become alert and watch the price cautiously.

Step 3

Now we wait for the price to reverse and close above the 20-period EMA, in an uptrend and close below the EMA, in a downtrend. Ensuring this step is critical as it confirms the continuation of the trend. We enter the market with an appropriate position at the close of the candle. There are two ways of entering the market. One, wait for the candle to close and then enter. Second, enter at the crossing of the price above or below the EMA. The second approach is an aggressive form of ‘entry’ and is not recommended for everyone. There is also a conservative form of entry, that is entering at the re-test of the EMA.

In the below image, we can see that we are entering at the close of the bullish candle above the EMA. But since the candle is long and has a large body, the ‘entry’ price is much higher than what we were looking for.

Step 4

Finally, we determine the stop-loss and take-profit for the strategy. The stop-loss is placed below the ‘low’ from where the market reverses and starts moving higher in case of a ‘long’ trade. In a ‘short’ trade, it will be placed above the ‘high’ from where the market reverses and starts moving lower. Since we are trading with the trend, the ‘take-profit’ can be set at the new ’high’ or ‘low’ that will result in a higher risk-to-reward ratio.

In our case, the risk-to-reward ratio of the trade is just 1:1 since we took a late ‘entry.’

Strategy Roundup

We are making use of the RSI indicator in a most constructive way which helps us in identifying when the market is overbought or oversold. Using the concept of trends, we are applying the strategy to reduce risk and maximise gains. The rule for entering the market in this strategy is what stands out. We are entering only after getting clear signs of confirmation from the market. We can also trail our stop-loss and exit when we get signs of another reversal. This is an aggressive way of taking profit and is mostly done to increase the gains.

Categories
Forex Basic Strategies

How to Profit Using The ‘Gap and Leave’ Forex Trading Strategy

Introduction

Gap and Leave is an interesting trading strategy that utilizes one of the most distressing phenomena of the forex market, a weekly gap between the last Friday’s close and the current Monday’s open price. The gap takes its origin in the fact that the interbank currency market continues to react on the fundamental news during the weekend, which results in a kind of opening on Monday at the highest level of liquidity. Today’s strategy is based on the assumption that the gap is a result of speculations and excess liquidity. Therefore, a position in the opposite direction should become profitable after a few hours.

In the past few articles, we discussed strategies that were pertaining to ‘trend pullback.’ Now, we will shift our focus and talk about a strategy that is best suited for trading a ‘range.’

Time Frame

This strategy works well on the 15-minutes and 1-hour time frame. Traders looking to trade intraday should use the strategy on the 15-minutes time frame. While traders looking for swing trading opportunities should look at 1-hour charts.

Indicators

No indicators are being used in this strategy. It mostly relies on price action and market speculation.

Currency Pairs

This strategy is suitable for trading in currency pairs, which are volatile and liquid. Also, since the Asian market is the first one to open for trading after the weekend, we would suggest applying this strategy in currency pairs involving the Japanese yen, Australian dollar, and the New Zealand dollar.

Strategy Concept

Gap and Leave is an easy strategy that is based on simple price action and speculation. It is observed that events and occasions that occur during the weekend give rise to unfilled orders in the market, which leads to a gap on Monday. This gap is a result of speculation and sudden infusion of liquidity in the market, as an outcome of the event. Most of these events are not of great importance, which means they do not have long-lasting on the value of a currency.

This characteristic can be used to our advantage by entering at discounted prices. Here it is important to note that the gap should coincide with a technical level of support and resistance. As mentioned earlier, this is a ‘range’ trading strategy. The price must reach the extremes of the ‘range’ as a result of the ‘gap.’ The idea is to go ‘long’ at support and ‘short’ at resistance. But this is done by following all the rules of the strategy.

The strategy offers a high risk-to-reward since we are executing our trades at the lowest prices, keeping a target at the other end of the ‘range.’

Trade Setup

In order to explain the strategy, we shall consider an example where we will execute a ‘long’ trade-in GBP/NZD pair on the 15-minutes time frame. Here are the steps to execute the strategy.

Step 1

Firstly, we should identify a ‘range’ that is newly formed. By this, we mean, the price should have reacted from the top or bottom of the range at least twice and moved to the other end. At the same time, we need to also ensure that the ‘range’ is not very old. We should not be considering ‘ranges’ where the support and resistance levels have been respected more than 5-6 times.

In our example, we have identified a ‘range’ on the 15-minutes time frame where the price has reacted twice from the resistance and four times from the support.

Step 2

The next step is to watch for Friday’s closing price. The candle must close somewhere in the middle of the range. This is because if the market has to gap on Monday, the gap will take the price at one of the extremes of the range. If the candle closes at support or resistance on Friday, the price gap will lead to a breakout or breakdown that will violate the ‘range’ trade. Then we should look for a breakout strategy.

In the case of GBP/NZD, we can see that the price almost closes in the middle of the range.

Step 3

This is the most important step in the strategy. In this step, we watch the market’s behavior on Monday and see if it opens with a gap or not. If the market gaps down to the support of the range, we will look for taking a ‘long’ trade after a suitable confirmation. On the other hand, if the market gaps up to the resistance, we will take a ‘short’ trade provided we have followed all the steps discussed earlier. A bullish candle after ‘gap down’ is the confirmation for a ‘long’ trade, and a bearish candle after ‘gap up’ is the confirmation for a ‘short’ trade.

In the below image, we can see that the price forms a bullish candle after gapping down on Monday. Hence, we enter for a ‘buy’ at this close of the first candle.

Step 4

Lastly, we need to determine the stop-loss and ‘take-profit’ for the strategy. Stop-loss placement is pretty simple, where it is placed below the support when ‘long’ in the market and above the resistance when ‘short.’ We take our profits when the price reaches the other end of the range. This means at resistance when ‘long’ and at the support when ‘short.’ The risk-to-reward of trades using this strategy is above average, which is quite attractive.

Strategy Roundup

Gaps are one of the most common tools used by institutional traders due to the high probability of winning trades. This strategy is based on market movement that is only a consequence of speculation, which does not hold any value. If we are looking for a gap trading strategy in forex, the Gap and Leave strategy is a good one to start with because it is great for beginners who want a relatively easy entry, at a slow pace and not involving complex indicators.

Categories
Forex Basic Strategies

Exploring The Forex Market Opportunities With The Help of ‘Volume’

Introduction

In the Forex market, we don’t really have a centralised exchange as we’re trading over the counter. This is the reason why it is so difficult to determine exact trading volumes in Forex. Even though there is no centralised exchange to provide us with the volume data, many forex broker’s and trading platforms keep track of the average volumes in a pair. Each retail broker will have their own aggregate trading volume. Platforms like TradingView also have a volume attached to their chart. We all have realised over time that volume in the forex market is an important indicator, which is the reason why we need the best volume indicator.

The volume indicator used to read the volume in the forex market is the Chaikin Money Flow indicator (CMF.) The CMF was developed by Marc Chaikin, who is a trader himself, and was coached by the most successful institutional investors around the world. The reason Chaikin Money Flow (CMF) the best volume indicator is that is measures institutional accumulation and distribution.

Normally, on a rally, the Chaikin volume indicator should be below zero. Conversely, on sell-offs, the indicator should be below the ‘zero’ line.

Time Frame

The strategy works well on the 1-hour and 4-hour time frame only. Therefore, we can say that it is a swing trading strategy and is not suitable for trading intraday.

Indicators

We will be using just one indicator in this strategy, and that is the Chaikin Money Flow indicator (CMF.) The rest all is based on price action.

Currency Pairs

The strategy is suitable for trading in almost all currency pairs that are listed on the broker’s platform. But we need to make sure that the forex pair has enough trading volume.

Strategy Concept

Volume trading requires us to pay careful attention to the forces of demand and supply. Volume traders look for instances of increased buying or selling orders. They also pay attention to the current price movement and trend of the market. Generally, increased trading volume leans towards heavy buy orders. These positive volume trends will prompt us to open new positions on the ‘long’ side of the market, depending on the price action.

On the other hand, if trading volumes and cash flow decrease—it indicates a “bearish divergence. This may be appropriate to sell. We will pay attention to the relative volume—regardless of the number of transactions occurring in a trading period. By learning how to use the Chaikin money flow and other relevant indicators, we will be able to identify whether to ‘buy’ or ‘sell.’

With practice, the volume trading strategy can yield a win rate of 75%!

Trade Setup

In order to explain the strategy, we have considered the chart of EUR/USD, where we will be illustrating a ‘long’ trade using the rules of the strategy.

Step 1

Firstly, look for a price reversal in the market or a price action that reverses an established downtrend or uptrend. This is an easy and simple step that requires us to have a basic understanding of price reversal. This reversal should be accompanied by the rising Chaikin volume indicator that shoots up in a straight line from below zero to above the ‘zero’ line, during the reversal of a downtrend. In an uptrend, the slope should be downwards, i.e., from positive to negative.

When the volume indicator goes negative to positive in a strong fashion, it shows an accumulation of smart money.

Step 2

Wait for the price to pullback near the previous lower low after an upward reversal. Likewise, wait for the price to pullback near the previous higher high. The Volume Indicator should also pullback in a similar manner. If the pullback is coming in slowly, the trade has a higher probability of performing. If the pullback is strong, we will exercise some caution.

When the volume indicator is decreasing and drops below zero, we have to make sure that the price remains above the swing low. If the market is satisfying all the conditions of the strategy until now, we can move on to the next step.

Step 3

Wait for the Chaikin volume indicator to break back above the zero lines. We enter for a ‘buy’ once a ‘higher low’ is confirmed, and the price starts moving in the direction of the reversal. In a reversal of an uptrend, the Chaikin indicator should break below the ‘zero’ line. We enter for a ‘sell’ once a ‘lower high’ is confirmed, and the price starts moving lower. Once the institutional money comes back in the market, we wait for them to step back and drive the market.

The below image shows a ‘higher low’ being formed along with the volume breakout.

Step 4

This brings us to the next important step, where we establish protective stop-loss and take-profit for the strategy. We place stop-loss below the ‘higher low’ that confirmed the reversal when ‘long’ in the pair and above the ‘lower high ‘when ‘short’ in the currency pair. This strategy indicates a strong reversal in the market that will change the trend of the market. This is why we set our ‘take-profit’ at the origin of the previous trend.

In our example, the risk-to-reward of the trade was over 1:2, which is great.

Strategy Roundup

The volume trading strategy will continue to work in the future; it is based on the activities of the smart money. Even though they hide all their operations, their footprints are still visible. We can read those marks by using proper tools. The Chaikin indicator will add value to our trading because it gives a window into the volume activity the same way we traded the stocks. Make sure to follow this step-by-step guide to trade properly using volume.

Categories
Forex Basic Strategies

Learning To Trade The ‘Turn To Trend’ Forex Strategy

Introduction

Although many times before, we have stressed on trading with the direction of the market, yet most traders have a hard time trading with the trend. The observation is contrary to what is said by experts and professional traders since the majority of retail traders claim to be trading with the trend but end up trading counter-trend. While everyone talks of the idiom, “the trend is your friend,” in reality, most traders love to pick tops and bottoms and constantly violate the above rule.

Time Frame

The strategy is fixed to two-time frames. The daily time frame for trend identification and the 1-hour time frame for trade entry.

Indicators

We use the following technical indicators for the strategy:

  • 20-period SMA
  • Three standard deviations Bollinger band (3SD)
  • Two standard deviations Bollinger band (3SD)

Currency Pairs

This strategy is applicable to most of the currency pairs listed on the broker’s platform. However, exotic pairs should be avoided.

Strategy Concept

This setup recognizes the desire of most traders to buy low and sell high but does so in the predominant framework of trading with the trend. The strategy uses multiple time frames and a couple of indicators as it’s a tool for entry. First and foremost, we look at the daily chart to ascertain of the pair in a trend. For that, we use the 20-period simple moving average (SMA), which tells us the direction of the market. In technical analysis, there are numerous ways of determining the trend, but none of them is as simple and easy as the 20-period SMA.

Next, we switch to the hourly charts to find our ‘entry.’ In the ‘Turn to Trend’ Strategy, we will only trade in the direction of the market by buying highly oversold prices in an uptrend and selling highly overbought prices in a downtrend. The question arises, how do we know the market is overbought or oversold? The answer is by using Bollinger bands, which help us gauge the price action.

Bollinger bands measure price extremes by calculating the standard deviation of price from its moving average. In our case, we use the three standard deviation Bollinger band (3SD) and Bollinger band with two standard deviations (2SD). These two create a set of Bollinger band channels. When price trades in a trend, most of the price action will be contained within the Bollinger bands of 2SD and 1SD.

Trade Setup

In order to illustrate the strategy, we have considered the chart of EUR/CAD, where we will be applying the strategy to take a ‘long’ trade.

Step 1

The first step is to identify the major trend of the market. This can be done using the 20-period simple moving average (SMA). If the price is very well above the SMA, we say that the market is in an uptrend. Likewise, if the price is mostly below the SMA, we say that the market is a downtrend. For this strategy, we have to determine the trend on the daily chart of the currency pair.

In our case, we see that the market is in a strong uptrend, as shown in the below image. Hence, we will enter for a ‘long’ trade at the price retracement on the 1-hour time frame.

Step 2

Next, we have to change the time frame of the chart to 1 hour and wait for a price retracement. In order to evaluate the retracement, we plot three standard deviations (3SD) and two standard deviations (2SD) Bollinger band on the chart. After plotting the two Bollinger bands, we need to wait for the price to get into the zone of 2SD-3SD BB.

In the below image, we can see that the price breaks into the zone of 2SD-3SD BB after a lengthy ‘range’ movement.

Step 3

Once the price moves into the zone of 2SD-3SD BB, we wait for the price to bounce off from the lower band of the 3SD BB to give an indication of a reversal. In a ‘short‘ set up, the price should react off from the upper band of the 3SD BB, and give an indication of downtrend continuation. During this process, we need to make sure that the price does not break below or above the 3SD BB. Because if this happens, the ‘pullback’ is no more valid, and this could be a sign of reversal. This is a crucial aspect of the strategy.

The below image shows how the price bounces off from the lower band of the 3SD BB two candles after the price moves into the zone.

Step 4

We enter the market at the first sign of trend continuation, which was determined in the previous step. Now we need to define the stop-loss and take-profit for the strategy. Stop-loss should be placed below the lower band of the 3SD BB, in case of a ‘long’ trade and above the upper band of the 3SD BB, in a ‘short’ trade. The ‘take-profit’ is not a fixed point. Instead, we take our profit as soon as the price touches the opposite band of the 3SD BB.

In the case of EUR/CAD, the resultant risk-to-reward of the trade was a minimum of 1:2, as shown in the below image.

Strategy Roundup

The beauty of this setup is that it prevents us from guessing the turn in the market prematurely by forcing us to wait until the price action confirms a swing bottom or a swing top. If the price is in a downtrend, we watch the hourlies for a turn back to the trend. If the price continues to trade between the 3SD and 2SD BB, we stay away as long as we get confirmation from the market. We can also set our first take-profit at 1:1 risk to reward to lock in some profits.

Categories
Forex Basic Strategies

Reliable Way To Make 30-Pips A Day In The Forex Market

Introduction

The 30 pips a day is a trading strategy that is based on market continuation pattern. This strategy is very profitable and has a long history of providing a substantial gain. Therefore, if you can implement this strategy well, you can make a decent profit from the forex market. This strategy is focused on a quick gain from the market; therefore, the currency pair that usually make a fast move is recommended for this strategy.

In this trading strategy, we will use the following elements:

  • 10 EMA and 26 EMA to identify the market direction. The main reason for using the Exponential Moving average over the simple moving average is that it provides the most reliable result in a short timeframe.
  • We will use 5-minute timeframe for trading as our focus is to make a quick gain from a short move.
  • We will implement the strategy in GBPJPY pair as it provides fast move in a short timeframe.

30 Pips a Day Trading System

In this trading strategy, we will consider the trend as an uptrend if the 10 EMA crosses the 26 EMA. Similarly, we will consider the trend as a downtrend if the 10 EMA crosses the 26 EMA. The reason for choosing the GBPJPY pair is that it has a higher daily movement compared to the other major currencies. GBPJPY pair can move 100-200 pips a day while most of the major currency pairs can move 60-100 pips a day.

However, our aim is not to catch every move during the day. Instead, we will focus on a little part of it, like 30 pips. That’s why the name of this trading strategy is 30 pips a day. In this trading strategy, the Potential Trading Zone is significant.

What is the Potential Trading Zone?

It is the zone where we will make trades based on our trading element. It is usually the reversal zone from where the price is likely to reverse from the current direction. Therefore, we will make the buying and selling decision at this zone depending on the current market trend.

In the above example, we can see that the major trend of the currency pair down. Despite the downtrend, the price will move up with a corrective speed, which is a minor counter-trend rally. In the 30 pips a day trading strategy, we will focus on the minor trend reversal movement and wait for the price to return to the major trend.

We can find the same market movement in the uptrend where the price will come down with a corrective speed. Later on, we will focus on the price zone from where the price is likely to resume its major trend.

Sell Setup Using the 30 Pips a Day Trading Strategy

  • Identify the major trend. If the primary trend is down, we will focus on sell trades only.
  • Find the location of price where 10 EMA crosses down the 26 EMA.
  • Do not sell immediately after the crossover. Wait for the price to make a retracement.
  • Enter the sell as soon as the candle crosses the potential trading zone halfway between the 10 and 26 EMA.
  • Stop-loss should be 15-20 pips.
  • Take profit should be 30 pips.

Example of 30 Pips a Day Sell Setup

In the above image, we can see that the 10 EMA crossed below the 26 EMA and moved up. The crossover is the first indication of sell entry. Later on, the trade setup comes as soon as price creates a bearish candle after a bullish rejection.

Buy Setup Using the 30 Pips a Day Trading Strategy

  • Identify the major trend. If the major trend is bullish, we will focus on buy trades only.
  • Find the location of price where 10 EMA crosses above the 26 EMA.
  • Do not buy immediately after the crossover. Wait for the price to make a retracement.
  • Enter the buy as soon as the candle crosses the potential trading zone halfway between the 10 and 26 EMA.
  • Stop-loss should be 15-20 pips.
  • Take profit should be 30 pips.

Example of 30 Pips a Day Buy Setup

In the above image, we can see that the 10 EMA crossed above the 26 EMA and moved down. The crossover is the first indication of buy entry. Later on, the trade setup comes as soon as price creates a bullish candle after a bearish rejection.

Alternative Trading Entry for 30 Pips a Day

  • If you don’t have enough time to manage your trade, you can simply use a pending order.
  • Once the candlestick comes back after the primary crossover, wait for a reversal candle to appear. Later on, place a buy stop or sell stop above or below the reversal candlestick.
  • You can place the stop loss above or below the candle high or low with some buffer. However, you can use the nearest swing points as a stop loss level also. Moreover, to take profit, you can set it to 30 pips.

Pros and Cons of 30 Pips a Day Trading Strategy

Like other trading strategies, 30 pips a day trading strategy has both strength and weakness.

Pros

  • As the GBPJPY pair is very volatile, it is straightforward to make 30 pips daily.
  • In a trending market, this strategy works well.
  • This strategy works well in Asian and London Session.

Cons

Summary

Let’s summarize the 30 pips a day trading strategy:

  • Identify the trending market in the GBPJPY pair.
  • Move to the 5-minute chart and identify a market where 10 EMA crosses the 26 EMA.
  • Wait for correction and enter the trade as soon as market rejects from the potential trading zone.
  • Set stop loss at 15-20 pips and take profit at 30 pips.

In every trading strategy, trade management is an important part. In the forex market, we anticipate the movement of various currency pairs and every pair moves in a different way. Therefore, if you face some consecutive losses, it is better to take a break from trading and enter the trade again as soon as the market starts to move as you expect.

Categories
Forex Basic Strategies

The ‘Daily High Low’ Based Forex Trading Strategy

Introduction

The daily high low based forex trading strategy is a breakout trading strategy from the high and low prices in the daily timeframe. In forex trading, the daily timeframe is crucial as most of the significant market players use this time table in their trading. As a result, any trading strategy in the daily time frame provides better trading results compared to the lower time frame.

On the other hand, when the price creates a rally by breaking the high and low price of the daily timeframe will indicate a significant market momentum. If you can avoid the range market, the high low based strategy can provide a reliable trading result. If you can implement the trading strategy well as per the rule mentioned below, you can make a decent profit from it in any currency pair.

The Daily High Low Based Trading Strategy

The daily high low based forex trading strategy has a simple concept:

  • If the price breaks below the low of yesterday’s candle, it may move further low.
  • If the price breaks above the high of yesterday’s candle, it may move further high.

It is a standard brief of this trading strategy. Let’s have a look at the image below:

In this image above, the price has made a new higher high once it breaks above the candle high in the market area. However, there is some market condition where price moves to a range and violates the movement above or below the candle high.

If you are trading the breakout of a daily candlestick that is larger than the earlier candlesticks, you might be caught by the mean reversion of the price. In the forex market, it is often difficult to predict how long a trend could stay. Almost 70% of the time, the market moves within a range; therefore, you should find a location of the price where the breakout from a daily candle would be reliable.

The basic concept of making a good profit from the forex market is to buy from low and sell from high. Therefore, any bullish breakout from a significant support level in a daily timeframe would indicate a reliable daily breakout strategy compared to a trade setup from the middle of a trend. Let’s have a look at the image below, how the price moved up once it got a breakout from a daily candle from a significant support level.

Now look at the image below and see how the price violates the daily breakout to the upside once it reached above 50% of the possible trend.

How to Trade the High Low Breakout Strategy?

This trading strategy is simple as you can make most of the trading decision a day before the movement is expected. The main of this trading strategy is to place two pending orders above or below the yesterday candle. Therefore, you can catch any movement either upside or downside from the previous day’s candle.

Timeframe

We should consider the daily timeframe to determine the high and low prices. Later on, move to the lower timeframe (usually H4) to enter the trade. However, for new traders, it is recommended to stick to the daily timeframe.

Currency Pairs

This trading strategy works well in all currency pairs, including EURUSD, GBPUSD, USDJPY, or AUDUSD. However, sticking to the major and minor currency pairs would provide a better trading result. Moreover, you should avoid exotic pairs as there is a risk of the false move by hitting the high or low and reverse back.

Breakout Rules

  • Identify the currency pair that is moving within a trending environment. You can predict the direction of the price based on the market context or support and resistance.
  • For example, suppose the price is aggressively creating a higher high or lower low. In that case, the price will likely continue the current momentum until it reaches the next resistance or support level. Moreover, any breakout from a significant key level often creates a fresh move either upside and downside.
  • When the daily candle of the previous day closes, place a buy stop above the daily high, and a sell stop below the daily low to catch the breakout.
  • Move your stop loss at 50% of the daily candle.
  • For the take-profit level, you can consider the average price of the last three days’ movement. For example, if the daily candle of the last three days shows the movement of 100 pips, 50 pips, and 100 pips, the total movement would be 250 pips (100+50+100). Therefore, the average price of the last three days would be 83 pips (250/3).

Example of Daily High Low Based Trading Strategy

The image below represents the graphical view of the daily high low based trading strategy:

  • In the image above, we can see the price moved up from a significant support level with a daily close above it. A buy Stop is taken once the price had a bullish daily close from the key support level. A similar concept will apply to the bearish market once the price has a daily close from a significant resistance level.
  • The next day, the buy stop is taken, and the price moved to the take profit level. The take profit level is taken by calculating the average price of the last three candles.
  • The stop loss is set at 50% of the previous day’s candle. If the stop loss hit, it will indicate that the price will reverse or consolidate more. In that case, we should wait for a further breakout or move to another currency pair.

Summary

Let’s summarize the daily breakout trading strategy:

  • Identify the currency pair that is moving within a trend or likely to start a new trend.
  • Set buy stop above the candle if the price is moving up from a support level and put a sell stop if the price is moving down from a resistance level.
  • Stop-loss should be at 50% of the previous day’s candle.
  • Take profit will be the average price of the last three days’ movement.

In this trading strategy, the challenge is to avoid correction and choppy market. In that case, you should read the price action to determine the possible movement by measuring the price momentum. Moreover, to get the maximum benefit from this trading strategy, follow strong money management rules.

Categories
Forex Basic Strategies

Catch the Breakout with 34 EMA Trading Strategy!

Introduction

The exponential moving average (EMA) is a specialized chart indicator that tracks the value of an asset over time. It is a sort of weighted moving average (WMA) that provides more weighting or significance to ongoing valuable information. As like the simple moving average, the exponential moving average is utilized to see value patterns over time, and observing a few EMAs at one time is simple to do with moving normal rebinds.

What Is an Exponential Moving Average (EMA)?

An exponential moving normal (EMA) is a kind of moving average (MA) that puts a more noteworthy weight and sharpness on the latest information points. The exponential moving average is likewise alluded to as the exponentially weighted moving average. An exponentially weighted moving average responds more essentially to ongoing value changes than a straightforward moving average (SMA), which applies an equivalent weight to all observations in the period.

In the below image, you can see a naked chart of EURUSD

Now let’s plot the exponential moving average in the chart to see how it looks like

The Formula of Exponential Moving Average (EMA)

EMAToday = 
(ValuetToday ∗ (Smoothing / 1+Days)) + EMAyesterday * (1 - (Smoothing / 1+Days))
Where: EMA = Exponential Moving Average 

While there are numerous potential choices for the smoothing factor, the most widely recognised choice is 2

That gives the latest observation exceeding weight. In the event that the smoothing factor is expanded, later observations have more effect on the EMA.

Calculating the EMA

Calculating the EMA needs one more inspection than the SMA. Assume that you need to utilise 34 days as the number of inspections for the EMA. At that point, you should hold up until the 34th day to gain the SMA. On the 35th day, you would then be able to utilise the SMA from the earlier day as the first EMA for yesterday.

The calculation for the SMA is clear. It is essentially the entirety of the stock’s closing prices during a time span, divided by the number of inspections for that period. For instance, a 34-day SMA is only the entirety of the closing value for the previous 34 trading days, parted by 34.

34 EMA with Trendline Breakout Strategy

By combining the exponential moving average indicator with the price action context, the 34 EMA with trend line breakout forex trading strategy has established. In a decent trending market, this forex trading system is an entirely dependable trading strategy that can pull in plenty of pips effectively into your forex trading account.

To demonstrate it, simply proceed to do a little backtest on previous price history, and you will perceive what I’m discussing after you’ve learnt the trading methods and layouts which are additionally clarified underneath.

Timeframes

The 34 exponential moving average trading technique functions admirably in all timeframes from 5 minutes to weekly charts. The higher time frames can give better trading outcomes. However, it is best to stay on the 1 hour to daily chart as it can give high accuracy trades.

Currency Pair

There are no rules to utilise a currency pair. Still, it is good to utilize a forex pair that often remains in the range, for instance, EURUSD. However, all major and minor forex pairs are free to go with this trading technique.

Buy Entry 

  • First, draw a downward trend line and look for an upward breakout.
  • If the breakout has happened, then the price must be residing above the 34 EMA.
  • After the downward trend breakout has happened, look at the highs of the bullish candlestick that form.
  • The signal candle is the candle with a high that is lower than the last candle’s high. So, if the signal candle’s high is broken, at that point, enter a buy trade immediately. On the other hand, you can put in a buy stop order only a couple of pips over the high of that signal candle so if the price breaks signal candle’s high, your order will be placed.
  • If your buy stop order isn’t executed and the candles keep on making lower highs, move your buy stop order to every lower high candle that structures until the price goes up and executes your trade.
  • It’s always better to place a stop loss below the downward trend line breakout candle.

Sell Entry

  • First, draw an upward trend line and look for a downward breakout.
  • If the breakout has happened, then the price must be residing below the 34 EMA.
  • After the upward trend breakout has happened, look at the lows of the bearish candlestick that form.
  • The signal candle is the candle with a low that is higher than the last candle’s low. So, if the signal candle’s low is broken, at that point, enter a sell trade immediately. On the other hand, you can put in a sell stop order only a couple of pips over the low of that signal candle so if the price breaks signal candle’s low, your order will be placed.
  • If your sell stop order isn’t executed and the candles keep on making higher lows, move your sell stop order to every higher low candle that structures until the price goes down and executes your trade.
  • It’s always better to place a stop loss above the upward trend line breakout candle.

Limitations of the EMA

It is hazy whether or more emphasis ought to be put on the latest days in the timeframe. Numerous traders accept that new information better mirrors the current pattern of the asset. Simultaneously, others feel that overweighting current dates makes a preference that prompts to more bogus alarms.

Correspondingly, the EMA depends completely on authentic information. Numerous economists suspect that business sectors are proficient, which implies that current market value meanwhile mirrors all accessible data. If the markets are actually proficient, utilising authentic information should disclose to us nothing about the upcoming movement of security prices.

Summary

Let’s summarise the 34 exponential moving average with trendline breakout trading strategy:

  • You should look for an impulsive trendline breakout.
  • After the trendline breakout has happened, the price must be above or below the 34 EMA (depending on buy and sell entry).
  • It’s always better to put the stop loss below or above the trendline breakout candle.
  • Better money management can give you a better risk/reward ratio.

Moreover, you need to practice this trading strategy until your win ratio reaches above 60 per cent, and you must have to control your emotion and psychology for better outcomes.

Categories
Forex Basic Strategies

Let’s Learn Some Momentum Trading Techniques Using The Awesome Oscillator

Introduction

Bill Williams was the one to first developed the Awesome Oscillator, and it essentially indicates the market momentum. On the other hand, RSI (Relative Strength Index) is a trading indicator that provides an idea of the overbought and oversold zone. In the Awesome Oscillator based trading strategy, we will use the Awesome Oscillator to determine the market direction and use the RSI to increase the probability by eliminating unwanted market movements.

The Awesome Oscillator

Bill Williams has created the Awesome Oscillators to identify the market momentum of a currency pair. Besides the forex market, this trading strategy works well in all financial markets, including the stock, indices, cryptocurrencies, and commodities. The elements of this trading indicator are pointed out in the image below.

  • The first element of Awesome Oscillator is the 34 period’s simple moving average indicating the median of the last 34 candlesticks.
  • 5-period simple moving averages indicate the median of the last five candlesticks.
  • Histogram and Zero Line.

Let’s have a look at how these elements represent in a market:

  • When the Awesome Oscillator is below the zero lines, we should focus on the short term moving average. If the 5 SMA moves below the 34 SMA, it will indicate a downtrend.
  • If the position of Awesome Oscillator is above the zero lines, we can consider the trend as an uptrend.
  • If the Awesome Oscillator histogram moves to the green zone, we can consider the candlestick that moved higher than the previous candle.
  • We will consider the histogram at the red zone that is smaller than the previous candlestick.
  • The rules mentioned above are not exact buying and selling signals. Instead, it provides a trading opportunity where traders should consider other confirmations.

We can also identify the divergence between the price and the Awesome Oscillator to find a trading opportunity.

If you see the price of a currency pair to make a lower low from the left side to the right side, but the Awesome Oscillator makes the opposite, you can find a potential divergence. In divergence, the Awesome Oscillator should create two peaks above the zero lines considering the market condition.

Awesome Oscillator with RSI Trading Strategy

In this trading strategy, we will combine the Awesome Oscillator to identify the market momentum and the Relative Strength Index to get the overbought or oversold zone. If we can combine these accurately, we can make a trading strategy that can provide a good profit.

This strategy works very well in most of the currency pairs and time frames. Therefore, we can take swing trade, day trade, and even position trade. Besides the technical formation using these two indicators, we will use price action to enter the trade. Moreover, we will use stop loss and take profit as a risk management tool before taking the trading decisions.

Now let’s move to the trading strategy. In the image below, we can see the visual representation of how to trade using the Awesome Oscillator RSI trading strategy. The rules for buying and selling of a currency pair are mentioned below:

Buy Trade Setup

  • At first, the RSI should be below the 30 levels and point to an upward reversal.
  • When the RSI moves above the 30 levels, we will consider buying signals only if the Awesome Oscillator shows a green bar.
  • When the green bar appears, we can place a buy stop about 2- 5 pips above the current candlestick and allow the price to take our trade automatically.
  • Sometimes RSI might signal 1-2 candlestick later than the Awesome Oscillator. In that case, we can consider trading entry by taking a smaller lot.

Sell Trade Setup

  • At first, the RSI should be above the 70 levels and point to a downward reversal.
  • When the RSI moves below the 70 levels, we will consider selling signals only if the Awesome Oscillator shows a red bar.
  • When the red bar appears, we can place a sell stop about 2- 5 pips below the current candlestick and allow the price to take our trade automatically.
  • Sometimes RSI might signal 1-2 candlestick later than the Awesome Oscillator. In that case, we can consider trading entry by taking a smaller lot.

In this strategy, we did not consider the histogram crossing zero lines. However, suppose you want to increase the probability of your trading. You can look at the zero line cross as a further trading condition that will indicate the overbought and oversold zone.

Stop Loss And Take Profit Idea

The stop loss and take profit idea is a vital element of any trading strategy. There are many ways to set take profit and stop-loss depending on the market swing low and Sewing high. In a buy trade setup, the stop loss should be below the recent swing low with 10 to 15 pips buffer. Similarly, in a sell trade, the stop loss should be above the recent swing high with 10 to 15 pips buffer.

Another idea of a stop-loss plan is to set it at 1.5X ATR. It will indicate the actual volatility of the currency pair that you are trading. Besides the stop-loss setting, take profits can be set with a multiple-level approach. You can hold your position until the Awesome Oscillator crossed above or below the zero lines. Later on, you can monitor the momentum of the price to identify the next take profit level.

Summary

Let’s summarise the awesome oscillator and RSI trading strategy:

  • If the RSI is above the 70 levels and points downward movement, we will consider selling setups only, and if the RSI starts to move from the 30 levels, we will consider buying only.
  • To enter the trade, we can take a pending order above or below the previous candle if other conditions meet.
  • The stop loss should be below the swing low or swing high with some buffer or at 1.5 X ATR.
  • For setting take profit, you can hold the trade until the Awesome Oscillator crosses above or below the zero lines. Moreover, if the market conditions allow you to extend the take profit.

In every trading strategy, trade management is an essential tool that a trader should not ignore. In the forex market, we anticipate the price based on our technical and fundamental analysis. As we trade on probabilities, there will be conditions where the market will hit our stop loss. Therefore, strong trade management is the only way to keep your balance steady growth.

Categories
Forex Basic Strategies

Forex Momentum Trading With The Help of RSI & MA Indicators

Introduction

If you are a trader, you should have some good ideas about the forex market. After having the basic knowledge and related stuff, you, as a trader, need to find a profitable forex strategy. After that, you need to find a proven track record of your strategy.

Therefore, you can easily implement it and start earning through your trades within a short time. However, it would help if you kept in mind that the forex is an uncertain and unstable trading market. Therefore, you must have a profitable and excellent trading strategy if you want to sustain here.

If you search on the internet, you will find thousands of proven strategies out there. The good thing is that experienced traders or mathematicians have created most of the strategies. You have to choose the best one for you.

However, the momentum-based strategy is profitable and famous too. Lots of traders are using this one as their primary trading strategy. However, if you find another suitable strategy, you can go for it besides the momentum trading strategy to boost your probability.

What is The Momentum Trading Strategy?

Momentum is a term that refers to buying a currency pair when it goes up and selling when it goes down. It is a very popular trading strategy among most professional traders.

When a big volume starts a movement, it creates a reliable market trend. Therefore, market momentum will be towards the trend that we can identify by reading the chart. In a strong bullish momentum, the price will aggressively create higher highs with a constant speed.

Similarly, in a strong bearish momentum, the price will create lower lows. After identifying the market momentum, we will move to one timeframe lower to take the trade.

However, forex trading always has an uncertain environment. No one can guarantee a 100% movement of price. However, when the market is in a trend, we can make a decent profit by using the momentum-based trading strategy.

Momentum Trading Strategy

Here is the most important part that you are looking for passionately. You will find the best momentum trading strategy for both the newbie and experienced traders. This guideline will answer all your queries.

Let’s have a look at the step by step approach of the momentum trading strategy.

Select the Currency Pair

First, you need to determine the price change from the last three months of some selected currency pairs. Also, don’t forget to do this calculation for the weekend. Once you find the last three months’ price changes, you need to research the last 13 weeks’ price movement.

In terms of currency pair, there is no clear indication of how much pair you should choose. Nevertheless, the ideal and wise option is to go through seven major currency pairs and cross pairs. It is better to put less importance on exotic pairs as they are risky because of their volatility.

After calculating the last three months’ price changes, it’s time to select the currency pair that moved much more than the others. As it is a proven profitable trading strategy, a currency pair can provide a 17% average annual profit. As per the last seven years of market observation, three months’ price has become a reliable factor while selecting the momentum-based strategy.

Entry

As we have a predetermined trend, you need to implement a trend continuation trading strategy to improve your overall trading result better. Moreover, many trend continuation strategies are there for you; you need to select a suitable one. In this trading strategy, we will use 20 Dynamic Exponential Moving Average (EMA) as a trend continuation indicator.

You should enter the trade towards the direction based on market momentum once the price rejects the 20 EMA with its body. Moreover, there is a good and effective solution for determining the trends’ strength: RSI. RSI is a good indicator, as well.

RSI stands for the Relative Strength Index. It has a 0-100 levels indicator. If the price goes below 30 levels, the price is likely to reverse towards the upside. On the other hand, if the price moves above the 70 RSI, it is likely to move down.

For a sell trade follow the following condition:

  • The price is moving towards the direction set in the market momentum.
  • The RSI is moving down from the 70 or 80 levels.
  • Price rejects the 20 EMA with a reversal candlestick formation.

Similarly, for a buy trade follow the following condition:

  • The price is moving towards the direction set in the market momentum.
  • The RSI is moving up from the 20 to 30 levels.
  • Price rejects the 20 EMA with a reversal candlestick formation.

Later on, enter the trade as soon as the candle closes above or below the dynamic level.

Stop Loss and Take Profit

After taking a trade, you need to determine the strength of the trend. You can set the stop loss 15 pips above or below the reversal candle or 20 days Average True Range (ATR).

To set the take profit, you need to determine how strong the running trend is. Moreover, impulsive pressure will indicate that the price may break the near-term support or resistance level. In that case, you can increase your take profit level. Alternatively, you can book some profit once you see the price stalling at the support or resistance levels.

Summary

In a nutshell, the summary of the entire guideline is here-

  • Find out the direction by calculating the last 13 weeks of market momentum.
  • Follow the market direction using a dynamic and hourly candle level of 20 EMA with a proper candlestick pattern.
  • According to the price action or ATR, set your stop-loss.
  • Following the market movement, you can set your take profit.

In this momentum trading strategy, trade management is the most challenging part as it requires to follow the market trend strongly. Since we know the forex market is uncertain, we should follow the market trend robustly. Moreover, you should follow an appropriate money management system that goes with your personality, and for each trade, it is wise to take less than 2% risk.

Categories
Forex Basic Strategies

Combining Moving Averages with Parabolic SAR To Generate Accurate Trading Signals

Introduction

Trend trading is a great way to earn money from the forex market. Any retail trading strategy based on a trend continuation pattern works well when it moves within a trend.  Therefore, in this trading strategy, we will take trades from minor corrections using the parabolic SAR towards the trend.

Furthermore, we will use a 100-period exponential moving average to determine the trend. If the price is trading above the 100 exponential moving average, we will consider the trend as an uptrend. If the price is trading below the 100-period exponential moving average, it will consider it a downtrend. We will follow a simple logic by considering buying trades when the market moves up and considering sell trades when the market is moving to drown.

However, there are no specific rules about the period of your moving average. Some traders are comfortable with 100 EMA, while some traders are compatible with 20 EMA or SMA. Therefore, if you’re trading in a lower timeframe, you can use any moving average from 20 to 100 periods. However, we will focus on 100 EMA as it provides good profitability based on swing trading ideas.

Why Should We Use Parabolic SAR?

Parabolic SAR is a forex trading indicator that stands for “stand and reverses.” This trading indicator was devised by J Welles, represented by some dots below and above the candlestick. In an uptrend, dots remain below the price and indicates a bullish pressure once the price is rejected from these dots. Similarly, in a downtrend, the dots form above the price, and the price starts to move once it gets rejected from the parabolic SAR.

In the image below, we can see a clear chart of the candlestick pattern.

Let’s plot the parabolic SAR in the price chart and see how it looks like.

It is visible that in an uptrend, Parabolic SAR is below the price, and in a downtrend, the parabolic SAR is above the price. This is why the parabolic SAR is considered as a stop and reverse indicator.

Furthermore, the parabolic SAR has a built-in stop-loss function. Once the price moves up or down with a new candle, the parabolic SAR changes with the price. Therefore, you can move your stop loss once the price creates a new higher or lower low. Furthermore, you can edit the primary parameter of Parabolic SAR from the indicator’s setting, but in this trading strategy, we will use the default format.

Moving Average with Parabolic SAR

If we use a 100-period exponential moving average, we can catch the major trend direction from the minor correction. The forex market Moves Like a zigzag. Therefore, there is a minor correction in a major bullish trend and minor bullish correction in a major downtrend. If we know the major trend, we can quickly enter the trade from a correction to get the maximum reward from the minimum risk.

In the forex market, parabolic SAR usually provides trading signals earlier than expected, which might create a negative impact on your trading result. Overall, any trend following indicator does not provide a good result when the price moves within a range. In most of the cases, markets follow the trend of about 35% of the time. Therefore, it is essential to filter out the conditions where the market is moving within a range.

We can eliminate the unexpected market behavior by using the 100 moving average as it will provide a more significant trend that will prevent over-trading. In the image below, we can see how the parabolic SAR provides false trading signals when the market moves within a range.

In the ranging market, it would be difficult to make a profit using this trading strategy. Therefore, it is better to use the 100 moving average to get the overall direction of the trend.

Moving Average With Parabolic SAR Trading Rules

Every trading strategy has its unique rules. In the moving average with the Parabolic SAR trading strategy, our main aim is to follow the trend towards the direction of 100 EMA.

Overall, we will follow simple rules as Complex trading rules make it challenging to implement it on the chart. You can make good profits with a simple trading strategy if you can utilize it well with appropriate trade management and money management rules.

Timeframe

The moving average with the Parabolic SAR trading strategy works well in all timeframes from 5 minutes to weekly charts. The longer timeframe will provide better trading results. However, it is better to stick to the 1 hour to daily chart as it can cover fresh moves driven by banks and financial institutes.

Currency Pair

There is no obligation to use a currency pair. However, it is better to use a currency pair that does not remain within a range for a long time like EURCHF. Therefore, all major and minor pairs are good to go with this trading strategy.

Buy Entry (Inverse for Sell Entry)

  • Identify the price above the 100 periods moving average. If the price is choppy at the 100 EMA, Ignore the price chart, and move to another market.
  • Identify the parabolic SAR to point dots below the candlestick, which will be a buy signal (above the candlestick is a sell signal).
  • Later on, place a buy stop order above the candlestick high.
  • Put your stop loss below the printed dot with some buffer.

Example of Parabolic SAR Strategy

At the image below and see how parabolic SAR provided a buy trade setup.

  • Notice that the price is moving in a range at the 100 EMA area with a violation. The blue horizontal line represents the support and resistance level, where the price is consolidating. In this consolidation, we will not take any trade.
  • If you look at the price structure, you can see the price is moving within a range from their resistance to support. On the price move above the 100 exponential moving average, you should put a pending order above the range, projecting that it will break out from the resistance level and create an impulsive bullish pressure.

Stop Loss and Take Profit Set

When you put the pending order above the resistance level, you should put a stop loss below red dots that have appeared below the candlestick. While setting the stop-loss, make sure to use some buffer of 10 to 15 pips.

Later on, hold the price until it points red dots above the price. The red dot above the price will indicate that sellers are entering the market, and there is a possibility to create a new lower low. Furthermore, while sitting the stop loss and take profit, you should follow the basic rules of price action, including the breakout and pullback.

Summary

Let’s summarize the moving average with the Parabolic SAR trading strategy:

  • You should look for a fresh trending movement above or below 100 exponential moving average.
  • Parabolic dots below the price will provide buy-entry, and parabolic dots above the price will indicate sell-entry.
  • You should avoid ranging markets where the price might violate parabolic dots.

Moreover, trade management and good trading psychology are mandatory for every trading strategy. You cannot make a decent profit until you know how to minimize the risk to get the maximum benefit from trade.

Categories
Forex Basic Strategies

Trading The Forex Market Using ‘Price Action With Context’ Strategy

Introduction

Price action with context is a process to predict a currency pair’s movement by reading the chart. The key price driver of a currency pair is fundamental events, but we can predict the future movement based on the present and past activity of the chart.

Central banks and financial institutes drive the forex market. Therefore, when they make the price move, they left some signs of their activity. As a price action trader, we will read their activity and anticipate what they might do in the future.

What is Price Action?

Price action is a process to inquiry about a currency pair’s price development. The main aim of the price action trading is to understand buyers’ and sellers’ sentiment in the price and predict future movement based on these. The price action trading is based on the combination of several trading indicators and price behaviors. Therefore, you might have to use multiple trading tools as a price action weapon.

The price of a currency pair moves based on the sentiment of buyers’ and sellers’. Therefore, using price action is logical that can provide accurate trading signals. In the price action with context trading strategy, we will identify a market direction by reading the chart and then enter a trade from the correction to get the maximum return with a minimum risk.

What are Price Action Weapons?

There are many parts in the price action trading that a trader should know, like- candlestick, support and resistance, trend, market flow, event level, key Level, and market context.

Candlestick

Candlestick represents the price movement of a currency pair for a specific timeframe. The four major parts of candlestick trading are- opening price, closing price, high price, and low price. Candlestick represents both continuation and reversal price direction based on the opening, closing, high and low. There are many candlestick patterns in the market, but in this trading strategy, we will focus on reversal candlesticks only.

Example of reversal candlestick – Pinbar, Engulfing Bar, and Two Bar, etc.

Support & Resistance

Support and resistance are a price zone from where the price is likely to change the direction. When the price is moving up, it will reverse as soon as it finds resistance. On the other hand, the price will stop moving down as soon as it finds a support level. There is more to know about the support and resistance in this trading strategy-

Event Level – Event level is a price zone that works as both support and resistance. It is the most important Level as both buyers and sellers put attention to it.

Key Level – key levels are a significant level in the daily or weekly timeframe to understand the price’s top and bottom.

Dynamic Level – Dynamic levels move with the price rather than a specific horizontal zone. In this trading strategy, we will use 20 Exponential Moving Average as the dynamic Level.

Market Context

Market context is a process to identify the nature of a trend. It has four elements:

Impulsive – When the price aggressively creates new highs and lows, it is considered as an impulsive trend. It indicates that the price will continue the current trend.

Corrective – In a corrective market structure, price barely creates new higher highs or lower lows. It is an indication of market reversal.

Volatile Trend – In volatile trends, the market follows the corrective structure and indicates a market reversal.

Non Volatile Trend – Non-volatile trend appears with the impulsive market momentum when the price tries to continue the current movement.

Bullish Price Action Trade Setups

Find the market in an impulsive bullish pressure in H4 or daily timeframe. Identify the Key support level and consider buy trades only as soon as the price is trading above it.

Entry

To enter the trade, you have to wait until the price comes down towards an event level with a corrective structure in 1 Hour timeframe. Enter the trade as soon as the price rejects and closes above the event level with a reversal candlestick.

Stop Loss

Put the stop loss below the recent swing low with 10-15 pips buffer. Here the buffer means you should put the stop loss 15 pips below the swing low.

Take Profit

The primary target of the take profit would be the next event level. However, if the bullish trend remains impulsive, you can extend the take profit. On the other hand, you can close earlier if the price barely creates new higher highs.

In the example below, we can see a visual representation of how to take the entry with stop loss and take profit level.

Bearish Price Action Trade Setups

Find the market in an impulsive bearish pressure in H4 or daily timeframe. Identify the key resistance level and consider sell trades only as soon as the price is trading below it.

Entry

To enter the trade, you have to wait until the price comes down towards an event level with a corrective structure in 1 Hour timeframe. Enter the trade as soon as the price rejects and closes below the event level with a bullish reversal candlestick.

Stop Loss & Take Profit

Put the stop loss above the recent swing high with 10-15 pips buffer. Here the buffer means you should put the stop loss 15 pips above the swing high.

The primary target of the take profit would be the next event level. However, if the bearish trend remains impulsive, you extend the take profit. On the other hand, you can close earlier if the price barely creates new Lower lows.

In the example below, we can see a visual representation of how to take the sell entry with stop loss and take profit level.

Final Thoughts – Trade Management Idea

In the above section, we have seen how to trade using the price action with context. In this trading strategy, buy and sell trades come after filtering out unusual market movements from the volatile market conditions.

However, no forex trading strategy in the world can guarantee a 100% profit, so your trades might go wrong even if you strictly followed all rules. If you want to grow your account with a consistent profit, you should follow strong trade management tools, as mentioned below:

  • Ensure that you are not taking over a 2% risk per trade of your trading balance.
  • Move your stop loss at breakeven as soon as the price creates a new higher high or lower low.
  • If you face a 3 or 4 consecutive losses, take a break and observe the market until it follows the trend accurately.
  • Make sure to keep your mind free from any bias while you are analyzing the market.

Overall, price action is the core element of trading that every trader should know. There are many trading strategies combining price action and other trading tools. The strategy we have seen above has a good history of providing profitable trades. Therefore, if you can implement it properly, you can consistently grow your trading account.

Categories
Forex Basic Strategies

Trading The Most Popular ‘Head and Shoulders’ Pattern Forex Strategy

Introduction

Head and shoulder is a famous market reversal pattern. Most of the new and experienced traders use this pattern to identify the potential market reversal trade. Traders can use this pattern in every market, including forex, cryptocurrency, stock, indices, and commodities.

In this pattern, there is an indication that the price is trying to make a new higher but cannot do it. In the forex market, it is essential to understand the sentiment of buyers and sellers. In that sense, head and shoulder is a prominent price pattern indicating what buyers and sellers are doing in the market and how buyers got rejected from a potential zone.

What is the Head and Shoulder Pattern?

Head and shoulder is a price pattern that usually appears in an uptrend and indicates a price zone from where buyers are going to lose their momentum. A complete head and shoulder pattern indicates the start of a bearish trend. Therefore, if you want to join the bearish trend as early as possible, you should take trading decisions based on this pattern to have a better risk: reward ratio.

The head and shoulder pattern has three elements, as marked in the below chart.

The left shoulder is the ordinary swing high of a bullish trend. Later on, the head indicates another swing high indicating the continuation of the bullish trend. However, the right shoulder indicates that the price is unable to make another high above the head, which is an indication that buyers are losing their momentum.

On the other hand, the inverse head and shoulder are like the head and shoulder pattern that appears after a bearish trend. It indicates a potential market reversal from a bearish trend to the upside.

In the image below, we can see how an inverse head and shoulder looks like.

How to Identify the Head and Shoulder Pattern?

The head and shoulder pattern is prevalent in the chart that does not require any effort to see. You can easily spot it with the naked eye. Moreover, there are some Expert Advisors (EAs) or trading indicators that automatically show the head and shoulder pattern.

You can draw the head and shoulder pattern using the trendline (without ray) despite the automotive process. Later on, we should focus on the location of the pattern. If the head and shoulder pattern appears near any significant support level, it might not work well due to the lack of space for further price decline.

Overall, the head and shoulder pattern from a significant resistance level or key resistance level can provide a potential market reversal opportunity. Furthermore, head and shoulder patterns with significant economic events often make the level important among traders.

Head and Shoulder Pattern Trading Strategy

If you have read the above section, you would know that it is not difficult to find the price’s head and shoulder pattern. The profitability ratio of this pattern is very high, based on the previous trading result. There are several ways to make trades based on the head and shoulder trading strategy. However, the most reliable way to take the trade is from the neckline breakout.

Timeframe

The head and shoulder price pattern in a daily chart is more reliable than the head and shoulder pattern in a 5 minutes timeframe. The accuracy of this trading strategy increases if you move to a higher timeframe. However, it is often difficult for traders to take trades based on a weekly or monthly timeframe as it requires a lot of time and balance. Based on the retail and institutional traders, any time frame from 1 hour to a daily chart is perfect for this trading strategy.

Currency Pair

The head and shoulder trading strategy works well in all financial markets, including forex, cryptocurrency, stocks, indices, and commodities. Therefore, there is no barrier to use it on specific currency pairs. However, it is recommended to trade in major currency pairs as there is enough liquidity to provide a substantial movement without any unnecessary spike.

Entry

After forming the head and shoulder pattern, it is crucial to measure the price action at the neckline area. The neckline is a support level based on the lowest swing point of two shoulders and one head. In this trading strategy, you should wait for the price to break below the neckline with a big candle breakout. The strength of the breakout will indicate how reliable the upcoming bearish pressure is.

Later on, wait for the price to correct towards the neckline again with a corrective speed and enter the trade as soon as the price rejects the neckline with a bullish reversal candlestick.

Stop Loss

The stop loss will depend on two categories. If you are an aggressive trader, you can put the stop loss above the reversal candlestick with 10-15 pips buffer. In case the market moves above the neckline and hits your stop loss, it would indicate that the price made a false break below the neckline. However, the conservative approach is to put the stop loss above the left shoulder with some buffer. It would save your trading balance from the unusual market noise.

Take Profit

The first take profit level should be based on the 1:1 risk: reward ratio. You can close 50% of the position at the first take profit level and wait for the 100% of neckline to head for the final take profit.

Moreover, you should be more cautious in setting the take profit level by considering the near-term support and resistance levels. In the example below, we can see how the price broke below the neckline and retested it again to create a trading opportunity. Moreover, this image refers to how to set the stop loss and take profit levels.

Conclusion

The forex market is the world’s biggest financial market, which is very uncertain. Therefore, no trading strategy can guarantee a 100% profit. There is some possibility that your trade might hit the stop loss after taking the entry, instead of moving down. In that case, you should take the loss and wait for further trading opportunities.

The best way to keep yourself profitable in the market is to use appropriate money management and trade management rules for trading. Therefore, if you take 1% or 2% risk per trade, any unusual stop loss might not affect the overall balance.

Categories
Forex Basic Strategies

Dynamic Channel Trading Using The Concepts Of Price Action!

Introduction

In forex, the dynamic channel trading is a profitable strategy that forms with standard trendlines. It indicates a potential move to identify the market direction both to the downside and upside. On the other hand, price action is a method to identify the price direction based on price behavior. Therefore, we can create a profitable trading strategy by reading the price action from any channel support and resistance level.

In general, traders use price channel as a technical analysis tool that helps to identify the potential market movement. The dynamic channel moves like a zigzag by creating lower lows and higher highs. In Forex trading, we usually have two types of dynamic channels:

  • An upward or ascending channel
  • Downward or descending channel

Dynamic Channel Identification

We can easily identify the dynamic channel by connecting the swing lows or swings highs they create. In an upwards dynamic channel, it will move with the price with a higher high formation.

Similarly, in a downward dynamic channel, it will move with the price by creating lower lows.

In the image above, we can see that the higher highs and the lower lows connected through straight lines. The dynamic price channel shows a significant movement from down to upside in the trend line. The trendline below the price may work as a dynamic support level, and the trendline above the price may work as a dynamic resistance level.

Besides the dynamic channel, we will use the concept of price action by measuring what buyers and sellers are doing in the market. Any slower and corrective movement from the dynamic channel support and resistance would indicate a possibility of a potential market reversal.

Later on, we will use the appropriate reversal candlestick from that area to enter a trade. In this trading strategy, we can make a profit when the price is trading within the channel, or it breaks out from the channel. However, we will filter out the unusual false movement by reading the price action.

Bullish Dynamic Channel Trading Strategy

In the bullish channel continuation trade setup, we will identify the price that is moving upside within the channel.

Identify the Price Location

Central banks and big financial institutes drive the price of a currency pair. Therefore, institutional traders focus on long timeframes mostly, as it provides the most reliable price direction. Therefore, we will move to the daily or weekly timeframe and identify the location of the price. We will consider channels that only meets the following condition:

⚠️ An upward channel should move within an uptrend above a key support level.

Entry

In an upside movement of a price channel, there will be new higher highs. Therefore, we need to identify a price channel where the price moves down towards channel support with a corrective speed. We will enter the trade as soon as the price rejects the channel support with a reversal candlestick formation.

Stop Loss

In a bullish channel trading, the stop loss would be below the reversal candlestick with 10 to 15 pips buffer.

Take Profit

The primary aim of the taking profit would be the immediate channel resistance. However, we have to read the price action to make a trading decision regarding the take profit.

If the price starts to move with an impulsive bullish pressure, it can go beyond the channel resistance. In that case, we can take some partial closing 10-15 pips below the channel resistance and wait for the price to test any event level.

Bearish Dynamic Channel Trading Strategy

In the bearish channel continuation trade setup, we will identify the price that is moving downside within the channel.

Identify the Price Location

Based on the price action context, we will move to the daily or weekly timeframe and identify the price’s location. We will consider channels that only meets the following conditions:

⚠️ A downward channel should move within a downtrend from a key resistance level.
Entry

In the downward price channel, there will be lower lows. Therefore, we need to identify a price channel where the price is moving down towards a channel resistance with a corrective speed. Therefore, we will read the price action and enter the trade as soon as it rejects the channel resistance with a reversal candlestick pattern.

Stop Loss

In the bearish channel trading, the stop loss would be above the reversal candlestick with 10 to 15 pips buffer.

Take Profit

The primary aim of the taking profit would be the immediate channel support. However, we have to read the price action to make a trading decision regarding the take profit.

If the price starts to move with an impulsive bearish pressure, it can go beyond the channel support. In that case, we can take some partial closing 10-15 pips above the channel support and close the rest of the amount at the next event level.

Channel Breakout Trading Strategy

In forex trading, when the price crossed (above or below) the channel, there is a profitable trading strategy. For making the trade sustainable, we need to identify the speed of the breakout. When institutions or banks enter the market, we see such massive breakout from the channel support or resistance.

Entry

After a massive breakout from a dynamic channel, we will wait for a correction. The correction indicates that the massive breakout would be strong. We will wait until the price moves to the channel support or resistance level with a corrective speed and enter the trade as soon as it rejects the level with a reversal candlestick formation.

Stop Loss

Setting a stop loss is similar to the channel continuation trade setup. You can put your stop loss above or below the reversal candlestick with 10 to 15 pips buffer.

Take Profit

The primary target of the channel breakout is the immediate event level. However, you can extend the take profit by reading the price action. If the power of the breakout is strong, the price may move beyond the immediate event level.

Conclusion

The Forex market is a competitive trading market where trade management is a key element for a forex trader. No trading strategy can assure you a confirmed profit. Therefore, it is recommended to use not more than 2% risk per trade and move the stop-loss at breakeven as soon as the price creates new lows or highs.

Categories
Forex Basic Strategies

You Must Know This ‘7-Day Period’ Forex Trading Strategy!

Introduction

Trying to pick the top or bottom is one of the favorite things a trader likes to do. We tried to do that using the ‘Dolphin Strategy.’ We did that with no indicator support. We are again going to unveil a strategy that does pick a top or bottom with no indicator support. This strategy is called the 7-Day period strategy. Let us take a step back and think, indicators are nothing but a mathematical representation of prices, which are calculated in different ways.

Therefore, sometimes it is important to look at prices alone. The 7-day period strategy is based on the idea that after every seven days of consecutive strength, a currency pair’s move is due for a retracement. The question arises, why seven days? This number is derived after constantly watching the market for years. Often, a new trend emerges at the beginning of the week, and if the trend is strong, it can last for several days with no retracement.

Many psychologists believe that human beings have the best retention rates on numbers that are in groups of seven or less. This is one of the reasons why phone numbers in the U.S. only have seven digits, aside from the area code. We have seen that the seven-day reversal pattern is more accurate in a trending market. We gave occasionally seen those periods when the market continues to move in the same direction after seven days of the exhaustive movement, i.e., from the 8th day onwards. Even though the setup is rare, when it does occur, it is significant.

Time Frame

As the name of the strategy suggests, it can be traded only in the daily time frame.

Indicators

In this strategy, no indicators are used. Simple Moving Average (SMA) can put on the chart to get a clear idea of the trend.

Currency Pairs

This strategy can be applied to all the currencies in the forex market. Exotic pairs should be avoided.

Strategy Concept 

The basic idea of the strategy is that when the market is strongly trending on the hourly chart, the retracement does not last more than seven days and changes its direction at the sixth or seventh day. This retracement is considered to over-extended, which leads to a strong reversal in the pair.

If the sixth or seventh candle coincides with a key technical level, the ‘move’ may very well stall at that level and continue its major trend. To implement the strategy effectively, we need to know trends and trend retracement. Since this strategy is based on fixed rules and price action, it is not necessary to know about technical indicators. However, SMA and ATR can be used for trend identification and measuring the momentum of the market.

Trade Setup

In order to understand how the strategy works, we will apply it on the USD/CAD currency pair and execute a ‘short’ trade using the strategy.

Step 1

The first step is to identify the direction of the market. As this is a trend trading strategy, we should be able to identify the major direction of the market. If the market is making higher highs and higher lows, it is an uptrend, or if the market is making lower lows and lower highs, it is a downtrend. A trend can also be determined using the Simple Moving Average (SMA) indicator. Very simply, if the price is below SMA, we say that the market is in a downtrend, and if the price is above the SMA, the market is said to be in an uptrend.

In the example we have considered, from the below image, it is clear that the market is in a strong downtrend.

Step 2

Next, wait for a retracement from the highest or the lowest point, which we will be evaluated based on our strategy rules. The retracement should be such that there are seven consecutive candles of the same color. One or two candles of the opposite color are okay, but we need to make sure that it does not impact the structure of the retracement. These seven candles represent an extended pullback, which can lead to reversal any moment.

In the below image, we can see seven days of the up movement, which is exactly the kind of retracement which we need for the strategy.

Step 3

In this step, we need to check the position of the price after seven straight days of the movement. The strategy works best if the price coincides with a key technical level of support and resistance. This is because, in these areas, the price action is very strong, and market moves as per expectations. But it is important to make sure that no step of the strategy is used individually. All of them need to be used collectively.

We enter the market once we get confirmation after the 7-day period. The confirmation is nothing but a bullish candle in case of a ‘long’ setup and a bearish candle in case of a ‘short’ setup.

In our example, we see that the price has approached the previous ‘lower high’ of the downtrend. This is an area where we can expect sellers to get active and take the price lower.

Step 4

Finally, we need to determine the ‘stop-loss’ and ‘take-profit‘ for the strategy. We place the stop-loss a little higher than the bullish candle when entering for a ‘long’ and little lower the bearish candle if entering for a ‘short.’ We take profit at two places in this strategy. The first take-profit is set at the previous higher high or lower low, while the second take-profit is set at 1:2 risk to reward.

Strategy Roundup

As there are many conditions associated with the strategy, the setup might be rare, but when it does occur, it is significant. We have seen trends where the retracement occurs for just a few days before it starts moving in the direction of the major trend. But these setups are not reliable. The most important condition of this setup is the continuous appearance of bullish or bearish candles for seven days.

Categories
Forex Basic Strategies

Divergence Trading – MACD Regular Divergence Forex Strategy

Introduction

MACD regular divergence is a trading strategy that considers the relationship between Moving Average Convergence Divergence and the price.

MACD, a technical indicator, invented by Gerald Appel in 1979. It is very famous among professional and institutional traders; therefore, it can provide a reliable trading opportunity. On the other hand, divergence is a significant concept in trading that happens between the price and oscillator.

In most of the cases, oscillators like MACD or RSI move with the price. However, there is some condition where MACD does not follow the same direction of the price and creates divergence.

What is the MACD Divergence Strategy?

MACD is a Momentum based indicator that shows the correlation between two moving averages. Traders use this indicator in stocks, bonds, and forex trading as a trend continuation and reversal indicator. If you want to become a successful forex trader, MACD would be the best indicator to follow.

If you use a momentum-based strategy, MACD is the best available technical indicator for you. If you trade using the MACD divergence strategy, it will show you the proper entry and exit points.

There are several types of divergence, but in most cases, investors use the following types of divergences:

Hidden Divergence

It happens when the MACD histogram creates divergence with the price. It indicates a minor market reversal and significant trend continuation.

Regular Divergence

It happens when MACD EMA moves to the opposite direction of the price. Regular divergence from a significant support or resistance level indicates a potential market reversal.

In the example below, we can see a naked chart with a MACD indicator.

If you look at the image, you can see several lower lows, and higher highs in the price and MACD EMA also followed the same direction. However, there is some point where the price and MACD did not follow the same direction as indicated in the image below.

This is how divergence forms in the price. It indicates a potential market reversal if it happens from significant support or resistance levels.

Bullish MACD Regular Divergence Trading Strategy

Bullish MACD regular divergence happens when the price of a currency pair moves to the opposite direction of the MACD histogram from a significant support level. Therefore, bullish MACD divergence strategy is considered as the positive divergence signal.

Timeframe

In this trading strategy, there is no specification of the timeframe. However, this trading strategy works well in H1 and H4 timeframe.

Currency Pair

The MACD divergence trading strategy works well in most major and minor currency pairs, including EURUSD, GBPUSD, USDJPY, and AUDUSD.

Location of the Divergence

It is essential to identify the location of the price. In this bullish divergence trading strategy, the price should form the divergence in a critical support level. Any divergence from a random place rather than a vital level would not provide good profitability. Before moving to the entry point, we should find Negative Positive and Negative (NPN) MACD histogram to form.

Entry

After forming the divergence, we should wait for a bearish reversal candlestick to enter the trade. Make sure to enter the trade as soon as the candle closes.

Stop Loss and Take Profit

In the bullish divergence trading strategy, stop loss would be below the reversal candlestick candle with 10-15 pips buffer.

The first take profit level would be based on 1:1 risk: reward, where you should close 50% of the trade and move the stop loss at breakeven. Later on, the 2nd take profit level would be based on near term event level from where the market is expected to show some correction.

However, as part of the trade management, you can extend the take profit level based on the market momentum. If the price shows an impulsive bullish pressure near the resistance level, it may break the level by creating a new high. In that case, you can extend the take profit level if your trade management system allows.

Bearish MACD Regular Divergence Trading Strategy

Bearish MACD regular divergence happens when the price of a currency pair moves to the opposite direction of the MACD histogram from a prominent resistance level. It is also considered as a negative divergence signal.

Timeframe

Similar to the bullish divergence, this trading strategy works well in H1 and H4 timeframe. You can use this trading strategy in all timeframes, but the higher timeframe provides a reliable result. On the other hand, traders often find it challenging to observe the price in daily and weekly timeframes. Therefore, H1 and H4 are ideal for swing traders.

Currency Pair

The bearish MACD divergence trading strategy works well in most major and minor currency pairs, including EURUSD, GBPUSD, USDJPY, and AUDUSD.

Location of the Divergence

It is essential to identify the location of the price. In this bearish regular divergence trading strategy, the divergence should format a significant resistance level. Any divergence from a random place would not provide good profitability.

Before moving to the entry point, we should find Positive Negative Positive (PNP) MACD histogram to form.

Entry

After forming the divergence, we should wait for a bullish reversal candlestick to enter the trade. Make sure to enter the trade as soon as the candle closes.

Stop Loss and Take Profit

In the bullish divergence trading strategy, stop loss would be above the reversal candlestick candle with 10-15 pips buffer.

The first take profit level would be based on 1:1 risk: reward, where you should close 50% of the trade and move the stop loss at breakeven. Later on, the 2nd take profit level would be based on the near term event level.

Summary

Let’s summaries the MACD regular divergence trading strategy:

  • Find the divergence based on NPN and PNP from a significant level.
  • Enter the trade after a reversal candlestick formation.
  • Stop-loss should be below or above the reversal candlestick with 10 to 15 pips buffer.
  • The first take profit would be based on 1:1 risk: reward ratio, and the second take profit would be based on the price action on the next event level.

There are more ways to use divergence as a trading strategy. Besides the divergence formation, you should focus on how the price is approaching a critical level. Any weakness at a significant level would indicate the first impression of market reversal. Later on, the divergence would indicate the final try of the opposite party. Happy Trading!

Categories
Forex Basic Strategies

Everything About The ‘RSI Rollercoaster’ Forex Trading Strategy

Introduction

Sometimes it is best to choose the simplest path of trading. The Relative Strength Index (RSI), invented by Welles Wilder, is one of the oldest and most popular technical analysis tools. If best traders in the world were asked to rank the technical indicators, RSI would certainly be accorded in the top five. It has the unique ability to measure turns in price by measuring the momentum of the turn, which is impossible by any other technical tool in technical analysis.

The standard RSI setting of 70 and 30 serves as a clear sign of overbought and oversold, respectively. The RSI rollercoaster is a strategy that we have developed to take advantage of these turns in the market. The purpose of RSI rollercoaster is to make money from range-bound currency pairs.

Time Frame

This strategy is suitable for trading on the ‘daily’ time frame. It can also be used on the smaller time frames, but the success rate is not very encouraging.

Indicators

As the name suggests, we will be using the RSI indicator for the strategy. No other indicators will be used. Sime knowledge of price action will be helpful.

Currency Pairs

This strategy applies to all the currency pairs listed on the broker’s platform. If trading on the lower time frame, we need to look for highly liquid currency pairs.

Strategy Concept

The key to the RSI rollercoaster strategy versus the traditional RSI strategy is the way of trading the overbought and oversold levels. Here we look for a reversal candle, which provides a sign of exhaustion before taking the trade. This way, we prevent ourselves from picking the top or bottom of a ‘range’ by waiting for an indicator confirmation.

This strategy works best in a ‘ranging’ market where overbought and oversold signals are far more true indications of change in direction. Furthermore, from experience, we have observed that the setup is much more accurate on the ‘daily’ charts than on the smaller time frames such as the 4 hours or 1 hour.

The primary reason for this difference is that ‘daily’ charts include far more data points into their subset and, therefore, change in momentum tends to be more meaningful on longer time frames. Nevertheless, the disproportionate risk to reward ratio in this setup makes even the shorter time frame trades worth considering. We keep in mind that although the setup will fail more frequently on the shorter time frames, the losses will generally be smaller, keeping the overall risk manageable.

Trade Setup

In order to explain the strategy, we have considered an example of such a trade that was carried out on the USD/CAD pair. As the strategy produces a better result on the ‘daily’ time frame, we will be applying it to the ‘daily’ time frame chart. Let us see the steps to execute the strategy.

Step 1

The first step of the strategy is to open the ‘daily’ (preferable) time frame chart of the desired currency pair. Identify key levels of ‘support’ and ‘resistance.’ A ‘support’ or ‘resistance’ is only valid if the price has reacted off from this area at least twice. If the price has reacted only once, that means a ‘range’ has not yet been established.

The below image shows the clear formation of a ‘range’ where the price has reacted multiple times from the ‘ends.’

Step 2

In this step, we wait for the RSI indicator to cross above the 70 ‘mark ‘when the price is near ‘resistance’ or cross below the 30 marks when the price is near ‘support.’ During this time, the price action of the chart is not of much importance. Once the RSI shows a reading below 70 after crossing it, we will look for ‘sell’ opportunities depending on the price action. Similarly, when the RSI shows a reading above 30 after crossing below it, we will look for ‘buy’ opportunities depending on the price action.

In this case, we can see that the price breaks down below ‘support,’ which is an indication of ‘sell’ as per the theory of support and resistance. But as per our strategy, we will not be looking at the price action in this step, and we will focus only on the RSI indicator.

A few days later, we see that the RSI goes below the 30 ‘mark’ for a moment and starts moving higher. This is our first indication of going ‘long’ in the market.

Step 3

We ‘enter’ for a ‘sell’ when the price moves back into the ‘range’ after the indication from RSI. Similarly, we enter for a ‘buy’ when the price moves back into the ‘range’ after the indication from RSI. This price action indicates a false breakout or breakdown, which is identified rightly with the help of an indicator.

In our case, we are entering ‘long’ in the currency pair after we get a confirmation in the form of a bullish candle, as we can see in the below image.

Step 4

In this step, we determine the ‘stop-loss’ and ‘take-profit‘ levels for the strategy. When executing a ‘long’ trade, the stop-loss will be placed just above the ‘high’ where the price created a false breakout. And when executing a ‘sell’ trade, the ‘stop-loss’ will be placed just below the ‘low’ from where the price created a false breakdown. The ‘take-profit’ depends on the major trend of the market. If we are trading against the trend, it should be kept at 1:1 risk to reward or even a little lesser than that. If the ‘trade’ is taking place with the trend, it can be kept at 1:2 risk to reward.

Strategy Roundup

The RSI rollercoaster strategy is designed to squeeze as much profit as possible out of the turns at ‘support’ and ‘resistance.’ Instead of immediately entering into a position when the market moves into an overbought or oversold zone, the RSI, along with a little bit of price action, keeps us away from the market until we get a confirmation sign of the exhaustion. The RSI rollercoaster is almost always in the market, as long as we see wild moves on either side of the ‘range’ to stop-out traders.

Categories
Forex Basic Strategies

Trading The Most Simple Yet Profitable ‘MACD Combo Strategy’!

Introduction

Theoretically, trend trading is easy. All we need to do is keep buying as long as we see the price rising and keep selling as long as we see the price breaking lower. In practice, it is far more difficult to do it. When looking for such opportunities, many questions arise in our minds, such as:

  • What is the direction of the market?
  • After spotting the trend, how long is the retracement going to last?
  • When is the trend going to end?

The greatest fear for traders is getting into a trend too late. That is, when the trend is coming to an end. Despite these difficulties yet, trend trading is considered to be the least risky and most popular styles of trading. When a trend develops, it can last for hours, days, and even months, depending on the time-frame.

Time Frame

The MACD Combo strategy works well on the 1-hour time frame. After gaining enough experience on the 1-hour time frame, we can also try the strategy on lower time frames.

Indicators

In this strategy, we will be using the following indicators

  1. 50 SMA
  2. 100 SMA
  3. MACD with default settings

Currency Pairs

This strategy applies only to major currency pairs. Some of the preferred pairs are EUR/USD, USD.JPY, GBP/USD, GBP/JPY, and few others. We need to make sure that whichever currency pair we are selecting, it should be fairly liquid.

Strategy Concept

The strategy we have developed answers all of the above questions. It also gives us clear entry and exit signals. This strategy is called the MACD combo. We use two forms of moving averages for the strategy: the 50 simple moving average (SMA) and the 100 SMA. The 50 and 100 input of SMA is suitable for trading on the 1-hour time frame chart. The input will change depending on the time-frame we choose to trade.

The 50 SMA provides a signal for entering a trade, while 100 SMA ensures that we are working in a clear trending market. The main idea of the strategy is that we buy or sell only when the prices cross the moving average in the direction of the trend. The basic concept of the strategy may appear similar to the “momo” strategy but is far more patient and uses longer-term moving averages on hourly charts to capture larger profits.

When this strategy is used on the daily (D) time frame wit the same indicator settings, it gives a larger risk to reward. Hence, this strategy is appropriate for long-term investors and swing traders.

Trade Setup

In order to explain the strategy, we have considered the chart of GBP/USD, where we will be using the strategy on the 1-hour time frame. Here are the steps to execute the MACD combo strategy.

Step 1

The first step of the strategy is to determine the market direction. This means we need to establish the trend of the market. As this is a trend trading strategy, the market must trend in a single direction before we can apply it. In an uptrend, the price should adequately trade above the 50 SMA and 100 SMA for a long period of time. Similarly, for a downtrend, the price should trade below both the SMAs.

In the below image, we see that the market is in a strong uptrend. Hence, we will look for ‘buy’ opportunities.

Step 2

The next step is to wait for a price retracement or a ‘pullback’ to join the trend at this discounted price. We say that the pullback is valid if the price crosses the closest SMA and stays below that SMA at least for a period of4-5 candles. But we need to make sure that the price does not cross below the next SMA. If that happens, the trend gets invalidated, and it may signal a reversal of the trend.

The below image shows that the pullback has crossed the first SMA (50 Period) and has stayed there for more than 5 hours.

Step 3

In this step, we will use the MACD indicator to enter the market. In case of an uptrend, we enter the market for a ‘buy’ as soon as the MACD indicator turns positive. Similarly, in a downtrend, we enter the market for a ‘sell’ when the MACD indicator turns negative. A conservative trader may enter the market after it moves above the SMA.

We can see in the below image that we are going ‘long’ soon after the MACD shows up a green bar. This is an aggressive form of ‘entry’ which requires experience to be able to spot them.

Step 4

In this step, we determine the stop-loss and take-profit for the strategy. Stop-loss is placed below the swing ‘low’ in case of a ‘long’ trade and above the swing’ high’ in case of a ‘short’ trade. Since we are trading with the trend, we will take our profits at the new ‘higher high‘ or ‘lower low’ depending on the momentum of the market. This is the reason behind high risk to reward of trades done using this strategy.

In this case, the risk to reward of the trade is 1:2, which is above the normal range.

Strategy Roundup

Traders implementing the MACD combo strategy should make sure that they only apply the strategy on currency pairs that are typically trending. Also, it is smart to check the crossover’s strength below or above the first moving average. We can also make use of the ADX indicator to check the momentum of the pullback. It is important to check the momentum of the trend and the pullback when trend trading.

Categories
Forex Basic Strategies

Heard Of The CCI (Commodity Channel Index) Trading Strategy?

Introduction

Often in life, taking the right action is the hardest decision to make. The same thing happens in trading as well. Most traders find it extremely difficult to buy at ‘bottom’ and sell at ‘top’ even though from a very early age, we are taught to look for value and buy “cheap.” That is why most traders who proclaim their love for trading with the trend fail to pick tops or bottoms.

While these types of ‘turn’ trades can be very profitable, they sometimes seem like tough tasks as the price can relentlessly trend in one direction, constantly stopping out the bottom and top pickers. Sometimes it is far easier and more comfortable to go with the flow. Yet, most traders are reluctant to buy breakouts for fear of being the last one to the party before prices reverse with a reprisal.

In today’s topic, we will solve the question of “how to trade breakouts confidently and successfully.” The Commodity Channel Index (CCI) Strategy is a setup designed to deal with just such a predicament.

Time Frame

One of the best parts of this strategy is that it works well on all time frames. That means we can use this strategy from very short time frames like 5-minutes to longer time frames such as the 4-hours or daily (D).

Indicators

In this strategy, we will use an indicator that is rarely used in forex. That is the Commodity Channel Index (CCI) indicator, devised by Donald Lambert in 1980 and originally designed to solve engineering problems. The primary focus of CCI is to measure the deviation of the currency pair’s price from its statistical average. As such, CCI is an extremely good measure of momentum that helps us to optimize only the highest probability entries for our setup.

Currency Pairs

This strategy applies to most of the currency pairs listed on the broker’s platform. We need to make that the pair we are choosing is fairly liquid.

Strategy Concept

The CCI is an unbounded oscillator with a reading of 100+ is typically considered to be overbought, and any reading of 100- indicates oversold. For this strategy, we will use these levels as our trigger points and change the CCI interpretation. We will look to buy the currency pair if it makes a new high above 100 and sell if it makes a new low below 100.

In this strategy, we are looking for new peaks or spikes that are likely to take the currency pair higher or lower due to its momentum. The thesis behind this setup is much like a body that will continue to remain in motion until it is hurtled by an external force or slowed down by counter forces. Similarly, new highs and lows in CCI will propel the currency in the further direction of the move until new prices halt the ongoing move.

Trade Setup

In order to illustrate the strategy, we have considered the EUR/JPY currency pair, where we will be applying the strategy on the 1-hour time frame chart.

Step 1

Firstly, open the chart of the desired currency pair and plot the Commodity Channel Index (CCI). Keep the input of the CCI index as 20. Then, mark key technical levels of support and resistance on the chart. For a ‘long’ trade, look for the last ‘high’ made by the CCI indicator and mark it out. That means its value should have crossed +100 during an upward price movement. Similarly, for a ‘short’ trade, look for the last ‘low’ made by the CCI indicator during the downward price movement.

In the below example, we have identified a ‘resistance’ and a ‘high’ that was made by the CCI indicator. Since the ‘high’ is more prominent on the chart, we will look for ‘long’ trades in the currency pair.

Step 2

This step is the most important part of the strategy. Here, we need to wait for the CCI indicator to market a new ‘high’ or new ‘low,’ which is higher than the previously identified ‘high’ or ‘low.’ This indicates a build-up of momentum in the market with the high chance that the market will continue moving strongly in the same direction. In the next step, we will see how to take an ‘entry’ after carrying the previous steps.

In the below image, we can see that the CCI index makes a new ‘high’ at the appearance of a bullish candle. At this moment, the price is exactly at resistance, which means we need to ‘sell’ from here. This is where the strategy comes into the picture.

Step 3

Once the market starts moving in our favor by about five pips, we enter with the appropriate position size. This is an aggressive form of ‘entry’ where we take advantage of the existing momentum. A conservative ‘entry’ would be to wait for a price retracement and enter after receiving a confirmation from the market.

In our example, we are taking an aggressive entry, i.e., at the breakout of the resistance. All traders who will be selling here thinking it as resistance would get trapped. This is the application of the CCI indicator.

Step 4

In this step, we determine the stop-loss and take-profit for the strategy. Stop-loss is placed below the previous ‘low’ in case of a ‘buy’ and above the previous ‘high’ for a ‘sell’ trade. If the ‘high’ or ‘low’ is too far away, it could reduce the risk to reward ratio. In such cases, the stop-loss can be placed 20-25 pips from the entry point. The ‘take-profit’ is set at 1:1 risk to reward.

Strategy Roundup  

If the rules are strictly followed, we may not experience any serious drawdown as we are trading based on market momentum. The key is a high probability, and this is exactly what the ‘CCI strategy’ provides. This strategy exploits the application of the CCI indicator, which is highly underrated in the forex market.

Categories
Forex Basic Strategies

Learning To Trade The Forex Market Using ‘Pure Die-Out’ Strategy

Introduction

Everyone wants to be the hero in the market and claim that they have picked the top or bottom of a currency pair. However, apart from boasting, there is no gain from repetitive selling at every new ‘high’ in hopes that this one would be the final ‘high.’ One of the biggest dangers encountered by novice traders is picking a top or bottom with no logic. The pure die-out is an intraday strategy that picks a top or bottom based upon a strong recovery after an extended move.

Time Frame

As it is an intraday strategy, the highly suitable time frames are 1 hour and 15 minutes.

Indicators

In this strategy, we will be using two indicators. The two indicators are RSI and Bollinger Bands.

Currency Pairs

This strategy works best on major currency pairs only. Among these, the preferred ones are EUR/USD, USD/JPY, GBP/USD, GBP/JPY, and USD/CAD.

Strategy Concept

The strategy looks for intraday fake-outs using three sets of Bollinger bands and the relative strength index (RSI) on the hourly and 15-minute charts. The trade setup is formed when RSI hits either an overbought or oversold level. The market is considered to be overbought when RSI moves above 70, while the market is considered oversold when RSI goes below 30.

This signals a possible reversal in the market and that we can start looking for a trade in the opposite direction. However, rather than just immediately buying or selling in hopes for a trend reversal based solely upon RSI, we add in three sets of Bollinger Bands, to help us identify the point of over-extension. We use three sets of Bollinger Bands because it helps us assess the extremity of the move along with the extent of possible U-turn.

The conventional theory of Bollinger bands suggests buying or selling when prices hit the two bands. In our strategy, we will totally be using three Bollinger bands, and when prices hit the third band on any side, we say that the move is within the 5% small group, which characterizes the move as extreme.

When prices move away from the third standard deviation Bollinger band and move into the zone of first and second Bollinger band, we are confident that the currency pair has hit its extreme point and is moving into a reversal phase.

Finally, we look for one last thing before making an entry: a candle to close fully between the second and first Bollinger Bands. This last step helps us screen out false moves and assures that the previous move was really exhaustion. This is a low-risk and low-return strategy that is suitable for traders who like to scalp the market.

Trade Setup  

To illustrate the strategy, we have considered the USD/JPY currency pair, where we will be applying the 1-hour chart strategy. Here are the steps to execute the strategy.

Step 1

Firstly, open the 1 hour or 15 minutes chart of the desired currency pair. Then plot the Bollinger band and RSI indicator on the chart. We need to plot 3 Bollinger bands with the same ‘period’ but different standard deviations. The first Bollinger band (BB) should have a standard deviation (SD) of 1, the second BB will have SD of 2, and finally, the third BB will have SD of 3. RSI will carry the default settings.

The below image shows the Bollinger band indicator plotted on the USD/JPY currency pair and the RSI on it.

Step 2

If we are looking for an overextended move on the downside, wait for the price to cross below the lower band of the 3SD BB or if we are looking for an overextended move on the upside, wait for the price cross above the upper band of the 3SD BB. Along with this, we need to see that the RSI goes below the 30 ‘mark’ in a down move and moves above the 70 mark in an up move. Both conditions need to be satisfied simultaneously.

In the example since we are looking for a ‘buy’ trade, we have to wait for the price to cross below the lower band of the 3SD BB along with the RSI reading of below 30. The below image shows that the conditions mentioned above are fulfilled.

Step 3

In this step, we wait for a candle to open and close between the 2SD BB and 1SD BB zone. It is important to check that the entire body of the candle is within this zone, and it closes near the lower band of the 1SD BB. This was for a ‘long’ setup. In the case of a ‘short’ trade, the only difference is that the candle should close between the upper band of the 2SD BB and 1SD BB.

In the below image, we can notice a bullish candle that closes well within the required zone, which is a sign of reversal.

Step 4

In this step, we determine the ‘stop-loss’ and ‘take-profit‘ for the strategy. Stop-loss is placed below or above the ‘low’ or ‘high,’ respectively, from where the reversal began. As we are trading against the trend, the ‘take-profit’ is set at 1:1 risk to reward. We will also lock-in some profits when the market starts moving in our favour, to ensure that we don’t lose money if it turns midway.

Strategy Roundup

In this strategy, we combine two technical indicators to identify the market’s top and bottom, without making wild guesses. This means we are determining overextended moves logically and technically. After practising well on the 1-hour chart, we can spot trade setups on the 15 minutes time frame. Since these are counter-trend trades, the probability of success will be less. This strategy is very simple to understand if we have basic knowledge of indicators.

Categories
Forex Basic Strategies

Learning To Trade The ‘Order Block’ Forex Strategy

Introduction

Order block is a market behavior that indicates order collection from financial institutions and banks. Prominent financial institutes and central banks drive the forex market. Therefore, traders must know what they are doing in the market. When the market builds the order block, it moves like a range where most of the investing decisions happen.

The market makes a sharp move towards both upside and downsize once the order building is completed. The key term of the order block trading strategy is that it includes what the institutional traders are doing. As they are the key price driver, any strategy that includes institutional trading might

What is the Order Block?

Financial institutes do not make a sudden investment in any trading instrument. They spend a lot of money on analysis to get the best trading result. Furthermore, they play with the money that is often impossible to arrange by retail traders.

Smart money makes several steps in their trading based on the availability of the price. For example, if a bank wants to buy $100M EURUSD, it will take trade-in three or four steps. In the first step, they will take $20M, in the second step, $50M, and in the third step $30M. The price usually makes a movement when the full quota of $100M completes.

Order block seems like a range, but every range is not an order block. Moreover, we don’t know when and where the smart money moves. Therefore, we will rely on the best location and price action to identify a suitable order block.

Besides the order block, we have to know what the order flow is. Once the price starts a movement from an order block, it provides an order flow towards any direction. Order flow from a higher timeframe indicates a market direction, and we have to find the order block towards the direction of it.

Order Block Trading Strategy

From the above section, we have seen what the institutional order block and order flow is. In this trading strategy, we will use 1 hour- 4 hours or the daily timeframe to enter the trade and weekly timeframe to identify the order flow. Furthermore, we will use the Fibonacci to identify the potential location from where the market is expected to move.

Timeframe

  • One hour to 4 hours to identify the entry-level.
  • Weekly timeframe to measure the order flow.

Currency Pair

The best part of this trading strategy is that it can provide profitable trades in all currency pairs. However, we have done extensive research and found that it works well in all major currency pairs, including EURUSD, GBPUSD, and USDJPY.

Identify the Order Flow

In the weekly timeframe, we will look for the price that tested an order block and moving higher or lower. Once it completes the test and starts the movement will find the direction.

In the image above, we can see that the price moved higher and came back sharply towards the order block with an impulsive bearish pressure but did not break the lowest. After the rejection candle, we will wait for the price to move higher with a candle close. Once the candle closes, we found our weekly order flow.

Later on, we will move to the H4 or daily timeframe and identify the order block to trade towards the direction of the order flow.

Location of the Order Block

Move to the H4 timeframe and draw the Fibonacci retracement from upside to downside. While you draw the Fibonacci level, make sure to draw from the last available price, not more than 200 candles. Furthermore, for a buy trade, draw the Fibonacci from the highest price to the lowest price.

After drawing the Fibonacci level, you should consider order blocks residing below the 50% Fibonacci retracement levels. Any price below the 50% Fibonacci retracement level is the discount price and any price above the 50% retracement level is the premium price.

In the bullish order block trading strategy, you should consider the discount price and, in a bearish order block trading strategy, consider the premium price only.

Entry

Wait for the price to break above or below the order block, win an impulsive bullish or bearish pressure. Later on, the price will make new highs or lows, but you should wait when it comes back to the order block. In most cases, the price will come back to the order block and test the 50% level before making the final movement.

Therefore, if you don’t want to monitor the price, you can take a pending order at a 50% level of the order block. However, the best practice is to enter the trade once it starts moving from the order block with a candle close above or below it.

Stop Loss and Take Profit Level

The stop loss level should be below or above the order block with some buffer. In most of the cases, use 10 or 15 pips buffer to avoid unexpected market behavior.

On the other hand, the ordinary take profit level would be towards the order flow with 1:1 risk: reward ratio. However, the final take profit level is Fibonacci 0%, which is usually the top of the available price in a bullish condition and the bottom of the price in a bearish condition.

Summary

Let’s summaries the order block trading strategy:

  • Identify the weekly order flow and consider the direction.
  • Identify the premium and discount zone level with the Fibonacci retracement levels.
  • Move to H1 to H4 timeframe and find the order block within Fibonacci 50% to 100% levels.
  • The price should move towards the order flow directly from the order block, but it should come down to test the order block again.
  • Enter the trade as soon as the price rejects the order block with a reversal candlestick.

The order block trading strategy is profitable in most of the currency pairs. However, it is essential to keep in mind that the forex market is very uncertain. We, as a trader, anticipate the price, and that’s why we use stop loss. No trading strategy can assure a 100% profit. Although the Order block is a very profitable trading strategy, you should use appropriate trade management and money management rules to avoid unexpected market conditions.

Categories
Forex Basic Strategies

We Have Simplified The ‘Dolphin Trading Strategy’ For You!

Introduction

One of the most annoying things for a trader is getting stopped out of a ‘long’ trade on the lowest possible tick, after which the prices reverse and move higher. Likewise, nothing can get more annoying than getting out of a ‘short’ trade on the highest possible tick of the move, after which prices reverse and ultimately move in our direction for profit.

All of us would have experienced this unpleasant reality more than once. We have designed a strategy specifically to take advantage of these spike moves in currencies by carefully getting into a trade by anticipating a reversal.

Traders who like to bank on consistent and small profits might feel this strategy appealing despite experiencing frequent stop-outs. Before going through the strategy and the trade setup, we must understand that while it misses infrequently, but when it misses, the losses can be very large.

Therefore, it is absolutely crucial to honor the stop-loss in these setups because when it fails, it can mutate into a relentless runaway move than could blow up our entire account if we continue to hold on to our trades.

Time Frame

This strategy works well on all time frames above the 1 hour. This strategy cannot be used for scalping as the risk is higher.

Indicators

In this strategy, we will not be using any indicators as it is based on pre-determined rules and price action.

Currency Pairs

This strategy applies to almost all the currencies listed on the broker’s platform. However, illiquid pair should be completely avoided.

Strategy Concept   

The trade setup that is formed using this strategy lies on the assumption that support and resistance points of tops and bottoms exert an influence on price action after they are breached. They act like a magnetic field attracting prices back to these points after a majority of the stops have been triggered. The thesis behind this strategy is that it takes an enormous amount of power to breakout or breakdown from tops or bottoms that are created after an extended move.

In the case of a top, for example, making a new ‘high’ requires not only huge capital and power but also enough momentum to fuel the rally further. By the time it makes a ‘new’ high, much of the momentum has passed, and it is unlikely that we will see a new ‘high.’ Dolphins have a very strong memory, and since this strategy is based on the memory of the price, we have named this strategy as ‘The Dolphin Strategy.’

 Trade Setup

In order to explain the strategy, we have considered the EUR/USD pair, where we will be applying the strategy on the 1-hour time frame. Here is the step-by-step approach to executing the strategy effectively.

Step 1

First, we need to identify a sequence of ‘higher highs’ and ‘higher lows’ on the chart when looking for a ‘short’ trade setup. Similarly, we need to identify a sequence of ‘lower lows’ and ‘lower highs’ when looking for a ‘long’ trade. Then we are required to mark the highest point (‘short’ setup) or the lowest point on the chart (‘long’ setup).

In our case, as will be executing a ‘short’ trade, we have identified a swing ‘high’ on the chart shown in the below image.

Step 2

Assuming that we have calculated our position size, we will ‘sell’ half of our position size at the ‘high,’ which was identified in the previous step. In a ‘long’ setup, we will ‘buy’ half of our position size at the ‘low’ identified previously. If the market is strongly trending upwards or downwards, we have to take a position of size lesser than ‘half.’

We are taking half of our ‘short’ positions at the previous ‘high’ once the market starts moving upwards after a retracement.

Step 3

In this step, we have to measure the distance of the ‘retracement’ or ‘pullback,’ which takes place after the price makes the ‘high’ or ‘low’ that was identified in the first step. Measuring this distance with the help of a measuring tool is crucial as further steps of the strategy are based on this distance.

The below image shows the distance of the ‘pullback’, measured with the help of a vertical pink line.

Step 4

In this step, we need to measure the exact same distance that was measured in the previous step above the ‘high’ in an up move or below the ‘low’ in a down move. In a ‘short’ setup, when the price starts moving above the ‘high,’ we will execute the remaining half of the positions at the half-way mark of this distance. Likewise, in a ‘long’ setup, we will execute the remaining half of our positions at the half-way mark of this distance, when the price starts moving lower.

The below image shows the point on the chart where we have executed the remaining positions.

Step 5

Now that we have entered the market with full position size, we have to set an appropriate stop-loss and take-profit for the trade. The ‘stop-loss’ is placed at the price corresponding to the distance of the ‘pullback’ that was measured in ‘Step-3.’ We take profits at two places in this strategy.

The first ‘take-profit’ is at support turned resistance or resistance turned support line. And the second ‘take-profit’ is at the ‘higher low’ from where the market goes back to the ‘high’ identified in the first step. In a ‘long’ trade, it will be at the ‘lower high’ from where the market goes back to the ‘low’ identified in the first step.

Strategy Roundup

One of the concerns for some traders might have with the ‘Dolphin Strategy’ is its asymmetrical structure and complex rules. Readers with good maths skills and trading experience notice the best of the trade setups using this strategy and harvest high risk-to-reward ratios. Traders need to be very strict with their stop-loss as the market might move in one direction only. However, the strategy works in our favor as it is a high probability setup.

Categories
Forex Basic Strategies

Forex Momentum Trading Using The ‘Momo Strategy’

Introduction

Some traders are extremely patient and wait for the perfect setup while others are extremely impatient and need to see a move in the next few minutes or hours or else, they are quick to hit the button for a ‘sell’ or a ‘buy.’ Most of the time, these impatient traders are chasing the market and necessarily take action when the market has already moved in one direction.

In other words, if they see that momentum builds in one direction, they piggyback on the momentum in hopes for an extension move as momentum continues to build. Once the ‘move’ starts showing signs of losing strength, these impatient momentum traders will also be the first to jump the ship.

So, if our strategy is based on momentum, we need to have solid rules for ‘entry’ and ‘exit’ to protect profits. At the same time, we should be able to do trade management to ride as much of the extension move as possible.

In this regard, we have developed a great momentum strategy that we call the ‘Momo’ trading strategy because we look for momentum or momo burst on very short term price charts.

Time Frame

The ‘momo’ trading strategy works well on the 5-minute time frame. This means each candle represents 5 minutes of price movement.

Indicators

We lay two indicators on the chart, the first one of which is 20-period EMA. The second indicator that we use is the MACD histogram. The settings for the MACD histogram is the default, where the first EMA = 12, second EMA = 26, and signal EMA = 9. All of these are based on the closing price of the candle.

Currency Pairs

This strategy applies only to the major currency pairs. Some of these include EUR/USD, USD/JPY, GBP/USD, GBP/JPY, USD/CAD, etc.

Strategy Concept

We use the Exponential Moving Average (EMA) to help us determine the trend of the market. Once the trend has been established, we use the second indicator to gauge the momentum of the move. We essentially wait for a reversal in the market, and then we try to take position only if the momentum supports the reversal move enough to create a large extension burst.

The position is exited in two segments, and the first half helps us lock some gains and ensures that a winner does not turn into a loser. The second ‘take-profit‘ attempts to catch what could become very large with less risk since we have already booked some profits earlier.

Trade Setup

In order to illustrate the strategy, we have considered the chart of EUR/USD, where we shall be applying the strategy to initiate a trade. All the steps will be performed on the 5-minutes time frame.

Step 1

Open a 5-minutes time frame chart of the desired currency pair and plot the 20-period EMA on the chart. Along with this also plot the MACD indicator on the chart. After plotting both the indicators, look for the currency pair to be trading below the 20-period EMA. The MACD histogram should be negative during this time period.

In the below image, we can see that the market is in a strong downtrend, and currently, the price may be overextended to the downside as indicated by the two indicators.

Step 2

Next, we need to wait for the price to cross above the 20-period EMA. When the price crosses the EMA, we need to make sure that the MACD is in the process of crossing from negative to positive or is in the positive territory no longer than 5 bars ago (in case of a downtrend reversal). The fulling of both these criteria together is a very strong sign of a reversal in the market. The two indicators combined together are very useful for identifying reversal in the market.

The below image shows the crossing of the price above the EMA with a single bullish candle, and, at the same time, the histogram also turns positive.

Step 3

We enter the market for a ‘buy’ or ‘sell’ after the market moves at least ten pips above or below the EMA. This is an aggressive form of ‘entry’ which may not be suitable for everyone. The conservative way of taking an ‘entry’ is by waiting for the market to re-test the EMA and then enter at the retracement. But if the momentum is strong, the market might just continue moving higher. In these times, traders who entered aggressively will only make money. It all depends on the nature of the trader.

As we can see in the below image, we have taken an aggressive ‘entry’ in the pair, i.e., exactly at ten pips from the point of crossing of the EMA. The histogram also shows that the momentum is building on the upside.

Step 4

In this step, we will determine the stop-loss and take-profit for the strategy. As mentioned before, the first take-profit is set at 1:1 risk to reward, which ensures we don’t lose money if the market turns around from the middle. The second and final take-profit is set at 1:2 risk to reward, to take advantage of the market momentum, which leads to an extended reversal. The stop-loss is set just a little below or above the EMA, which will be about 10-15 pips. A conservative trader can place the stop-loss below the ‘low’ or above the ‘high’ from where the market reverses.

We can see in the below image that the momentum continues to build on the upside (indicate by histogram), which is why the market moves smoothly to our final take-profit after we enter.

Strategy Roundup

As this is a momentum-based strategy, we can also use trailing stop-loss to capture gains of the new trend. Since liquidity is the basic requirement of the strategy, we recommended using this strategy in pairs like EUR/USD, GBP/USD, USD/JPY, and some other major pairs only. The ‘momo’ trading strategy is a powerful strategy to capture momentum-based reversal moves. However, sometimes it may not work, and it is important to figure out why it failed.

Categories
Forex Basic Strategies

Heard Of The ‘Good Morning Asia’ Forex Trading Strategy?

Introduction

In the previous article, we discussed a strategy that was in the European session. However, there are a fair number of traders who prefer the U.S. session as they feel the market tends to be more exciting and thrilling. These traders consider the Asian session to be boring and quiet most of the time.

Many part-time retail traders based in the United States and Europe miss out on opportunities in European and U.S. sessions because of work and other business commitments. The only time they are left with happens to fall in the apparent boring and quiet Asian session. Therefore, it becomes necessary to come out with a strategy that is exclusively meant for the Asia session.

The strategy we will be going to discuss today is suitable for trading during the early-morning Asian hours. This time period has numerous opportunities for traders in different time zones across the world, whether they are part-time or full-time traders. We hope that the strategy will greet everyone like the bright morning sun.

Time Frame

The good-morning Asia strategy works well on the 4-hour time frame. This means each candle represents one day of price movement.

Indicators

This strategy is based on pure price action, and hence no indicators will be used during the process.

Currency Pairs

This strategy applies only to the AUD/JPY currency pair.

Strategy Concept

Opening hours of the Asian market begin a couple of hours after the U.S. market closes. The Asian market direction tends to take its cue from the previous day’s movement during the U.S. session because the U.S. market is the largest economy of the world, and most of the institutional banks are located in the U.S.

It is observed that when the U.S. market closes with the bullish sentiment, the Asian market usually starts the day bullish. If the U.S. market closes with the bearish sentiment, the Asian market remains bearish throughout the day.

During the early morning Asian hours, the best currency pair to take advantage of this phenomenon is none other than the AUD/JPY, as the Japanese Yen and the Australian dollar are the most active currency during the Asian session.

Looking at the price action, we take an entry right after the U.S. market closes at 05:00 PM. The first requirement of the strategy is that we need a ‘range’ or a ‘channel’ before the U.S. market closes. Depending on the position of the price and where the candle closes before the U.S., we take an entry. There are many rules that we need to follow before we can use the strategy profitably.

Stop-loss is placed above or below the technical levels, which is the easiest part of the strategy. The risk-to-reward ratio for this strategy is anywhere between 1.5 to 2, which is quite good.

Trade Setup

For this strategy, the closing of the 4-hour candle corresponding to 5:00 PM New York time is crucial for the strategy. Here are the steps to execute the strategy.

Step 1

Firstly, we need to identify a ‘range’ or ‘channel’ on the chart of AUD/JPY. This becomes our trading region, where we will be carrying out all the trades. A ‘range’ or ‘channel’ is confirmed only if the price has reacted and reached the other end at least twice after touching the extremes.

We have considered an example of a trade where we will be applying the rules the strategy step by step. The below image shows the 4-hour time frame chart of the AUD/JPY pair, where we identified a ‘channel’ with multiple touches on either side.

Step 2

In this step, we need to pay close attention to the position of the price and the closing of the U.S. market. The most important part of the strategy is looking out for the price action taking place at the end of the range, which should be occurring at the close of the U.S. market. Depending on the signal we get from the market, we will take an appropriate currency pair position.

At the close (U.S.) if the price closes as a bullish candle from the support, we will enter for a ‘buy’ at the opening of the subsequent candle. If the price closes as a bearish candle from the resistance, we will enter for a ‘sell’ at the opening of the subsequent candle.

Step 3

In this step, we take an ‘entry’ with a suitable size and determine the stop-loss and take-profit for the trade. As mentioned earlier, we will enter for a ‘buy’ or ‘sell’ right after the U.S. market closes, and the next candle opens. This ensures that the risk to reward will be higher.

The stop-loss for the trade is placed a few pips below or above the key technical level of support or resistance. To increase the risk to reward ratio, we can also place it just above or below the previous candle. This would require some experience of using the strategy over a long time. The ‘take-profit’ is set at the other end of support or resistance. We can have a larger ‘take-profit’ if we are trading with the trend of the market. The ‘take-profit 1’ ensures that we lock in some profits if the trade goes against us.

Strategy Roundup

This strategy is suitable for traders with little time to trade. Furthermore, it does not require complex market analysis. It does have some strict rules which might reduce the creation of the trade setups. The ‘entry’ time of the trade is fixed at every morning. Since Japan and Australia are the first countries in Asia where markets open, there will be ample liquidity in the market that will allow traders to execute ‘long’ and ‘short’ positions very easily. All the best!

Categories
Forex Basic Strategies

Trading ‘Cable’ Using The ‘English Breakfast Tea Strategy’

Introduction

When traders deal with a particular currency pair for a long time, they start to observe certain characteristics and behavior of that currency pair. Such common behavior could be observed during market opening hours, closing hours, or major news releases. Traders may notice common behavior before and after the holiday season, such as Christmas or New Year.

Day traders enjoy the volatility of the market opening. This could be either Tokyo open, London open, or New York open. Some traders are familiar are with the pattern developed during the Tokyo open while some are comfortable trading the New York open. While some traders like to trade when the market is not extremely volatile, they prefer to trade when the market is quiet and less volatile.

The strategy we will be discussing today is based on the peculiar behavior observed in the GBP/USD currency pair. This behavior is mostly observed during the London opening hours.

Time Frame

The English breakfast tea method works well on the 15-minutes time frame. This means each candle represents 15 minutes of price movement.

Indicators

This strategy is based on pure price action; hence we will not be using any indicators.

Currency Pairs

This strategy applies only to the GBP/USD currency pair.

Strategy Concept

The pattern is observed in GBP/USD before, and after the London market opens in the morning, we have named this strategy an ‘English breakfast tea strategy.’

We have observed that when GBP/USD trends in one direction from 04:15 hours to 8:30 hours London time, it tends to move in the other direction after 8:30 hours. We now compare the closing price of the 15-minute candle that corresponds to 04:15 AM and 08:15 AM London time to determine the direction of the GBP/USD. We then enter the market in the opposite direction at 08:30 AM London time.

For example, if the closing price of the 15-minutes candle at 08:15 hours is lower than the closing price at 04:15 hours, we go long at 08:30 hours. If the closing price of the 15-minutes candle at 08:15 hours is higher than the closing price at 04:15 hours, we go ‘short’ at 08:30 hours.

The stop-loss for the strategy is fixed at 20-30 pips depending on the point of entry on the chart and risk appetite. There are two profit targets for the strategy with risk to reward ratios of 1:1 and 1:2. In other words, the ‘take-profit‘ would be at around 30 pips and 60 pips, respectively.

Trade Setup

Since this strategy is based on the London time zone, we need to make sure that we change the trading platform’s time zone to ‘London.’ If this is not possible, we should know London’s corresponding time opening with respect to our time zone. Let us see the steps required to execute the strategy.

Step 1

In the first step, we mark 04:15 hours and 8:15 hours London time on the chart. Then we look at the difference between the two candles. If the closing price of 8:15 hours is lower than the closing price of 04:15 hours, we then look for buying GBP/USD. On the other hand, if the closing price of 8:15 hours’ candle is higher than the closing price of 04:15 hours’ candle, we will for ‘short’ trades in the currency pair.

In the following example, we see that the market moves lower between 04:15 hours and 8:15 hours London time. The closing price of the latter is below the former. Therefore, we will take a ‘long’ position by executing further steps.

Step 2

In this step, we examine the ‘entry’ part of the strategy. ‘Entry’ is the simplest part of the strategy where we enter the market at the close of the 08:30 hours’ candle. If the difference between the two candles marked in the previous step is negative, we enter for a ‘buy’ at the subsequent candle. If the difference between the two candles is positive, we enter for a ‘sell’ at the subsequent candle.

We can see in the below image that the subsequent candle dropped significantly lower. As per our strategy, we will take a ‘long’ trade at the close of this candle. Let us see what happens later.

Step 3

In this step, we determine the stop-loss and profit targets for the strategy. The stop loss is usually set at 20-30 pips depending on the risk appetite of the trader. However, a technical approach for setting the stop loss is that, if the trade is taking place in the direction of the major trend of the market, we keep a small stop loss. If the trade is taking place against the major trend of the market, we opt for a larger stop loss. The first profit target is at 1:1 risk to reward, and the second one is set at 1:2 risk to reward. If we are trading against the trend, the first ‘take-profit’ ensures that we don’t lose any money even if the market turns around mid-way.

In the below image, we can see that the price hits our final ‘take-profit’ after taking an entry at the close of the red candle. Since the market was in an uptrend, we kept a small stop loss.

Strategy Roundup

This strategy is based on a fixed time period, i.e., during the market opening hours. The rules are simple and specific. Any trader can try out this strategy to benefit from the volatility associated with the market opening. However, the currency pairs will change for other market openings. Since we are not giving much importance to the market trend, we might have some losing trades in the beginning until we become expert in the strategy.

Categories
Forex Basic Strategies

Learning To Trade The GBP/JPY Pair Using The ‘Guppy Burst’ Strategy

Introduction

After discussing some of the intraday and long-term trading techniques, we will now focus on very mechanical trading strategies. The strategies discussed previously were time-driven, which means each strategy involved several parameters.

This style of trading is suited to newbies because it is purely based on a fixed set of rules and steps. Due to its non-dependence on rules specific time frames, the strategies we will be discussing span over three different categories: scalping, day trading, and position trading.

The first strategy is the guppy burst strategy, which is based on the 5-minute chart. The second strategy is English Breakfast Tea, which is based on the 15 minutes chart, and the third strategy we will talk about is the good morning Asia strategy, which is based on the daily chart.

The guppy burst strategy seeks to exploit trading profits when the market is quiet. One would have observed that the market is least volatile after the U.S. market’s close until the Asian market opens. The forex market is quiet during this time and tends to move gently. However, the market movement during this time is fairly predictable. The market again momentum after the Asian market opens.

Time Frame

The guppy burst strategy works well on the 5-minute time frame. This means each candle represents 5 minutes of price movement.

Indicators

This strategy is based on pure price action; hence, no indicators are required for this strategy.

Currency Pairs

This strategy applies only to the GBP/JPY currency pair.

Strategy Concept

Firstly, we identify a ‘range’ during the window of three hours between the close of the U.S. market and the opening of the Asian market. We are also taking advantage of the volatility that is witnessed when the opening of the Asian market is nearing. We will place a pending buy order at the range’s resistance with a stop loss at the support.

Similarly, we will place a pending sell order at the support of the range with a stop loss at the resistance. This might appear opposite for some traders who are well versed with the support and resistance strategy. The reason behind buying at resistance and selling at support is that, as soon as the Asian market opens, the market starts to trend in the same direction of the current move. This means we are anticipating a breakout or a breakdown of the range.

We will have two take-profit points in this strategy. The first profit target is set at risk to reward ratio of 1:1.5, while the second one is at 1:2 risk to reward. By this, we ensure that we lock in some profits and don’t lose when the trade goes against our favor.

Trade Setup

Since the time zone of the trade very important here, we need to mark the reference candle for the strategy. It is the one that corresponds to 5 PM New York time, which is nothing but the closing time of the U.S. market. As mentioned earlier, the strategy is applicable only to the GBP/JPY currency pair. Here are the steps of the guppy burst strategy.

Step 1

The first step is to open the chart of the GBP/JPY currency pair and then wait for the U.S. market to close. Mark this as the reference candle, and from here, the analysis of the chart begins. We need to analyze the pair on the 5 minutes candlestick chart. The below image shows an example of such a trade setup on the GBP/JPY pair. Here we see that the market is an uptrend and recently has formed a range.

Step 2

Next, we need to identify a ‘range’ where we have at least two points of support and resistance. We have to assure that the market does not start moving in a single direction after the U.S. market closes. If it does, then the strategy is no longer valid. However, the market mostly remains sideways after the U.S. session. Depending on the market’s major trend, we place a limit order at support and resistance. If the major trend of the market is up, we place the ‘buy’ limit at the resistance, and if the major trend is down, we place the ‘sell’ limit at the support.

Step 3

In this step, we do not have to do anything, but just wait for the market to hit our limit orders. At the same time, if our limit order is not triggered, we should leave the market as it is and not chase it. This is an important part of risk management.

In the below image, we see that our ‘buy’ order gets triggered a few minutes after the opening of the Asian market.

Step 4

As mentioned earlier, we have two ‘take-profit’ points for the strategy. The stop-loss placed at support if going ‘long’ in the market and at resistance if going ‘short.’ The first ‘take-profit’ is set at a point where the resultant risk to reward of the trade is 1:1.5. The second ‘take-profit’ is set at 1:2 risk to reward. We lock in some profits at the first profit target, which ensures that we don’t lose money even if the market turns around.

The below image shows how the market continues to move upwards and starts trending after the breakout from the range.

Strategy Roundup

As we are not sure when the breakout will happen, the best way to enter the market is by creating a pending order on the extreme ends of the range. The important part is the identification of the range during the three-hour window between the U.S. market close and Asia market open. Along with that, make sure to place a limit order in the direction of the market.

Categories
Forex Basic Strategies Forex Daily Topic

Trading Three-Point Reversal and Continuation Patterns

Introduction

The fundamental question that any technical investor asks it is where a trend begins and ends? The final aspiration of the analyst is to identify the start of a new market direction as early as possible, enter the market, and make money with the trend.

A technical tool that could aid in the reversal trend identification process is the reversal chart patterns, which we will review in this educational article.

Three-Point Patterns

Three-point patterns are chart formations that can be broken into two categories, identified as reversal and continuation patterns. But, in this regard, the technical trader should consider that sometimes reversal chart formations may act as continuation patterns.

Stop-Loss Setting: In general terms, the stop-loss level should be located above (or below) of the nearest peak or valley of the entry-level of the chart formation.

Take Profit Setting: There is a broad range of methods available to the technical trader to establish a profit target level. Some of the options to establish this level are:

  • A Fibonacci ratio projection.
  • Parallel trend lines defining a trend channel.
  • An equivalent length to the previous impulsive wave.
  • A range extent similar to the previous move.

Trailing Stop Use: A trailing stop is an added method to protect profits. The trail stop advances as the move progresses in favor of the trade, but the stop level holds during retracements.  This method not always improve the results, although it is an excellent psychological anchor. The downside of using trailing stops, however, is that it could generate a premature closure of the trade, thus not allowing a trade to mature properly while the current trend is still progressing.

Classical Three-Point Patterns

In the technical analysis literature, there exists a wide variety of chart patterns. However, both Thomas Bulkowski, as Fischer and Fischer, agree on a reduced group of trend reversal patterns as the best indicators of a reversal. These are identified as follows.

Head and Shoulder Pattern: The H&S pattern is the most popular trend reversal pattern. H&S tends to appear regularly in the financial charts. However, in some cases, the H&S formation fails, and the market action continues developing with its previous trend. An ideal Head and Shoulder pattern should have the right shoulder at the same level as the right shoulder.

A market entry might be taken once the price action breaks and confirms the close below (or above) the neckline. The stop-loss should be placed above the second shoulder. The profit target level is assumed to be placed at an equivalent distance taken from the head to neckline, and projected from the breakout level.

Triple Top and Bottom: These formations rarely appear in financial markets. However, when they do, they tend to be profitable. 

The entry signal is to be set once the price breaks and closes above (or below) the top (or the low) price range. The stop-loss level should be placed below (or above) the triple top (or bottom) range. As a profit target, it is recommended a range equivalent to the length of the high and low, projected from the breakout level.

Rectangle Pattern:  In this formation, the price moves between two parallel trend-lines that progress horizontally. A trade signal will trigger after the price breaks and closes above (or below) the rectangle range. 

A conservative way to confirm the entry signal consists of waiting for the closeout of the rectangle formation range. The stop-loss and profit target levels hold the same arrangement as in a triple top and bottom pattern.

Key-Reversal Days: Although a Hammer Candlestick pattern offers poor performance, it tends to increase when the price action develops a hammer in a third peak or valley at the end of a fast market.

This pattern does not have any specific entry setup; however, Fischer and Fischer considers that for the pattern to be considered, the shadow’s length of the hammer should be at least three times its body.

The stop-loss should stay below (or above) the low of the key-reversal day. The profit target level may be set at the same distance as the previous trading range.

Three Ascending Valleys and Three Descending Peaks: These formations are usually the most reliable three-point patterns.

The essence of these formations, higher (or lower) highs and lows, indicate the continuation of the trend. Generally, a long position signal will trigger if the price rises above the highest peak and a short position when the price settles below the lowest valley.

The stop-loss should be located above (or below) the recent peak (or valley.) Finally, the profit-target level should be set at the equivalent distance of the previous range projected from the entry-level.

Triangles: Triangle patterns shows three basic variations, symmetric, descending, and ascending. The symmetric triangle could be both a reversal and a continuation formation; however, the ascending and descending triangles usually are continuation patterns.

The entry signal happens when the price breaks the triangle base-line. A stop-loss order may be located above the triangle top. In the opposite case, the protective stop should be placed below the triangle.

As profit-target level, a range from the highest to the lowest level of the triangle can be projected from the breakout level.

Conclusions

The identification of the beginning of a new trend and how to make money from it has been the primary investor’s quest since Charles Dow’s era. Three-point patterns are useful tools not only to identify trend reversals but also to recognize continuation patterns.

In this context, Bulkowski’s work cited by Fischer and Fischer provides a useful statistical study, illustrating the failure rate of a broad range of chart formations. For example, the rectangle top pattern when the price breaks up has a 2% failure rate. On the other hand, the top key-reversal pattern has a 24% failure rate.

Lastly, Bulkowski’s ranking study could be a powerful tool for the technical trader, seeking ways to reduce the risk of his market entries. In this regard, identifying the patterns and their execution requires practice and confidence when placing the order on a breakout.

Suggested Readings

  • Fischer, R., Fischer J.; Candlesticks, Fibonacci, and Chart Patterns Trading Tools; John Wiley & Sons; 1st Edition (2003).
  • Bulkowski, T.; Encyclopedia of Chart Patterns; John Wiley & Sons; 2nd Edition (2005).
Categories
Forex Basic Strategies

Trading The ‘Trend Bouncer Strategy’ Using Appropriate Risk Management Techniques

Introduction

The activation of a trend can be from a political decision or an improvement in the GDP of the economy. Some other reasons include the central bank policy announcement and the discovery of new resources. Trends move like waves causing long to short term price movement in both the directions of the market.

In an uptrend, we observe that, at a certain point in time, price pullback, or retrace before continuing with the upward movement. Similarly, in a downtrend, prices retrace upward against the downward movement before continuing their way down again. This ebb-and-flow movement can be frustrating for many new traders because they are not familiar with such market moves and often get stopped out before the market starts to move in their direction later.

Experienced trend traders usually wait for a retracement before taking a trade in the direction of the major trend. This is how the trend bouncer strategy was introduced. The Bollinger band indicator provides an effective way of identifying the up and down movement of a trend.

Since this is a trend trading strategy, we will have more than one profit target. We have two specific profit levels for this strategy.

Time Frame

The trend bouncer strategy works well with the 1-hour and 4-hour time frame chart. This means each candle on the chart represents 1 hour and 4 hours of price movement, respectively.

Indicators

We will use two Bollinger bands with the following settings.

  1. Moving average 12, deviation 2
  2. Moving average 12, deviation 4

One should have a clear understanding of the Bollinger band indicator before using it for this strategy. Refer to our articles on Bollinger bands for an explanation of the indicator.

Currency Pairs

The strategy is suitable for trading in all currency pairs listed on the broker’s platform, including major, minor, and few exotic pairs. However, it is better to trade in highly liquid currency pairs.

Strategy Concept

With the Bollinger band indicator’s help, we can objectively identify the ebb-and-flow movement of a trend. When the price hits the upper band of the first Bollinger band (MA 12, Dev 2), it indicates an upward movement. In this scenario, we prepare to go long in the currency pair. As prices retrace back to the centerline of the Bollinger band (MA 12), a significant retracement has occurred, and it is time to enter for a ‘long.’

Similarly, when prices hit the lower band of the Bollinger Band (MA 12, Dev 2), it indicates a momentum to the downside, and we prepare to go ‘short’ in the currency pair. As prices retrace back to the centerline of the Bollinger band (MA 12), and it is time to enter for a ‘short.’ We will exit our ‘trade’ in two places, which we explain in the coming section of the article.

Trade Setup

In order to illustrate the strategy, we have taken the example of the USD/JPY currency pair on the 4-hour time frame, where we will find a ‘long’ opportunity in the market using the strategy. Here are the steps of the trend bouncer strategy in forex.

Step 1

Firstly, open the chart of a currency pair and plot two Bollinger bands. The moving average of the first Bollinger band is 12, with a standard deviation of 2. Moving average of the second Bollinger band is also 12 but should have a standard deviation of 4. Since it is a trend trading strategy, it is best to use the strategy on the pullback of a new trend. However, it can also be used on a reversal, but the reversal should be confirmed before applying the strategy.

In this example, we see that the market has shown signs of reversal, which could extend on the upside.

Step 2

The next step is to wait for the price to hit the upper band of the first Bollinger band, in case of an uptrend. Similarly, the price should hit the lower band when trading the pullback of a downtrend. This gives us the confirmation that a trend has been established. Now, we need to wait for a retracement of this move before we can enter the trend.

In the below image, we can see that the price exactly touches the upper band of the first Bollinger band (MA 12, Dev 2), and now we will wait for a pullback to join the trend.

Step 3

The next step is to wait for the retracement to touch the Bollinger band’s centerline. The intersection of the price and the centerline is the entry signal for the strategy. An important point to make a note here is that the pullback shouldn’t come in a single candle. This means the pullback should come in multiple candles. The longer it takes, the weaker the pullback. In such cases, the is a higher chance that the trend will continue.

In our example, we are entering for a ‘long’ as soon as the price touches the Bollinger band’s centerline. We also see that the pullback has come in 6 candles, which is desired.  

Step 4

As mentioned earlier, the strategy has two ‘take-profit‘ points. The ‘take-profit’ points are set based on the risk to reward ratio. The first one is at 1:1 RR, and the second one is at 1:2. The reason for the two ‘take-profit’ points is that since we are trading with the trend, the market has the potential to make new ‘highs’ and ‘lows.’

Strategy Roundup

Understanding the trending nature of the market helps us to identify the direction and timing of our entries. The best part of this strategy is that we bank profits in various stages. With a momentum indicator like the Bollinger band, we greatly increase the odds of being profitable in the long run.