Categories
Forex Ichimoku strategies

Ichimoku Kinko Hyo Strategy for a Takeaway

Ichimoku is a popular indicator made by Japanese experts decades ago, yet, as with other products made in Japan, it is still usable today. It is a composite indicator with several elements that are made to ensure high probability signals. However, some prop traders analyzed each element separately to determine if their roles are performing well. This article will explain the elements, describe the default way of using it, and present two beginner-friendly strategies useable right away. Ichimoku can be used in many different ways, it is far more complex than Moving Averages opening the doors for many interpretations and strategies.

Indicator Theories

There are many theories about the indicator, going very deep in its meaning even creating exclusive fan trader groups. To beginners, this might be overwhelming and unnecessary to know. The opinions presented here about the indicator and its elements are just for reference, your trading and decisions should be your own. A lot of research was done by traders about Ichimoku summarized in this article, giving you a good starting point in understanding the trend following strategies. 

If you are a beginner, then definitely you do not need to concern yourself with the mathematical background of each element, what they account in measurements, history, MA names translations, and so on. Practical application is what matters in the end, your end balance, and other, theoretical information is not going to add value at this point. Therefore, we will focus on what you do to use Ichimoku effectively in two ways. 

Indicator Elements

This indicator has five different parts. They can be grouped by their action. Moving Average crossovers is the dominant category. Two Moving Averages, Tenkan-San and Kijun-Sen are fast and slow MAs that generate the main trend confirmation signal. These do not move smoothly as classic MAs, they have their calculations causing this, but this is not a con. A second category also has two elements that make the Ichimoku Cloud – Senkou Span A and B. The cloud is a filter. It represents an area of lower quality signals generated by the fast and slow MA crossovers, therefore you should not trade.

If the price is above or below the cloud, you are safe to take the MA crossover signals. Some traders complicate the role of could elements, paying attention to the width, slope, and so on, but this is unnecessary. The last piece is the Chikou Span. This element does not have an obvious, clear role. Some traders use it while others just do not see where it fits. When you test an indicator or experiment, you try to give some meaning to it in conjunction with the price action, taking various patterns as a signal in some way. Imagination can take you to see a pattern but testing will prove if that idea is consistent and worthy. However, the factor Chinkou Span represents can be worthy or not to you. 

Kumo Cloud

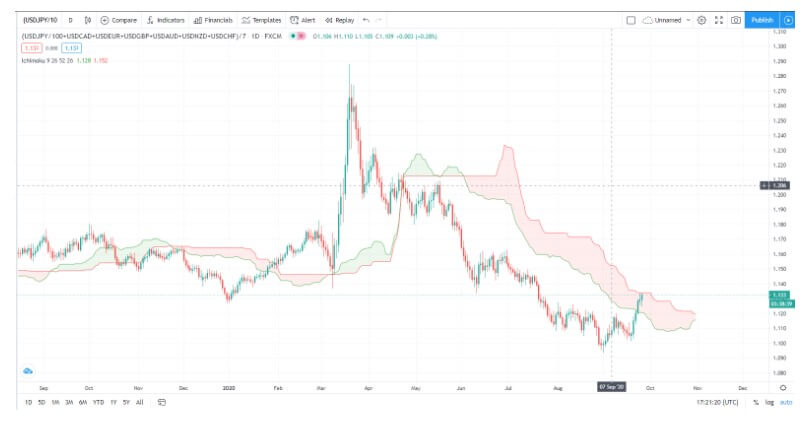
Let’s start with the Kumo Cloud part. Ichimoku is already integrated into the MT4/5 platform by default, no need to install it from other sources. The image below is showing only the Ichimoku cloud without the other elements on the tradingview.com platform. Note that the USD (USD index) is inside the cloud after a rally in a long downtrend, each candle is one day. This moment is not good for trading the USD in any currency pair since the price is in the cloud. So Ichimoku has a filter, a rare element in an indicator. For beginner traders, this is very important. When we first start trading forex, we take all the signals we can from an indicator, even though we know not all are going to be good. We also do not know which one is fake and we do not have any money management plan. Ichimoku is showing you how to discipline yourself and wait for high probability trades, a very important lesson when creating your first system and a trading plan. 

There are other ways to use the cloud but for now, we will stick with its filtering role. The cloud color change and switches are some other signals that are also going to be analyzed in another article about this indicator. Now, the Kumo Cloud has another function, not only does it tell you to stop trading that pair or asset, but it also tells you to trade only in one direction if the price is not inside it. Therefore, you enter only short trade signals if the price is below the cloud and only long if above. Now, because of these rules, a lot of your trades are not going to be eligible. Suddenly, trading you used to know as fun is becoming boring. It is now a waiting game. If you are a trader looking for fun, excitement, forex will not give you that for free. If making money is exciting to you, this waiting game for high probability trades sounds great, but do not get emotional when losing streaks come. When you get a bit more experienced, you can try to trade signals inside the cloud at half the risk you normally would. The trading system can get more advanced as you build it to the point even these trade entries end up good enough. 

Trade Entries

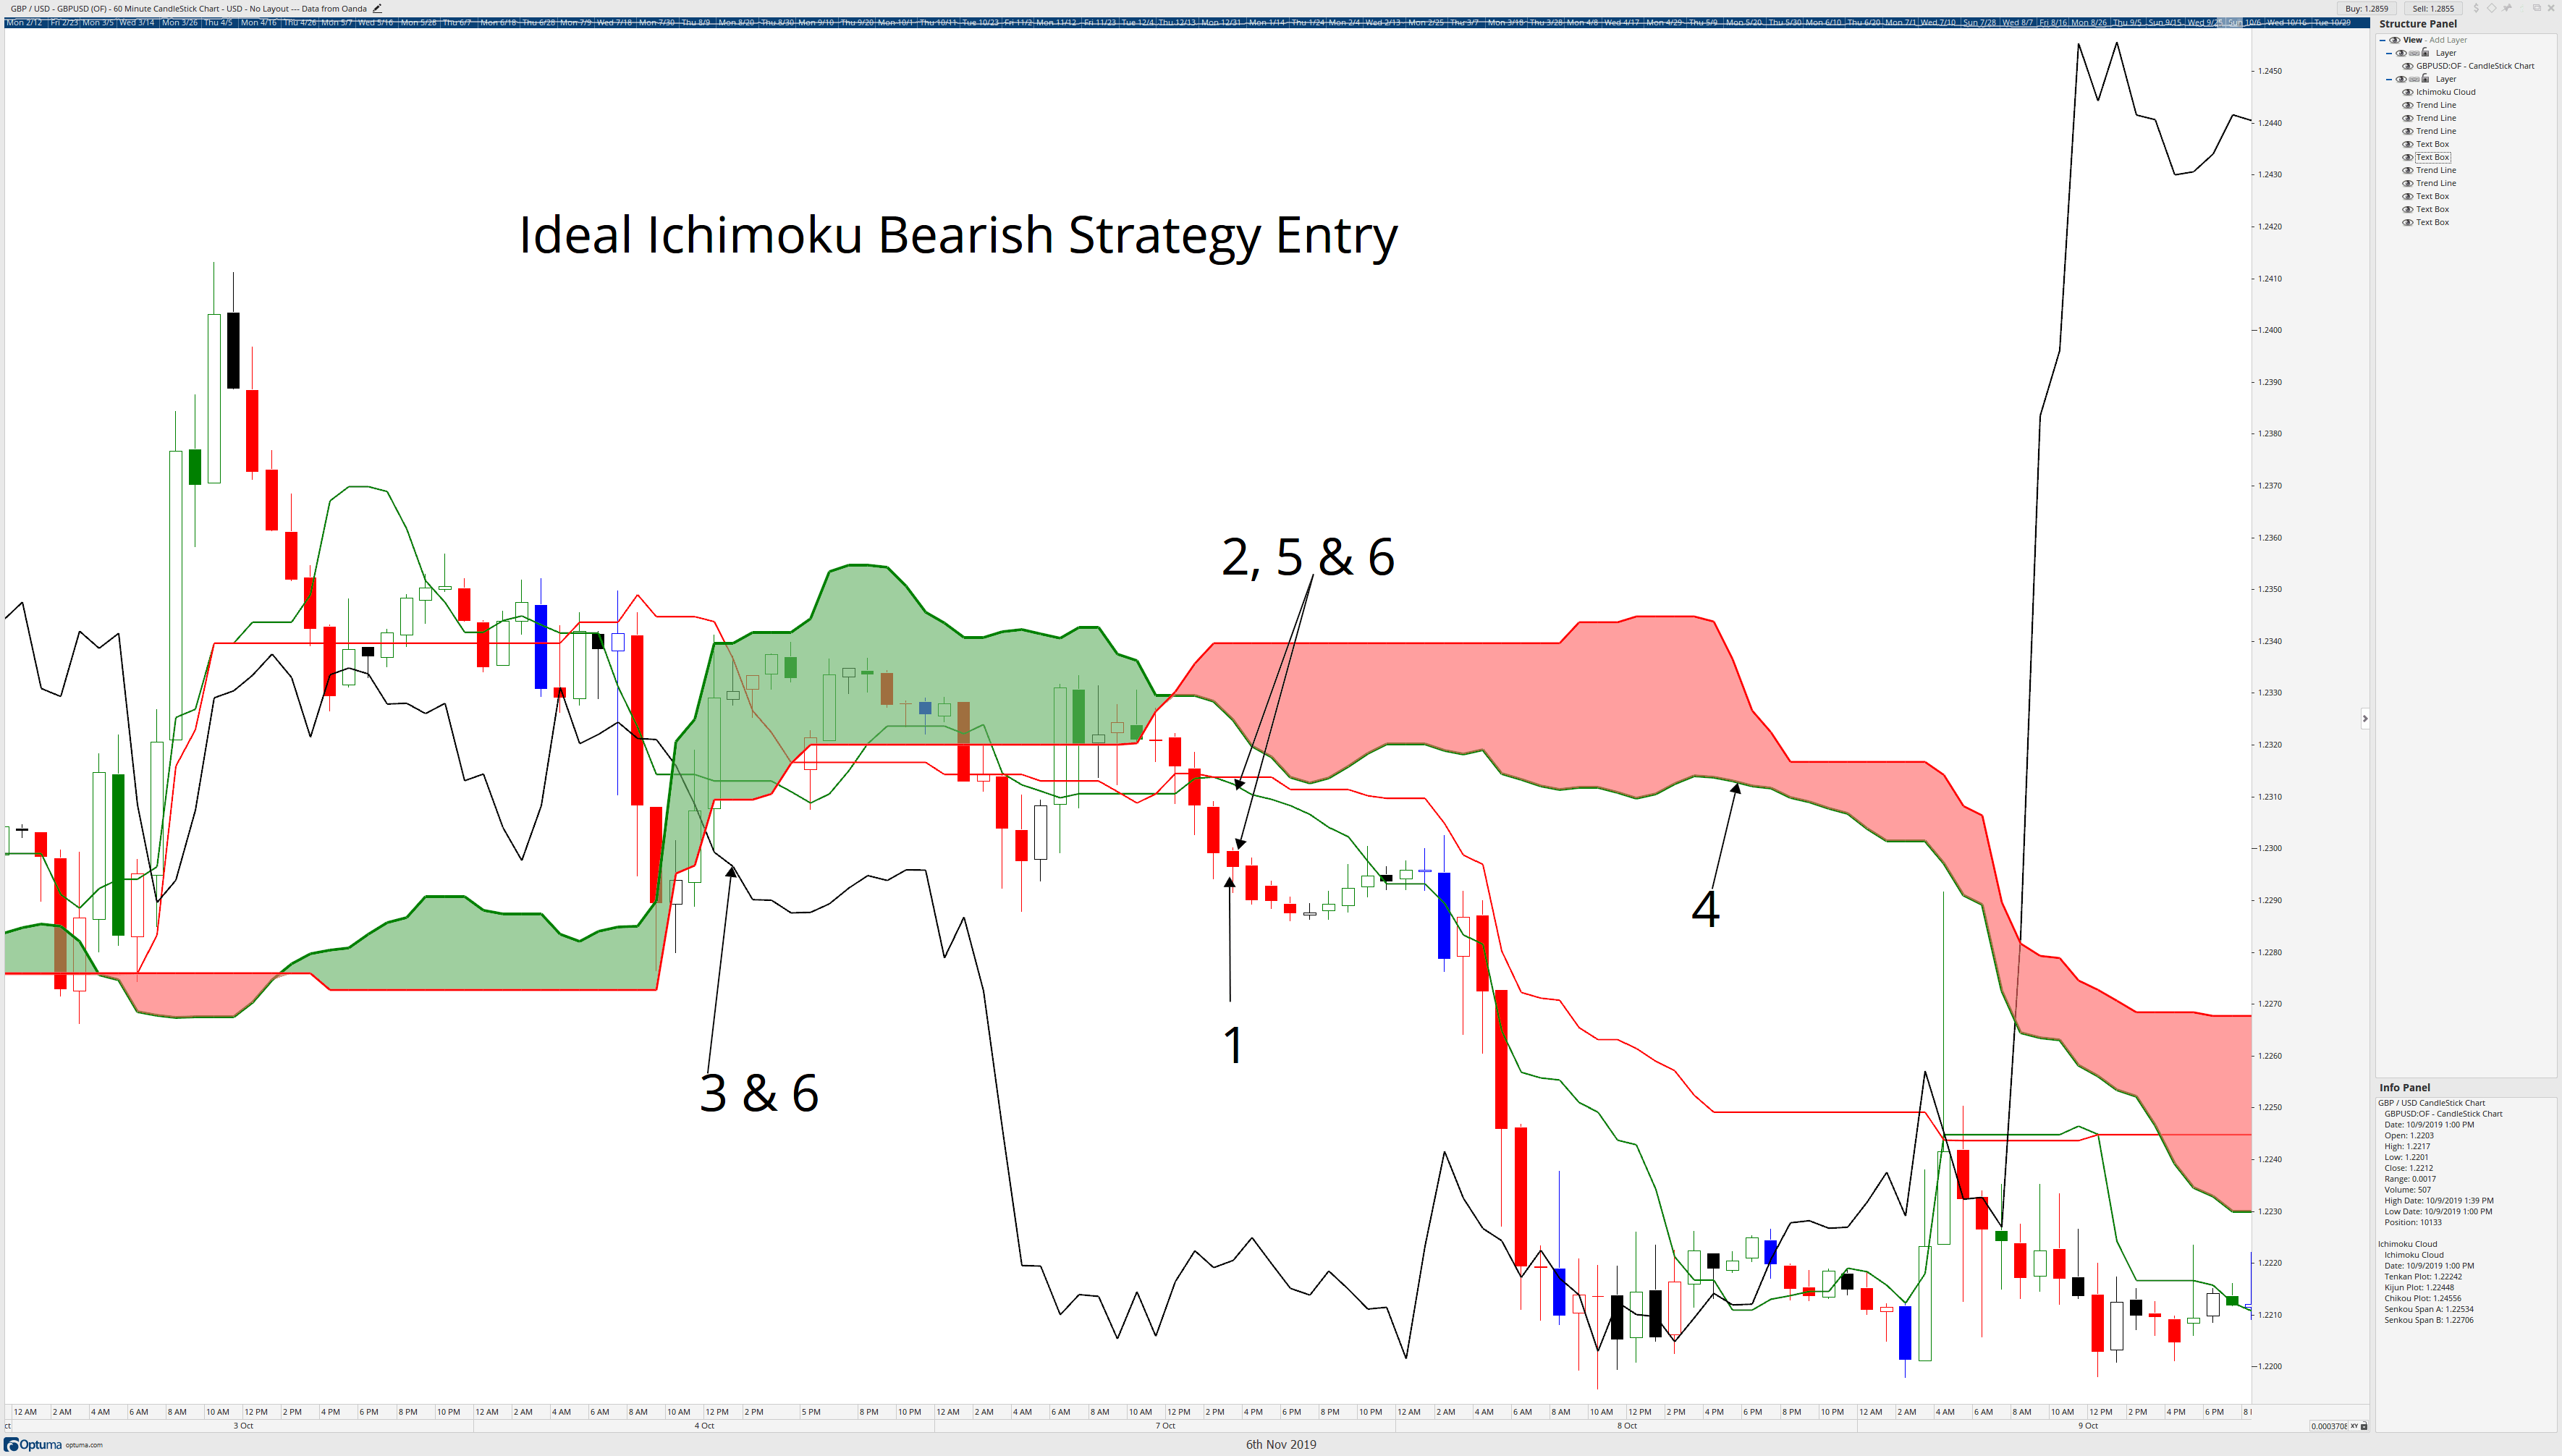
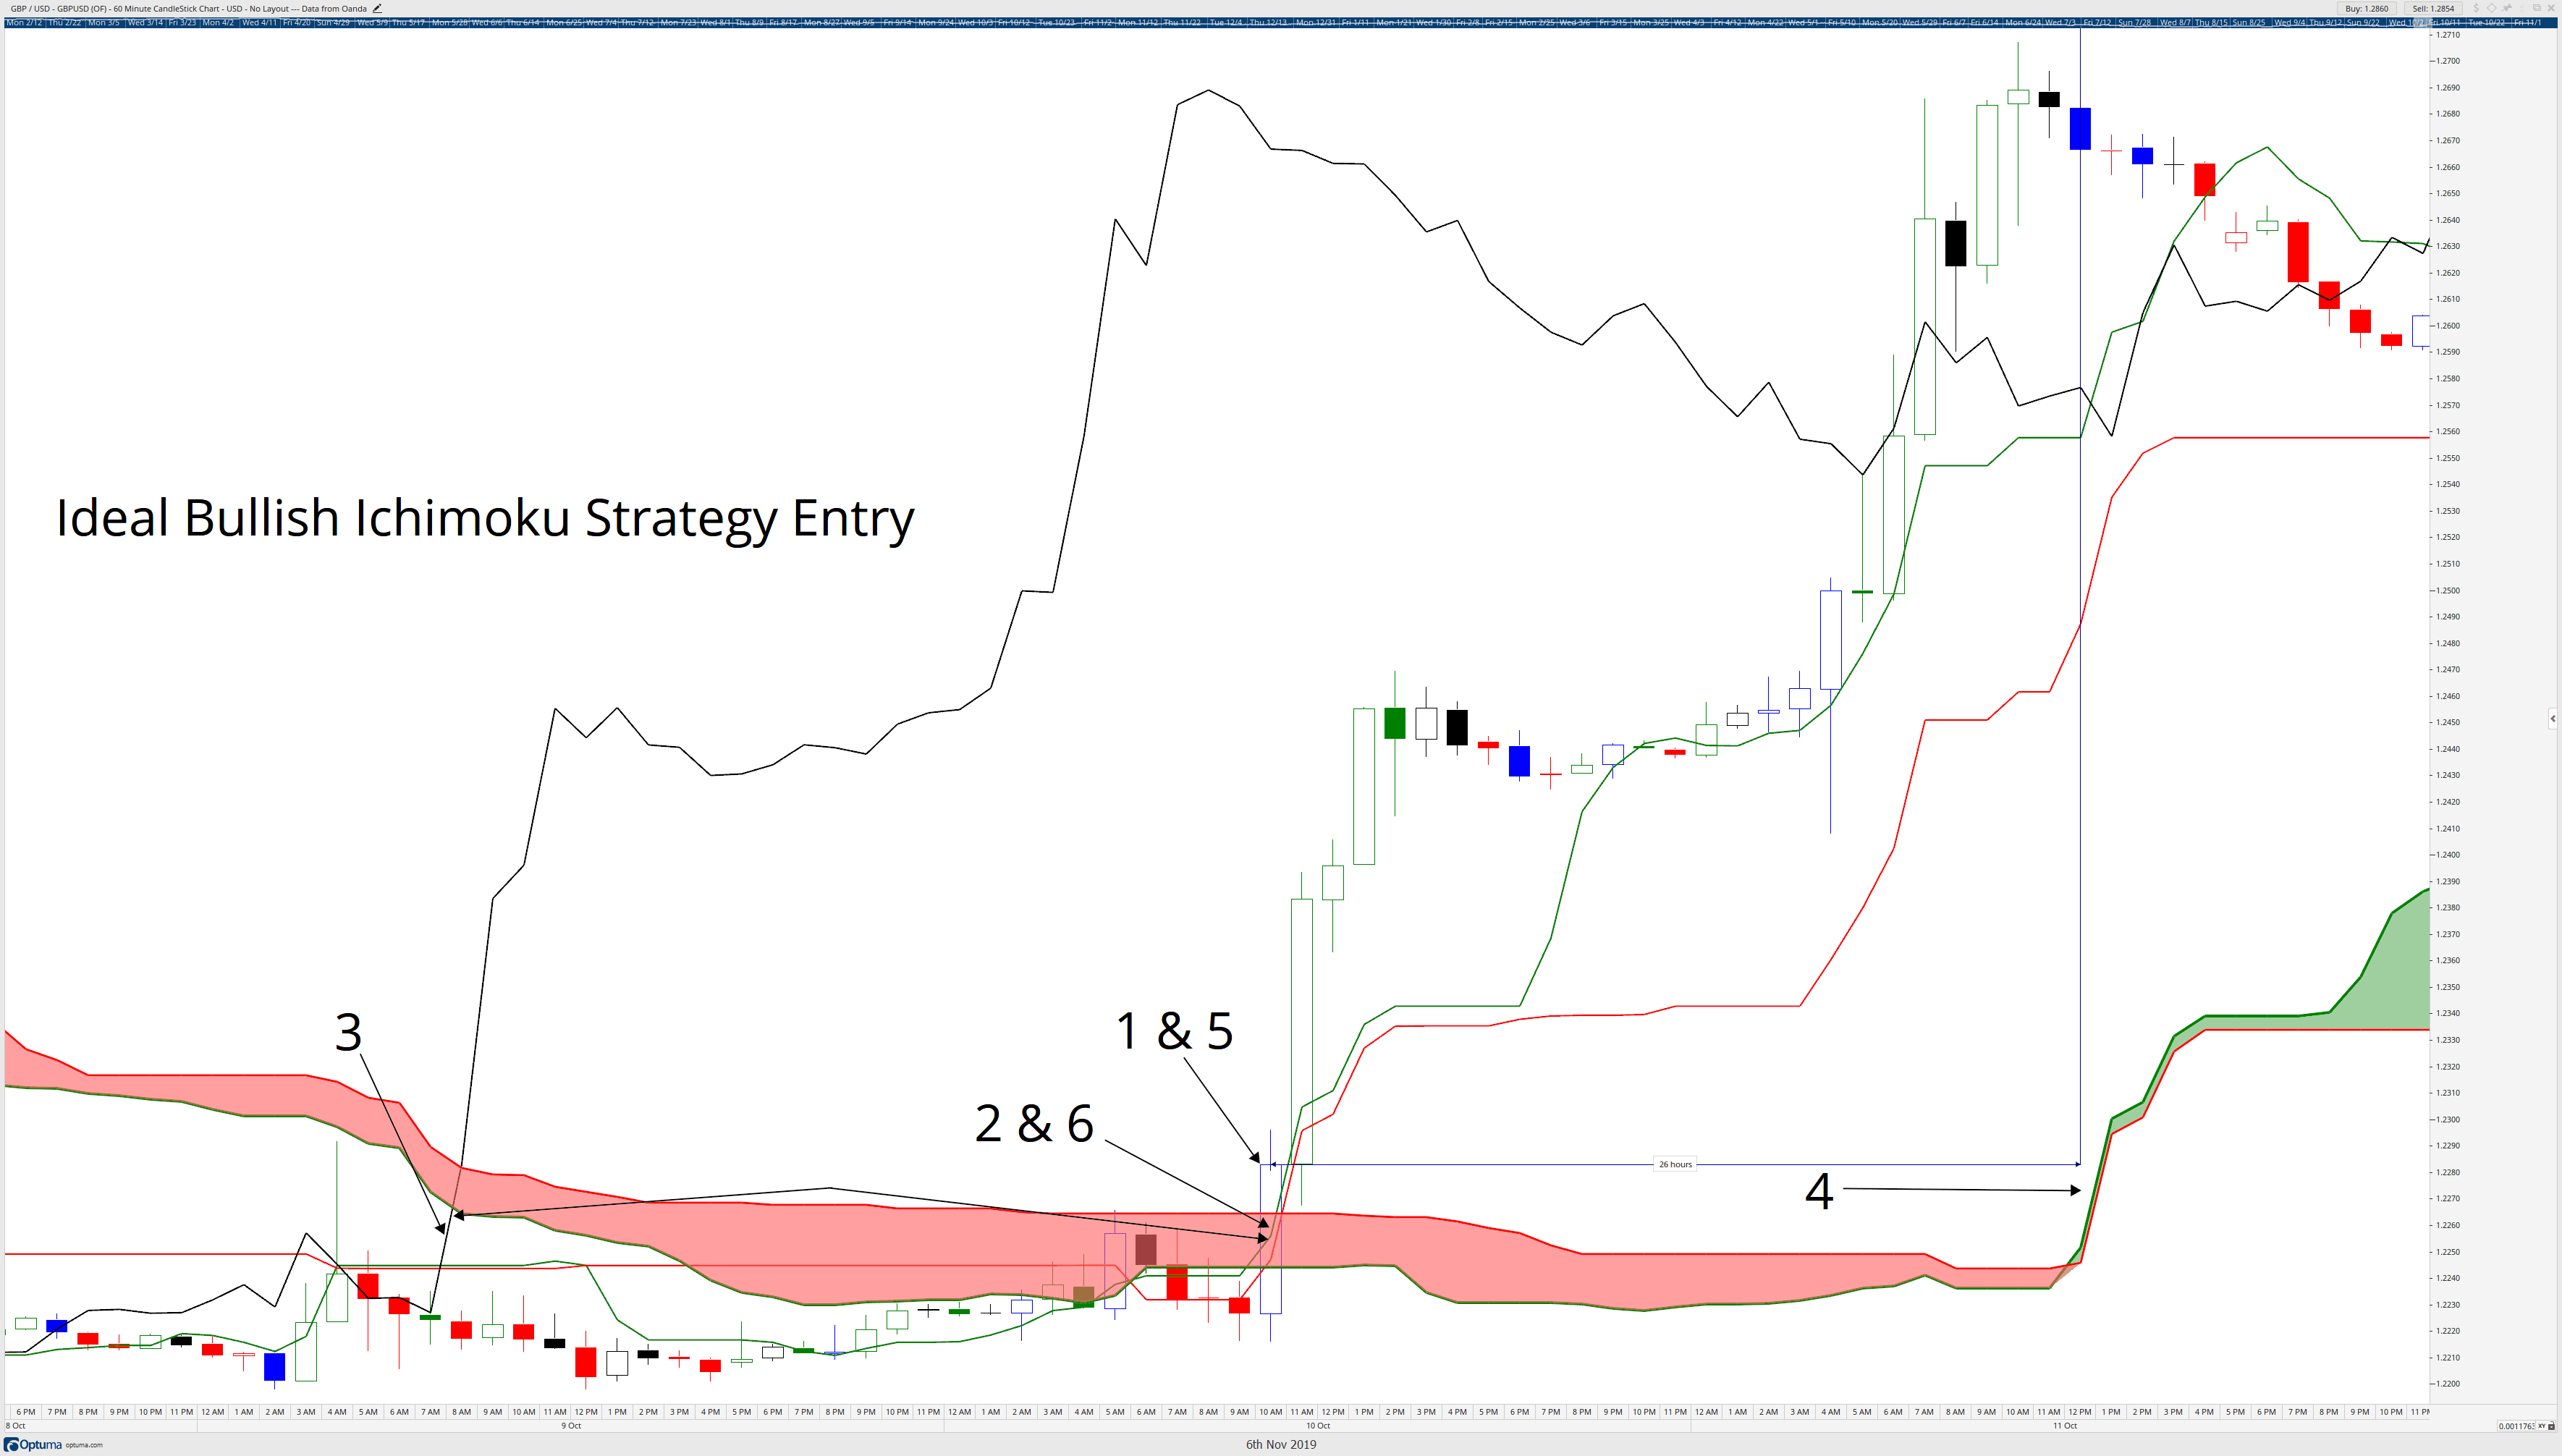
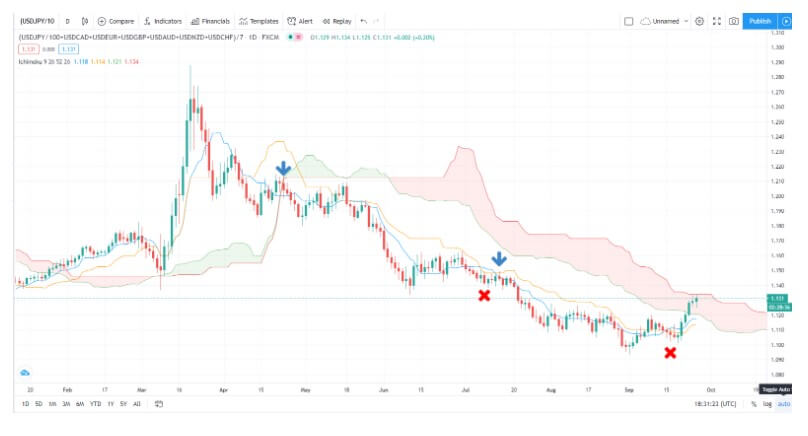
Talking about the trade entries, Ichimoku has an interesting MAs crossover solution but also price combo signals. In the picture below we have the same chart but with the Tenkan-San and Kijun-Sen present. We have added arrows for entry signals and exit markers when the MAs crossed back again. As you can see, we have only traded short trades once the price broke out the Kumo Cloud down, ignoring all long signals – when the faster blue MA crossed the slower orange MA up. All signals gave us successful trades if we are to short the USD with the best-performing currencies in this period.

Even though we are using the USD Index, you can apply any asset here. Ichimoku settings are by default. Train your discipline by following the signals to the letter including the rules of the cloud. Add on money management, where you put your Stop Loss and Take Profit, and how big are your positions. After this practice, your understanding of trends and trading will sip into your mindset. Now, every system you come up with will have these values in the core, your ascension to a professional level is now not in question. 

Put this Ichimoku trading strategy to all 28 currency pairs having the major 8, test all signals on a demo account, see if it works. If you keep it on a daily timeframe, the signals will be more consistent but you will have to trade for a longer time.

Money Management

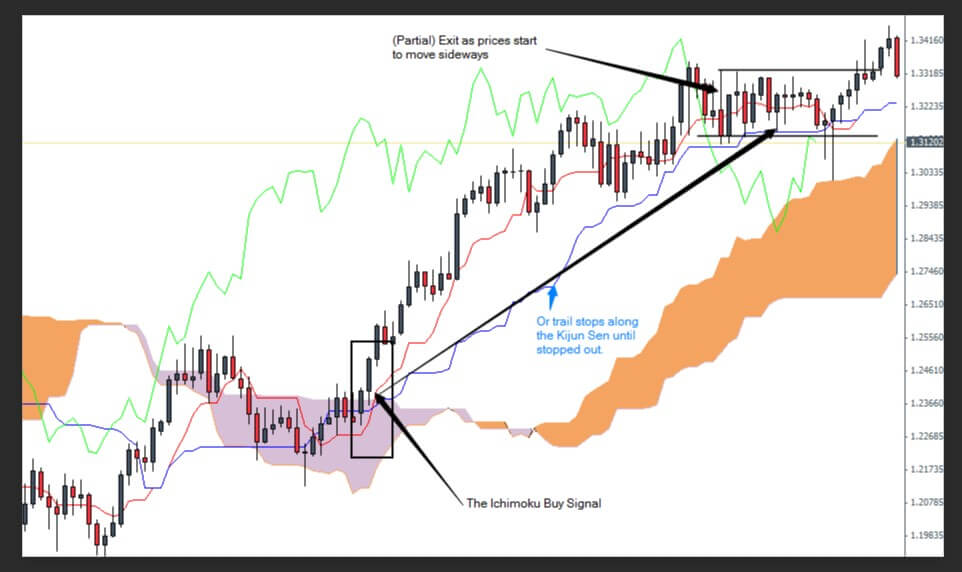
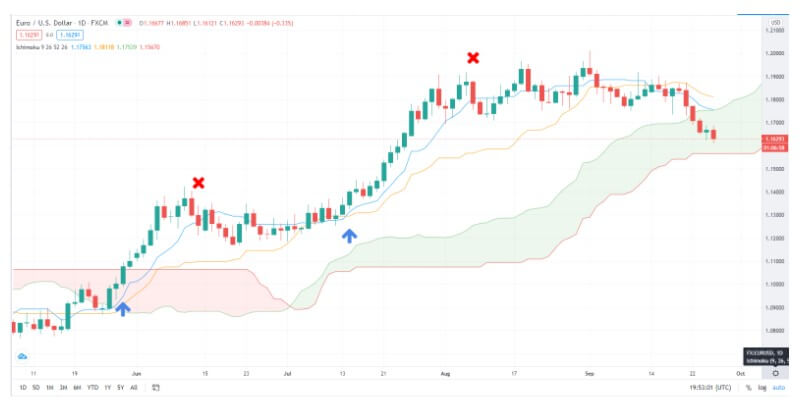
Money management is one of the top priorities in trading, above technical systems like Ichimoku. If you are struggling to create one, this indicator can also help you with that. For simplicity’s sake, you can always set your risk per trade to 1% of the account balance. Stop Loss placement can be put on the slower Ichimoku MA at the moment of the trade entry. When you are winning, if you wait for the faster MA to cross the other the exit might not be optimal. A better position can be when the price crosses the faster MA. This can also be your Take Profit in a form of a trailing stop. In the picture below we see Ichimoku in action on a daily EUR/USD chart.

Added arrows mark the moment when the price broke out of the cloud and when the MAs had a long signal. This trend lasted for about 10 days until the price closed below the fast blue Ichimoku MA. We have marked this moment with a cross, here you exit a position. If you were to exit when the MAs cross again you would take considerable drawdown risk, even though the position would have been a bit better on both long trades. The second long trade is a continuation. MAs crossed again and we have a green light to enter. This trend was even better. Ichimoku is not only an effective tool but also a great teacher of trading. As a bonus, it spurs ideas on how you interpret patterns into signals. You are probably thinking about using the slower MA as the exit moment instead of the faster, or look for a signal when the MAs broke out of the cloud. All of these are legitimate options. At the end of the day, you need to test them all. Still, have in mind improving technical analysis is not your priority, money management rules and psychology is. 

Chikou Span

The final element of the Ichimoku and the most mysterious is the Chikou Span. The line lags 26 periods, it is not drawn at the current period, it is shifted. It represents the exact price action except it is shifted back 26 periods, it is not a Moving Average. Chikou Span’s classic use is as a filter. When the line is in the cloud, 26 periods before, you do not enter a trade if there is a signal currently. 

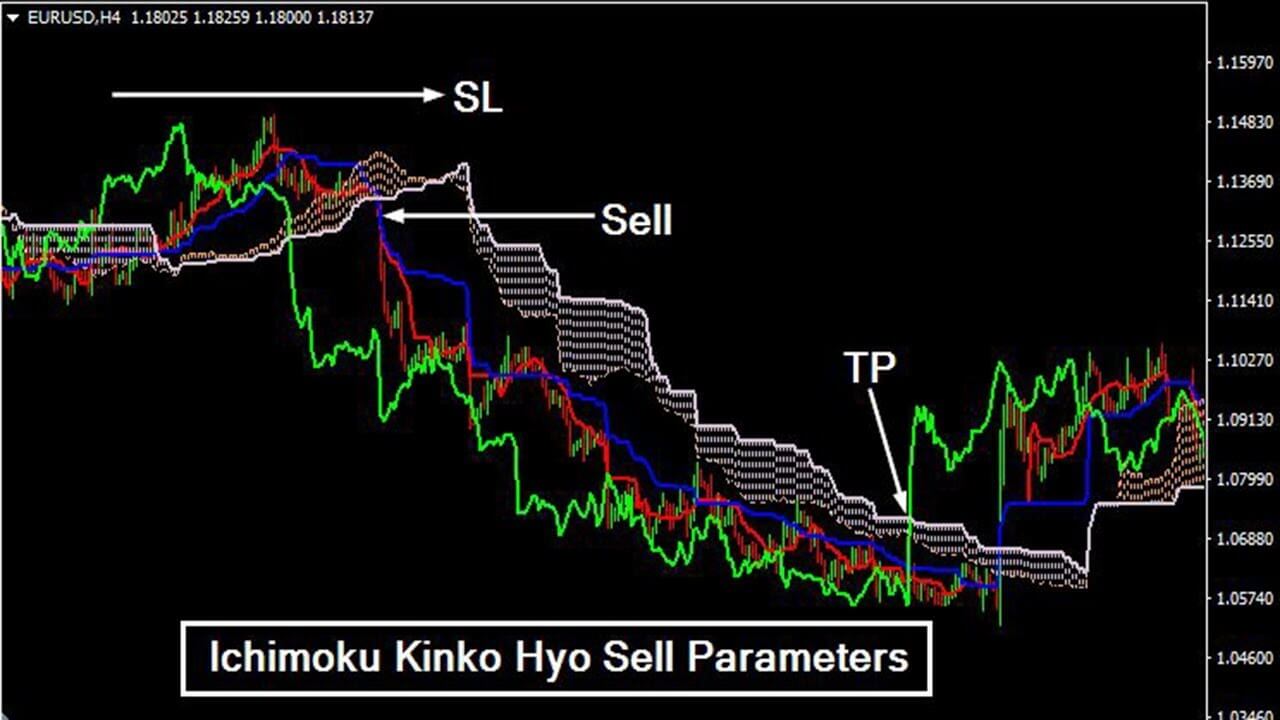
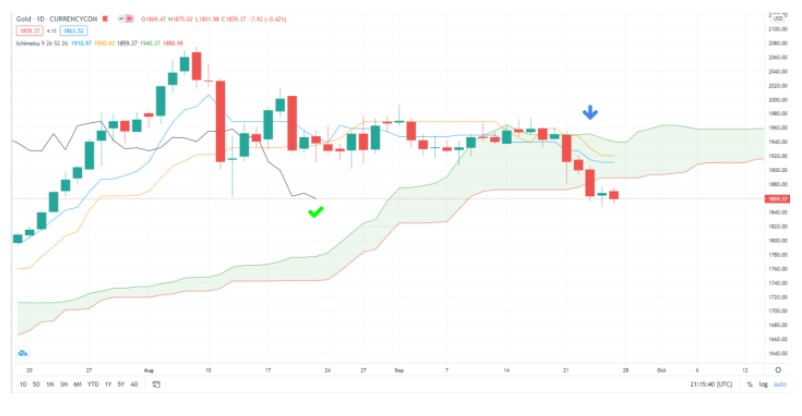
In the picture below we have Gold on a daily with a complete Ichimoku indicator on default settings. The usual MA cross gives us a signal to short the Gold, the price went out of the cloud and the Chikou Span line colored black is also out of the cloud. We have everything set up to short here, the entry moment is marked with an arrow, and the Chikou Span is checked. 

Chikou Span can also sometimes be above the cloud when you have a short signal. This is also a case when signals are filtered. Sometimes this filter can cause you to miss good trends and sometimes it keeps you out of fake signals. Some traders do not see it as an effective tool while others rely on it every time. Again, what every trader needs to do is test it out. Not only every trader is different and has different systems, but also they trade different assets, some of which Chikou Span is a very useful filter. This element can be interpreted in your own way, you do not have to blindly follow classic views. 

A Final Word

Ichimoku is fantastic for beginners. It has money management levels, filters, effective confirmation elements, and trains discipline. Furthermore, the ideas that it can spur create motivation to dive deep into forex trading. Just take caution not to get overexcited, when you meet a losing streak your morale can take a hit to avert you from trading completely. Since Ichimoku is already integrated into the MT4, there is no effort barrier to start trading the right way.

Do not think if you trade Ichimoku only will get you to the professional level. You will have results, but beginners need to understand that having a break-even result at the end of the year is a success. Most traders are bust because of bad money management (if any) and no discipline, while Ichimoku traders have learned how to stay above. The rules you set before testing are permanent. Think about how do you want to use the elements of this indicator, if the Chikou Span is good enough, where are your Take Profit and Stop Loss levels, how much to risk, how will you measure volume or volatility since Ichimoku does not cover this category, and so on.

Set everything up and then start executing without deviations. After testing is done, analyze your trades, try to cut the losers first with some measure or a tool, and then try to catch more winners with other methods. This indicator has so many traders and there are so many methods to use it. Some professional traders just use one or two elements and add other tools that improve on it, creating a unique system. The second Ichimoku article will present other aspects of this indicator you can also take and apply to your trading right away. 

Categories
Forex Ichimoku strategies Forex Trading Strategies

Breakdown of the Ichimoku Strategy

Trading only with the Ichimoku will not get you to the top trading levels, but some parts of this indicator are worth analyzing as one of the best you can find according to certain professional technical traders. Taking elements from Ichimoku and applying it to your system is a good idea. Very often taking certain elements with a specific role from other systems and adapting them to your system advances trading to another level in terms of technical precision. However, these improvements are a priority only when you develop money management and a trader’s mindset.

Ichimoku allows a beginner to develop all of it. It has enough parts to cover the most important trading aspects and it is also a base for money management. Of course, developing a proper mindset takes time, and only if you have the discipline not to deviate from the plan. Ichimoku system or indicator will not get you far, at least not into the pro trading level, yet on the other hand, it presents a great path for learning. In our previous Ichimoku article, we have discussed the best ways to use it. Now we are going to see how good it is when each element is separately analyzed. Collectively we already know Ichimoku is a good indicator, but can it be better or can you use some parts of it that are just great on its own for something else?

The synergic effect all these elements create can be broken if you tamper with them, but does it mean a system is great only if its elements are great separately? According to technical prop traders, this holds true, players make the team, however, bad players are unlikely to make a great team however good they are when playing together. So let’s break down the Ichimoku, see how good the elements are. 

The Chinkou Span element is not used very often and is unique to the rules of the Ichimoku system. It is unusual in many ways since it is just a price level line shifted 26 periods back and yet it is used as a trade filter in conjunction with the Ichimoku cloud. Whatever your decision on using it is, Ichimoku trading will still be good enough provided you stick with the plans. According to professional traders, when you trade with it for a long time, you will want to move on and improve. A lot is missing with Ichimoku, forex areas you want to cover and implement into the system. Similarly to playing chess, when you start without any plan or strategy, anyone can beat you. When you follow a structure or a strategy, suddenly you can beat anyone you know. The basic strategy you have will not work against professionals, of course. This is the same feeling we get trading with Ichimoku only after some time. 

Ichimoku indicators are quite old, made in 1930. They still work but makes you wonder is it possible nothing better has been made for almost a century and can new, better indicators be applied instead. When you test new indicators you will see they are not very good, more often they are abysmal when it comes to signals and filters. But occasionally you will find great ones worth keeping. Technical traders say some people hate indicators because they never went on the quest to find the ones worth in gold. Note though, the awesome indicators you find may not play well when you plug them into your system. Creating this algorithm is a lot of trial and error work that not many will want to pursue.

Even though the indicator is great but does not fit however you tweak it, keep it. Systems evolve with your improvement and research, and it may not take a while for this great indicator finds its role in a new system version of yours. Now, Ichimoku has not evolved for a long time, forex has changed, computers have changed, people too, it is interesting how it still works to a certain limit. Additionally, forcing you to use the Ichimoku indicators combination only is a very limiting view and practice. It will not get you far. 

Opinion presented in this article should not concern you, especially if you already have a system that brings profits consistently. It is for those who are still building their system. Ichimoku Indicators are all based on lines calculated based on the price movements. Some will call these secondary indicators, primary is the price action. These lines create a cloud, MA crossing signals, and the Chikou Span on its own. Some people create mystery about the secrets of Chinkou Span, but there are no secrets, if traders do not see how it fits their systems it does not mean there is a secret ( and also profitable?) meaning.

It is common to see people making something more interesting by stirring up a mystery, hype, or other unproven claims. Mysticism explains nothing, however, this trend was popular since the 80s and it was carried over to healthcare, conspiracies, lifestyle, diets, mental practices, and to forex trading too. There is no room for these interpretations for professional traders. Everything technical traders do have a number, a measure, or evident meaning. Ichimoku indicator and especially Chikou Span attract esoteric interpretations you should ignore. There are so many ways Ichimoku can be interpreted and this is not the one you need even though they are popular. 

Since we are going to measure the performance of every Ichimoku element separately, let’s see how Chikou Span goes on a daily chart. You can use this line in the basic already explained way or have some other interpretation with the price, for example. If we look at Chikou Span only, when the price is below the line 26 periods before we trade only shorts, and when it is above only long trades. So it is still a filter indicator and there are even more ways to use it. Try to test is with your favorite trend confirmation indicator.

Does Chikou Span filter bad trades, make your confirmation indicator better? If the answer is yes then you may have an element worth your while. However, according to the testing made by other prop traders, the results are not good and pale to other filtering methods. It should eliminate losers and keep the good as much as possible. Unfortunately, Chikou Span filtered too many winners and not enough losers whatever method we have used. So we are eliminating this element from our list, we will have to find other filters. But let’s move on to other arts of Ichimoku.

Ichimoku Cloud is formed by Senkou span A and B. The cloud is the purpose of these two lines. Traders also have many ways to what they pay attention to and how they interpret signals or filtering with the clouds and the lines. There are three main ways. The first one is the classic way, take only shorts if the price is below the cloud and vice versa. The second one is using the cloud extension. If you have noticed, the cloud goes beyond the current asset price, into the future.

Since we have it in the future, it can also mean it is plotting a prediction of how the price can behave. The cloud has a bullish and bearish color, usually marked by green and red shade. The cloud will shift bullish and bearish shades telling traders there is a price momentum shift probably too. The third most common use of the cloud is as a dynamic Support and Resistance. Traders will interpret any price breakouts out of the cloud as a signal to enter a trade. In this case, the cloud is a signal generator and a reversal predictor, not a filter indicator. 

Now when we test the breakout way of interpreting the cloud we do not have consistent results. There are many cases when the price closed and broke through the cloud only to reverse. Some of the breakouts are false, some are good, overall not good enough compared to other tools. So this method is not classic but it does not mean it is better either. However, you will need to test this out yourself. As for the reversals, we found it is hard to define a reversal signal as the price can enter and get out of a cloud multiple times in a couple of days. This problem is especially apparent when in ranging areas, where reversals should work better than in trending. Whatsmore, reversal strategies are not as good as trend following according to many studies. We will eliminate the breakout way of how the cloud is interpreted and move on to the cloud predictor way.

Whenever the Kumo Cloud turns its colors, this is a signal the price is going that direction. When we have a future shift and see the cloud in front of the current price, we can use it as a predictive signal whenever it switches colors. Is it accurate in predictions? According to our tests, its performance as a trend confirmation or prediction is abysmal. It even feels like the prediction part of the cloud is there just because the cloud is used as a filter in a classic way, and the rest of it is just the result of the code. It was never meant to be a confirmation or prediction tool.

It would be great to have something that predicts the price, even with average accuracy, but we have not found a way to have anything remotely useable. A combination with other indicators could make it better, and it can be your quest to find it. Just do not invest too much effort into something it is unlikely to get better. We say this because no indicator can predict the effect of the big banks, news events, and other catalysts. The only way to partly predict this is by having insider bank information. Let’s move on to the next way. 

We have only left the classic Ichimoku cloud role interpretation. While trading this way, one cannot notice trades are far apart if we trade only when the cloud filter allows for it, without any other rule, such as when the price breaks through the cloud. Now, this is great for training your discipline but it definitely filters out trends that make a difference to the balance have you taken the trades filtered. On some occasions, only two to three trades can happen on a particular currency pair in one year. This is not optimal if you want to forward test some system, it would take you a long time to have a good trading sample. When you get advanced, the Kumo cloud is not good enough. If you are a beginner, the cloud and complete Ichimiku will teach you a lot of essential skills. 

After all said and done, the cloud and all of its interpretations do not have a place in prop traders’ algorithms. Moving on to the last pieces of Ichimoku, the MAs. In the article about crossovers we have presented the drawbacks and how MAs can be used more effectively. If we take the classic Ichimoku approach and wait for the MA crossover as a trade entry signal, they tend to lag too much, similarly to the other MAs types. This is not about the settings, it is inherent to crossovers no matter what settings you set. If we take the price instead of one MA and use it as the signal generator when the price close-crosses the MA, we have a whole new result. We can take the faster MA out and use only Kijun-Sen.

What we get is very good entries but not quite in line with our usual Take Profit and Stop Loss levels according to the ATR. There is simply too much drawdown. However, Kijun-Sen can play a critical role if we follow our system structure. Kijun-Sen is a top-rated Baseline element to some prop traders. On its own, it can generate consistent results if each crossover is taken as an entry. This means it is a very good candidate for our system that can refine the signals once use in conjunction with other elements. 

Kijun-Sen is the element we can take out of the Ichimoku. We have described the Baseline in another article, according to one trader’s ranking, Kijun-Sen is top 100 indicator in the baseline category. You do not need to adjust the settings if you follow our structure on the daily chart. The baseline is also the core for our money management, it is the starting point for our ATR measurements and it is involved in some of the trading rules. Now you have something for a takeaway, still do not stop your search for better tools. Kijun-Sen will up your odds tremendously, still, it may not be enough for the elite rank. 

Finally, you can trade Ichimoku, test it, see it in different ways, even find something we did not, there is nothing obligatory in this article. Ichimoku has a forced group of indicators, it will force you to trade its way even though it has limited performance. Later on, when you need to advance, you need to make your system. Kijun-Sen based indicator already exist, some of them have some addons that may or may not improve its effectiveness. One example of such an indicator is Jurik Smoother Kijun-Sen by Mladen, available for free. It is available on various popular trading websites.

Categories
Forex Ichimoku strategies Ichimoku

Ichimoku Strategy #1 – The Ideal Ichimoku Strategy

The Ideal Ichimoku Strategy is the first strategy in my series over Ichimoku Kinko Hyo. There are two sides to a trade, and so there will be two different setups for long and short setups. This strategy comes from the phenomenal work of Manesh Patel in his book, Trading with Ichimoku Clouds: The essential guide to Ichimoku Kinko Hyo technical analysis. Buy it, don’t pirate.

Patel identified this strategy as the foundational strategy. Because it uses all of the components of the Ichimoku system, I believe that this is the strategy that people should be able to know so well, that they can glance at a chart and understand what is happening. You should see this strategy and be ready to trade it profitably before you transition into trying other Ichimoku strategy. If you don’t, you can run the risk of being disenfranchised with the system and believe that it is another trading system that doesn’t work.

Moving on to the other strategies without mastering this strategy first is very dangerous to your trading development and your understanding of the Ichimoku Kinko Hyo system.

Ideal Ichimoku Bullish Rules

  1. Price above the Cloud.
  2. Tenkan-Sen above Kijun-Sen.
  3. Chikou Span above the candlesticks.
  4. The Future Cloud is ‘green’ – Future Senkou Span A is above Future Senkou Span B.
  5. Price is not far from the Tenkan-Sen or Kijun-Sen
  6. Tenkan-Sen, Kijun-Sen, and Chikou Span should not be in a thick Cloud.
Bullish Ideal Ichimoku Strategy Entry

Ideal Ichimoku Bearish Rules

  1. Price below the Cloud.
  2. Tenkan-Sen below Kijun-Sen.
  3. Chikou Span below the candlesticks.
  4. The Future Cloud is ‘red’ – Future Senkou Span A is below Future Senkou Span B.
  5. Price is not far from the Tenkan-Sen or Kijun-Sen.
  6. Tenkan-Sen, Kijun-Sen, and Chikou Span should not be in a thick Cloud.
Bearish Ideal Ichimoku Strategy Entry


Sources: Péloille, Karen. (2017). Trading with Ichimoku: a practical guide to low-risk Ichimoku strategies. Petersfield, Hampshire: Harriman House Ltd.

Patel, M. (2010). Trading with Ichimoku clouds: the essential guide to Ichimoku Kinko Hyo technical analysis. Hoboken, NJ: John Wiley & Sons.

Linton, D. (2010). Cloud charts: trading success with the Ichimoku Technique. London: Updata.

Elliot, N. (2012). Ichimoku charts: an introduction to Ichimoku Kinko Clouds. Petersfield, Hampshire: Harriman House Ltd.