Introduction
One of the major goal of every trader is to measure the momentum of the asset they are trading; momentum can confirm that whether the security is about to reverse or the trend is strong enough to print brand new higher high. Simply momentum indicators are the tools utilized by the traders to get a better understanding of the speed of the price action changes its direction. Most of the technical indicators used to measure the momentum are bound between the two technical levels. This is important because when the asset goes above the centerline, it is an indication that the momentum of the underlying security is increasing. So when the price action reaches the overbought and oversold conditions, it suggests that the asset momentum is weakening and would signal a reversal in a trend. Some of the major tools to measure the momentum are Stochastic, RSI, ROC, and MACD.
ADVANTAGES OF THE MOMENTUM INDICATOR.
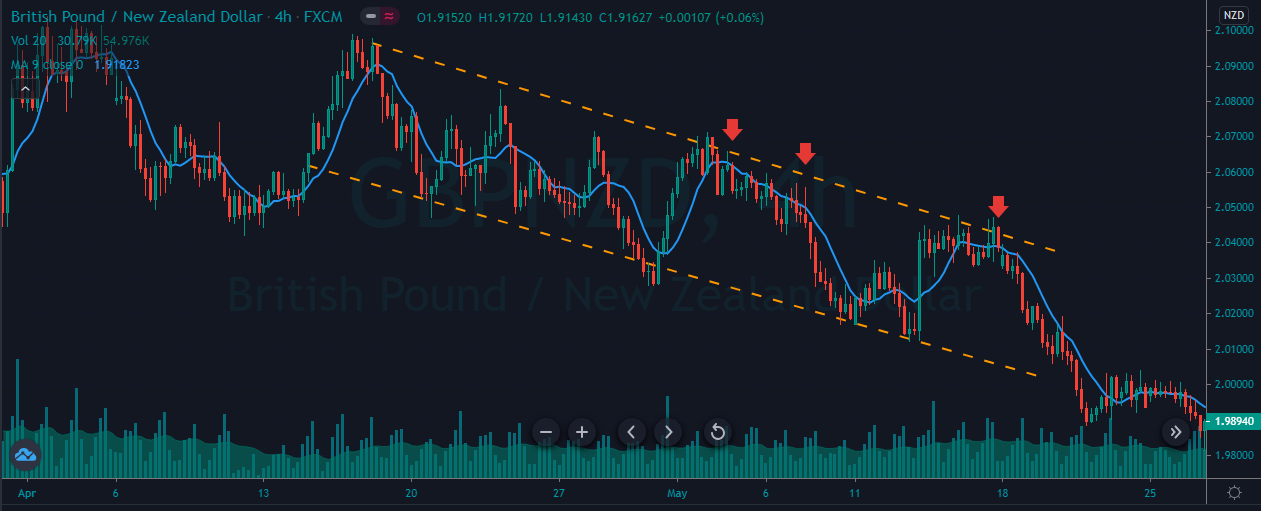
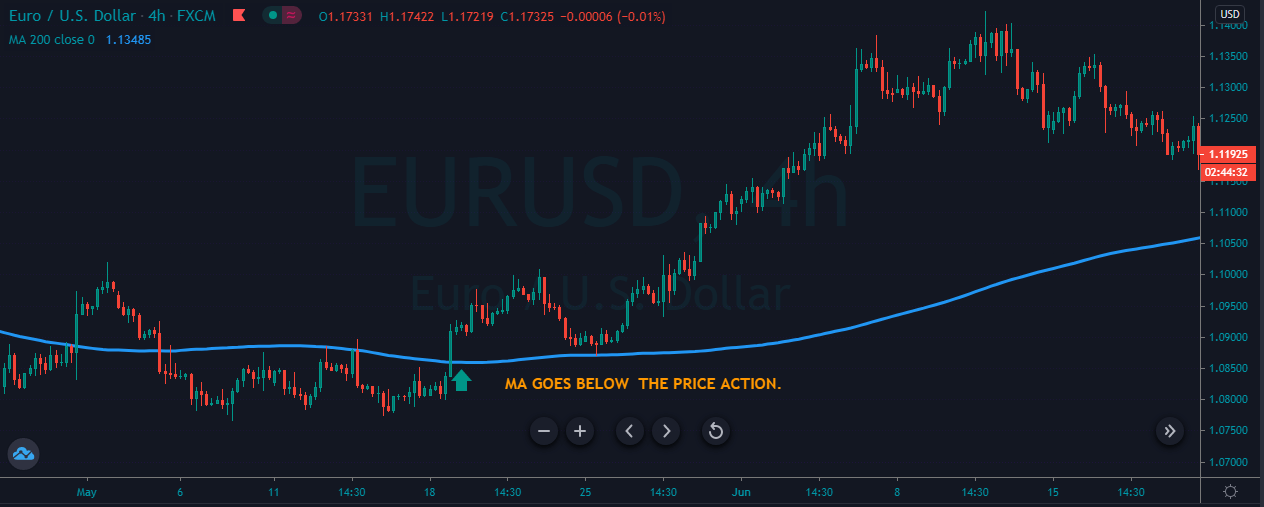
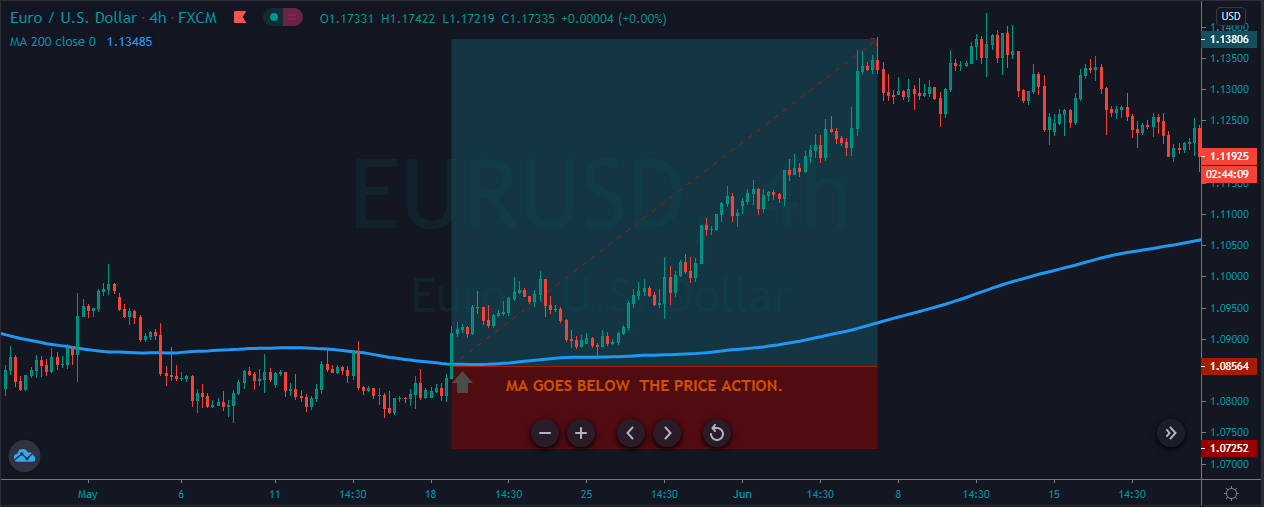
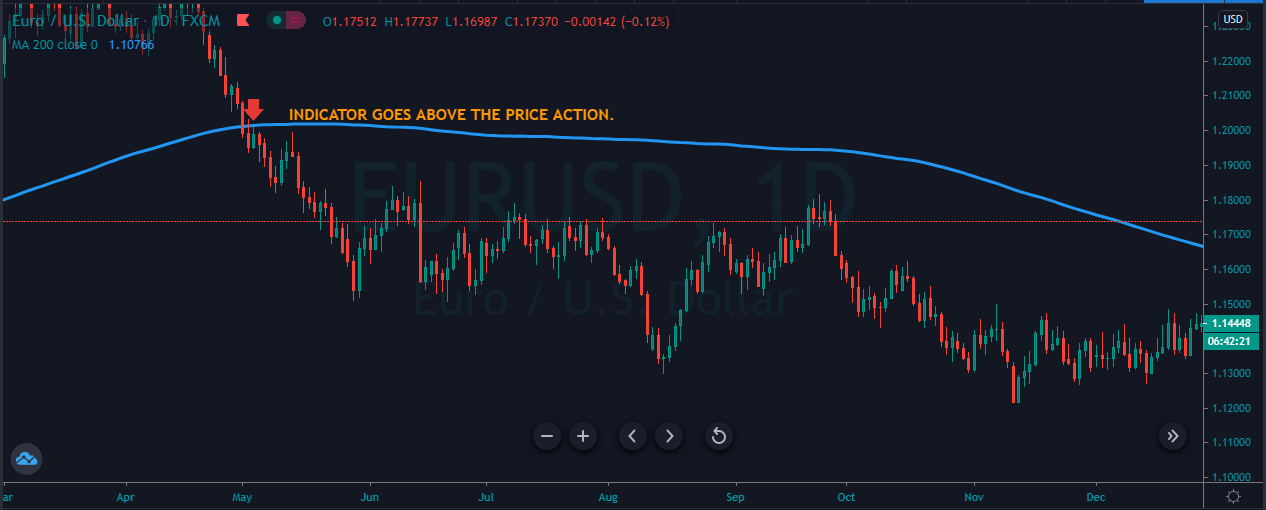
Momentum indicator shows the strength of the trend regarding less the direction of the up and down moves. Momentum indicators are specifically useful to find out where the market can potentially reverse its direction. In this case, the divergence and the overbought and oversold signals are quite useful. So to identify the direction of the trend, it is advisable to pair them with the Moving average, trend lines, or any other directional indicator to identify the trend of the underlying asset.
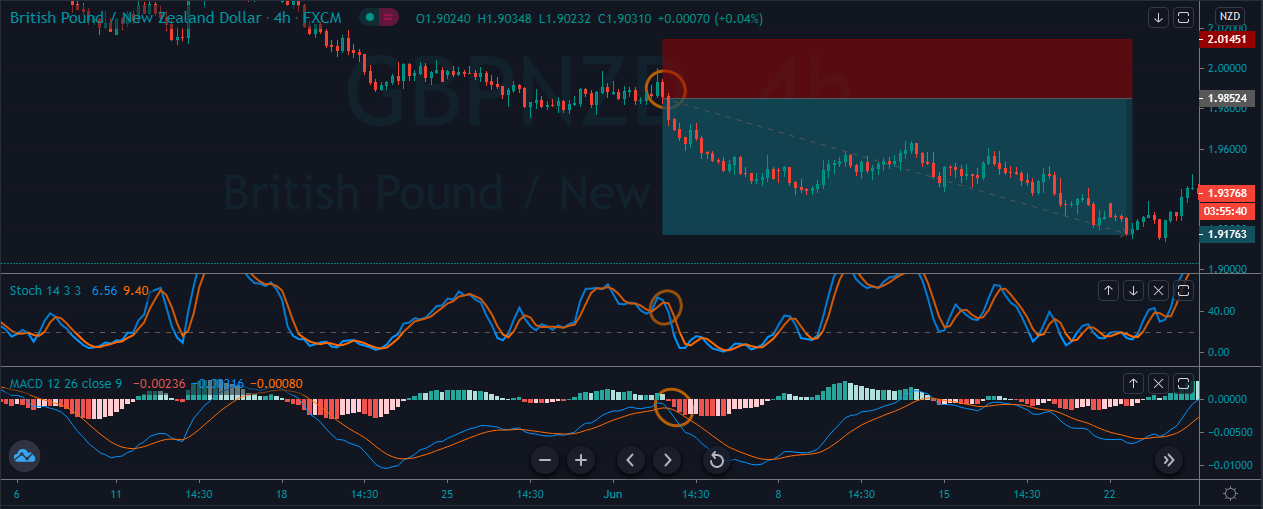
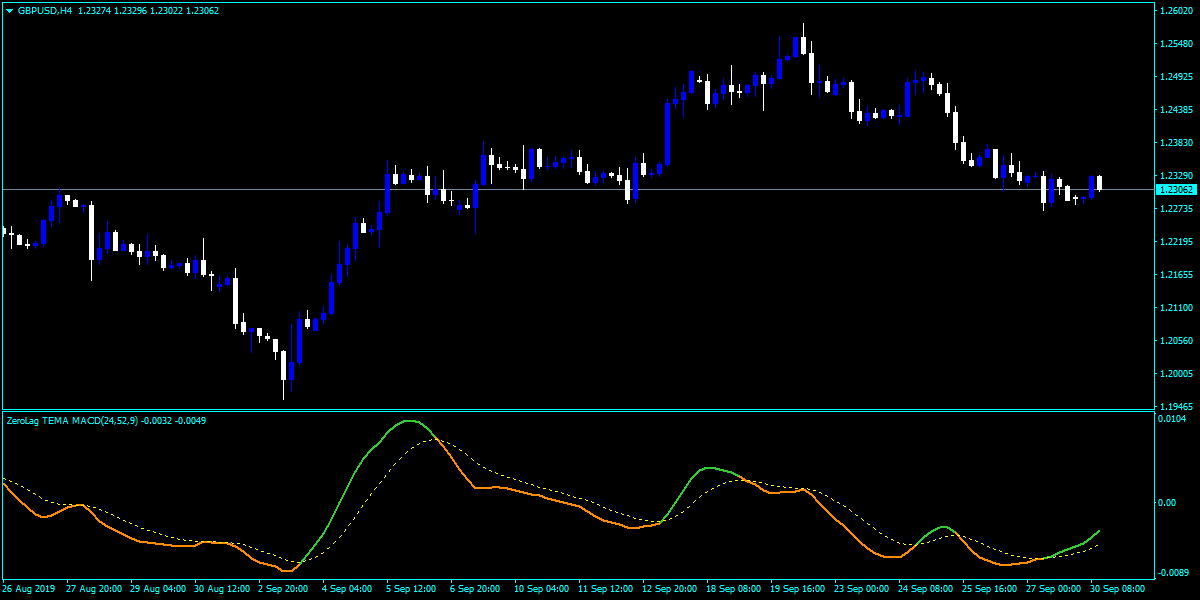
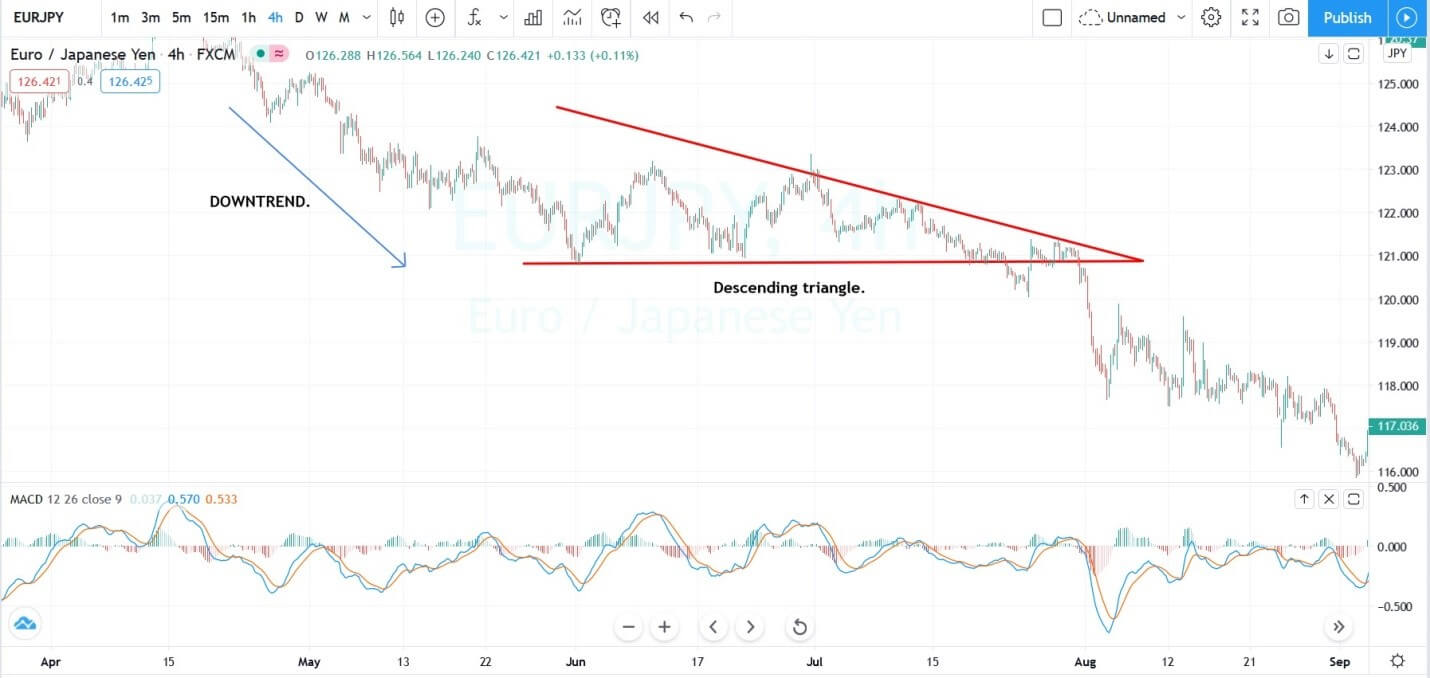
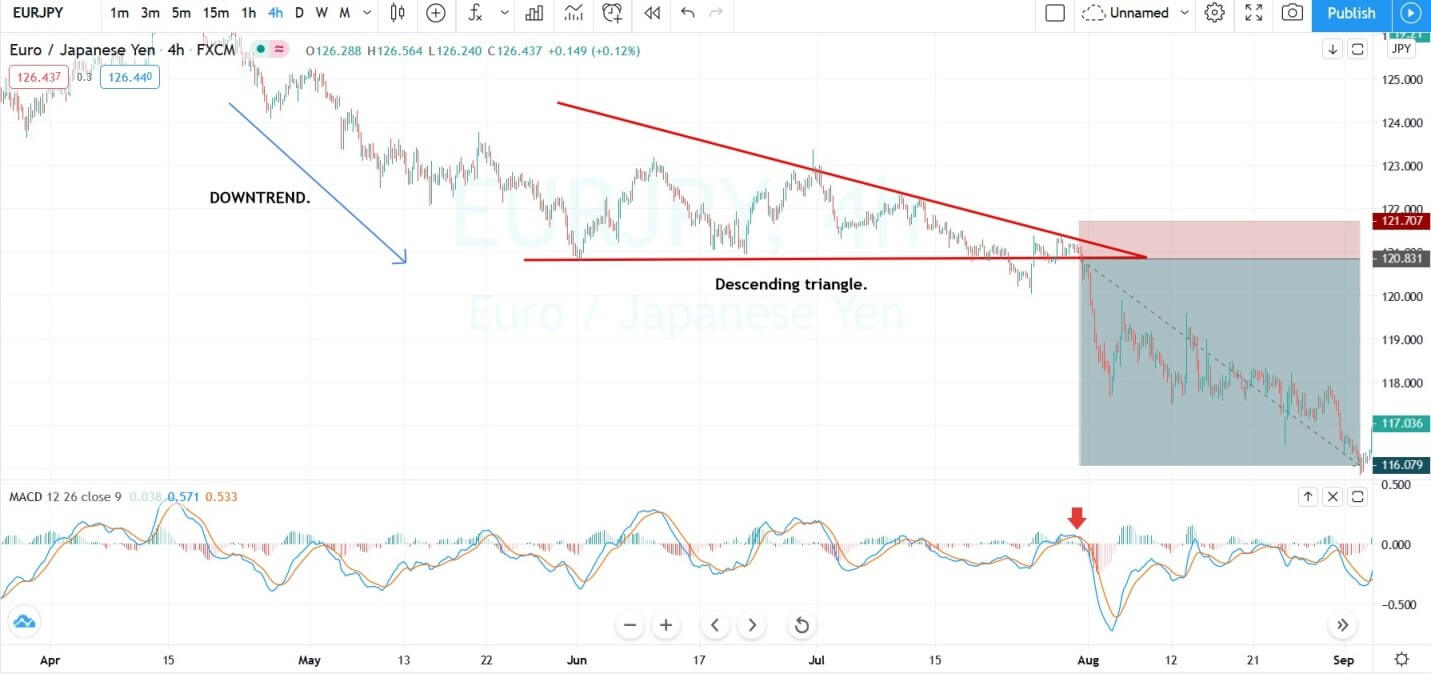
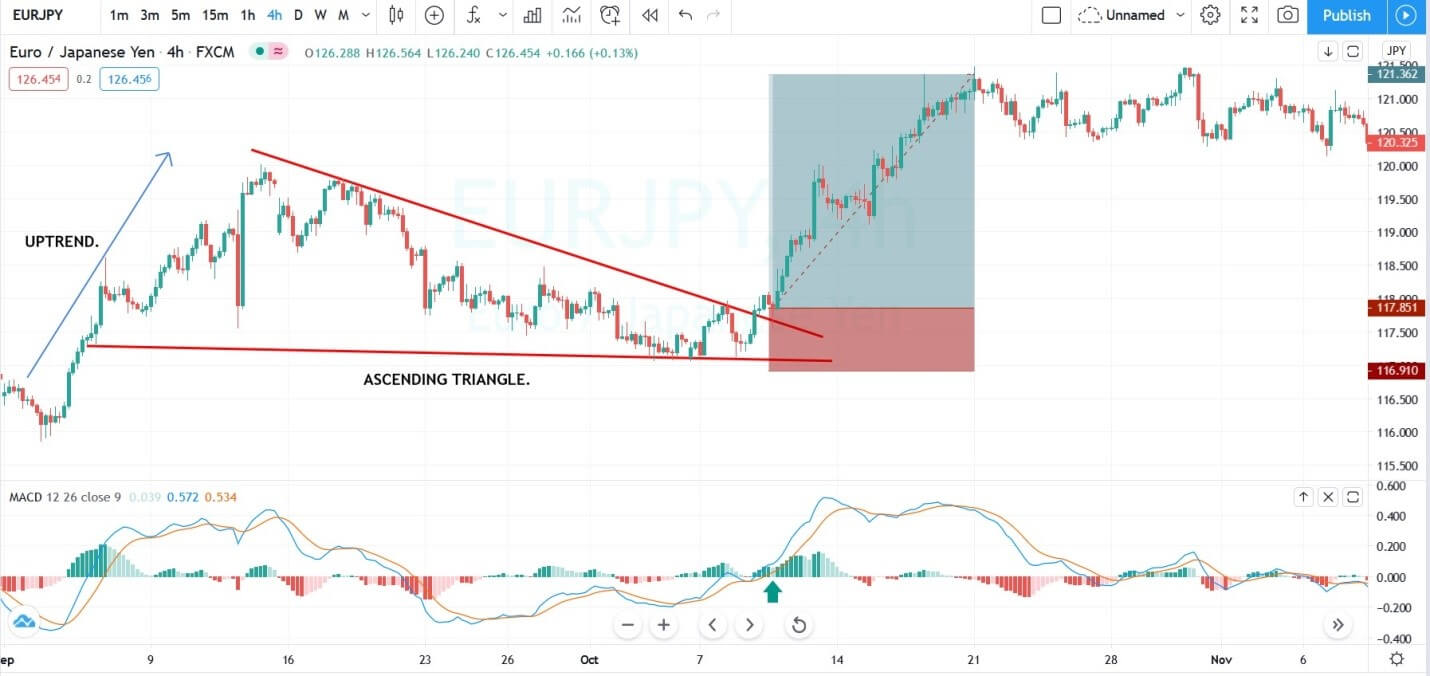
MOVING AVERAGE CONVERGENCE AND DIVERGENCE {MACD}
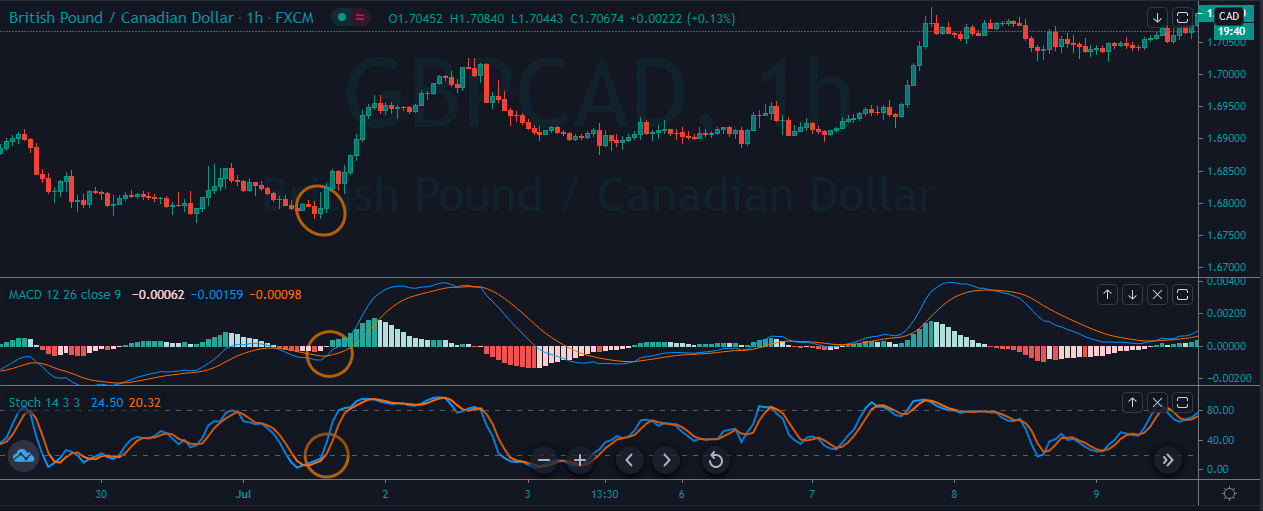
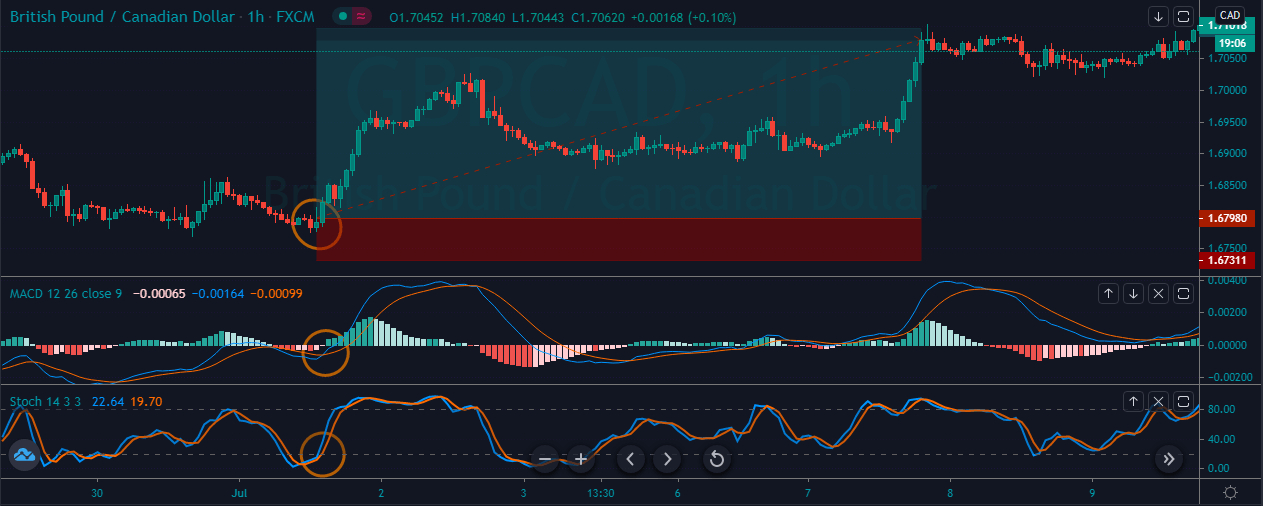
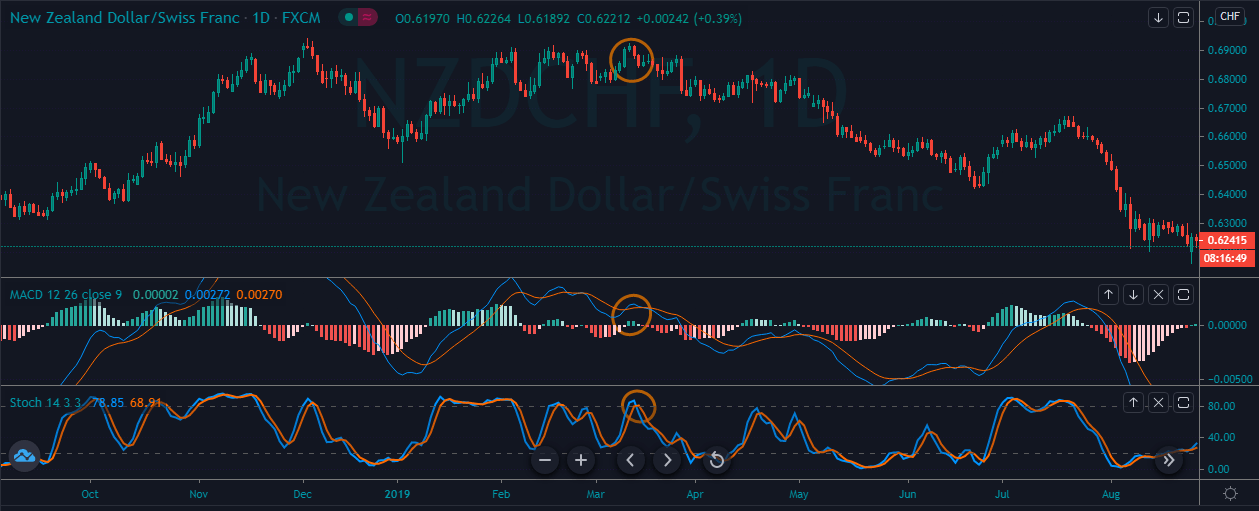
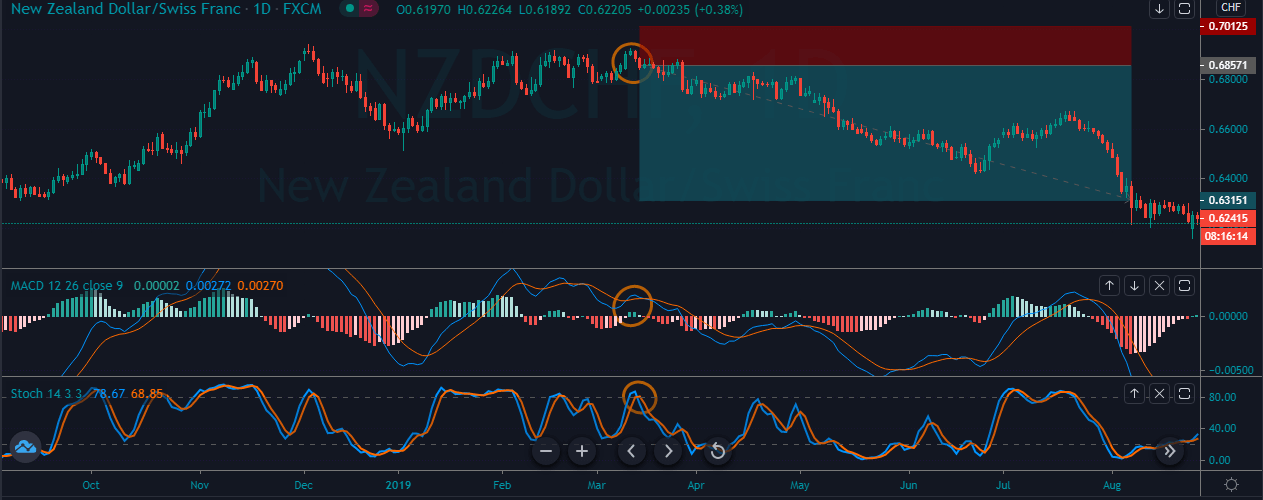
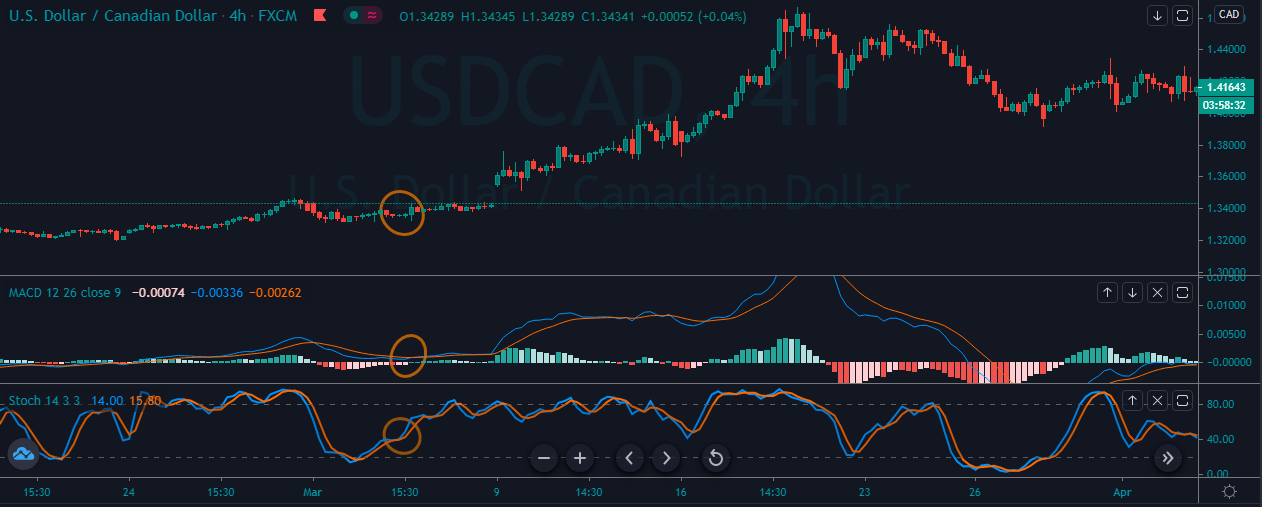
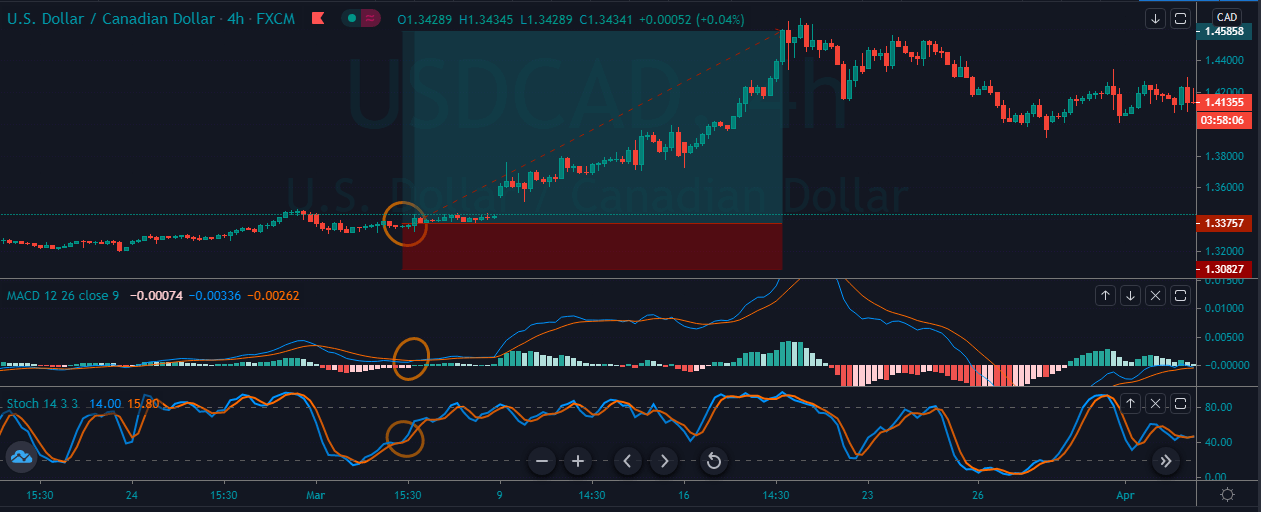
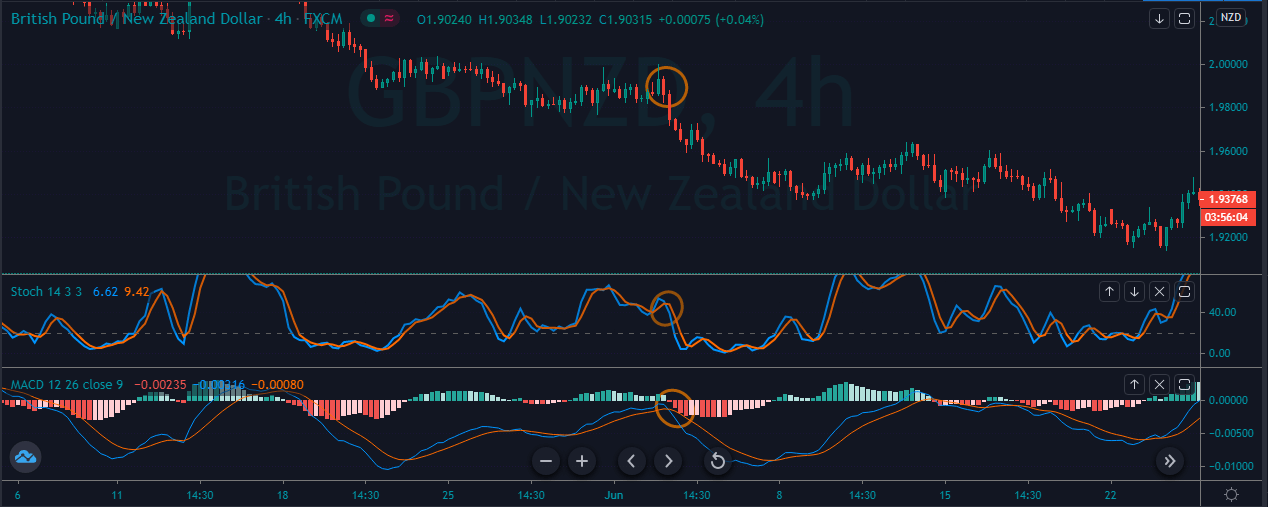
MACD is a trend-following momentum indicator developed by the Gerald Appel in the late seventies, which used to measure the momentum of the security. The indicator shows the relationship between the two moving average of the asset price. The MACD is calculated by subtracting the 26 period EMA from the 12 periods EMA. The result of this calculation provides the MACD line, and then the nine-day EMA of the MACD called the signal line is transposed over the MACD line. This gives us the buy and sell signal depending on where the MACD crosses the signal line.
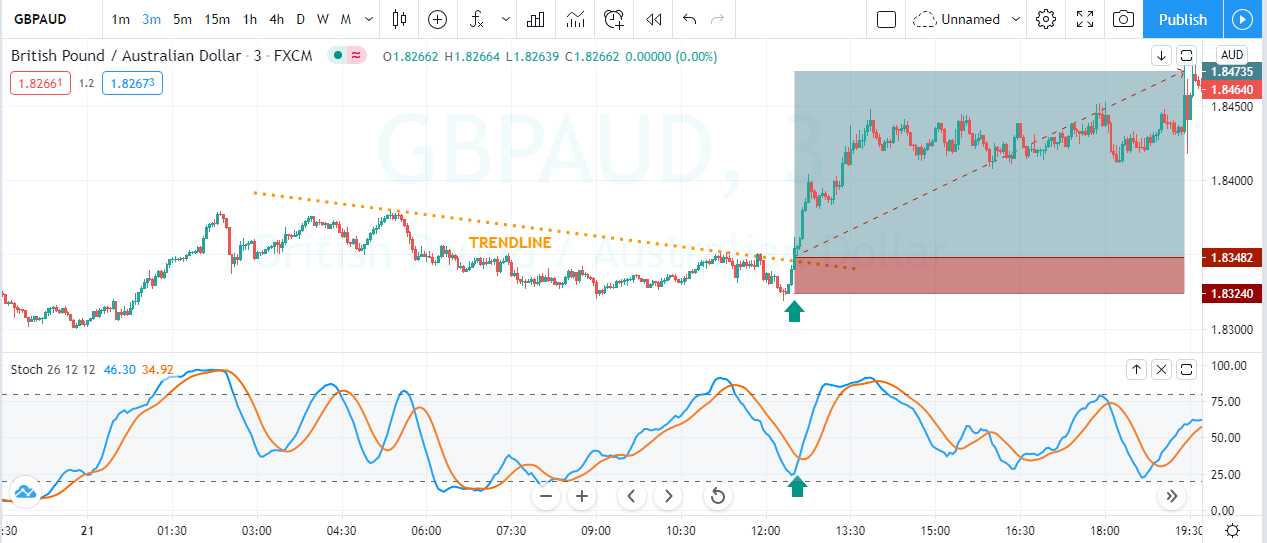
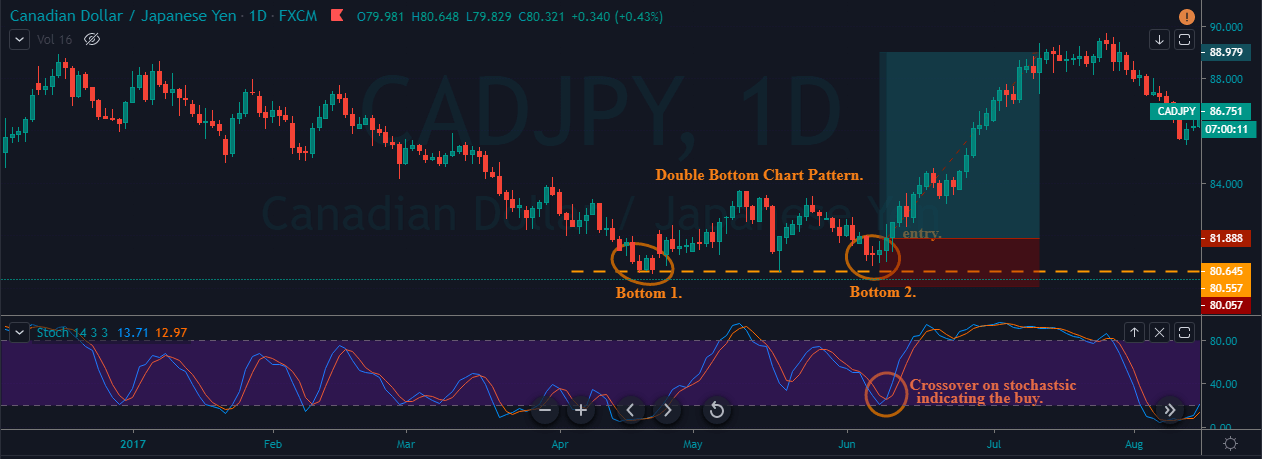
STOCHASTIC OSCILLATOR.
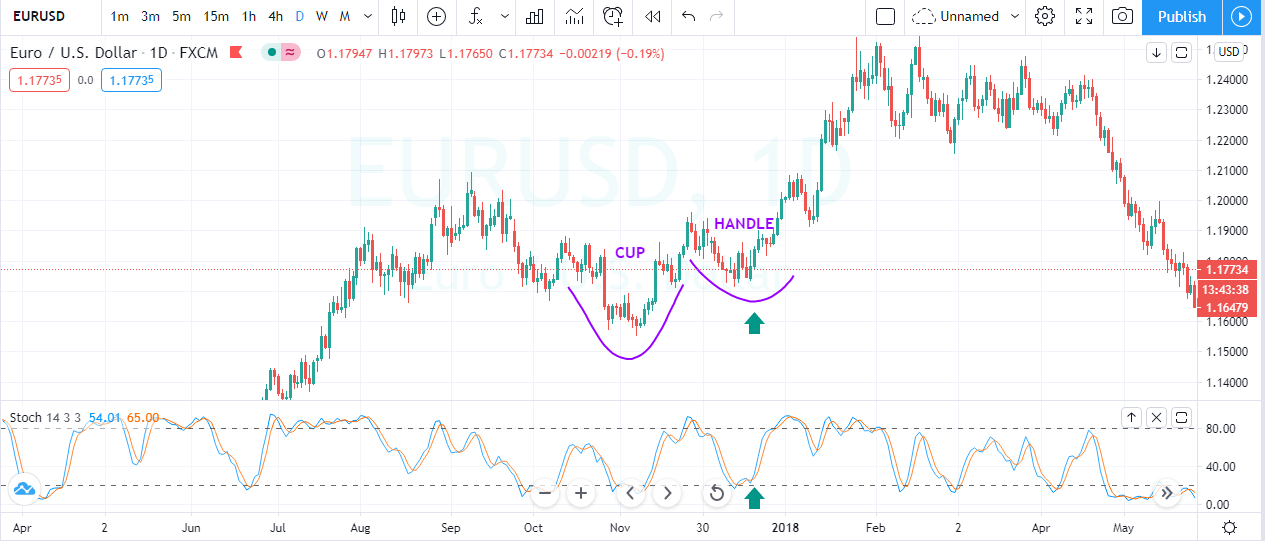
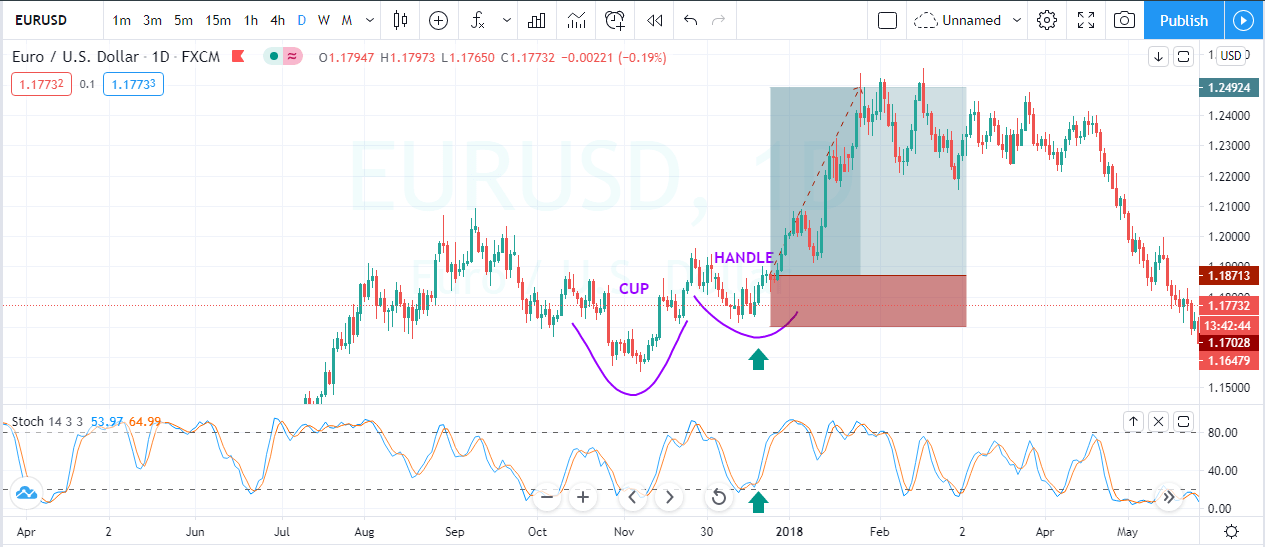
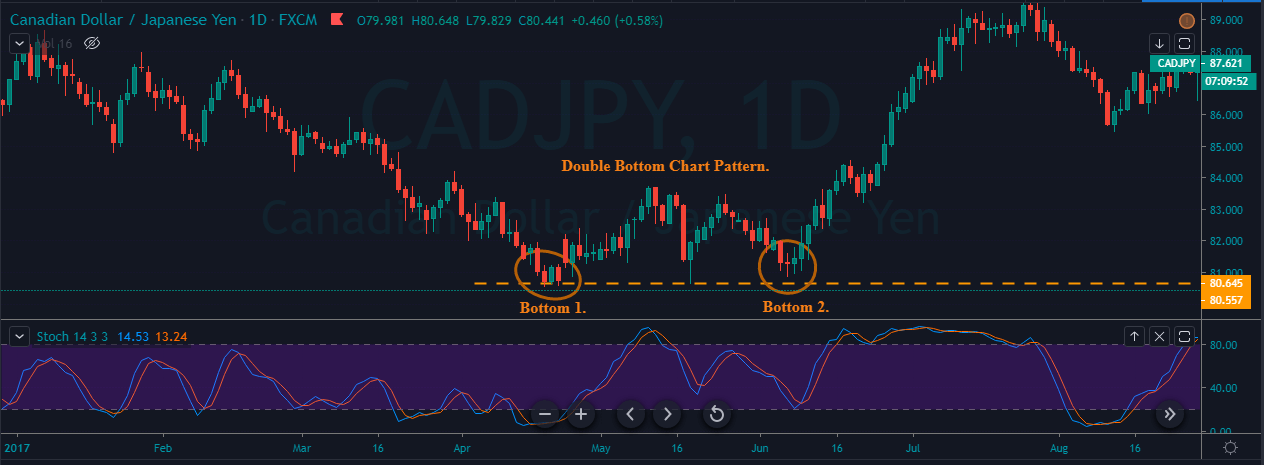
Stochastic is a momentum indicator developed by George Lane in the late 1950s. The stochastic doesn’t follow the price or volume; instead, it follows the speed and momentum of the market. This indicator is the leading indicator when it comes to measuring the momentum because the indicator changes its direction before the price action changes its direction. The indicator measures the closing price of the asset to a range of its historical prices over a predefined period. Stochastic is a range bounded indicator which used to generate the overbought and oversold trading signals using the 0 to 100 levels. Values of 80 considered to be overbought, and the values of 20 considered to be overbought. When values reach these levels, it’s an indication of weakening momentum, and the reversals are very likely to happen.
RELATIVE STRENGTH INDEX.
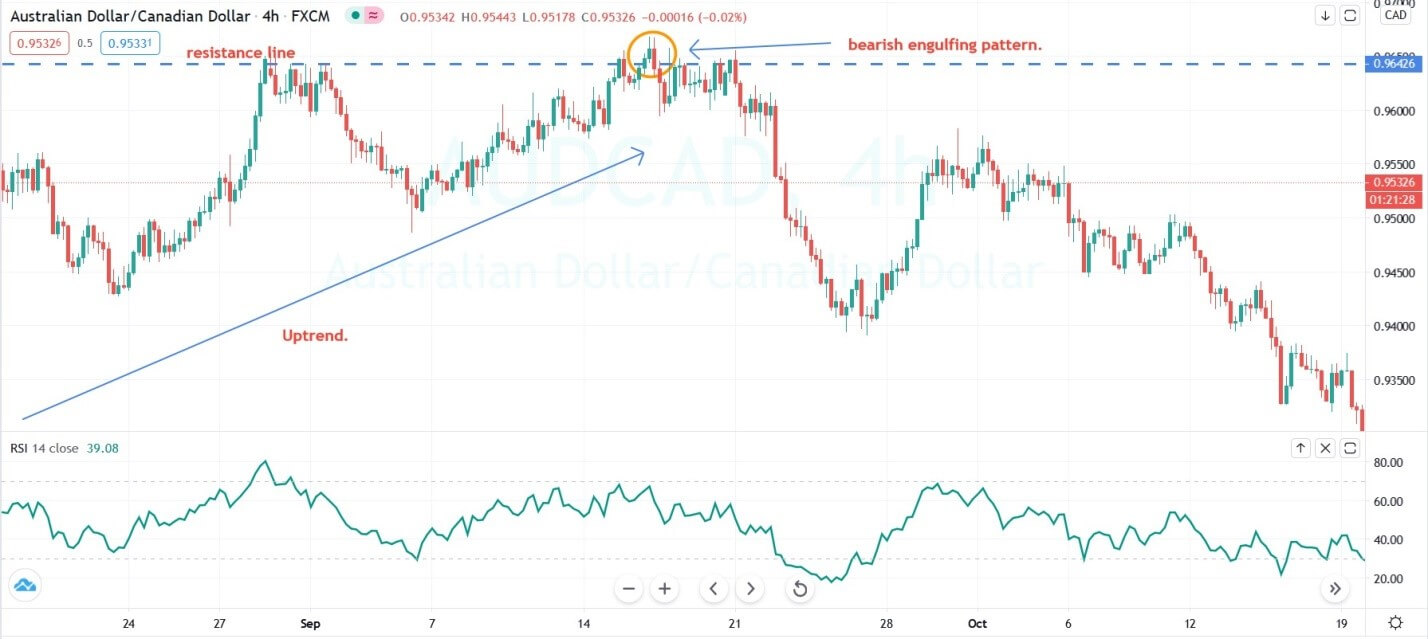
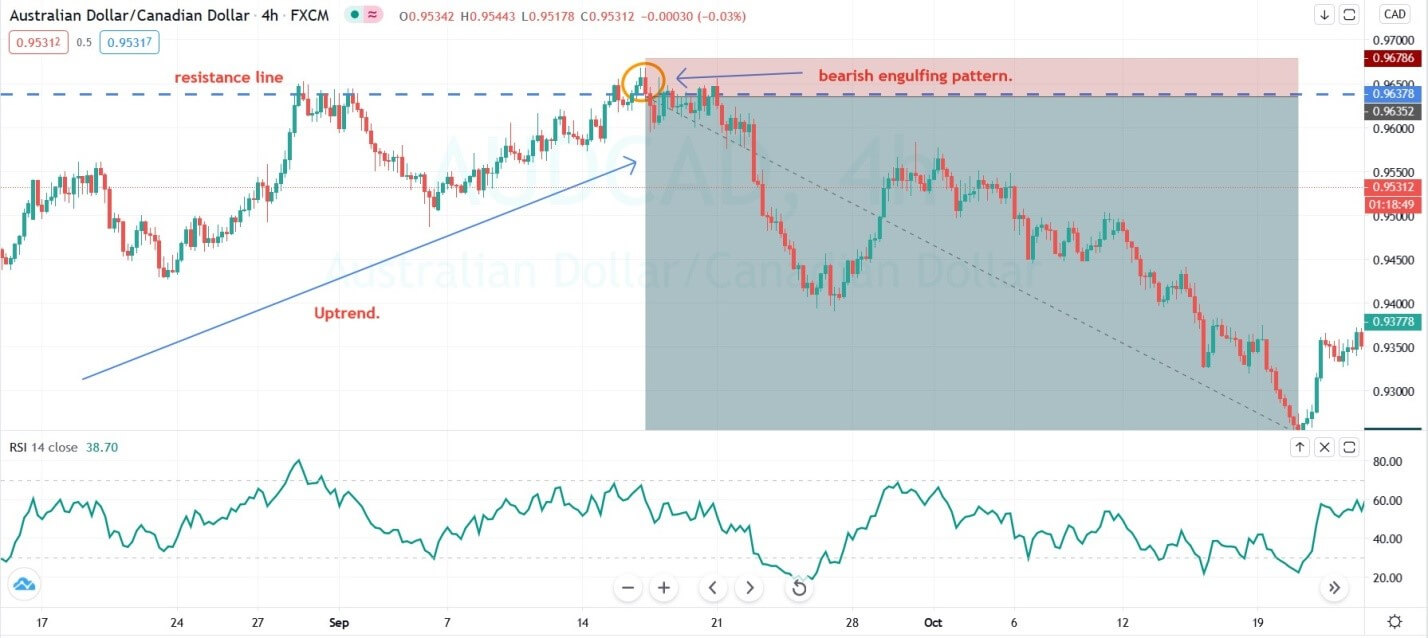
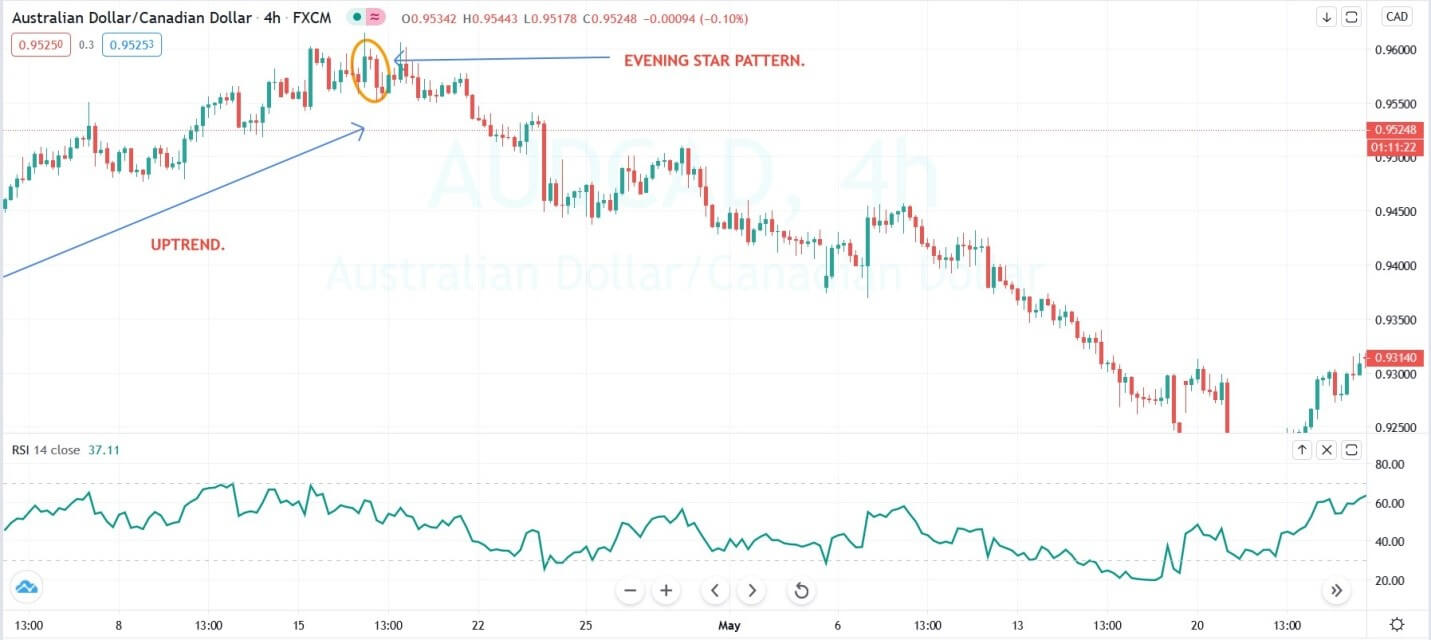
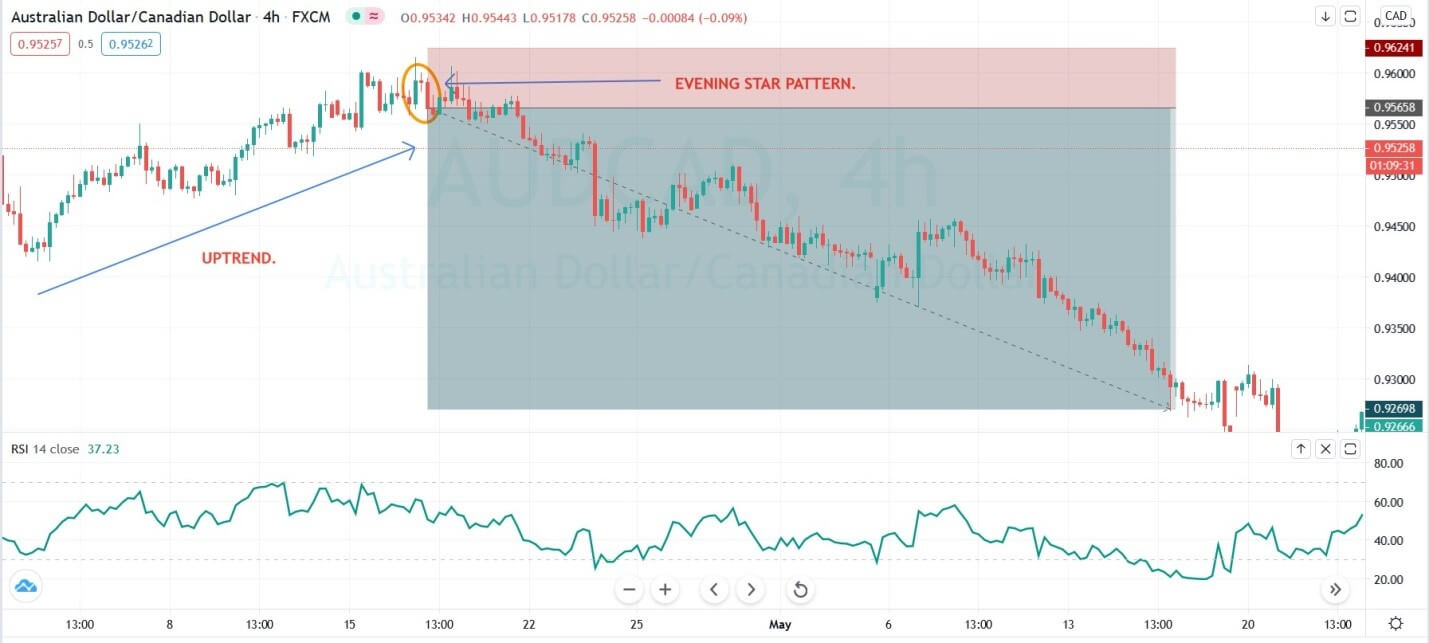
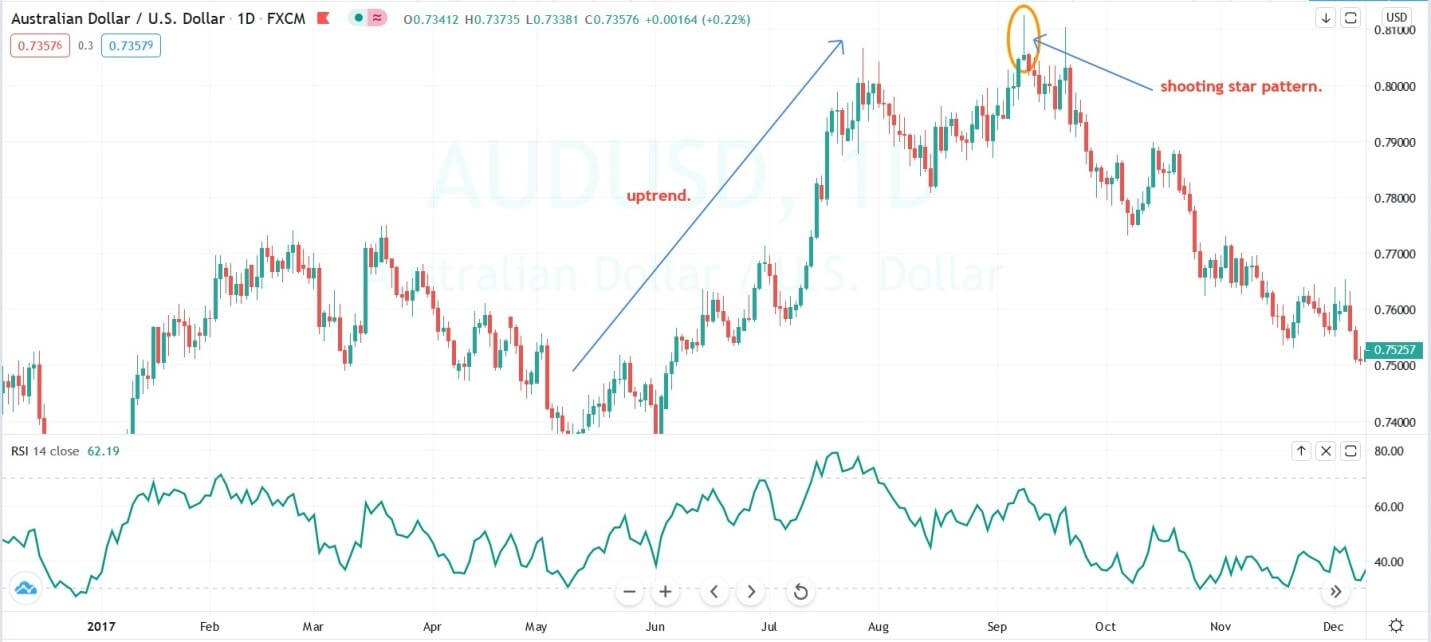
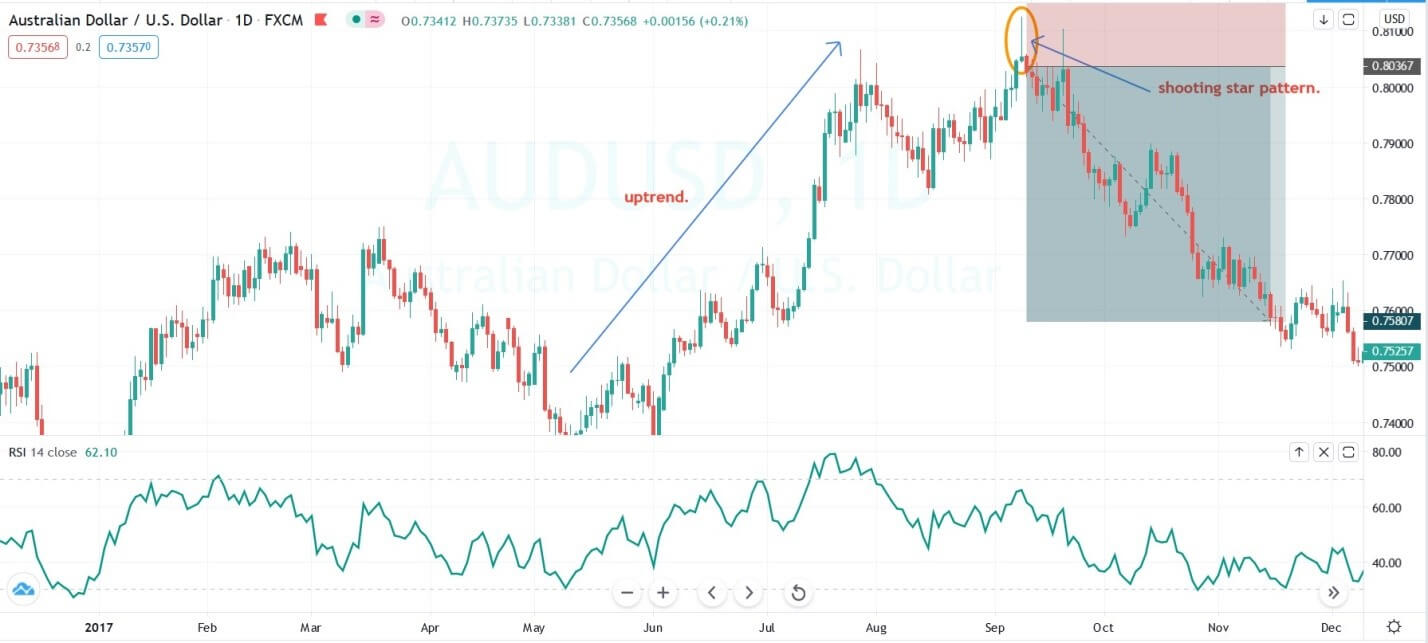
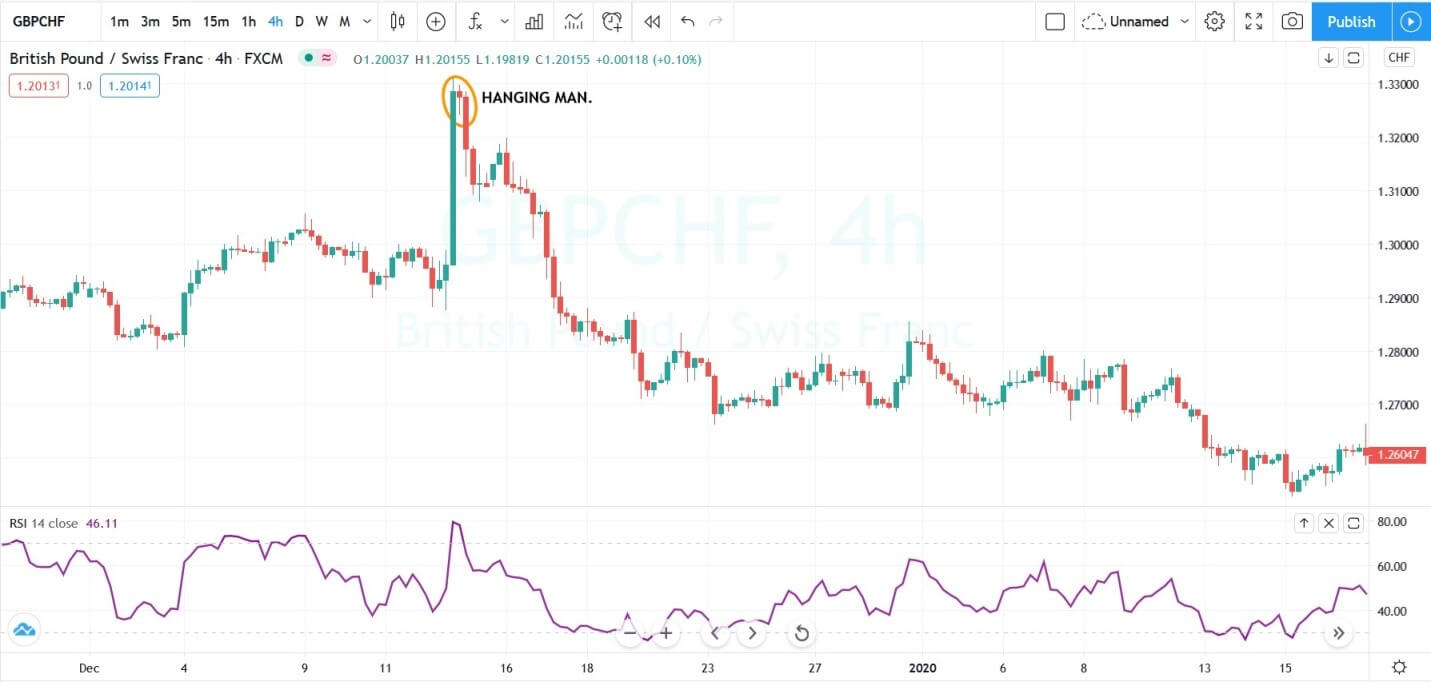
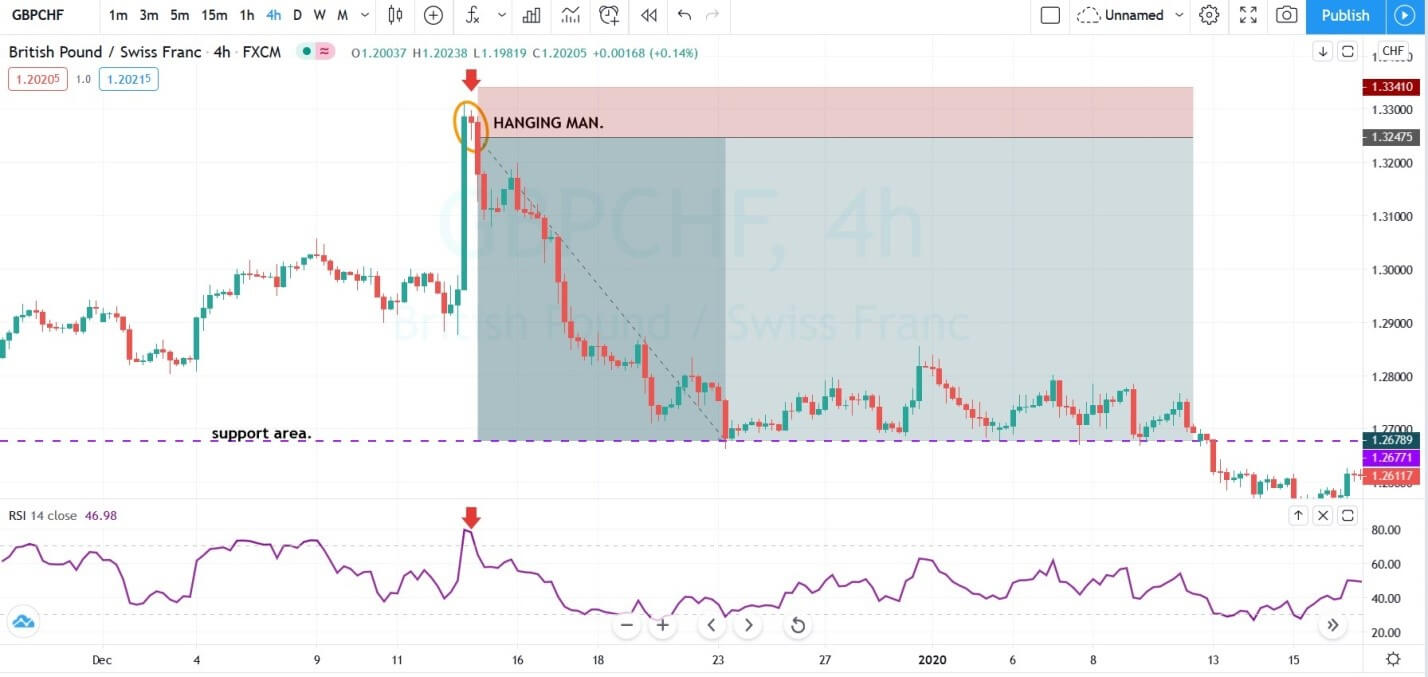
RSI is a momentum indicator developed by the J. Welles. Wilder. It used to measure the magnitude of the recent price changes to evaluate the overbought and oversold conditions. Just like the stochastic RSI is a range bounded indicator, which oscillates between the 0 to 100 level. According to the Wilder, the RSI considers to be overbought when above the 70 and it is oversold when it reaches the 30 level. When prices reach the 70 level, it means the buying momentum is dying and now can expect the reversal or the correction in the trend. Conversely, when the price action reaches the 30 level, it means the selling momentum is dying, and now the reversal or the correction is required to print brand new lower low.
RATE OF CHANGE {ROC}
ROC or Rate of Change is the speed at which the variable changes over a specific period. The ROC is often illustrated by the Greek letter Delta, and it is often used to measure the momentum of the asset. Graphically the indicator represented by the slope of the line, and it is expressed as a ratio between changes in one variable relative to the correspondence change in another. An asset with a higher momentum has a positive ROC outperforms the markets, and the negative ROC is likely to decline in momentum, which is an indication to take sell.
FINAL WORDS.
Momentum indicators are the major tools for traders to analyze the market. Still, these indicators are rarely used in isolation, and most of the traders use them in conjunction with the other technical analysis tools that reveal the direction of the trend. Once the direction of the indicator has been determined, then the momentum indicators are helpful to gauge the momentum of the price action to identify the major trading opportunities.

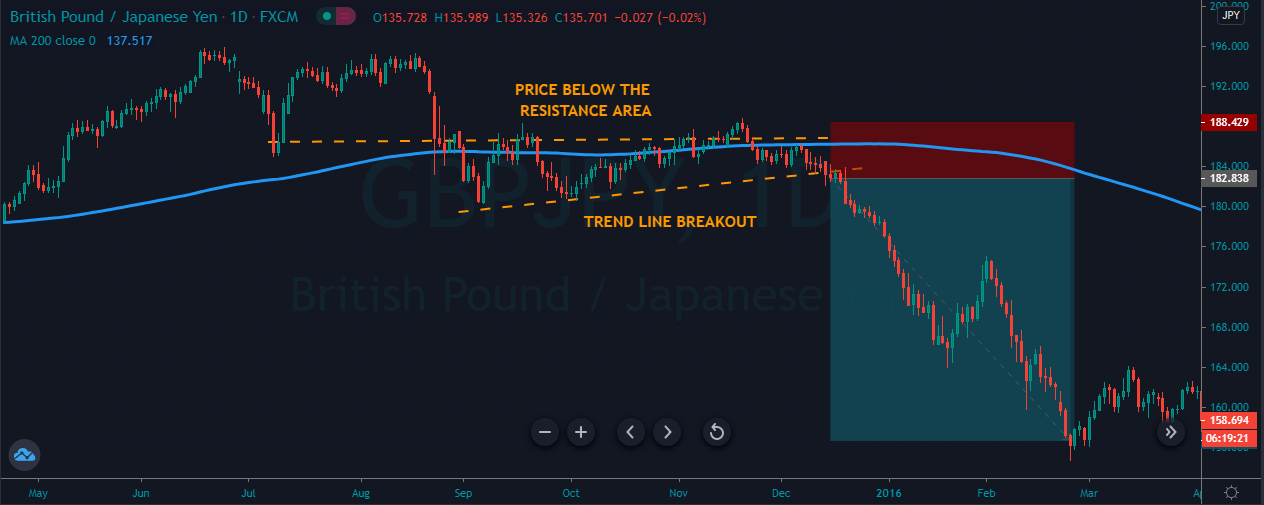

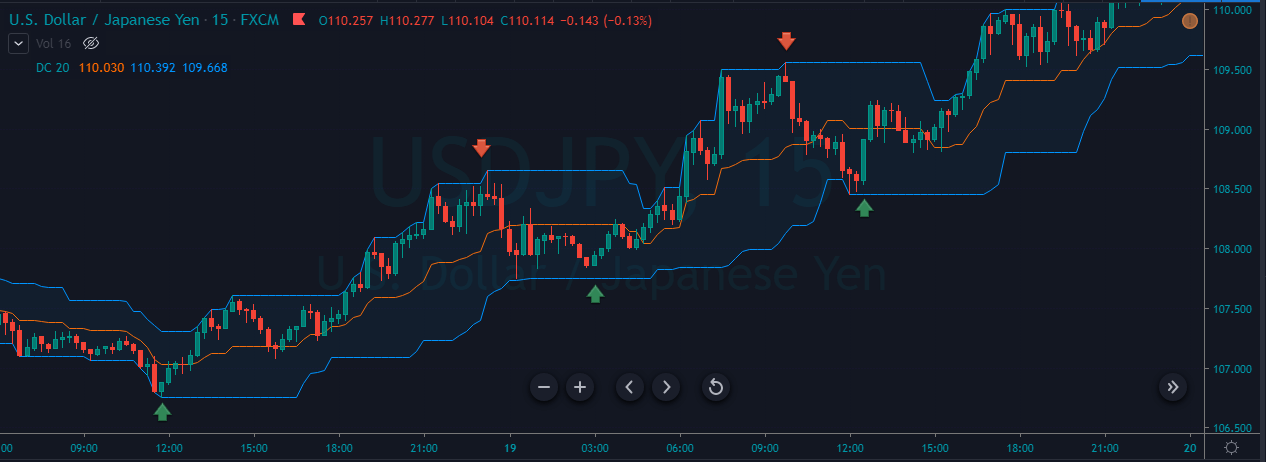
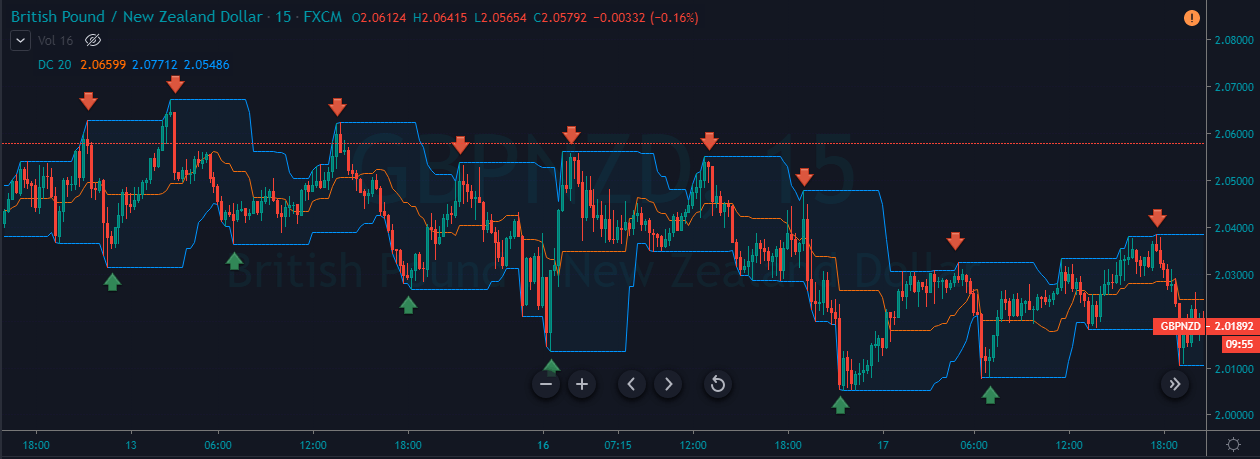
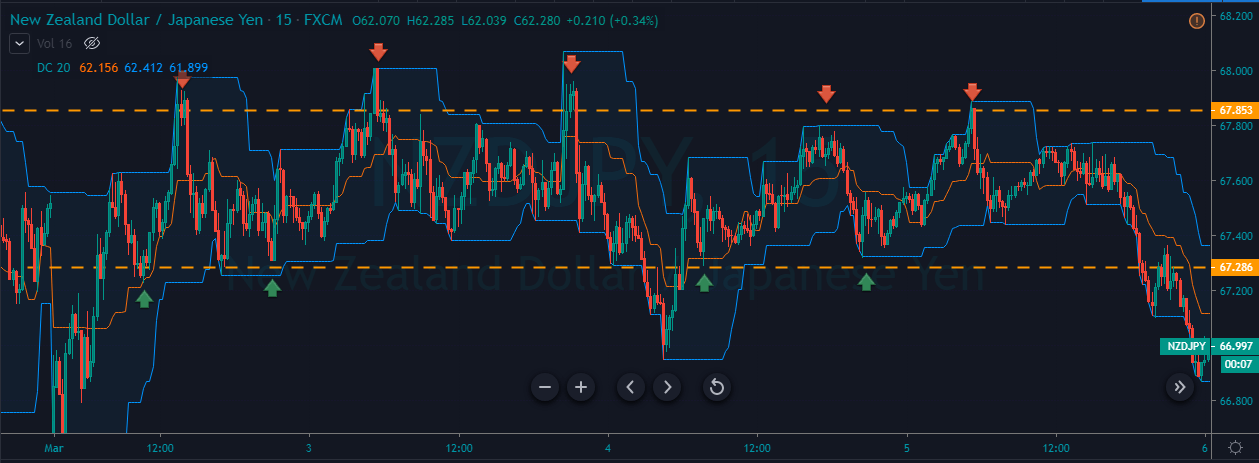
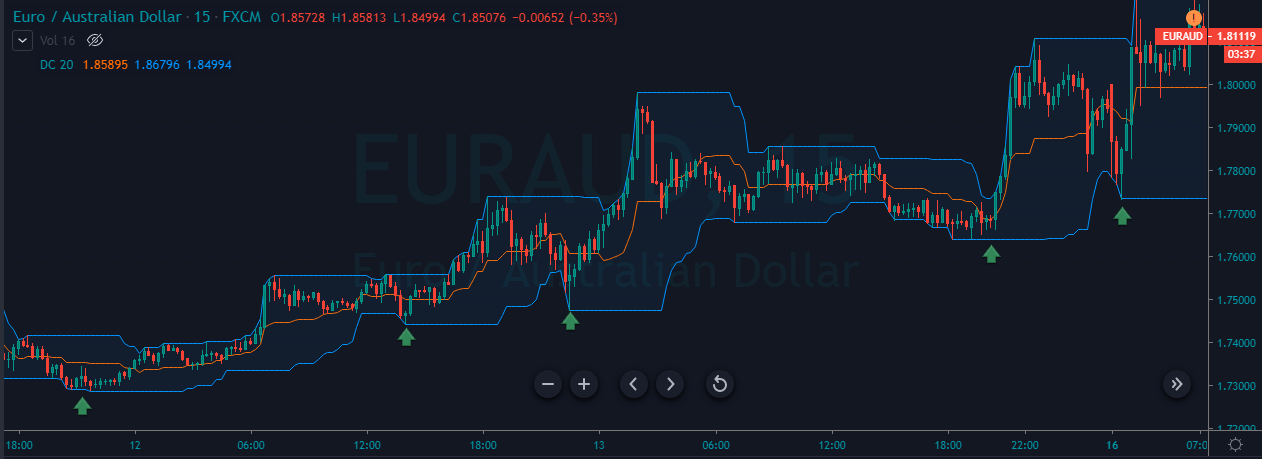
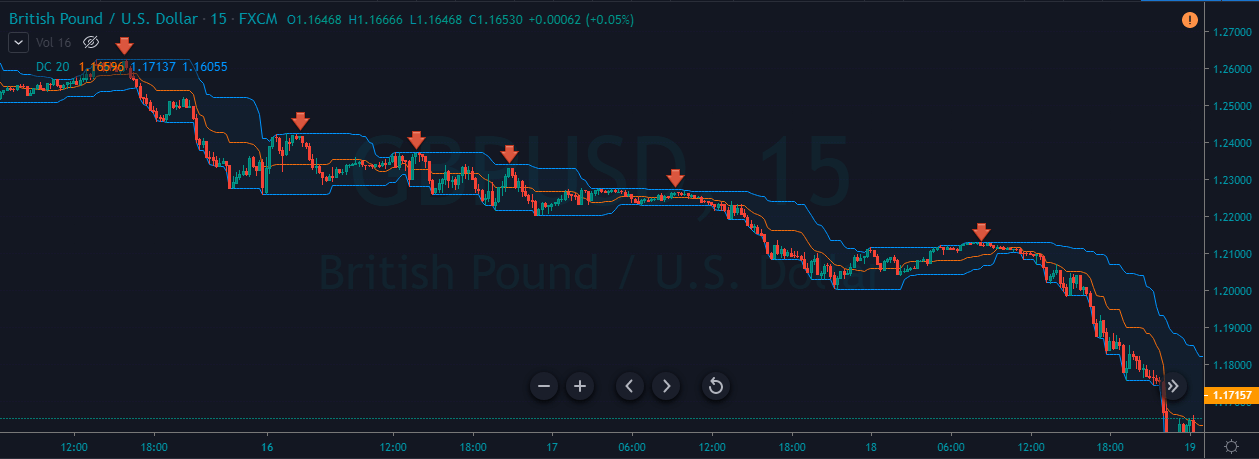


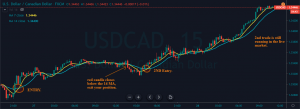
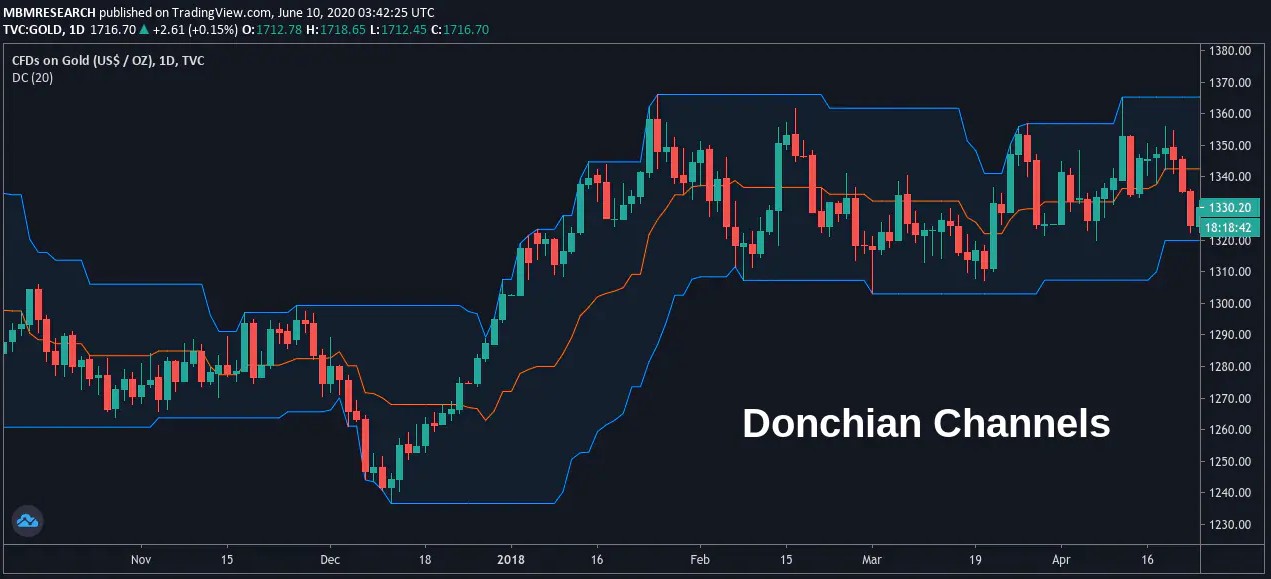
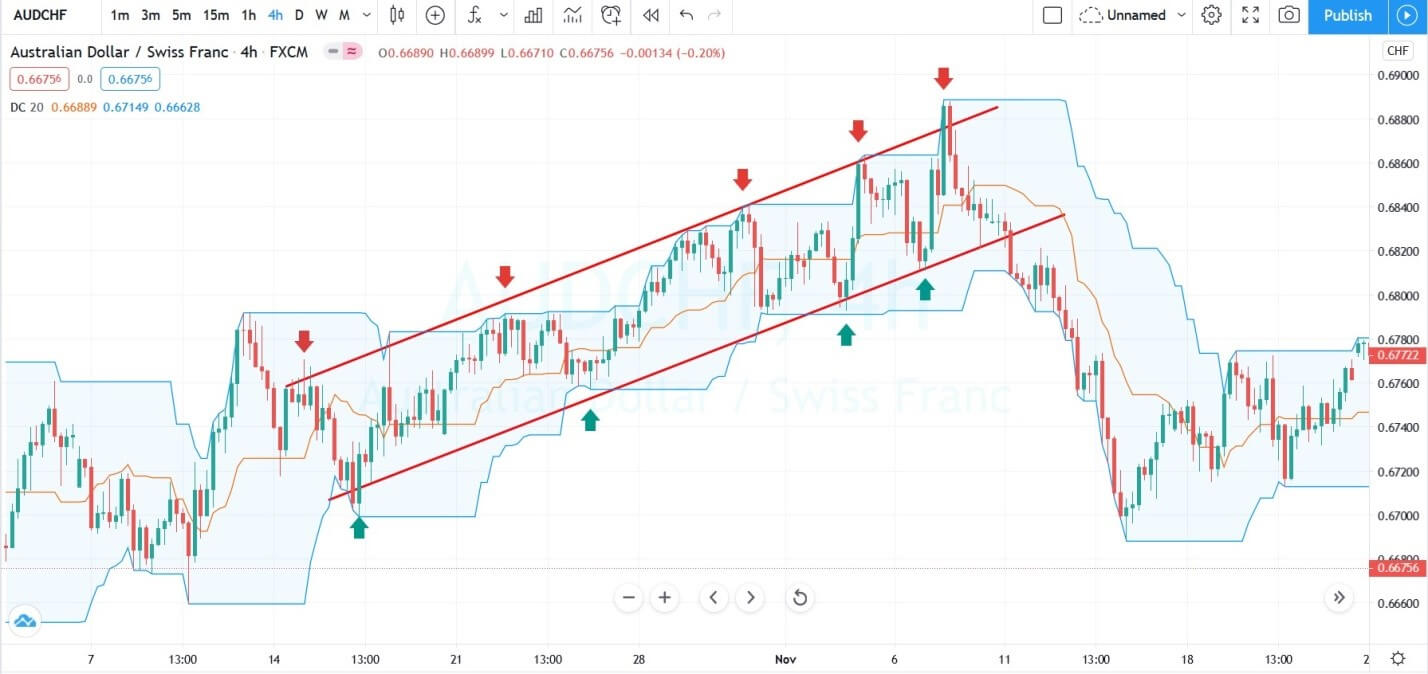


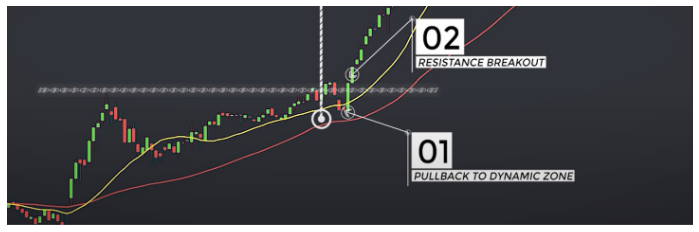
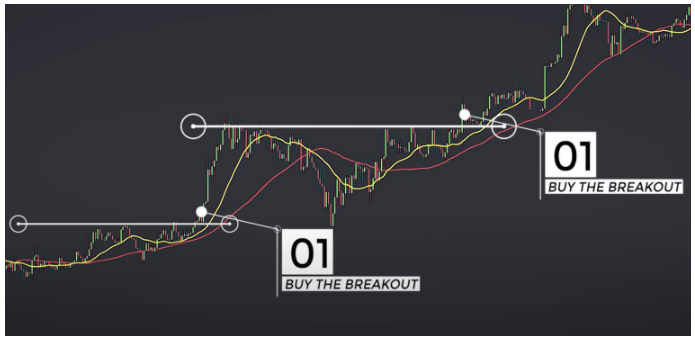
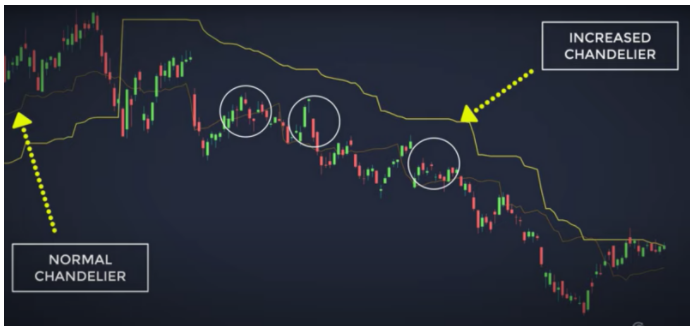
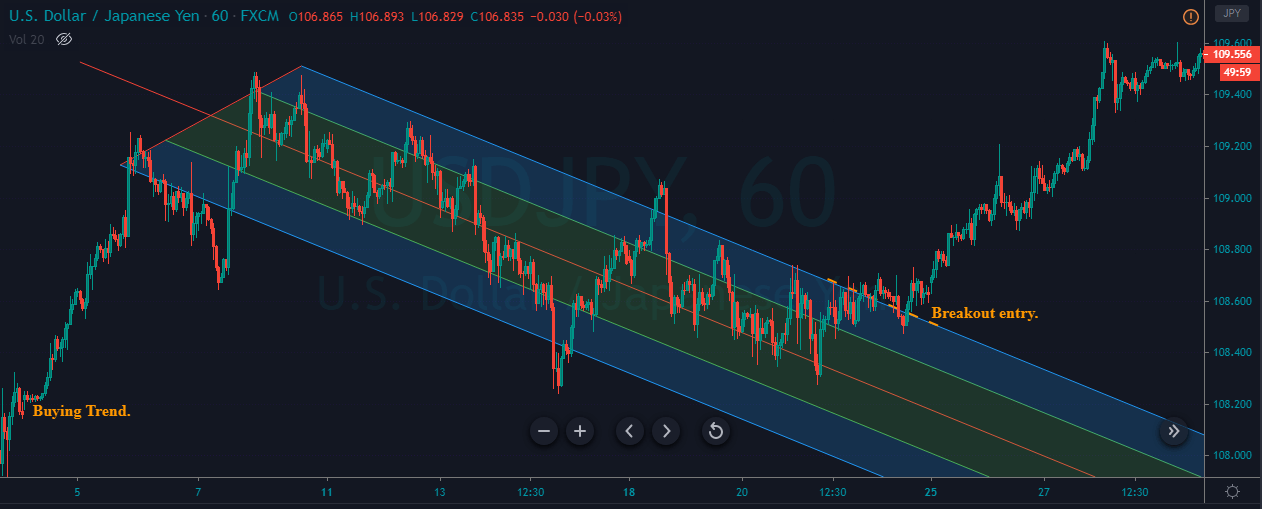
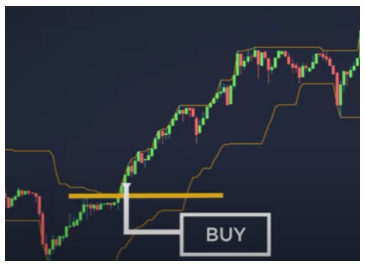 The Donchain Channel is very closely tied with the simple Support And Resistance PA trading to the point it is just a facilitator so you can see the lines. As with the S/R trading, previous resistance that was violated becomes support and vice versa. As for money management, Stop Loss acts as the profit taker and as the loss limiter. Placing the Stop loss on the chain lines is actually a trailing stop that you can move manually or you can set up a custom one that follows 2xATR value in 20 periods which is also the default for the Donchain Channel.
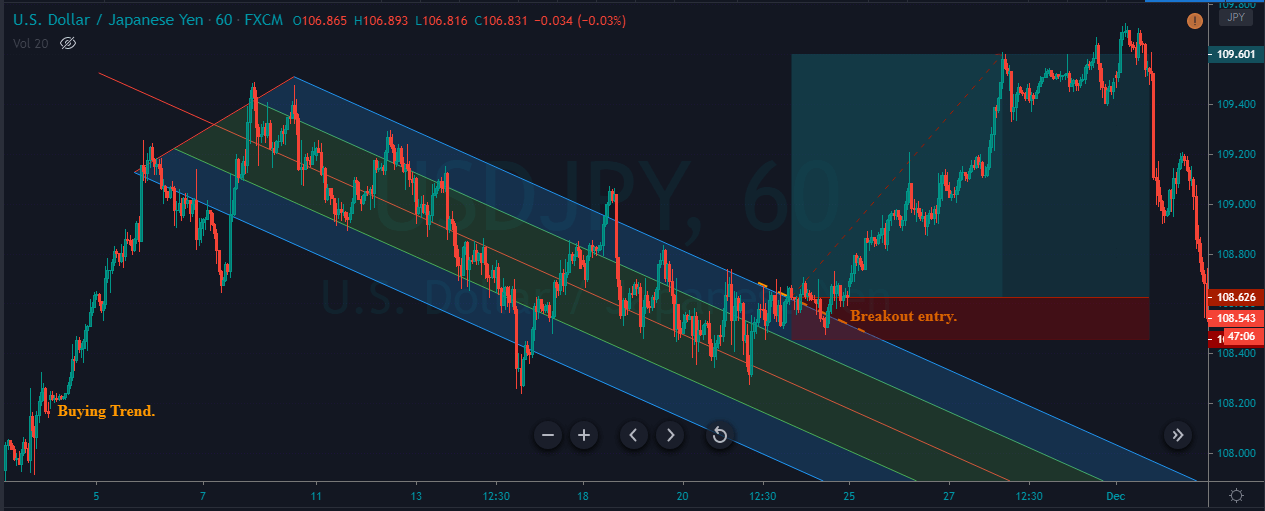