Categories
Forex Videos

Forex Options Part 6 – Assessing options!

Forex Options VI – Assessing options


Probabilities

If you’ve been following our Options video series, you’ve understood that options trading is a game of chance. Thus, if you hope to succeed at trading options, you must strive to consistently place the odds in your favor as much as you can on every trade you intend to make.
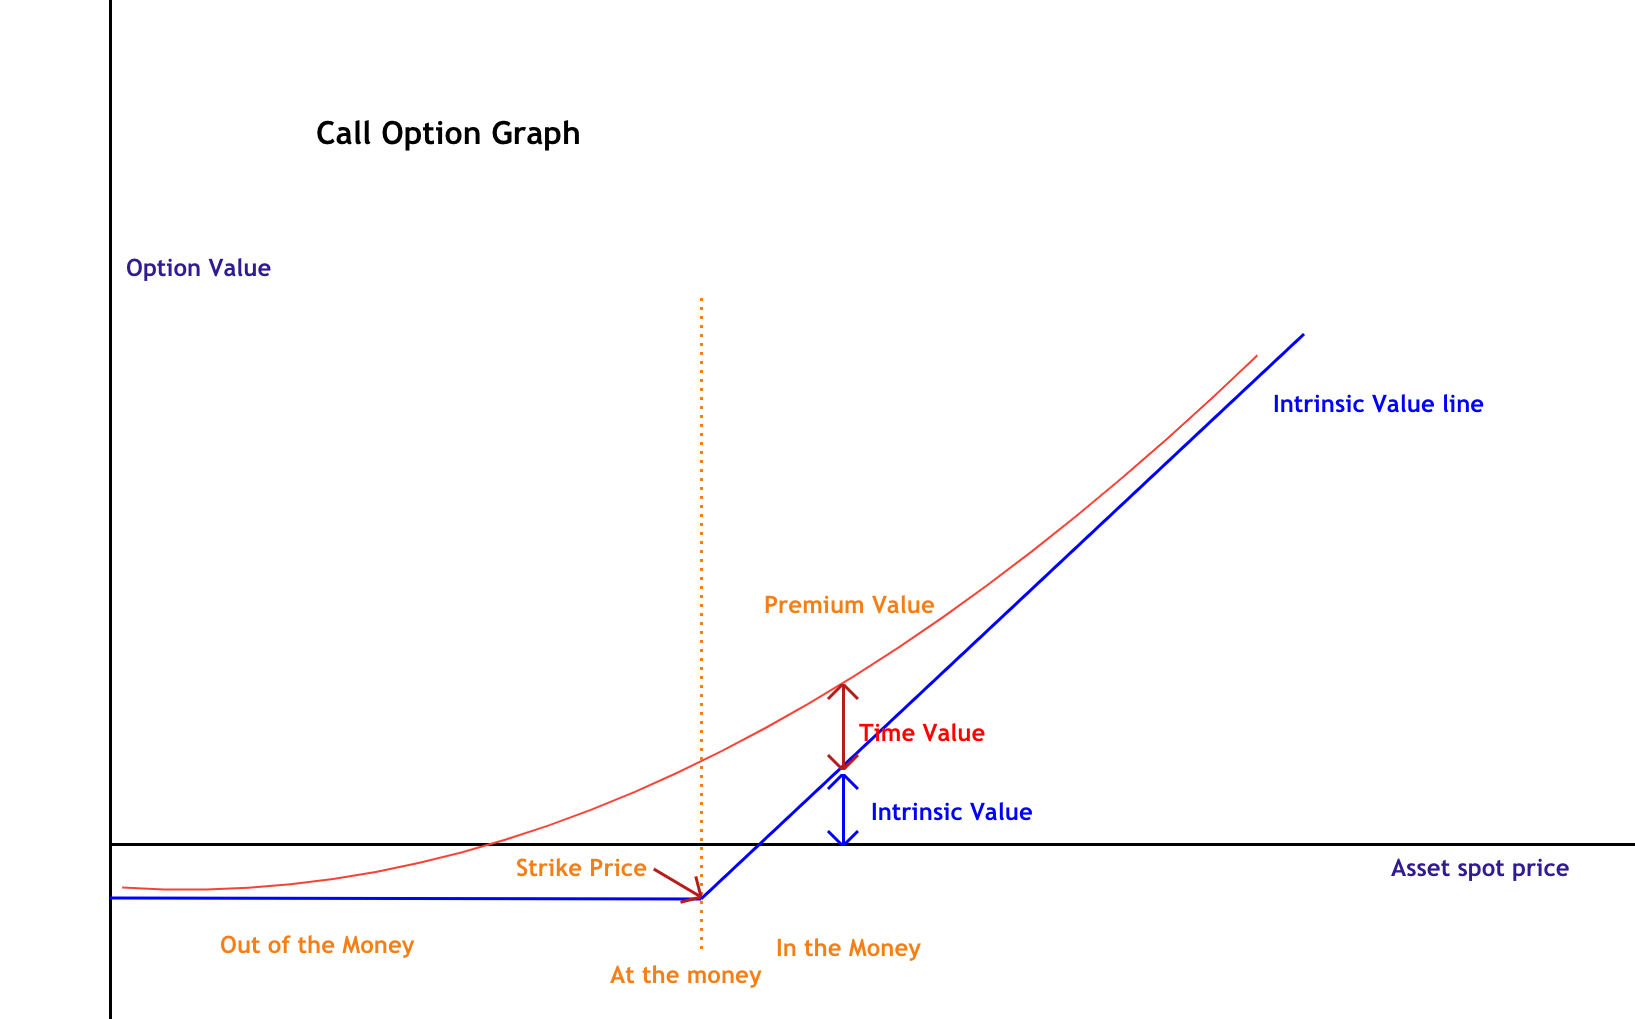
Options traders must realize that options are not the same as trading the underlying asset. Options have a time premium that vanishes with time, and that makes their probability of profit to be less than 50%.

Pros and Cons

Although forex traders are used to having an opinion on whether a pair is going to move up or down, the options’ trader should not theorize about it, but comparing the risk and reward characteristics of several possible trades to decide which is the most desirable. Dreaming about unlimited profits while buying low-probability options or selling far out of the money options with high-probability of profits without minimizing the risk is a recipe for disaster.

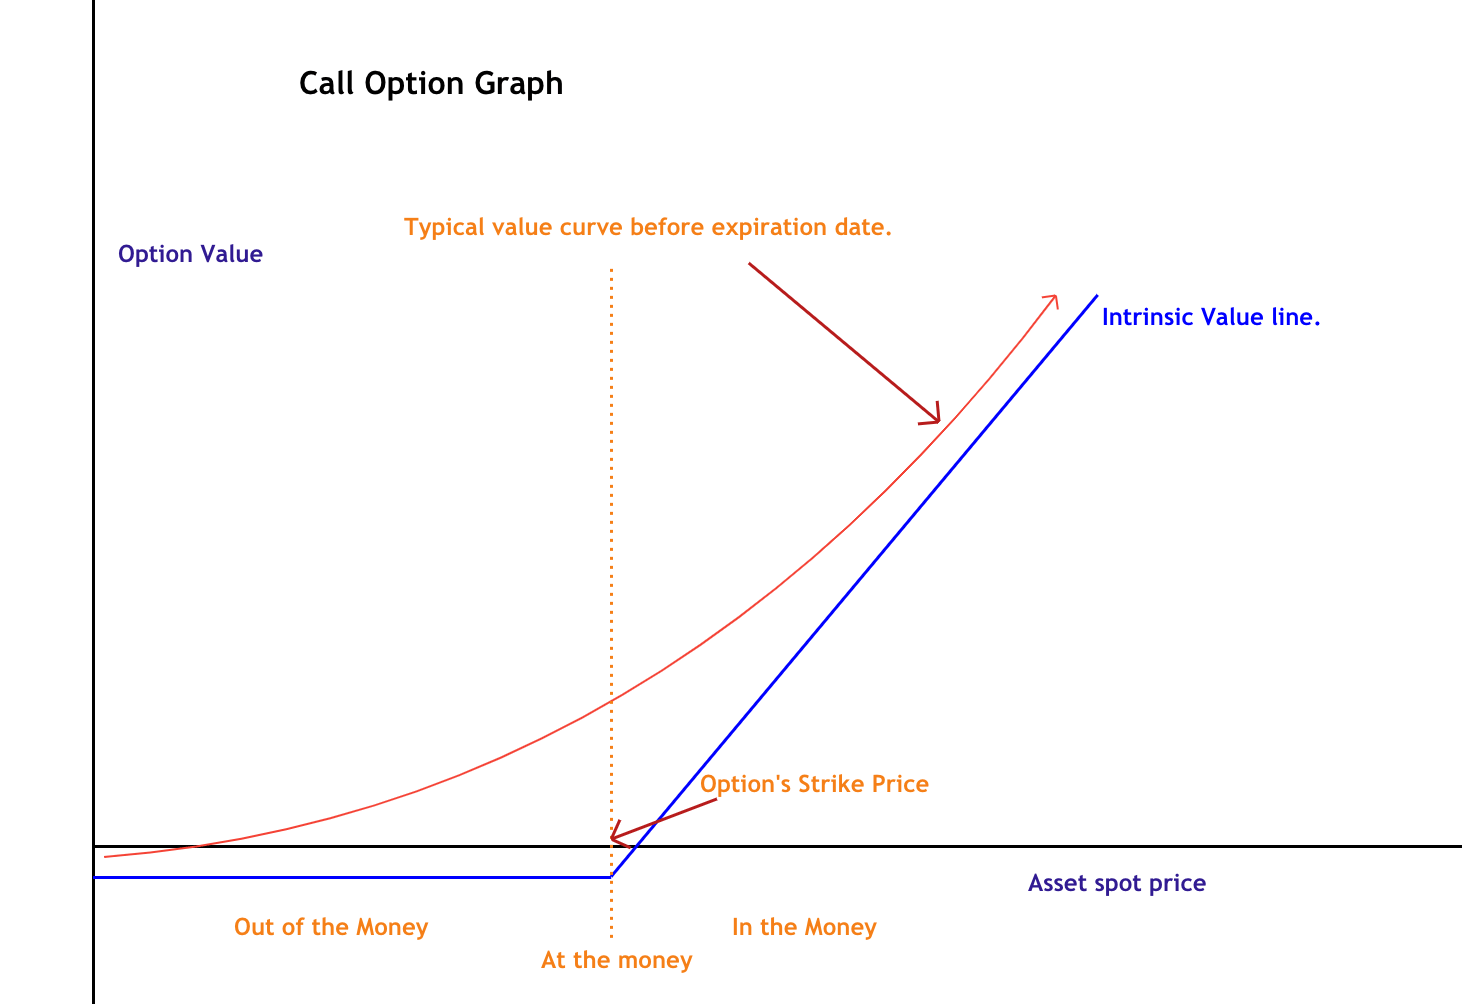
The Delta as a proxy of probability

An option’s Delta can be determined for each option, using an option-pricing model, which usually is made available by the broker to its customers. Sites such as Investing.com display the Delta of the most usual FX options.
Delta values range from 0 to 100 on Calls and from -100 to 0 on Puts. Delta can be viewed as
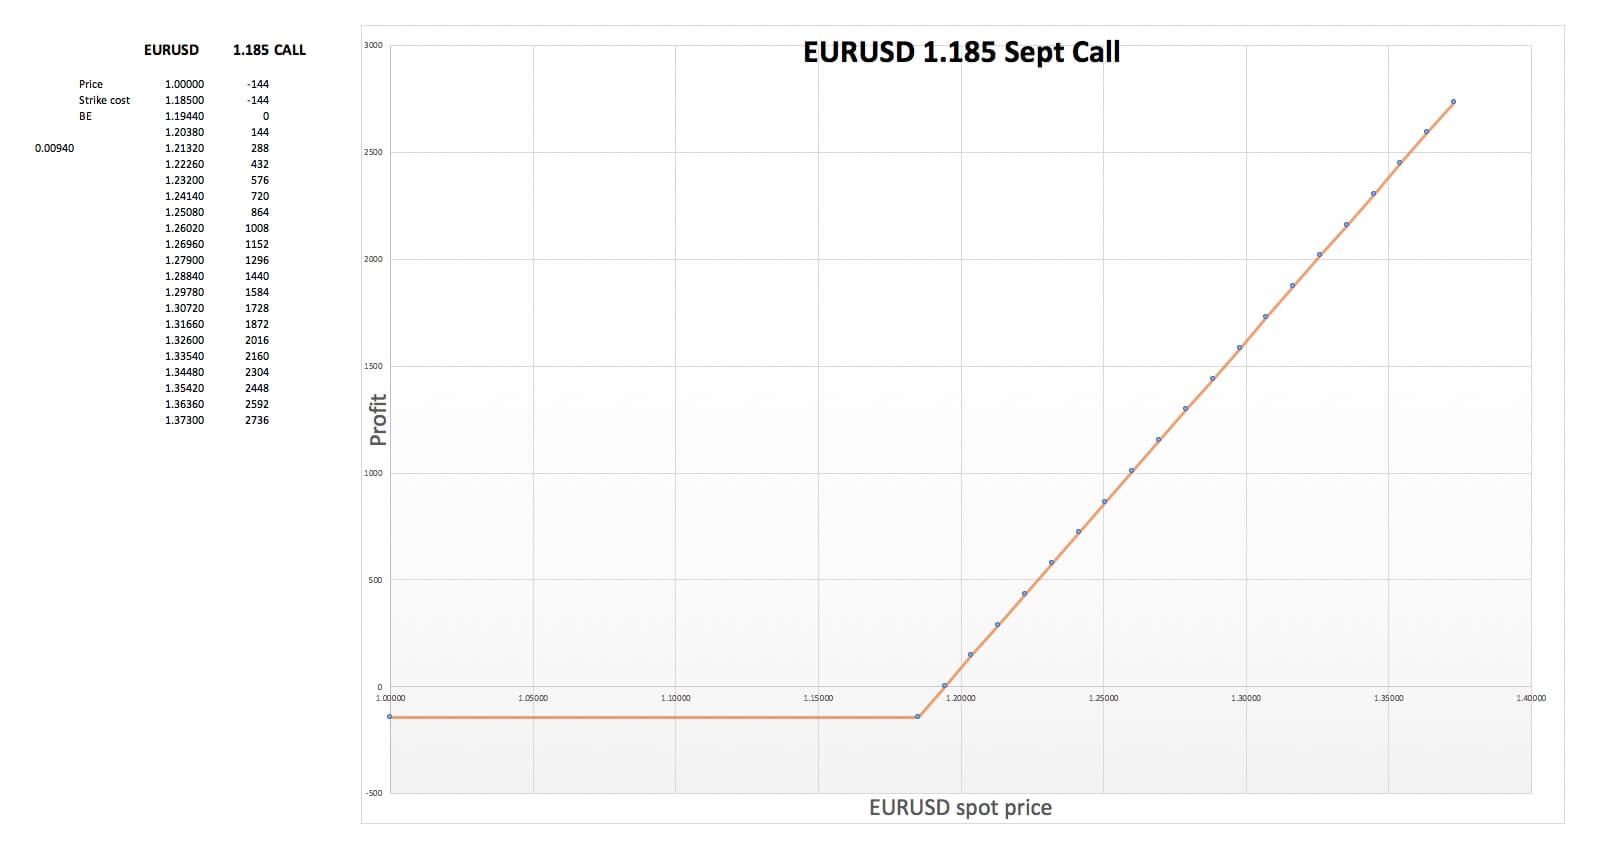
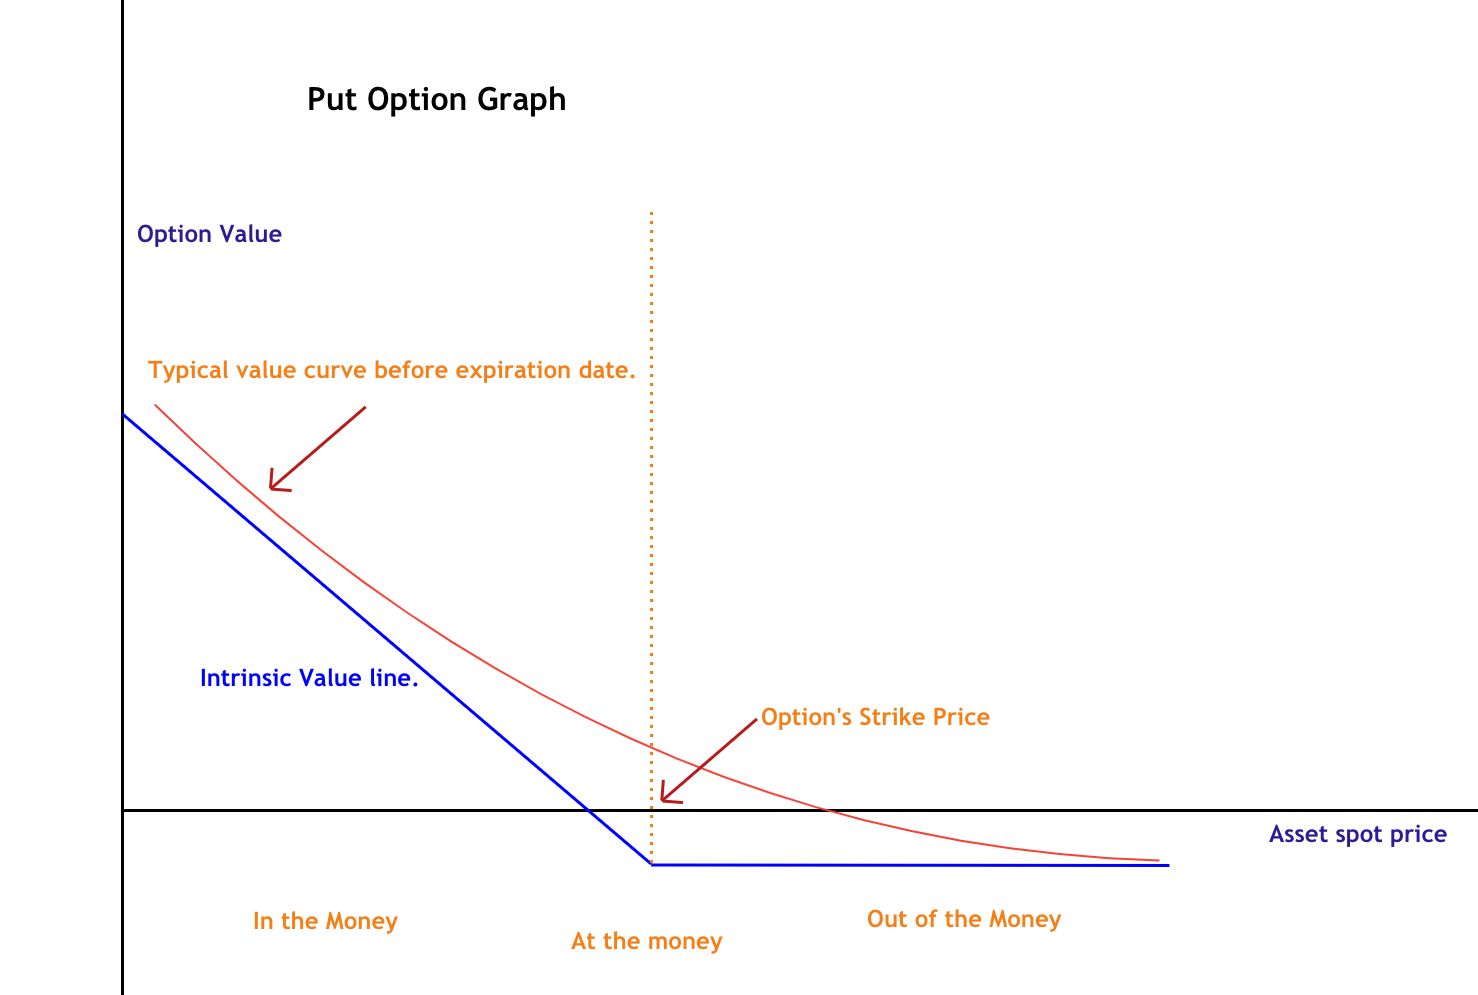
1.- An estimate of the odds that the option will be in the money at its expiry. For instance, if the EURUSD 1.1650 Sept Call has a delta of 0.33, it has about a 33% probability of expiring in the money.

2.- A delta of 0.33 implies that the option moves 0.33 pips for every pip of movement on the underlying. A delta of 100 means the option position is equivalent to buying the underlying asset; thus, a delta of -50 is equal to being short the underlying with half of the original position size.

Please note, though, that the Delta of an option changes with time and price movements.

Delta Neutral

Delta neutral is a way to place the overall trade position so that the Delta nears to zero. This can be achieved by having a combination of options with positive and negative deltas so that their summation is near zero. Delta neutral traders don’t bother with market movements, because they don’t not affect them. Their task is to keep their position neutral, rebalancing it when the position moves away from neutral by opening new positions and/or closing open ones. According to advocates of this methodology, Delta Neutral strategies naturally make a trader buy low and sell high, creating a consistently profitable game.

Probability and risk Analysis

Options traders usually have several ways to fill an options trade for a determined strategy. Thus, evaluating the probability and the risk of the possible trade combinations will determine which is the most profitable and best candidate.
For example, a trader may be decided to buy a put and a call on the EURUSD pair before a potential disrupting event. That way, he will profit from the volatility raise without caring about direction. But he may be in doubt about whether to buy them at the same strike price (Straddle) or a different price (Strangle).

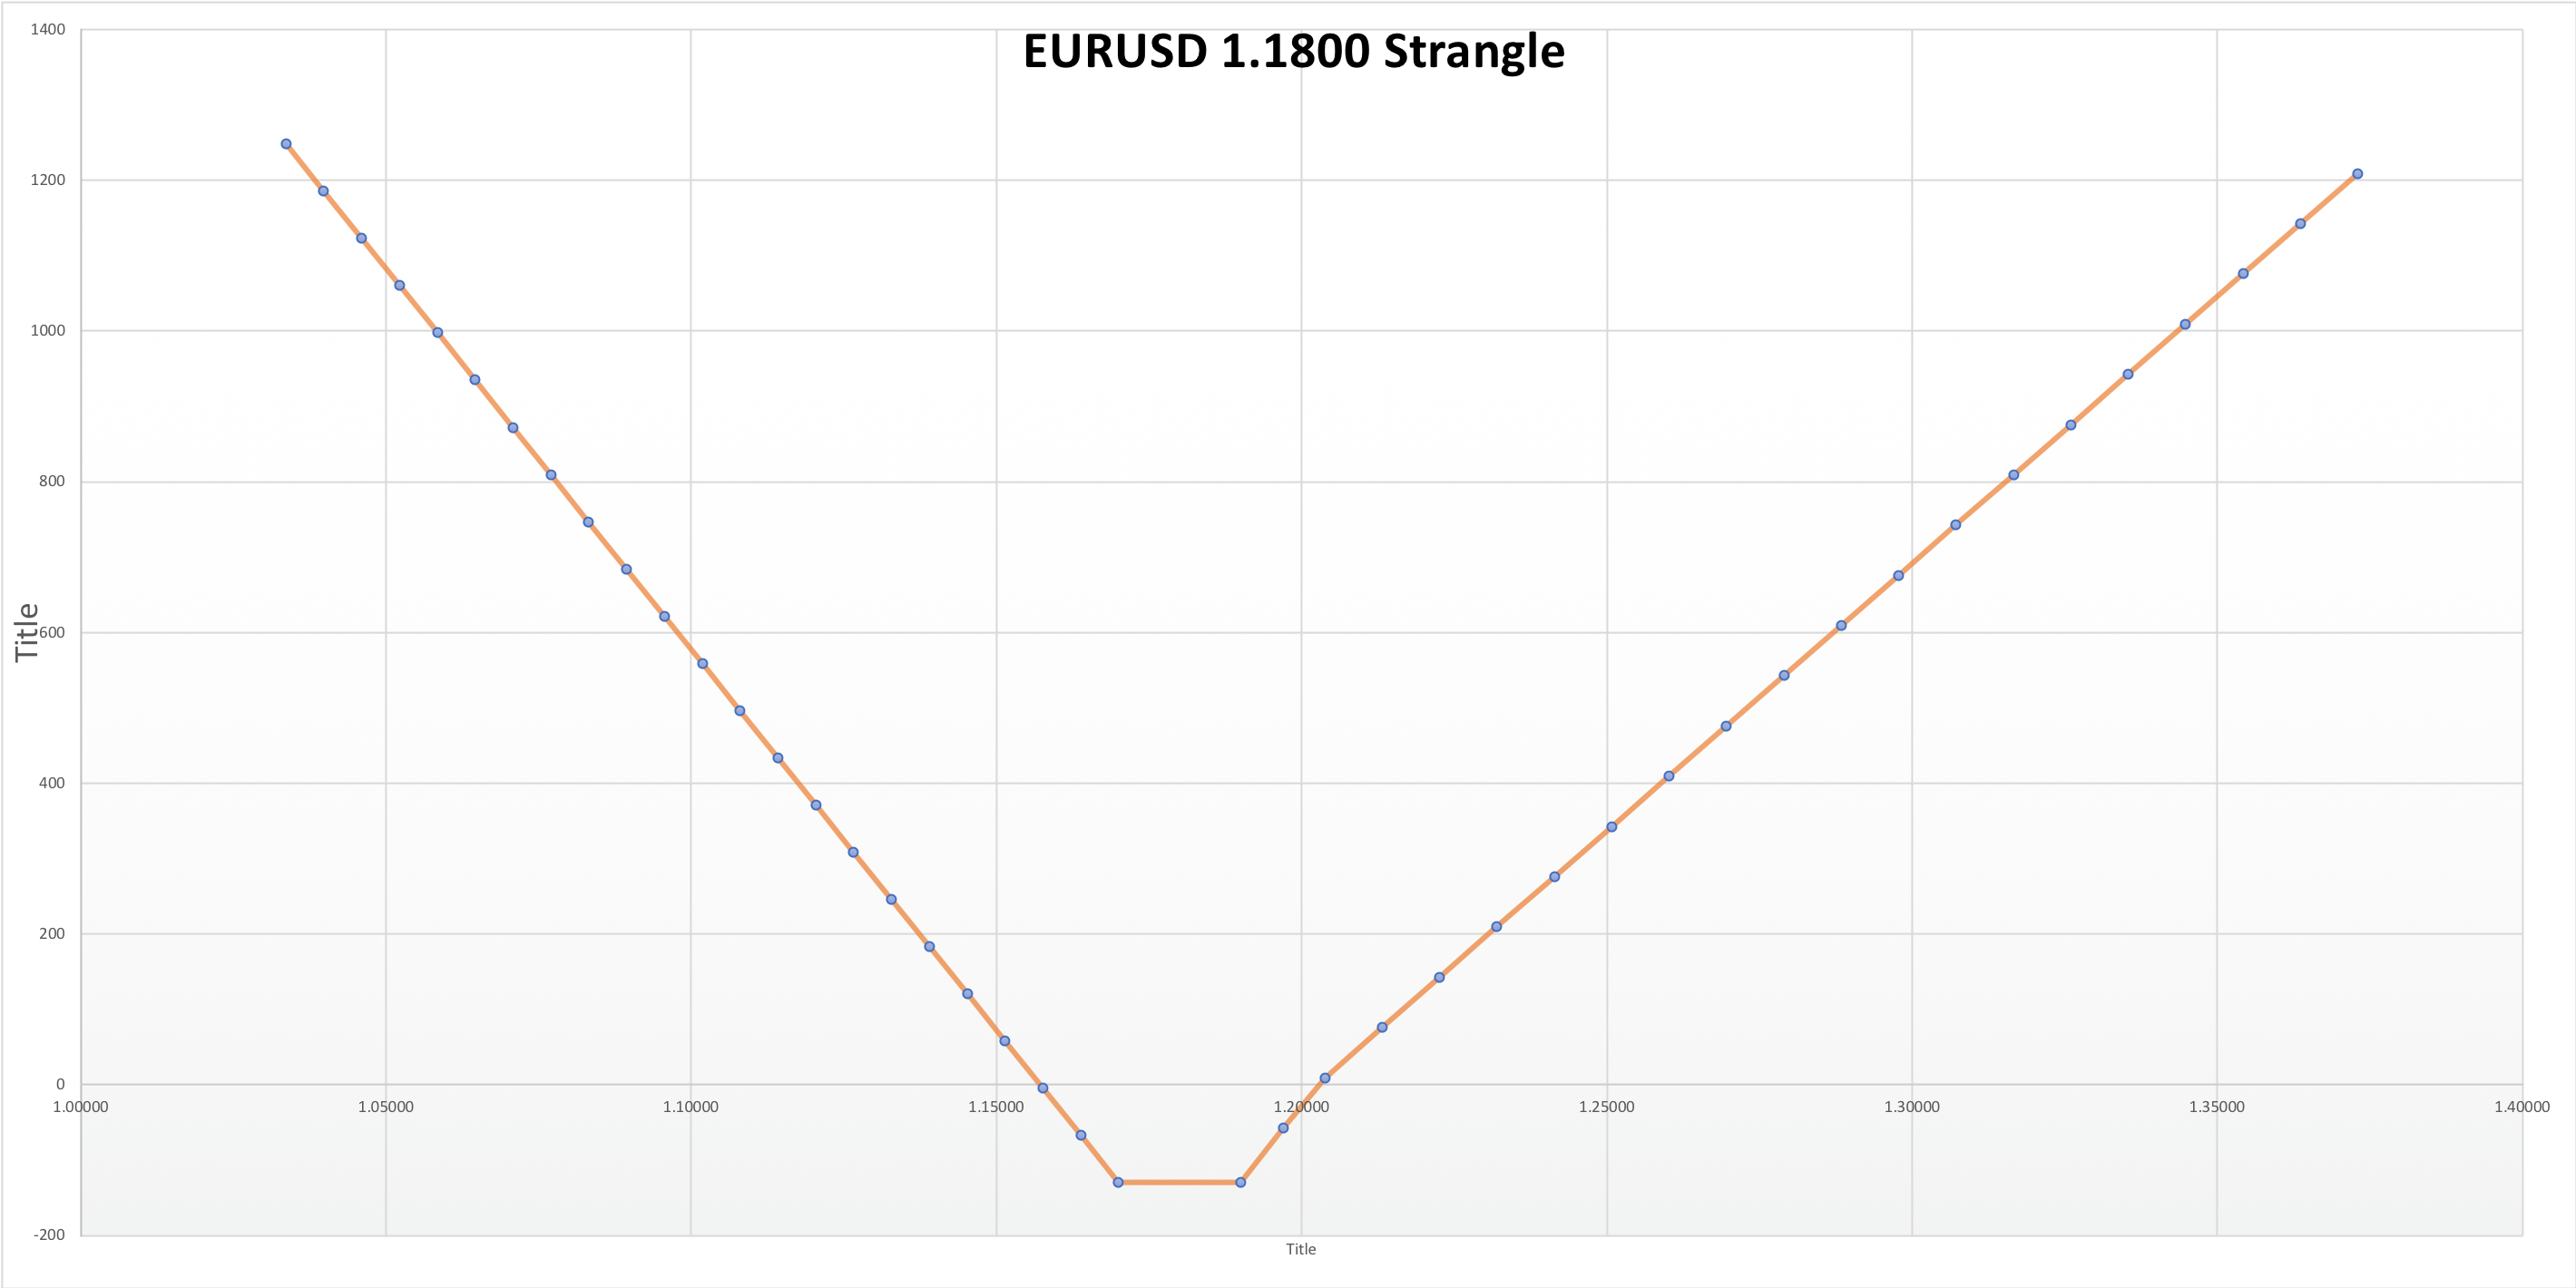
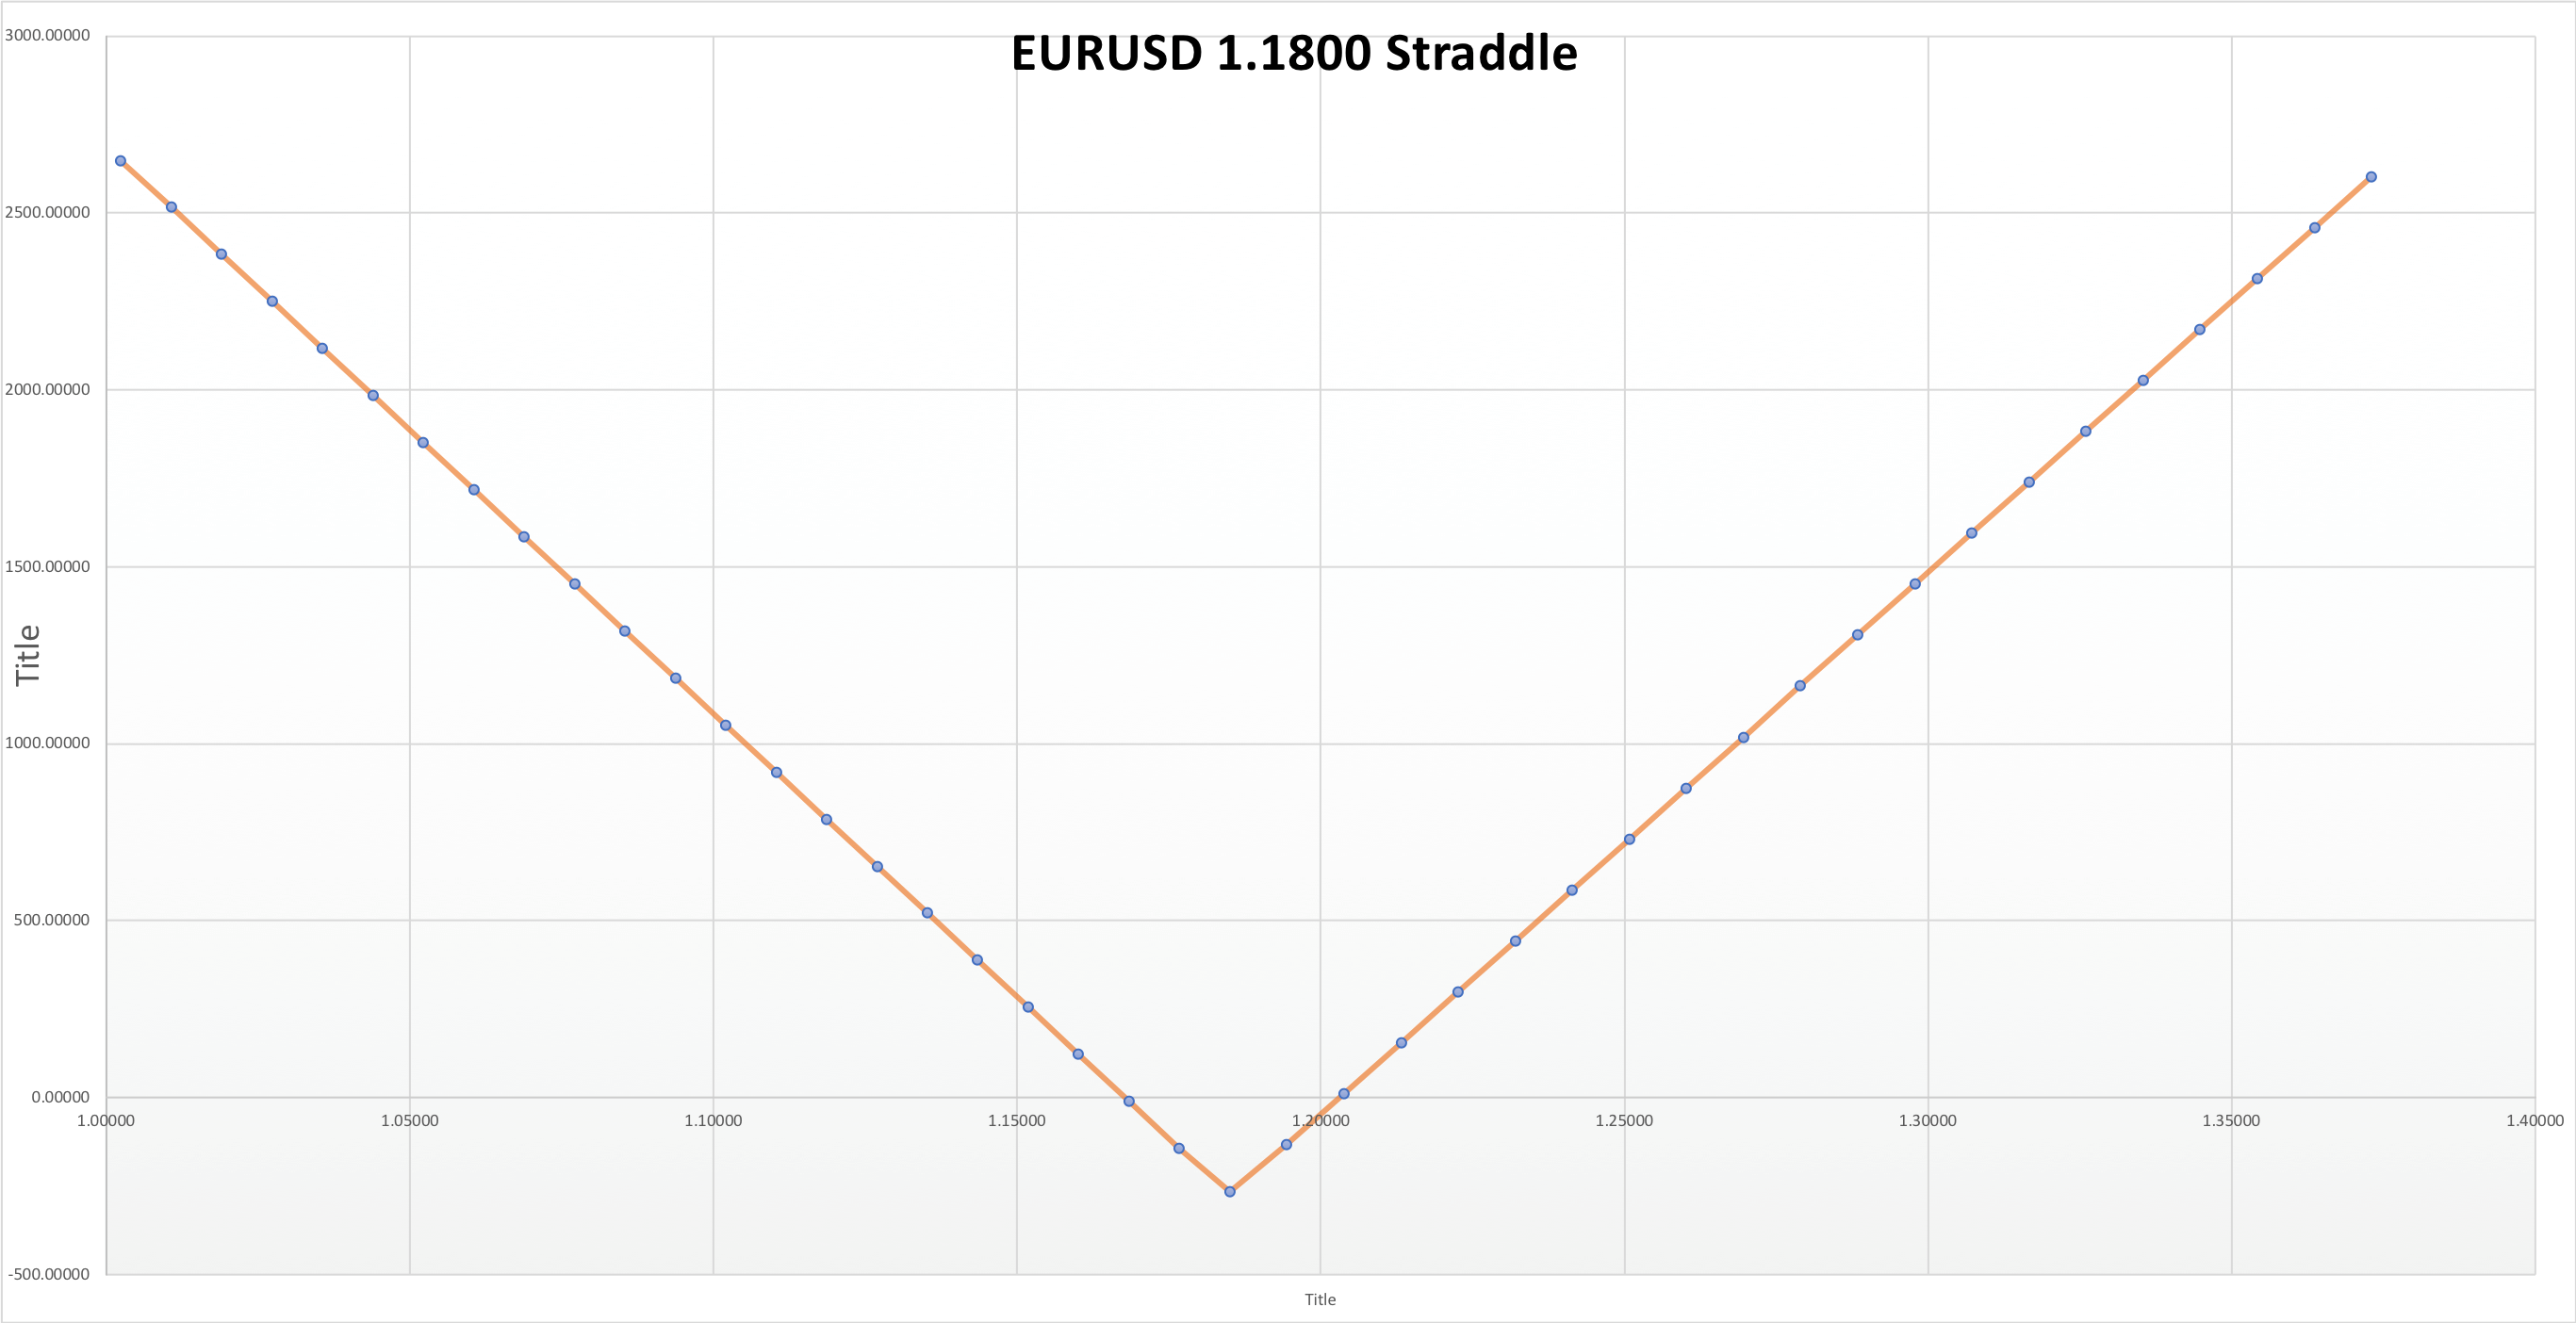
The trader must consider the following for every candidate combination:

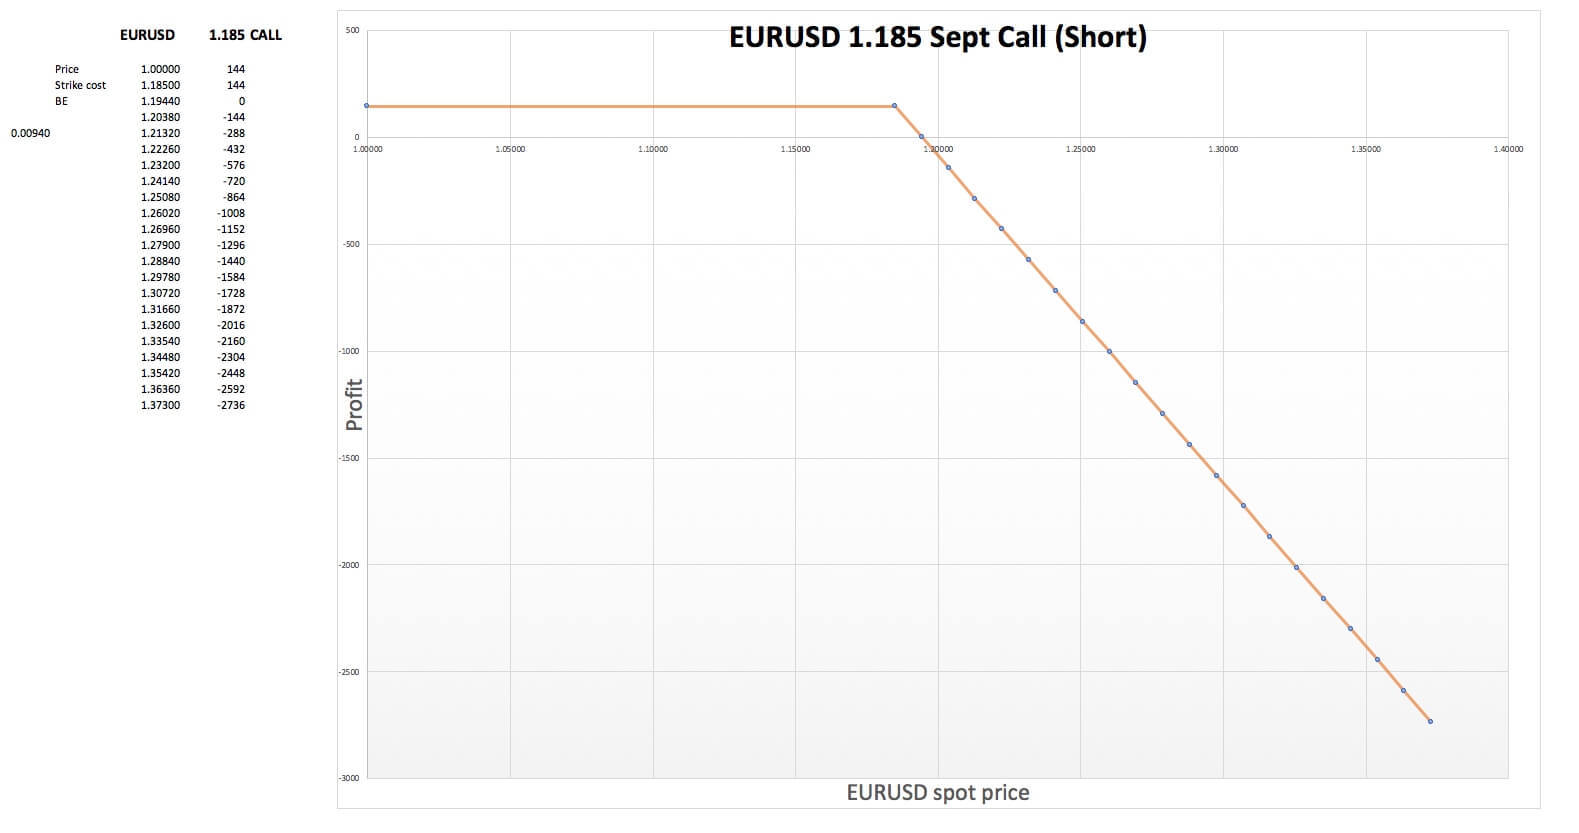
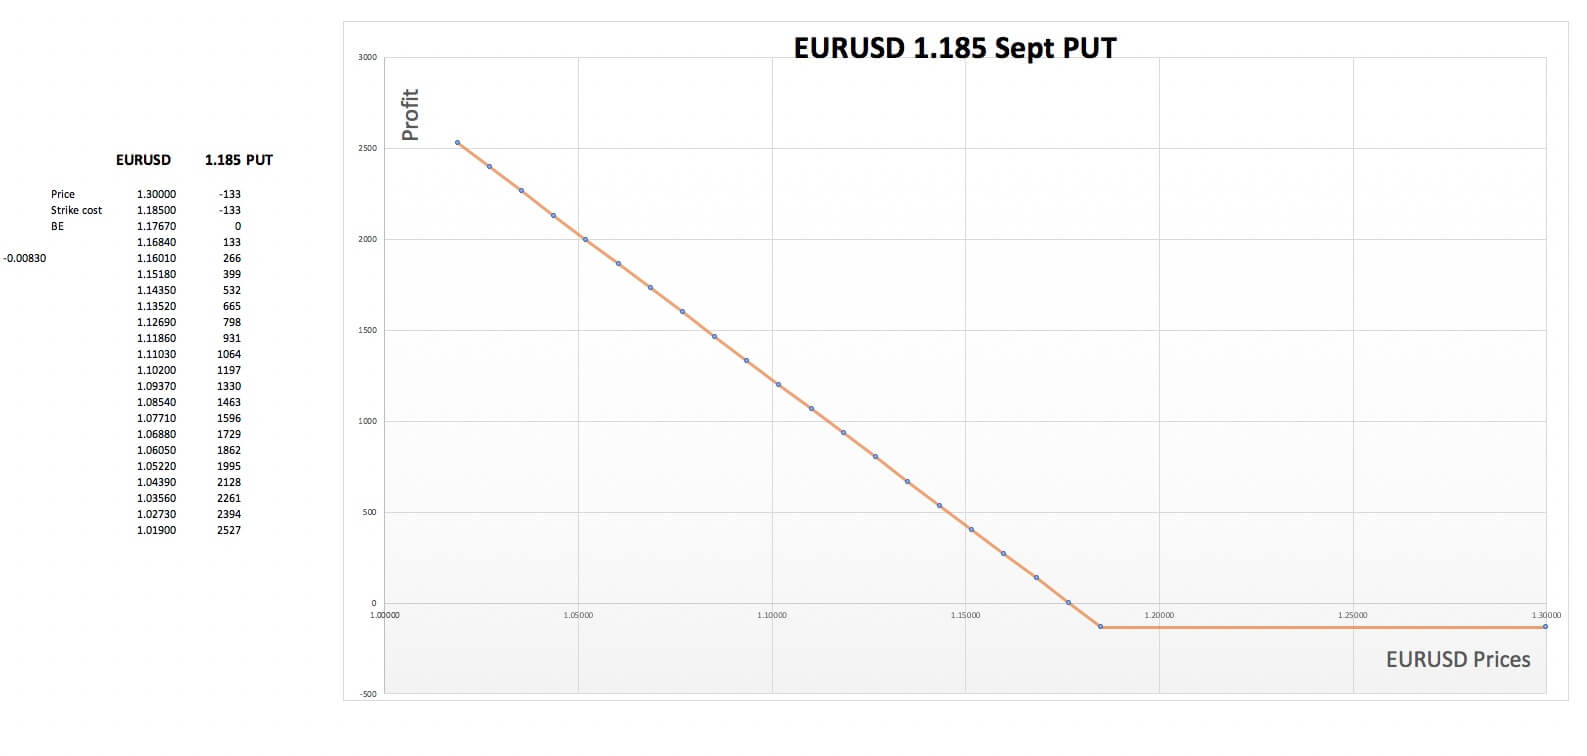
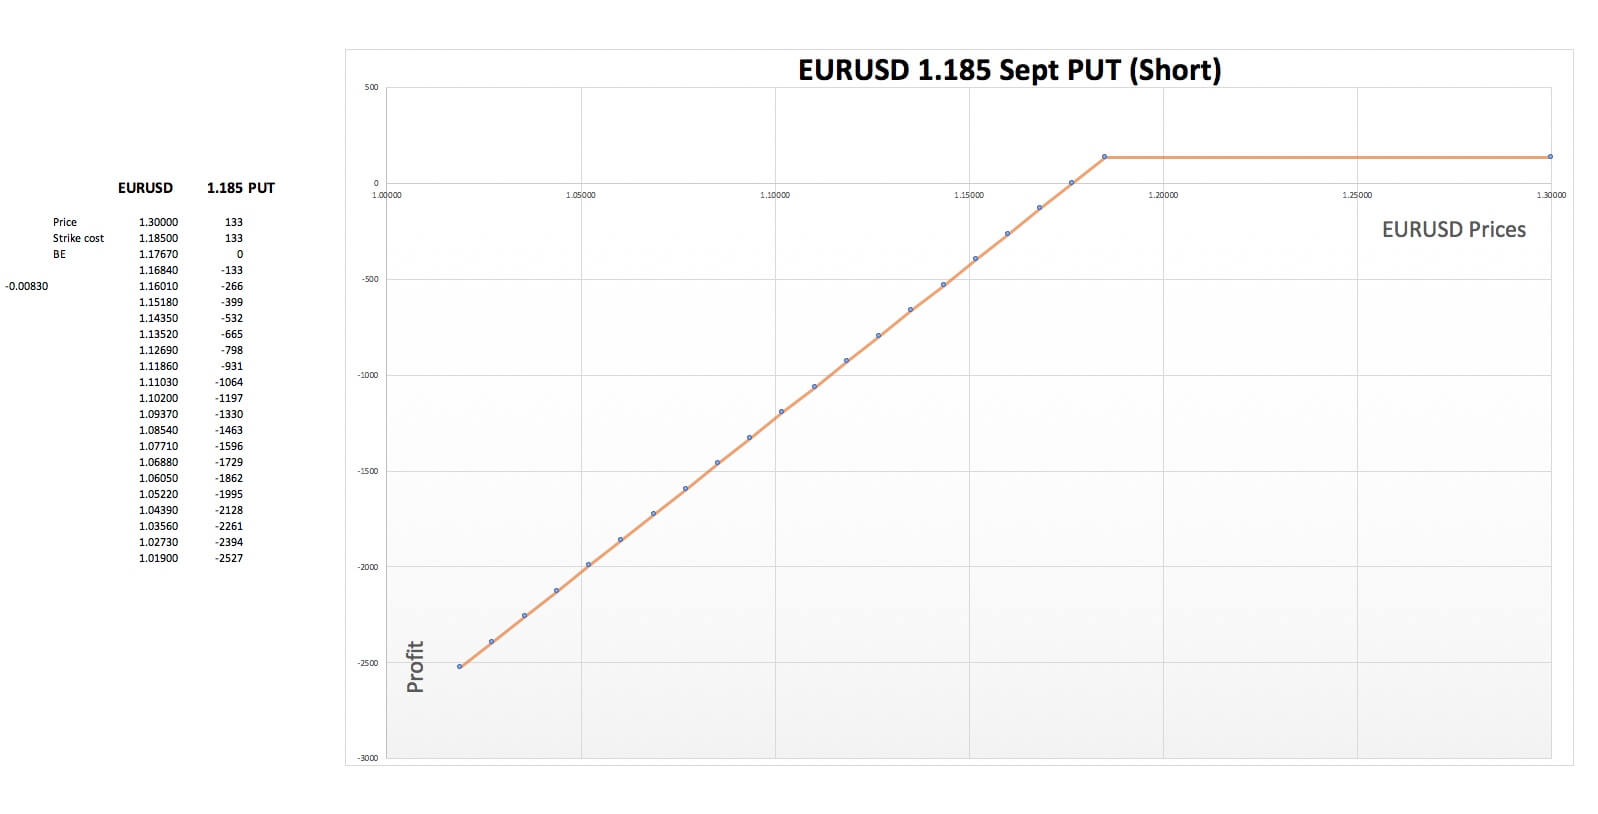
  • Upside and downside break-even points
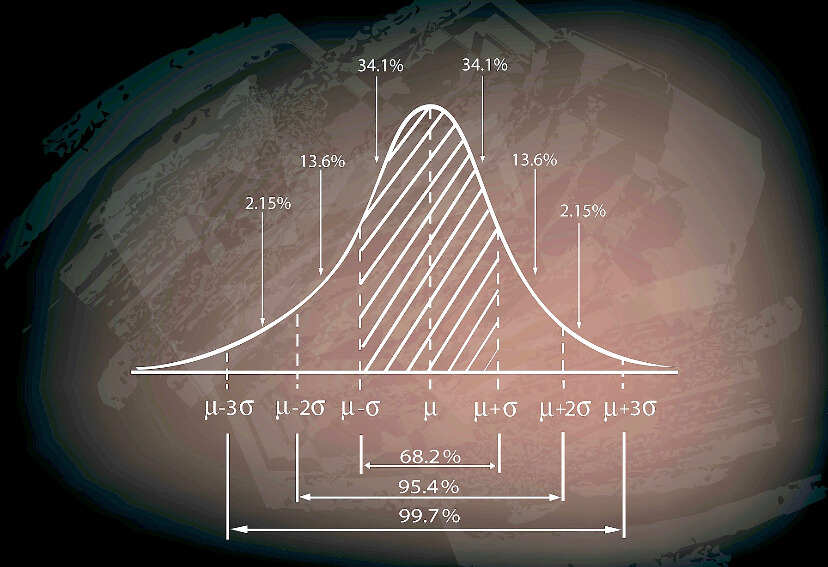
  • Probability of being outside of BE at Expiration
  • Profit at expiration for the upward and downward targets
  • The maximum loss of the option combination
  • Likelihood of experiencing the maximum loss.

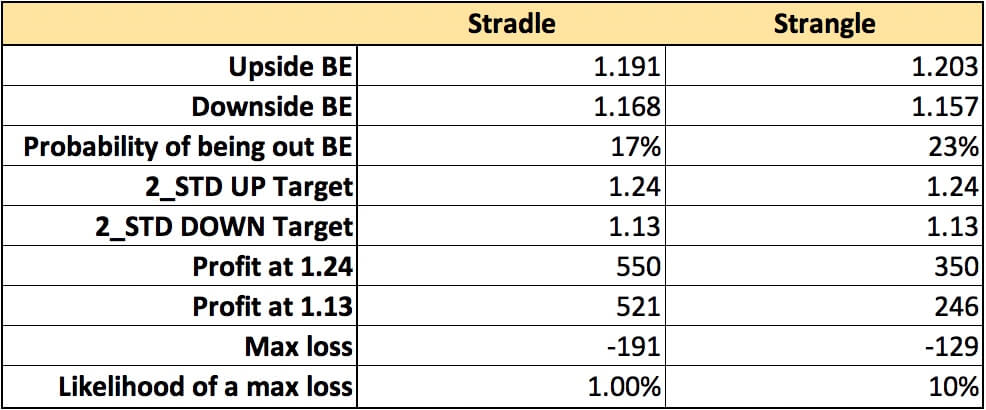
A table made with these parameters will show the best alternative, which in this case, is the Straddle, as it shows the best settings and also the highest rewards for its risk.

Keys to Success in Option Trading

The essential trading guidelines to succeed in options trading are:

  • Identifying the strategies available
  • Understanding when to use a given plan to maximize the benefit
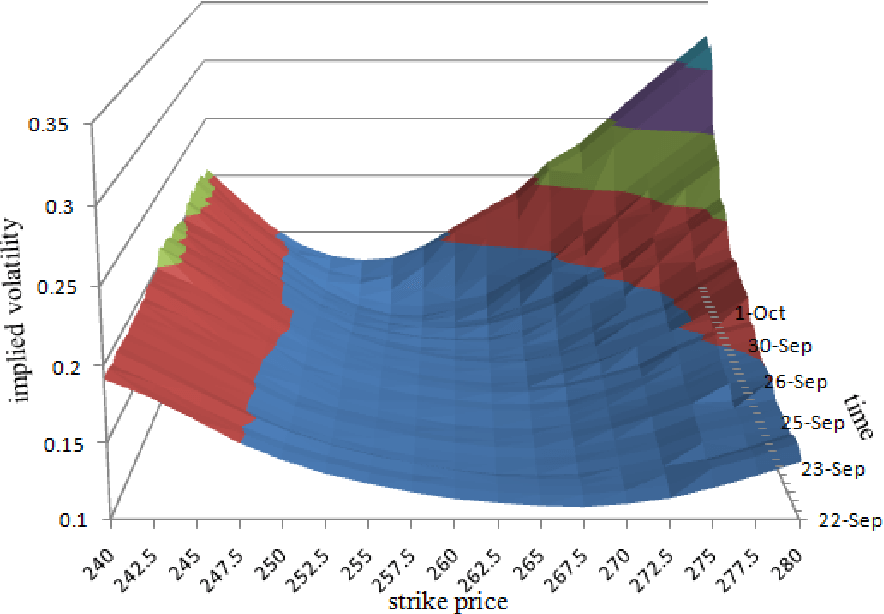
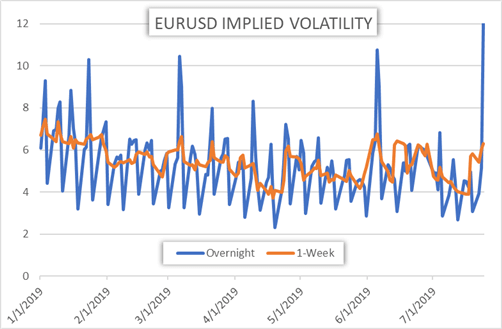
  • Accurately evaluating the level of the current volatility
  • Identifying whether it is time is to buy premium or sell premium
  • Buying undervalued options and selling overvalued options
  • Recognizing when there are disparities in the implied volatilities of different options and take advantage of the fact
  • Properly take a profit and cut a loss

Stay tuned for more on Option Strategies!

Recommended reading:
THE OPTION TRADER’S GUIDE TO PROBABILITY, VOLATILITY, AND TIMING , by Jay Kaeppel

Categories
Forex Videos

Forex Options Part 5 – Risk Profiles


Forex Options III- Risk Profiles of the Basic PUT/CALL Strategies

A Risk profile is the most important tool for analyzing the gain-loss potential of an Options strategy. Thus we need to dedicate a chapter to understand how to make risk profiles. That is because understanding and managing risk is a critical task for the options trader.

Risk profile

A risk profile is the graphical representation of the profit-loss of an options trade in relation to the changes in the price of the underlying asset. The horizontal axis shows the possible stock prices of the underlying asset. The vertical axis from bottom to top show potential losses and profits. The graph lines indicted the theoretical profit and loss of a position at expiration. The zero-line is the trader’s break-even point.


To create a risk profile of a Call option, the horizontal line below the zero-line would represent the cost of the option at day zero. Since below the strike price, the option has no intrinsic value. The horizontal line shows its time value. This line is extended until the strike price point. From there, profits begin to add up, so the path heads to the upside with a slope that reflects the profit and price change.

EURUSD 1.1850 Sept. Call

An easy way to construct it is by using Excel’s graphs after creating a table with relevant profit-loss points. As an example, we present a long position on EURUSD 1-1.850 sept-2020 Call.


In a long Call position, we buy the right, but not the obligation to purchase the asset at the strike price. Thus, if the asset drops in price, let’s say to 1.0000, we are not obliged to buy at the 1.1850 strike price. This sets the maximum loss to the price paid for the call option, which is $144.

Therefore, we set the cost value (-$144) with a minus sign from 1.0000 to its 1.1850 strike price. That will draw a horizontal line. Then we compute the break-even price (1.1944) and set its profit to zero. We calculate the distance from strike to BE ( 0.00940) and add points every that distance, which should also show $144 profit differences. After creating the table, we can create a graph and display it on the sheet.

Similarly, the same EURUSD 1.185 Short Call option will look like:


In the case of an option seller, he expects the price not to go above the strike price at expiration, but our maximum profit is the option premium ($144). If the price moves above the strike price, his premium will fade and start becoming an increasing loss. That is reflected in the profile.

As for Puts, the EURUSD 1.1850 Long Put profile is shown below:

When we purchase a Put, we buy the right to sell at the strike price. Thus, we expect the price of the asset to drop. But we don’t have an obligation to do it, So, if the asset’s price moves up, our loss will only be the cost of the Put option, $133 in this case. That creates the profit-loss profile shown above.

The short version of the EURSD September Put – when you sell the option instead of purchasing it– is:

In this case, the maximum profits occur when the price at expiration is above the strike price. Prices below expiration will covert that profit into increasing losses.

These kinds of graphs will give you the basic profile in case you don’t have more sophisticated options analytical software but is enough to create the strategies’ profile curves.

Categories
Forex Videos

Forex Options Part 4 – Volatility

Forex Options IV – Volatility

Historical Volatility

Historical volatility is the calculated or statistical volatility of an asset. It merely measures the price fluctuations of a security over a specific time. For example, we can calculate the standard deviation of the EURUSD pair over the last 20 days to get the 20-day historical volatility. Options traders, then, use this value to compute the fair price of a given option. If historical volatility is 25%, it means that the asset’s likely movement within the next 12 months will be in a range of about 25% from the current price ( plus or minus).

Figure 1 – EURUSD daily chart with its 20-day historical volatility curve.

Implied Volatility

Implied volatility represents the volatility of an asset expected by the market over the life of an option. The main difference with historical volatility is that the later is based on past price changes. In contrast, Implied Volatility is the volatility implied by the current price action of a given option. Historical volatility looks at the past, whereas implied volatility reflects the market’s expectations for future volatility.

Figure 2 Implied volatility shift with time and strike price


source: Semantic Scholar

When the expected volatility decreases, the option’s premium drops, and when it moves up, the option’s price goes up. Thus, assets with lower levels of implied volatility will hold cheaper option prices.

Implied volatility changes, as the view of the market participants shift. Options’ sensitivity to the changes in implied volatility varies with the time to expiration and strike to spot Price distance. An option near expiration will be less sensitive to implied volatility changes than a similar option with a longer time to expiration. Also, options with strike prices at the money have the highest sensitivity. In contrast, options deep in the money or out of the money are less sensitive to implied volatility shifts.

How to effectively use Implied Volatility

We can follow the asset’s implied volatility and take note when it peaks and when it troughs historically, to determine when it is relatively high and low.

Fig 3 – EURUSD Implied volatility changes
source: dailyfx.com

Following this procedure, we can determine when option prices are cheap, and when they are expensive. Also, since volatility tends to be mean-reverting and cyclic, traders could forecast a potential move towards its average value.
Volatility forecasting by itself is not a stand-alone strategy but can help traders decide their optimal option selection. For instance, if the options are expensive, and a trader expects this to revert to lower values soon, he may choose to sell instead of buying overpriced options. Strategies following this idea can be covered calls, naked puts, or credit spreads. Also, during low implied volatility, the purchase of options is the best choice. In that case, long calls, or even, a long straddle ( long put + long call) can be profitable.


Recommended reading:
THE OPTION TRADER’S GUIDE TO PROBABILITY, VOLATILITY, AND TIMING , by Jay Kaeppel

Categories
Forex Videos

Forex Options 3 – Option Pricing


Forex Options III – Option Pricing


Supply and demand

The price of a given option is determined in the real market by supply and demand. That means a buyer and a seller must agree on a determined price to complete a transaction. A buyer willing to buy at market price must pay the ask price. A seller wanting to sell at market price should accept the bid price. Options spreads are usually larger than spot spreads. For instance, the typical spread of a EURUSD spread is 3-4 pips, but its lower risk at a reduced cost makes them attractive to knowledgeable option traders.

A probability game


Options trading is a probability game. The long-term profitability of an options strategy is linked to the traders trying to buy undervalued options and sell overvalued options. Therefore, the trader should have a clear understanding of theoretical versus market valuations, and, in the case of FX Options, knowing the underlying market fundamentals.
The majority of options traders use an option as if it was the underlying, buying calls when they think the asset will go up and buying puts when considering it will go downward. The issue is that options are wasting assets, thus in most cases, that approach is unprofitable.

Structured approach


Most authors consider that to trade options successfully, a structured approach is necessary. A trading plan is needed, and, in addition, developing the discipline to follow it.
The benefits of a structured approach are:
Emotions are eliminated in the decision-making process
There is no psychological need to be right
The best thinking effort is made before the battle, avoiding subjective decisions

The Theoretical Pricing Model

Options are complex investment products as it involves estimating the odds the price of an underlying asset to surpass the strike price within a given time lapse. The most used model is The Black-Scholes equation that uses the price, volatility, time, and interest rates to compute an option’s fair price. The basic idea of the Black-Scholes model is that the right to delay a decision ( to buy an asset at a specific price) has a value, which can be computed.
A general trait of these models is the assumption that the distribution of prices in the market is Gaussian or something close to it, on a logarithmic scale. Although the Gaussian distribution is an approximation to the way prices move, it is essential to understanding the pricing model’s statistical nature.

Under this model, the price movements of the underlying assets move also following the Normal Distribution. If you’ve followed us in our Stats for traders” video series, you’d understand by now that 68,2% of the values following the bell-shaped curve lie within one standard deviation (SD) from the mean and 95.4% of them lie within two SDs.
That means only 31.8% lie away more than one SD, and just 4.6% go farther than two SDs. In the case of an option, we are interested in only one side of the bell curve. In this context, only 15.9% of the data points lie beyond 1 SD, and 2.3% beyond two SDs.

The Black-Scholes-Merton Formula

C(S0,t) = S0N(d1) -Ke-r(T-t) N(d2)

S0N(d1): The Intrinsic value
-Ke-r(T-t)N(d2): The time value of the option

d1 and d2 are calculations of the area of a point in the curve, which will show the price’s odds to reach that point.

As said, the Black-Scholes-Merton equation assumes that price movements follow the Gaussian Distribution. That, combined with an expiring date and the knowledge of the volatility (sigma) of the asset, are the key ingredients to assess the fair price of the option.
If we were to buy at the absolutely fair price, the model would predict zero gains and zero losses in the long term. But the volatility in the market is not constant but changing. Therefore, the ability to evaluate which options are cheap or expensive, under our forecasted scenario showing a higher (or lower) future volatility is one of the elements for success.

In the next video of this series, we will develop the volatility concept applied to options.


Recommended reading:
THE OPTION TRADER’S GUIDE TO PROBABILITY, VOLATILITY, AND TIMING , by Jay Kaeppel

Categories
Forex Videos

Forex Options 2 – Intrinsic Value & Time Value

Forex Options II – INTRINSIC VALUE AND TIME VALUE

As we have seen in our previous video, Options have value, called the premium. The premium is the cost of buying the option and varies depending on its strike price distance to the spot price.
As we can see on the graph 1, depending on whether the spot price is above, equal or below the strike price, it is said s call option is “in-the-money,” “at-the-money,” or “out-of-the- money” (Conversely, “out-of-the-money,” at-the-money” and “in-the-money” for a put option.)
The value of the option (premium) in a determined moment is composed of its intrinsic value and time value.
Premium = Intrinsic Value + Time Value

Intrinsic value


The intrinsic value of an option is the amount by which it is in-the-money. The intrinsic value part of the premium is not reduced or lost by the passage of time. On a Call option, it is the difference between the spot price and the strike price of the underlying asset. On a Put option, the intrinsic value is equal to the subtraction of the strike price and the asset’s spot price. If the option is at the money or out of the money, its intrinsic value is zero.
We can see that the intrinsic value is not dependent on how much time is left until its expiration. It only tells how much of the value of the asset is included in the price. If the intrinsic value is zero, then the premium has only time value, which decreases over time.

Time Value

The time value (Theta) can be thought of as the amount by which the premium exceeds its intrinsic value. Also called Extrinsic value, the time value has a direct relation to time, but also to changes in volatility. The time value of an option expiring in three weeks has less time value than a similar option expiring in six weeks. That is logical, as the buyer can profit more time from the movement of the option.
Since American options can be exercised any time before expiration, an option premium cannot go below its intrinsic value. This means that the cheaper the option, the less real value is included in the price. The price of out of the money options are lower as the strike price moves further out of the money. That is because the odds of being profitable at expiration decrease with distance from strike to spot price.
The time value has a kind of snowball behavior. It decreases slowly when far away from expiration, but it accelerates and depreciates faster and faster. On the expiration date, the option’s value is only its intrinsic value, which means the option has to be in the money.
As the option is deeper in the money, it has less time value and more intrinsic value. This also means the option behaves more and more as its underlying asset. This is related to the Delta getting closer to 100 ( or -100 in the case of puts). The higher the Delta, the option captures a higher percentage of the movement of its underlying asset.

That’s all for today. In the next videos will explain the basic strategies using options.


Recommended reading:
THE OPTION TRADER’S GUIDE TO PROBABILITY, VOLATILITY, AND TIMING , by Jay Kaeppel

Categories
Forex Videos

An Introduction To Forex Options Part 2- Step Up Your Game!

An Introduction To Forex Options Part 2- Step Up Your Game!


The price of the option, at least theoretically, is determined by a complex computation using the Black-Scholes model. The Black-Scholes equation aims to compute the fair value of the contract, based on the asset’s volatility, the time in days to the expiration, and the distance of the strike price to the spot price of the underlying.
But, the market may and do set a different price. Since strike price and expiring date are fixed, the difference of the market price with the theoretical price, computed using historical volatility, is attributed to a different perception of the asset’s volatility, which is called “implied volatility.”

The greeks

The running price of an option depends on several factors, as we can see: The volatility, the distance of the strike to the current price, and the time to the expiration. The greeks are four factors that define the risk of the option: Delta, Gamma, Vega, and Theta.

Delta

Delta measures the change in the price of an option that results from a change in the underlying’s price. The value of delta ranges from – 100 to zero on puts and from 0 to 100 on calls. For example, the delta of a call at the money ( when the strike and spot prices are equal) is 50, which means the option’s value changes 50% of the change on the underlying’s price. Delta is also a measure of the probability of being profitable at expiration.
We have to pay attention to the following:
– Deltas increase as the expiration date gets closer
– Delta’s rate of change is measured by Gamma
– Implied volatility changes can also change the Delta.

Gamma

Gamma measures the rate at which Delta changes. Gamma is small for out of the money options and gets higher as the option moves at the money. Gamma is positive ( 0-100) for calls and negative ( -100-0) for puts.
A low gamma suggests that even a large movement on the underlying will have a small effect on the Delta and, therefore, on the option’s price.

Vega

Vega is the measure of the volatility of the underlying asset. As the Vega increases, so do the odds of the price moving larger ranges. Hence, an increase in Vega it rises the price of the option, while a shrinking vega will lower it. Thus, option sellers benefit from the shrinkage of Vega. Vega reflects the price action of the market. An increasing Vega shows a trend, while a decreasing vega may show a trading range. Also, since Vega reflects the implied volatility, it can increase or decrease without any price changes on the underlying asset. Of course, a quick change in the price increases it. Also, Vega drops as the option gets closer to its expiration.

Theta

Theta shows the time decay of the option and is related to its distance to the expiration date. As time passes, Theta drops. Theta is always negative since time moves in the same way for calls and puts. Consequently, Theta decay is good for sellers and bad for buyers. Theta is highest for the at-the-money option, and its value drops to its negative limit with an increasing rate near expiration.


Recommended reading:
THE OPTION TRADER’S GUIDE TO PROBABILITY, VOLATILITY, AND TIMING , by Jay Kaeppel

Categories
Forex Videos

Ethereum’s Adoption Rate Exceeding Bitcoin!

Ethereum’s Adoption Rate Exceeds Bitcoin’s Rate After 5 Years


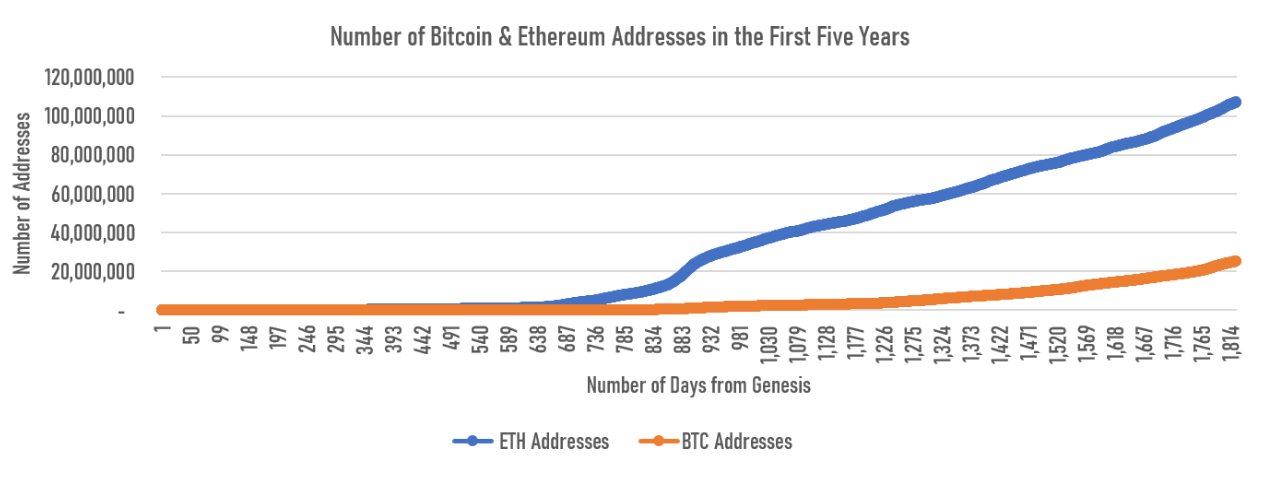
One key metric suggests that Ethereum has enjoyed a much faster adoption rate as well as the growth rate in the first five years of its existence than Bitcoin.
When comparing the total number of addresses created in the first five years on both Ethereum and Bitcoin, it’s easy to see that the second-largest cryptocurrency by market capitalization takes the win.

However, while the number of addresses could be considered a good gauge of the adoption rate, it may not be as perfect as it sounds. One reason for that is that the accounting systems are different.

Key differences


The growth rate for both BTC and ETH networks is quite similar in the first 600 days. However, by mid-2017, Ethereum’s curve became much steeper as a result of the ICO boom and the creation of thousands of ERC20 tokens on the Ethereum protocol.
Another advantage that Ethereum had over Bitcoin from the beginning is that, while Bitcoin was the tech that introduced crypto to the world, Ethereum walked an already walked path. Bitcoin’s adoption was rather slow and gradual at first as almost no one even know what crypto could bring. The slope of its curve never had an uplift similar to Ethereum’s curve during the ICO boom.

Categories
Forex Videos

An Introduction To Forex Options Part1 – Step Up Your Game!


Forex Options: Introduction


This article begins a series that will explain the basic concepts of options. We will focus on the basic or vanilla options because we think they are the most used in all markets, and base of all variants, including the infamous binary options.

Options as Insurance

An option was thought of as insurance, where the buyer acquires the right to be compensated if something happens to his main assets. That way, fund managers could hedge the risks of their portfolios. Thus, an option is a derivative from the main asset, which gives the buyer the right, but not the obligation, to buy or sell at a determined price at the expiration date.
Therefore, contrary to the underlying asset, an option purchase offers unlimited gains for a limited loss. In a sense is like a position with built-in stop loss, only that the stop loss does not get executed until the expiration date of that option. This, and its relatively low cost compared with the cost of the underlying asset, has made options a game extremely popular.

The contract

Options are structured contracts between two parties, a buyer and a seller in which the seller takes the obligation to sell a specified asset at a determined price, called Strike Price, at a future expiration date. The buyer also acquires the right, but not the obligation to buy the asset at the strike price.
Option basic classes
There are two basic option classes: Calls and Puts.

Fig 1 – The valuation curve of a Call

Fig 2 – The valuation curve of a Put

A Call offers the buyer the right to buy the underlying asset at the strike price, and a put provides the buyer the right to sell it at the specified strike price, both at a set expiration date. There are two options styles, European and American options. Both are similar. The only difference is that American options allow the buyer to exercise the option at any time before expiration, while the European style may be exercised only on the Expiration date. The difference is subtle but unimportant, as any trader can sell the purchased option instead of exercising it and use the money to purchase the asset.

Option contract detail terminology

The terminology of an option stipulates the asset, expiration date, type, and strike price of the contract. Example:
“EUR-USD December 01 1.20 Call”
This contract states that the underlying asset is the EUR/USD pair, that the expiration date is December 01, the strike price is 1.20, and is a Call.

Expiration dates are usually the third Saturday of the month for monthly options, but there are also weekly options that may expire at a determined day and time.
We can see that for a predetermined asset there can be a lot of different contracts involving different expiries, strike prices, and class (put or call). These contracts are called option chains.


Recommended reading:
THE OPTION TRADER’S GUIDE TO PROBABILITY, VOLATILITY, AND TIMING , by Jay Kaeppel

Categories
Forex Videos

The US Printed More Money in June Than In Two Centuries!

The US Printed More Money in June Than in Two Centuries

Dan Morehead, CEO of Pantera Capital, expressed his opinion on the US, printing a shocking amount of money to support the economy during the COVID-19 pandemic.
His letter to investors states that “The United States printed more money in June alone than in the first two centuries after its creation.” Morehead continued saying that “In June, the US budget deficit, which counted $864 billion, was larger than the total debt that was incurred from 1776 through the end of 1979, which is shocking.”

Bitcoin is the way out

Morehead made it extremely clear that Pantera Capital sees Bitcoin and cryptocurrencies as a whole as the solution for the current crisis. He also highlighted the contrast of the effects of money printing in recent months, to the effects it had over the centuries:
“With that first trillion USD printed, the US defeated British imperialists, bought Alaska and made the Louisiana Purchase, defeated fascism, built the Interstate Highway System, ended the Great Depression, and went to the Moon.”
Morehead showed his distrust towards how the US handles its finance, citing the resulting inflation as the main reason any person should “get out of fiat money and get into Bitcoin.”

BTC Going to zero

Not everyone is, however, as bullish when it comes to Bitcoin as Morehead is. Goldbug Peter Schiff is also extremely concerned about the effects of money printing the US has done. He predicts that “The US is about to experience one of the greatest inflationary periods in the history of the world.”
However, he isn’t fond of Bitcoin and says that an asset with no intrinsic value will eventually go to $0. He suggests that people move their funds into gold and other precious metals.

Inflated prices 

Despite widespread fears over USD inflation, many experts actually predict that consumer prices will go into a period of deflation.
However, many believe the inflation is, at the moment, actually hidden in asset prices rather than consumer prices.
Pantera Capital revealed a simple investment strategy it has when it comes to non-fiat assets:
“Stay long on crypto until schools and daycares open. Until then, the economy won’t function properly and money will be continuously printed.”

Categories
Forex Videos

The End Of The Retail Forex Trader?


Is the Forex market creaking at the seams?


Retail forex traders take for granted, or do not know, or simply forget, that the retail sector of this market is derived from and only operates on the back of the institutional foreign exchange market place, where currencies are physically sold and bought, and need to be electronically delivered, on behalf of their institutional accounts and where these trades are growing again after a short period of decline to over $6.6 trillion in value per day in spot FX and the forward FX market.

If not for the continual success of the institutional forex market, there would be no retail market, where retail traders trade on the difference in price, contracts for difference or spread betting, and do not take physical delivery of the currencies they trade in.

In 2002, under the direction of the Federal Reserve, a company called CLS group which stands for continuous linked settlement was formed to act as the middleman in a large and ever-growing portion of institutional forex trades and where it was their role to authenticate and match trades to ensure that correct currencies or payments are placed into correct accounts.

CLS has prepared a report which was recently published by the global FX committee, or GFXC,  which was set up in 2017 as a forum for bringing together central Banks and private sector participants with the aim to promote a bus fare liquid open and appropriately transparent foreign exchange.

CLS is set up to deal in 18 currencies, most of which are from major economies. In the report, the chief executive, Marc Bayle de Jesse, mentioned a worrying statement, and I quote, ‘’ given the way in which FX trading has evolved, we have to think of additional ways to solve the problems of systemic risk’’.

He added that the market had previously seen payment failure in 1974 when Herstatt Bank in Germany, which was a privately owned bank in the city of Cologne, failed in the delivery of German Deutsche marks and US Dollars in a forex transaction because of time zone differences between Germany and the USA. This, coupled with the fact that they had made losses in betting against the dollar, caused the bank to be put into administration. The knock-on effect was significant, where the counterparty banks did not receive their US dollar payments.

Other entities, such as the bank for international settlements and GFXC themselves, have also expressed potentially very significant risks due to the amounts involved.

And while the payment cost of some clearinghouses is deemed to be expensive, some banks and institutions prefer to settle FX trades directly with their trading counterparts based on trust.

With the forex market growing and where emerging economies will be relying more and more on foreign exchange transactions, it is worrying to see that major clearinghouses are worried that there could be a breakdown in settlements  If this were to happen on large transactions it could cause utter panic in the foreign exchange markets, with a possibility of a halt in market makers offering liquidity to the market, this could cause a spill over into the retail market with disruption to pricing, liquidity and even temporary suspension in trading. As if retail traders didn’t have enough to worry about! Let’s hope those clever people in clearing can develop extra fail-safe mechanisms to protect international settlements.

Categories
Forex Videos

How do public holidays affect the Forex market?

How do public holidays affect the Forex market?

Thank you for joining the forex academy educational video. In this video presentation, we will be looking at how public holidays affect the forex market.
Public holidays have various effects on the financial markets, including forex trading. For example, in institutional forex trading where banks, hedge funds, and institutions physically buy and sell currencies, which have to be delivered into bank accounts, in some situations, public holidays may require that settlement dates are postponed for one business day.
But in the world of retail currency trading, where traders trade contracts for difference or spread betting, this, of course, does not apply.
Bank holidays mean that the banks in the country where the holiday is taking place will be very unlikely to be trading in the forex market. And because banks are the biggest single participants in the forex markets, if they are on holiday, then the volume of transactions is typically reduced. When volume is reduced, this can have the effect of making the market static in the given currency pair are involved. But this thinning can also cause voids and gaps, which can also have the effect of creating spikes in price action.

As an example, when the Japanese have a public holiday, it is not unusual to see the USD JPY pair have periods of extra and volatility. While, if for example, the Euro area and the US shared a public holiday, such as the Christmas period, you would typically find thin market conditions and little volatility, especially when those two currencies are paired.
Another thing to consider, which most retail traders do not, is that there can often be extra volatility in price action in the 24 or 48 hours before a public holiday, and also so a day or two after a public holiday. This is known as the public holiday effect and is well-known, particularly in the stock market, where investors see extra volatility and usually extra buying during the run-up to public holidays.
Sometimes this is not quite so evident within the forex market; however, things to be considered are that large institutions do not like large exposed trading positions over weekends and public holidays. Often you will find that banks, institutions, and traders like to adjust positions by closing them out or switching between assets, for example, out of a currency and into a more stable asset such as gold, which is very bullish in the current market. This is known as hedging. Certainly, the longer the public holiday, the more likely you will see thinning in markets and where Christmas is the best example.
This type of situation can lead to extra price volatility in the run-up to public holidays, and you should bear this in mind before you place trades before, during, and after a public holiday.

And so, bank holidays can cause the forex market, on occasion, to act erratically and where fundamental and technical analysis sometimes has little or no bearing on price action. In other words, trade during public holidays at your peril. If you insist on trading during these periods, you should expect the unexpected and always maintain tight stop losses. And take note, the bigger the country, the less the volume going through, for example, the most widely traded currency in the United States dollar and if they are on holiday volume crashes, similarly with Europe with regard to the Euro currency.
Ensure that you have a good public holiday calendar which you can refer to in order to trade around public holidays
Here are the public holidays for August, September, and October 2020.

Categories
Forex Videos

Forex GBPUSD Breakdown 14th-24th July 2020


A detailed look at Cable price action 14th to 24th July 2020


What is going on with the GBPUSD pair, AKA Cable?

Thank you for joining the forex academy educational video. In this session, we will be looking at what has been happening with the Great British pound US Dollar pair, also known as Cable between the 14th to the 24th of July 2020.
The idea behind this video is to show you what professional traders look for in their technical analysis in order to try and determine the future movement of price action.


This is a 1-hour chart of Cable for the period of the 14th to the 24th of July 2020.
One of the biggest mistakes that new traders make is that they do not look at historical price action before putting on a trade. Technical analysis is a trader’s best friend and should be looked at holistically before for taking on a trade. Technical charts should be looked at from left to right because they tell a story.

We can see that the price action of this pair was bid up to position A, which was a new recent high and, importantly, above the key figure of 1.2600, a multi-month high for the pair. Traders will have taken some profits after this push, and we see price action fall back to the support line, before a second push higher to position B, and where position B is lower than position A. This tells us that the strong bull move was running out of steam. Buyers were worried about a possible double top rejection of position A, and this left the door open for sellers to come in because the price could not be sustained above the key 1.26 level.

We then have a period of sideways consolidation between the support and resistance line and more importantly between the two key levels of 1.25 and 1.26, however, there is a breakout of this consolidation period at position D, where the bulls gain control and where the resistance line becomes support and we see an aggressive move higher from here position E. support lines often become resistance lines and vice versa. The other critical component of this bull move was the fact that the EU Brexit negotiator Mr. Barnier was holding talks with a British government regarding the future trading arrangements, post-Brexit, and a potential new trade deal. The market was expecting that a possible deal could be reached, and this was seen as positive for the British pound.
Meanwhile, profit-taking was taking place at position E and where subsequent price action began to fall back to position F and where technical analysis traders saw a bear formation and pushed pair down to position G, which is an important round number of 1.2650.

Looking for an opportunity to enter the market, bears again took control and pushed the pair higher. However the fading arch formation was reflective of uncertainty, and where the market was braced for an EU press conference, where Michael Barnier, the lead negotiator for a new EU/UK trade deal, said that a deal was unlikely with the British government due to substantial differences and so-called red lines around fishing rights and possible divergences in standards, which would likely prevent a deal being reached. This was seen by the markets as bad for the British pound and activated an initial sell-off in the pair, which was only stopped in its tracks when the United States released worse than expected initial jobless claims data for June, which reversed the pair at position H, coupled with the fact that Mr. Barnier said that there was still an opportunity to secure a deal with a British government and that talks would resume again in August. This gave a more positive sentiment to the pound, and the pair lifted to the second period of support and resistance, importantly, this was above the key 1.27 level.

In thin trading on Friday evening, BST, after the European and London sessions had finished, and with China and US tensions rising because of a breakdown in relations and a lack of trust growing on either side, the US dollar was generally sold off across the board and Cable lifted to a new multi-month high of 1.2800.
A large part of the bid tone in this pair is because of a bad sentiment for the United States economy due to the growing number of Covid cases which is seen as being almost out of control, and where are Great Britain has largely surpassed the worst of the disease and whereby the economy is opening up, and things are returning to some kind of normal.

The scope is for further upside in this pair due to the ever-increasing bad sentiment for the United States dollar and slightly better sentiment for the British pound, where there is still hope that an EU UK trade deal can be completed by December.

Categories
Forex Videos

Making Huge Profits In Gold buying the dips!

Gold, buy the dips

Welcome to this forex academy educational video. In this session, we will be looking at the uptrend in gold prices with regard to the possibility of a continuation in this bull trend.

Gold, buy the dips.


In this historical chart going back to 1998 where prices were just 200.00, we can see an almost exponential rise in the value of gold to its current levels.
Gold, which is the oldest currency on earth, is traded primarily by people looking to invest by taking ownership of the physical product however it is used in the markets four trading on speculation for hedging against swings peaks and troughs in the general financial markets which is pretty much what we are seeing today. The most recent rise in the value of go gold is attributed to the uncertainties in the global financial markets pertaining to the onset of the covid virus.
The recent rise in the value of gold should be attributed to a risk-off event in the financial markets where people are bailing out of certain riskier assets and moving into gold. This includes general speculators who are enjoying the recent bull trend to these historic highs.


In this 5-day chart, we can see peaks, troughs, and spikes in prices, plus pullbacks and price flattening followed by a slight sell-off, and then continuations to the current highs. Price has generally been able to stay above 1900.00

Analysts at Goldman Sachs have increased their 12-month price outlook for gold to $2,300 a troy ounce. And while stock markets around the world are looking exposed to the continuation in the covid virus with potential falls on the horizon, and where yields are considered to be low in the bond market, it is no surprise that investors are looking for ways to offset their exposure to these assets and recently, for many, gold stands out. The bull trend speaks for itself.

Morning show institutions wrestle with the incredible amounts of stimulus being unleashed into the market by the federal reserve, and well they worry about the potential knock-on effect with regard to rising inflation; as a result, markets tend to reflect on previous similar situations such as the market crash in 2008 and other virus outbreaks in order to predict future price movement. While the big guns worry about the intricacies of the continuing financial crisis, shrewd investors will be following the money. With that in mind, gold is looking like a safe investment, in which case some major analysts are suggesting should continue looking for entries into this gold trend as it nudges up towards 2000.

Categories
Forex Videos

Forex! GBPUSD/Cable looks towards 1.3200!

Cable looks towards 1.3200

Thank you for joining this forex academy educational video. In this session, we will be looking at the GBPUSD pair, also known as cable.
The idea is to show you recent price action on a 1-hour chart so that you can apply the related methodology to your own trading style.


Always read your chart from left to right because it tells a story of historical price action key levels and what potentially is driving a particular currency pair.
Here we can see that price action remained bullish from the 27th of July, and moved up to a significant key level at 1.300. It Immediately found some sellers at the position, and where 1.300 was then seen as an area of resistance. After such a bullish move, traders will typically take some profit and wait for the next significant move in price action before they re-join. Here on our chart, we can see that at position B, here was a retest of the 1.300 and where this level subsequently became an area of support. Again, we see a nice bull rally before price action falls back to the key level at 1.30 at position C and D, where subsequently, the bulls finally start buying the pair ad where 1.300 is then seen as a significant area of support.
Price action goes on to breach the 1.3100 key level, and then at position E Andrew Bailey, Governor of the Bank of England left its interest rates on hold for the August meeting and left its policy unchanged. Importantly all nine members of the monetary policy committee voted to leave interest rates and changed.

Because there was market speculation that the Bank of England might introduce negative interest rates to try and mitigate against the negative economic effects of the covid pandemic, this was largely discounted by the governor of the Bank of England who said after the announcement that negative interest rates would be useful and remain in the toolbox, but they have no plan to introduce them at the moment.
Again, this provided a lift for cable, which was driven up on the good news to 1.3183. 1.3200 will be on traders’ minds as the next significant test.
Things to consider are that growth forecasts have been upgraded with positive data releases in recent weeks for Great Britain. And Mr. Bailey said that “The British economy is still set to contract in 2020 – COVID-19 is taking its toll. Nevertheless, this decline has now been trimmed to single digits – 9.5% against 14% beforehand. That is a substantial upgrade. While the BoE also trimmed growth forecasts for the next two years – a slower recovery – it is hard to foresee too far into the future given the high uncertainty surrounding the virus.” However, the Bank of England remains wary of further outbreaks of the virus, hampering the economic recovery for the United Kingdom.
Cable will need to push up and find a support area above 1.3170 in order for a sustained push up to the 1.3200 level. We would imagine an initial rejection of this key exchange rate, however, if the market goes on to attack it on a number of occasions, it could be breached and leave the door open for a push-up to 1.3250. Failure will see a push down to the low 1.30’s

Categories
Forex Videos

Where Next for The Dow Jones Industrial Average!


Where Next for The Dow Jones Industrial Average?

Where next for the day jones industrial average?
Thank you for joining the forex academy educational video. In today’s session, we will be looking at the dow jones industrial average, which is closely watched and considered to be the main united states benchmark indices.
It is price-weighted and tracks the performance of 30 of America’s largest companies, which are mostly listed on the New York stock exchange.


The Dow Jones index reached a record high of over 29,000 in February, before tanking to just above 18,000 in march during the worst of the Covid pandemic in the United States. And then rallied back up to 27,500 in June while the United States was still severely impacted by the outbreak of the virus. The amazing recovery was largely driven. I hope that the pandemic would soon be over and that a recovery would quickly happen within the United States with regard to the economy getting back to normal. The Fed was calling this a V-shaped recovery. Straight down and then straight up. However, this has not exactly transpired, and although the federal reserve has implemented monetary policies to prop up their ailing economy and help those individuals who have been impacted, including support for companies, all of this is just adding to America’s debt burden. The typical analysis of the stock market being driven up by growth is, therefore, flying in the face of the fundamentals.
And while every single good news regarding vaccines has tended to keep the Dow Jones index propped up, almost artificially, another aspect which has been holding it up to levels above 26,000 points and more recently a pop above 27,000 points has been the expectation that tech stocks would perform very well during this time. This has been backed up by strong performances from companies such as Microsoft and apple Intel NVIDIA and Amazon, which are listed on the alternative index, the National Association of Securities Dealers Automated Quotations, or Nasdaq, of which there are two variant indices; the 100 and the composite.


Worryingly Wall Street closed in the red, which was largely triggered by buy tech stocks falling potentially bursting the bubble that the American economy will be driven higher by such stocks leading to a v-shaped recovery.
Even more alarming is the continuing spat between China and the United States, which could lead to tariffs being implemented on either side and potential sanctions. Any breakdown in trade between the two nations, especially China buying from the United States at the moment, would also impact on the so-called v-shaped recovery. And, of course, America just does not seem to be getting a handle on the number of cases of Covey, which are escalating in some States.
The pullback from 27,000 points on the Dow to the current level of 26,470, at the time of writing, and a simultaneous drop on the s&p 500 of 20 points and a shed of 98 points on the NASDAQ on Friday the 24th July, has set alarm bells ringing with investors and traders who have been concerned that stock markets in the United States are overvalued and about to crash for a second time since March.

Categories
Forex Videos

How To Make Money Following Our Free FX Options Signals! Updates & Improvements

How To Make Money Following Our FX Options Section – Update

Thank you for joining the Forex Academy educational video. In this video, we will be looking at our FX options service, which is completely free and which we first brought you on the 23rd of April this year. We will be taking a look at how the service is going since its inception and what’s changed and how it can be applied to your daily trading to enhance your overall success rate.


First, you will need to head to our website at Forex (dot) Academy, select market update, and from the drop-down menu, click on FX options.


Every day, on this page, our analyst, Kevin O’Sullivan, brings you the combined volume FX option expiries, which close at 10 a.m. New York time, each day. The combined amounts will never be less than 100 million of the local currency pertaining to the maturity. And where these large volume FX option maturities have a magnetic effect on the price action of the particular currency typically major pairs that are involved.


This is what you might expect to see when you click on the FX options page every day when the majority are available. Here we can see that there are three options maturities due to roll off at the 10 a.m. New York cut. The first option is for 982 million euros at the 1.1300 exchange rate, the second option is for 584 million euros at 1.1400, and the third option is 4 for 512 million euros at 1.1500.


These FX option maturities are lean plotted on to a 1-hour chart and colour coded red, orange, or blue. If you see an FX option in red, there is a high probability that’s the price action gravitates towards this by 10 a.m. New York. If the maturity is colour coded in orange, there is a slightly less possible chance of price reaching this level by the cut. And if the maturities are highlighted in blue, there is an unlikely chance that price action reaches these levels by 10 a.m.


Kevin will also so provide chart analysis, which is a fairly new feature when he publishes this data at around 8:30 a.m. BST each day. Here he says that the pair is consolidating but that the 1.1400 option expiry is within range and with a caveat that eurozone data and policymaker speeches may play a role in trend direction. He has provided support and resistance levels, and the two options at 1.13 and 1.15 are discounted by coding them in blue, Kevin, and where he believes the price will move to the upside to target the 1.400 maturity which he has coded in red.


Let’s take a look at the price action later on during the European and United States session in this pair. We can see that Kevin was correct price action punched through the resistance line and headed up to the 1.1400 option maturity. At no time did price action go near the one 1.13 00 or 1.1500 levels, as predicted, and where these were highlighted in blue as being unlikely. And at the time of the New York cut, the exchange rate was 1.1430, just 30 pips away from the favoured red option at 1.1400.
It is suggested by Kevin that traders place the option expiry levels onto their own charts in order to feed this into their own trading methodology. Even if you had taken on the trade based on Kevin’s recommendation early in the European session, you could have made nearly 50 pips as the price rose.
What is more, is that this service is extremely reliable and wear on a regular basis the technical analysis as provided by Kevin is throwing up accurate predictions often with pinpoint accuracy and regularly buy a handful of pips. Which just goes to show how much the market pushes price action to these key fx expiries and where are often larger the combined amount of the maturity, the more likely of price action hitting the FX option maturity at the time of the 10 a.m. New York cut.

Categories
Forex Videos

Forex Analysis! What Next For The EURUSD!


Where next for EURUSD pair?

Thank you for viewing this forex academy educational video.

In this session, we are going to be looking at what has been going on with the euro US dollar pair in terms of what has been driving it to its current levels and where we might expect price action to go from here.


Firstly, we always read our charts from left to right because they tell a story. On this one-hour chart of the euro US dollar, we can see a strong area of support where the price was not able to breach below the 1.1375 level, having already flirted with levels above the 1.1400 key level.
The next significant part in this bull move is at position A which was when the EU leaders agreed the €1.8 trillion budget and recovery package for the eurozone member states, which included debt and grants.
Initially, this was seen as a buy the rumour sell the fact scenario, where price action reached a high hi of 1.1470 on the news that the 27 members had finally reached an agreement.
Price action fell back to the key 1.1400 level before finally moving up to position C before the pair pushed above the key resistance line there. Note how the Bollinger bands opened up to facilitate this push, which was a very aggressive move, taking the pair air up through the key 1.1500 handle without any initial pullback or resistance here, before finding some resistance at position D at around 1.1550. Profit-taking leads to a pullback to position E, which was just above that key 115 handle.


Again, the bull’s push the pair higher in a very aggressive drive up to the next key level 1.1600, before profit-taking pulled the pair lower into a neck formation, and before the secondary spike higher, which could not quite reach 1.1600 level, which was seen as a potential double top. And when the EU Brexit negotiator Mr. Barnier made comments that the potential of a no-deal Brexit was very high, the pair pulled back to position G only to be reversed aggressively at position H due to poorer than expected Initial Jobless claims unemployment numbers from the United States on Thursday the 23rd.
Price action subsequently moved up in another aggressive bid and punched up to the 1.1625 handle before fluctuating at its current levels around the key 116 handle.


The next important phase will be whether price action can find a firm footing above 1.1600. The Euro has certainly got the market sentiment in its favour currently, with Covid still aggressively running rife in the USA and where the EU seems to be coming up with successful stimulus packages for the Eurozone area. A failure at this critical level could see a retest of 1.1550 and lower as the market considers if the pair has simply run out of steam at these multi-month highs.

The only caveat being that all of this stimulus is mostly made up of debt, and this could be an anvil around Europe’s neck if the economy does not recover as expected during 2021.

Categories
Forex Videos

Forex World Faces Another Economic Disaster Part 2!


Has the West got it right regarding the China & Hong Kong National Security Law? Part 2 of 2


Societies are complex and ever-evolving organisms,  and if China is to successfully govern Hong Kong then surely it has a right to implement changes to laws if when it feels the need to do so, after all, other countries do this all the time, and mostly without criticism and especially from China, who is fairly agnostic with regards to the governance of other countries.
While 27 countries in the West have openly criticized China’s new Hong Kong law, 53 other countries have come out in support of the new legislation. This is largely gone unreported.

What’s more, 2.9 million people in Hong Kong signed a petition supporting the new law, some 38% of the population in which case you can comfortably assume some people did not bother, in which case it could be as even as a 50/50 split of the population agreed.
Certainly, investors were happy as the Hong Kong stock market surged 1.7% as the bill was introduced.

One question which came out was that several accusations from media outlets – including Ming Pao, RTHK, ATV, TVB, Now TV, Oriental Daily News, and Apple Daily – that organizers had hired protestors, and that many had been paid between HK$200 ($26, £15) to HK$800 for turning up and protesting.

And while in the United States black lives matter’s protesters were called terrorists by Donald Trump, the protesters who were causing disruption, mayhem, wanton criminal damage and almost financial ruin for some businesses in Hong Kong, were called heroes by the West.

And so the question is, has the West got this wrong, and do they have the right to tell China how to handle its affairs and make threats of sanctions and tariffs without any real foundation that the new security law in Hong Kong is such a bad thing, especially as a high proportion of residents actually support it. Wouldn’t it be more advisable to sit back and watch how the new law is implemented and look at it from the point of view that action should only be taken should there be proven breaches of human rights and miscarriages of justice amounting from the new law? After all, how could anybody, with any common sense, expect that China will change the law, now that it’s actually been implemented?  Is it worth risking an economic fallout with China, especially as we are still in the midst of a global pandemic that is crippling economies around the world?

Perhaps we need to further analyze some more lessons from history and further statistics before we start trying to push China around: –

China’s percentage of the world’s gross domestic product in 1980 was 1%, which is quite staggering when we realize that it had grown to 15% in 2015, and currently in 2020, pre-pandemic, the figure was 18.5%.

If growth rates return as expected, by the end of 2021, the post-pandemic picture for China’s growth path could see it with 30% of world’s GDP between 2030 to 2035 according to economic modeling by Tsinghua University, Beijing. That is twice as much as the United States and almost identical to the United States and Europe combined. And, incidentally, that is the same as the percentage of global GDP China enjoyed in 1820.

Some Might argue that China expanded so incredibly because of reverse engineering and copying other countries’ products and stealing intellectual property rights.  However, China has moved on, and the West has certainly enjoyed buying cheaper products as manufactured in China.  But, China has now become a powerhouse of innovation and is clearly able to hold it so on that front, from cars, white goods, phones, computer systems, software, medicine, communications technology, as produced by Huawei and other Chinese tech firms. They are also leading designers of infrastructure projects, with the best rail system in the world. They own huge banking corporations and leading companies such as Alibaba, JD.com, NetEase; the danger is that China is about to leave the West in its shadow. And all this happened since the Chinese communist party abandoned a large part of its ideology in order to embrace capitalism.

China’s growth is simply disproportionate and while it’s most important relationship is with the USA, it is also highly focused on its relationships with the developing world, where it sees itself as having an affinity and especially with African nations which have enjoyed growth and wealth having sold natural resources to China and been able to benefit from infrastructure projects as designed and provided by China.  Some 65% of Africans have a favorable attitude to China and where some African countries are growing solely on the basis of their relationship with China.

Perhaps another lesson for the West is that in 1970 two thirds of global GDP was with the western world, where 15% of the world’s population lives, and only one third in the developing world where 85% of the population lived.

In 2015, 59% of the world’s GDP was accounted for by the developing world, and only 39% by the developed world. And of course, China has its tentacles in all the far-reaching corners of the developing world.

The West cannot stop China, and if it forces China into a situation where tensions become so bad and trust so failing between both sides, the result could be an economic fallout of unprecedented magnitude.

And while China is leaning towards becoming the biggest economic powerhouse on the planet, we should be working with them and not against them if we want to continue to reap the rewards of economic prosperity.

Further alienation by the West to China by forcing them into a corner over the issue of the Hong Kong security law could cause extremely harmful repercussions, which could see pandemonium in the financial markets should sanctions and tariffs be implemented and all while the world is still reeling from the Covid pandemic.  The timing of all this could not be worse. Long-term prosperity can only be met by stopping the rhetoric and working together under an umbrella of economic and political harmony.

Finally, what will the future hold for Hong Kong as a trading hub? Certainly, there is no imminent risk that the West will abandon the trading opportunities with regard to its important finance center, tourism, and import and exports should there be a full-scale trading crisis with China. The people of Hong Kong are largely seen as victims in the dispute over the new law.

Categories
Forex Videos

The Forex World Faces Another Economic Disaster Part 1!

Has the west got it right regarding the China & Hong Kong National Security Law? Part 1 of 2

Tensions are building between the west and the Chinese government over the recent introduction of China’s National Security Law, but is the west right or wrong on this issue? Threats of tariffs and sanctions are firing in both directions, and some are being implemented while strongly worded threats are being bandied by both sides. To get a clearer picture, perhaps we need to go back in time a little to try and better understand this complex issue, which threatens to further destabilize global trade, where both sides will suffer economically.

Great Britain acquired Hong Kong Island from China in 1842, at the end of the 3-year Opium war, when the so-called Treaty of Nanking was signed. Hong Kong returned to Chinese rule at midnight on July 1, 1997. The ceremony was attended by the then British Prime Minister Tony Blair, Prince Charles of Wales, Chinese President Jiang Zemin, and U.S. Secretary of State Madeleine Albright. The only caveat in the arrangement was that there would be one country and two systems, whereby Hong Kong would retain its own economic and administrative systems.

However cracks began to emerge when the Chinese government attempted to introduce a fugitive offenders amendment bill that would have seen the introduction of an extradition treaty between Hong Kong and the mainland and where offenders from Hong Kong, or those on the run from China, could then be sent to mainland China for processing and prosecution, and if found guilty, there were the implications of jail time being spent on mainland China, thus eroding a fundamental section of the one country two systems arrangement.

There was an outcry by some members of the community in Hong Kong, and immediate objections and protests began there when the proposal for the new bill was presented in 2019 because this was seen as opening up the possibility of Hongkongers to perceived unfair trials and violent treatment in China. The protestors said the new bill would give China a bigger stronghold in the judicial system in Hong Kong, and it could be used to target activists and journalists.

The bill was withdrawn after violent protests in Hong Kong and after an 18-year old was shot in the chest with a live bullet as protesters fought police officers with bricks, petrol bombs, sticks, poles, and anything they could get their hands on.  Buildings were torched and vandalized, residents were terrorized as the violence escalated out of control, people were stabbed, and protestors tried to remain incognito by wearing black masks. The activists set up roadblocks, barricades and had standoffs with the police. Hong Kong had never seen violence on this scale in its modern history. The local economy and stock market suffered losses as a result.

The protesters had demanded an end to the bill, and that the stigma and possible risk of criminalization having been characterized as rioters be withdrawn, they also demanded an amnesty for arrested protesters and an independent inquiry into alleged police brutality, plus the implementation of complete universal suffrage, or the right to vote in political elections. They also demanded the resignation of Carrie Lam as Chief Executive.

Although the bill was withdrawn, China did not relent entirely and has now introduced a new Hong Kong national security law, which came into effect on June 30, 2020, and where the law’s key provisions include that: Crimes of secession, subversion, terrorism, and collusion with foreign forces are punishable by a maximum sentence of life in prison. Beijing will establish a new security office in Hong Kong, with its own law enforcement personnel – neither of which would come under the local authority’s jurisdiction and where some cases could be sent back to mainland China to be tried.

This has largely been met with consternation and criticism by the west where 27 countries have protested against the new bill and where Australia has immediately canceled its extradition treaty with Hong Kong by way of protest and offered what equates to a sanctuary to people who wish to flee Hong Kong and where the British government has said that it will offer U.K. residency to 3 1/2 million Hong Kong nationals with overseas British passports, should they wish to leave Hong Kong. The United States government has come out very strongly against the new law and says there will be consequences for China.

The European Union has also issued a strongly worded complaint to the Chinese government.  And whereby President Xi Jinping has counter issued strongly worded advice to all of those speaking out against the new security law to stay out of its affairs, while suggesting there will be consequences for those countries taking action such as Australia and where these actions are likely to be financial in nature, perhaps such as extra tariffs, sanctions or even a reduction in trade.

The market has begun to sit up and take note of the extraordinary exchanges and threats coming from both sides.  The Australian dollar has come under pressure, and President Trump has said that he has no interest in currently pursuing Phase 2 of the China / U.S. trade deal. The rhetoric has caused spikes and troughs in the U.S. equities market and the U.S. dollar, with implications to counter traded currencies as the fallout between China and its trading counterparts worsens.

Categories
Forex Videos

Fundamental Analysis For Novices! – Wholesale Inventories USA

Fundamental Analysis for Novices Wholesale Inventories, USA


Thank you for joining the fundamental analysis for novices’ educational video.  Today we will be looking at the United States wholesale Inventories.

If this is the first time you have joined our fundamental analysis for novices’ educational videos, we highly recommend that every day you use an economic indicator in order to plan your trading activity around the releases of economic data that is released by all the government’s around the world.  These statistical data releases can have a dramatic effect on volatility within the market, and that is why it is essential that it becomes second nature that you use one on a regular daily basis.

Most brokers offer an Economic Calendar facility, and they typically look something like this.

The key components to an Economic Calendar are obviously the day and the date and the actual time of the event, and please bear in mind that the time may differ from your own location.  The event itself, where typically you will see the nature of the event, such as trade balance, GDP, housing starts, initial jobless claims, bond auctions, interest rate decisions, etc., and the country the release pertains to.

You will also be able to see the impact barometer, which is typically low, medium, and high, where high would be the more likely to see extra volatility after the data release. They will also be a section for the actual data upon its release, and you will typically find a previous value, whether that is weekly, monthly, quarterly, or annually, and a consensus section that will have been put together by leading economists and analysts.

Here we have highlighted the United States wholesale Inventories for May 2020, and according to the time it was due in 58 minutes at the time of writing and where the previous release for April was 1.2% with a consensus of 1.2% and where the market impact value is set to low. Therefore, upon its release, it is unlikely to cause significant market volatility due to the fact that it lags by two months.

Us wholesale Inventories are released each month by the Census Bureau, and it tracks the changes in wholesale sales and inventory levels. The wholesale inventory component is more important because if producers have high inventory levels, this can be seen by the markets as showing slow demand by consumers, and this would have a knock-on effect of causing decreased manufacturing production; this, in turn, will affect jobs and gross domestic product. The sales component does not reflect personal consumption and is therefore not seen as such an important aspect of the data release.

A high inventory number suggests the economy is slowing in the United States and this is negative or bearish for the dollar, where as a low reading is seen as positive or bullish for the US dollar

Categories
Forex Videos

Forex – China & Australia Tensions Build! A Critical Blow For The Economy?


China and Australia tension builds


Let’s take a look at the Australian Dollar USD Dollar price action during the European and US session on Thursday, 9th July.

But just before we do that, Let’s remind ourselves of the brewing spat between Australia and China.

Firstly, the tensions have built because the Chinese have introduced a draconian national Security legislation law for Hong Kong. Therefore, the one country two systems arrangement established by the UK government when it handed over Hong Kong to China in 1997 and which was designed to protect the city from the mainland repressive legal system has now all but been meaningless. This was, in essence, a firewall between China and Hong Kong.

The new law will clamp down on, and I quote, “any conduct that seriously endangers national security,” including separatism, subversion of state power, terrorism, and “activities by foreign and overseas forces” that “interfere” in Hong Kong’s affairs. The extremely vague law allows for the extradition of people who are seen to be breaching the rules to be extradited and tried in mainland China. More worrying, is that the law could apply to anybody who happens to be in Hong Kong even from other countries who openly criticizes China’s feelings in Hong Kong who could then be arrested and extradited to China also. This might, for example, include international journalists.

And so, it is not surprising that the Western world has condemned China’s interference in Hong Kong, which was a culmination of their frustration to handle the riots which started in Hong Kong during 2019 in protest of China’s increasing legal stronghold there.

In joining the international outcry, Australian Prime Minister Scott Morrison said the new law undermined “Hong Kong’s own basic law” and the territory’s current level of autonomy from Beijing.

The Prime Minister said Australia would protect citizens of Hong Kong by offering them residency. Immediately Beijing warned Australia not to offer citizenship to Hong Kong residents.  However, the government of Australia ignored this request.  Australia has also suspended its extradition treaty with Hong Kong.  This also flies in the face of the request from Beijing because it means it will no longer extradite accused individuals from Australia to Hong Kong, or China if they have breached the new security law.

On Thursday, 9th July at position ‘A,’ the Chinese government said there would be percussions for Australia’s interference in their governing of the people of Hong Kong. Price action was around 0.6980 level at the time the news wires picked up the quote from China’s Xi Jinping.

Price action and volatility picks up immediately with downside pressure to the pair, subsequently being reversed, causing a spike to just below the 0.70 key level, before sustained selling for the Australia dollar.

The AUDUSD Has enjoyed a recent upside reversal in price action to the key 0.70 level, due to the fact that Australia has handled the coronavirus very well, with low percentages of people catching the disease and dying from it. Also, now that China is largely back on track in terms of its recovery from the virus, which means that business is heading back to normality between the two nations.

However, with its huge commodities-based export market, it’s biggest single customer is China. And therefore, if China were to impose tariffs or other trade restrictions with Australia, due to the growing crisis, it will be a catastrophe for the recovering Australian economy.

One thing that we can be sure of is that the Chinese government is extremely unlikely to back down over this issue.

The implications are serious for Australia, and their dollar will likely see more downside, especially if China imposes punitive measures on his trading partner.

Categories
Forex Videos

Forex! What’s Driving Cable & Where You Should Be Trading!

What’s Driving Cable?

Welcome to the Forex Academy educational video in this session we will be looking at the British pound and discuss what might be driving it within the realms of the pound vs. the United States dollar also known as Cable.


What is driving Cable? 

After a bullish rally at the end of June, where price action had consolidated due to end of the month, end of quarter rebalancing, the Great British pound found some buying pressure at the beginning of July and where price action in Cable largely consolidated for a few days due to the fact that Britain and the European Union had completed a recent round of trade negotiations, which had fallen largely flat and all come to nothing.

However, at position A, the European Union chief Negotiator Michael Barnier announced he would be having dinner with the UK’s trade negotiator, David Frost, at Number 10 Downing Street. That evening. No doubt, they would be eating fish and chatting about fisheries, which is one of the biggest stalling points between in the UK and the EU you being able to reach an agreement on a future trading deal.

However, the announcement of the meeting gave a lift to the pound, causing Cable to make fresh highs, just below the key 1.26 level at position B.


The morning after the night before induced some negative tones from Barnier who declared there had been no major developments and cable consolidated and pulled back to position C, which was just before the Chancellor of the Exchequer, Rishi Sunak released an emergency budget. This was largely well-received by the market because it will help people retain their jobs as the UK tries to recover from the COVID pandemic, especially the younger generation of the United Kingdom. Job losses would be limited UK Gov offering a further olive branch in the form of £1,000 payments to companies in order to retain staff after the end of the furlough arrangement.

After a strong move above the 1.26 level sentiment shifted to a downbeat United States dollar which began to reverse some of its bad performance across the board on all the major currencies, mostly driven by better than expected US data releases, and which sent Cable back down to position E. Some of this would have been down to profit-taking. However, we see an uptake in the pair again during Friday’s European session to retest the previous high at around 1.2663 level. A double top always makes the markets nervous.

However, around this time, President Donald Trump came out and said that there would likely be no Phase 2 to deal with China. It simply wasn’t on his mind.  This sent a shockwave through the market where US equities initially were sold off and which saw buying pressure on the United States dollar and a pullback in Cable.

The financial markets and especially the forex markets are extremely volatile at the moment and liable to huge swings caused by a myriad of reasons but mostly centered around the fallout from the Covid pandemic, of course. Tensions are building with China as it flexes its muscles over its new security law regarding Hong Kong and which is causing fall out with most of its trading partners. The UK government is about to make a decision with regards to the Chinese technology firm Huawei and whether or not to implement its 5G technology within the UK communications infrastructure.  Declining the use of Huawei technology may be seen by the Chinese government as a further indication that relationships are souring between the two nations.  Any increased tensions could also cause downward pressure on the Pound Sterling.

Categories
Forex Videos

Forex Fundamental Analysis for Novices – Japanese Bank Lending Rate!

Fundamental Analysis for Novices Japanese Bank Lending Rate


Welcome to the fundamental analysis for novices’ educational video.  In this session, we will be looking at the bank Japanese bank lending rate.

You have probably heard the old adage – failing to plan is planning to fail.  Well failing to take note of an Economic Calendar on a regular, daily, basis in order to plan your trading around potential volatile economic data releases is planning to fail at trading.
You should refer to one the day before you plan to trade, and eventually, when you are proficient enough, you will look for opportunities where extra volatility might creep into the market after a particular data release, in order to hop on a post developing trend.  But before you are proficient, you should avoid such volatile times at all costs.

The critical components of any Economic Calendar which are available by most brokers,  is the day and date, the event type, the time of the event, noting that the time of the event might be your local time and not the time of the particular country where the information is being released,  the likely impact that the data will have on the financial markets upon its release, the actual data will be released into a set area of the calendar and it is important that you find out where,  the consensus or forecast of the data, which has been put together by the economists and analysts and where large deviances from this upon release may cause volatility and the previous level of that data for comparison purposes. Remember, we are looking to see whether data is worse, better or the same as the previous release.  Better economic data numbers are positive for that economy, and where you might see the local currency strengthen, worse numbers might mean that the country is not doing so well economically and therefore bad for the country and where you might see the local currency weekend against its counterparts.

As mentioned, we are looking at the bank lending rate for Japan year on year for June, which will be released on Wednesday, July 8th, at 12:50 AM BST.

This particular data is considered as low-impact upon its release by the bank of Japan. It is the value of outstanding loans with Japanese Banks, and it is seen as important within the financial markets because it provides an insight as to whether banks are lending more to businesses. The more money that is lent, the better that is for companies who might be expanding, or buying more raw materials, and perhaps taking on extra staff.


The actual data released is calculated as a percentage and where year on year figure 4 May was 4.8%,  and that the general consensus forecast is for an increase to 7.2%,  and this is what the market will be looking for, a better number than for May and thus an improvement year on year.

Although the data is perceived as being of low impact, this will show whether or not the Japanese economy is faring better from the fallout of the pandemic.  Holistically, this and the rest of the data which is coming out of Japan currently will give an overall picture of the general health of the Japanese economy. A strengthening economy might mean a strengthening currency.  And vice versa,  The only caveat being that quite often, the Japanese Yen is considered to be a safe-haven currency, and it can be bought heavily even when the Japanese economy is not faring very well.

Categories
Forex Videos

Retail Traders Expect a $15,000 Bitcoin Value By 2020 End!


Retail Traders Expect a $15,000 Bitcoin in 2020


A survey conducted by Bitcoin IRA, which is a major crypto custodian, shows that 42% of the platform’s customers think Bitcoin’s price will exceed $15,000 by the end of 2020. On top of that, a staggering 57% of the respondents said that they are buying and holding cryptocurrency as a long-term investment rather than a short-term money grab.

High hopes for Bitcoin

Mike Schrobo, Bitcoin IRA’s head of marketing, said that all respondents were retail investors. He also said that the company firmly believes in the long-term fundamental benefits as well as value propositions crypto provides to the financial system. He claimed that upward price pressures will likely continue as a result of Bitcoin’s adoption and scarcity. He also connected Bitcoin’s future price increase expectancy with money printing all around the world, which happened, and is happening, as a result of the COVID-19 pandemic.

Comprehensive survey

The survey also showed that 53% of respondents are extremely interested in earning some form of interest on their investments, either through lending or investing. Besides cryptocurrencies, the survey showed that these investors are also investing in precious metals, cannabis, and movie companies.

Categories
Forex Videos

Forex Position Sizing – The Gamblers Fallacy!


Position Size II- The Gamblers Fallacy

We are going to commit this video to explain a gross misconception about streaks. The majority of traders tend to think that the chance of the next trade being a winner or a loser depends on the previous events. That means people feel that long streaks have a high probability of ending in the next trade. That belief is wrong and makes many traders think that adapting his position size to the recent performance is the right way to go.


Dependent or independent probability events?
What is a dependent probability event?
A dependent probability event is an event whose probability of outcome depends on the previous results. For example, the likelihood of getting an ace on a deck of cards depends on the previous draws. The initial probability is 4/52, but as the game evolves and more cards are drawn, it will depend on the number of cards left and the number of ace cards drawn. So, if the deck currently has 41 cards and one of the aces had been drawn, the odds of the next draw being an ace is 3/41.


Independent probability events

An independent probability event is an event whose probability of outcome does not depend on the previous results. Coin tosses and dice rolling are among this kind of events. The odds of a fair coin resulting in heads (or tails) is not dependent on the previous results, even when many people believe that a streak of heads has a higher chance of ending with the next move than when the last play was a tail. In fact, the odds of a streak to end are the same in all situations, no matter how long the streak is: 50%.

Trading is a game of chances.


The question is now to decide is if a trading strategy is a dependent or an independent process. That is a very interesting question, and it is difficult to answer with 100% accuracy. The majority of the strategies are independent processes, meaning the next trade outcome is not dependent on the preceding trades. That means it has no memory. Also, to prove a trading system is dependent is very hard to accomplish, and it is left to errors.

Modulating the position size

It would be nice to trade a dependent system. Imagine you know the odds of a win are higher when the previous trade was also a win. You could increase your position after a win, and decrease it after a loss. On a system in which the odds of winning after a win drops, you could do the opposite: reduce your position size after a win and increase it after a loss.
But modulating the position size can be wrong if the trading strategy or system shows independency, and that is what is called the gambler’s fallacy: People tend to believe the odds of the next move change with past events when, in fact, it did not. That makes them adapt their position in the wrong way. They tend to reduce their position size during large winning streaks and increase it during losing streaks, expecting a winner soon. That is the opposite of cutting losses short.

Streaks cause doubt on traders

The majority of traders follow their strategy with little confidence. Since they don’t fully understand the statistical principles behind streaks, they abandon the system after four or five consecutive losses, thinking that the markets have changed or that the system’s testing was not as good as they thought.

Changing the risk

Another dangerous situation may occur on a winning streak, in which the trader may think that his system is infallible, thus increasing the size and risk of the next trades. In his Definitive Guide to Position Sizing, Van K. Tharp explains a curious situation that happened when they were testing their “Position Sizing Game.” The game was set to 60% winners where 55% of the time, they won what they risked, and 5% of the time, they won 10 times their bet. One of their testers had an incredible 23 winning streak, after winning ten times in a row, the tester began to increase the trade size from 10% to 95% bringing $10,000 to 1.45 million in 23 trades. On trade #24, the tester risked $1,000,000 and lost, leaving the trading account balance with just $45,000.

The lesson is evident. Events subject to the laws of chance have winning and losing streaks that defy the common understanding of people.
We should leave a more in-depth analysis of streaks for another video, but suffice to say that the odds of a streak is conditioned by the probability of a single event.

The odds are out there

The ods of an n streak are P ^n that means, P multiplied by itself n times, where P is the probability of the event. For instance, the odds of a four heads streak on a fair coin toss are 0.5×0.5×0.5×0.5 = 0.0625 = 6.25% .
That means the larger the probability of a single event happening, the higher the odds of a large streak.

Translated to the trading world, a system with a high percentage of winners will have short losing streaks and extended winning streaks. The opposite is true. A trading system with a low percentage of winners will suffer larger losing streaks.

Categories
Forex Videos

Fundamental Analysis For Novices – Eurozone Services Sentiment!

,

Fundamental Analysis For Novices – Eurozone Services Sentiment


Welcome to the fundamental analysis for novices educational video.  In this session, we will be looking at the eurozone services sentiment indicator.

It doesn’t matter if you are an occasional trader,  a day trader,  or an institutional size trader,  one aspect of trading which is an absolute must is to regularly refer to an economic indicator such as this one,  in order to plan your trades around the release of countries’ economic data releases.

Many Traders only trade on economic data releases, as soon as the data is released, they will have orders already placed into the market or execute instant trades depending on the statistical data releases as they come out into the market.  This is called trading on fundamental news flow.  It can cause extreme volatility in the market.  This is just one of the reasons why you need to be informed as to when countries release their economic data statistics into the market, and where these are usually released at set times and subject to an embargo.

Most brokers will provide their traders with an economic calendar,  and the critical components are the time of the release, which may not necessarily be in the local time, the type of event, showing the country and the data to be released, including which aspect of the economy it refers to, the date and date. The impact that it will likely have upon its release, which will typically be in three levels – low – medium and high risk. Where high risk is more likely to cause volatility in the market.  A general consensus amongst economists and analysts with regard to what they expect the level to be, and the previous data release.
The economic data release is typically updated weekly, monthly, quarterly, and annually.

Here we can see that our area of interest today is the eurozone services sentiment for June, which is set to be released at 10 am British Summer Time on Monday the 29th of June.  The impact level is set to low, the consensus value is  – 27,  and the actual figure for the previous month of May was – 43.6.


So, what is the eurozone services sentiment indicator? The indicator is calculated on a monthly basis by the European Commission and is seasonally adjusted.
The services sector comprises firms only in-service industries such as: transportation, information, trading and securities, investment, insurance, mortgages, waste management, private healthcare and social assistance, arts, entertainment, etc.

A sample of 18000 companies across the eurozone are surveyed about business conditions for the last three months, and where they are asked three questions:

If business conditions have improved, worsened, or remained the same over the last three months,

If the demand for their services has increased, decreased, or stayed the same over the last three months.

And they are also asked a question about the expected demand for their services in the next three months, and whether they think it is expected to grow, fall or stay at the same level.

Each respondent’s answer is weighted to the relevance of their contribution to their country’s economy and where each country’s response is weighted with regard to their contribution to the Eurozone area.

Let’s just go back to the economic calendar for June, and although the impact of value is set too low, we can see that the previous figure for May was – 43.6, which is incredible, and was obviously this low because of the coronavirus impact.  The consensus value is -27, which is a much greater improvement on the previous month’s figure, and where economists and analysts are predicting a general improvement in this indicator.  Huge deviations from the consensus, especially if the released data is worse than the previous month’s figure, will, in actual fact, cause extreme market volatility.

The reason the indicator is is so important is because it tells the market if conditions are improving in the Eurozone area in which case should the figure come out at -27 as per economists’ expectations or even better this would be considered good news for the eurozone and we might expect the euro to gain in exchange rate values against its counterparts.

Should the figure be worse than -27,  this would show that in actual fact conditions in the service sector across the eurozone are not improving and the businesses in this sector have a pessimistic outlook for the next quarter, and this might have a negative impact on the Euro currency which might then fall in exchange rates against its counterparts.

Bear in mind, that if businesses have an optimistic view, they will be employing more people, perhaps borrowing more money to expand their businesses, it also means that the general population is using more services because they have a more optimistic view of the circumstances in the eurozone area as things improve from the virus conditions.  And so there is a huge knock-on effect with regard to jobs, extra demand for services, and a generalized getting back to normal.

The opposite applies should the respondents have a completely negative out view for the next quarter.

Categories
Forex Videos

Fundamental Analysis For Novices – Money Supply!

Fundamental Analysis For Novices – Money Supply  


Thank you for joining our educational video four fundamental analysis for novices. In this video, we will be looking at Money Supply as an economic indicator.


Successful traders use economic calendars to tell them when governments are due to release statistics regarding the health of that particular nation’s economy.  Such data release information can be found on an economic calendar such as this one.  The majority of brokers provide an economic calendar, and you should refer to it every day in order to avoid trading around times of possible extra market volatility surrounding the release of high impact economic data.

The critical components of an economic calendar are the day, date and time, the actual event, the likely impact of the data, the actual data upon release, the previous data for comparison, and a market consensus of what the likely figure will be.

Here we can see that on Monday, June 29th at 9:30 BST Great Britain will release is M4 money supply data for May and also the year on year update, and where the economic impact is considered to be low.

All countries pay particular attention to money supply, but in the UK, the M4 Money supply data Is released by the Bank of England. Basically, it is an indicator that tells the market how much sterling is in circulation, in both notes, coins as well as money held in bank accounts.

Typically, more money in the system usually reflects lower interest rates and where this might generate more investment while increasing the amount of money in consumers’ bank accounts, which thereby stimulates spending.

Intern businesses will buy more materials to increase production for consumers’ needs, and this increased business activity might also have an effect on the labour market, which might see more employment during such times.

The opposite would apply if money supply falls, which could be a reflection on economic growth rates.
There are various types of money supply levels from M0, M1, M2, M3, and M4. And you might hear terms such as broad money supply, Narrow money, I’m very in degree as to the type and size of a council in which the monies and coins are kept.

Money supply data is published periodically by the country’s Central Bank or the Federal Reserve as in the United States, and where they release the pertaining data on a weekly and monthly basis. Their respective treasuries issue paper and coin currency depending on their requirements, which will change from time to time, depending on economic circumstances.  For example, during the economic crisis brought on by the coronavirus, central banks have issued more money into their economies for banks to hold on reserve in order to extend credit.

M4 is the bank of England’s main measure of money supply and would be a comparison of M3 measures in many other countries. The Bank of England does not set a target for money supply. However, the monetary data does throw lights on the incremental outlook for inflation, and because government’s do usually have targets for inflation M4 money supply does play a significant aspect in the UK economy. At the moment the British government, like most, is extremely active in providing stimulus to shore up the British economy from the effects of the coronavirus, this stimulus, or quantitative easing as it is known, is a policy aimed at boosting money supply.

Although the M4 money supply data will not usually be a market-moving indicator, it is important that traders keep tabs on all governments’ money supply data, and quantitative easing in particular, in order to gauge what each country’s government is doing in this area.

Categories
Forex Daily Topic Forex Videos

Fundamental Analysis For Novices – German IFO Indicators

Fundamental Analysis For Novices – German IFO Indicators 

Thank you for joining our educational video four fundamental analysis for novices. In this video, we will be looking at the German IFO Indicators.


One of the absolute must-dos for traders is to routinely analyze economic data releases from governments around the world. These show the economic health of that particular nation’s economy.  This data can be found on an economic calendar such as this one.  The majority of brokers provide an economic calendar, and you should refer to it every day in order to avoid trading around times of possible extra market volatility surrounding the release of high impact economic data.
The key components of an economic calendar are the day, date and time, the actual event, the likely impact of the data, the actual data upon release, the previous data for comparison, and a market consensus of what the likely figure will be.

INSERT WHAT IS THE GERMAN IFO

This is a German business sentiment index. The data is compiled by the Munich based CESIFO Group. The institute conducts a survey of around 9000 German businesses, including manufacturing, the service sector, trade and construction, and focuses on their assessment of the business situation, including their short-term planning.  Each response is weighted according to the significance of the particular firm’s importance within the German economy. The data is compiled in such a way to reflect outcomes between – 100 and plus 100.  where the lower, the worse for the German economy and vice versa.  The IFO is a leading indicator.

Here we can see that the IFO economic indicator is due for release in 27 minutes and where the data is released in three components: business climate for June, current assessment for June, and Expectations for June.  The impact of value is medium, and that means there is a possibility that the data release can cause volatility in the market upon release.

The consensus values are highlighted and are expected to be slightly higher in each case for the previous releases for May 2020.  This means that economists and market analysts are predicting the IFO releases will be an improvement on the previous month.

This is the technical analysis of a 1-hour time frame for the euro US dollar pair just prior to the release of the IFO number.

This is the actual data release for each of the three components. While all three are better than the previous month’s figures for May, the current assessment component is slightly lower than the consensus value.

After an initial dip lower due to volatility at the time of the release, a slight bid tone returns to the pair. Traders saw a positive figure, which was above the previous release, and this was considered to be good for economic growth, and therefore traders viewed this as bullish for the Euro. A lower reading would have had the opposite effect.

A short while after the markets had time to analyze the data and listen to some negative comments, post-release, from the German finance minister, the pair pushes lower.

It is always advisable when trading around important data releases, such as the German IFO economic indicator, to wait until such time as the market has done its own analysis and then try and get on to a trend once it is started to develop.

Categories
Forex Videos

Forex Fundamental Analysis For Novices – The Chicago Fed National Activity Index


Fundamental Analysis For Novices – The Chicago Fed National Activity Index 


Thank you for joining our educational video four fundamental analysis for novices. In this video, we will be looking at the Chicago Fed national activity index.


If you are new to trading, one of the most important aspects of a daily trading routine is to analyse economic data releases from the government’s around the world, which reflect the health of that particular nation’s economy. This data can be found on an economic calendar such as this one. Most brokers provide an economic calendar, and you should refer to it every day in order to avoid trading around times of possible extra market volatility surrounding the release of high impact economic data.


The most important aspects of the economic calendar are the time and date of the event, the impact value, which is typically low, medium, and high, and where a high impact event is more likely to cause extra volatility upon its release. The actual data, which is updated in the calendar at the time of the release and is usually subject to an embargo. The consensus – where available – which is the anticipated actual release as put together by economists and analysts, and also the previous data which is usually released weekly, monthly, quarterly, or annually.


As we can see, the Chicago fed national activity index for May will be released at 1:30 BST on Monday, June 22nd, and the impact level is medium and where there is no consensus value, but the previous value for April was – 16.74.


Some brokers’ economic calendars will provide a brief description of the event, and here we can see that the Chicago Fed national activity index, also referred to as the CFNAI on some calendars, Is released by the Federal Reserve bank of Chicago. It is a monthly index design to gauge overall economic activity and related inflationary pressure.

In fact, the CFNAI is actually a combination of 85 indicators covering areas such as housing, personal consumption, employment, unemployment, hours worked, income, production, factory orders, and inventories.
The index measures various aspects of overall macroeconomic activity and was designed by Harvard University. The idea being that all the data can be brought together in one single point in order that policymakers can have a more focused aspect for being able to forecast inflation within the US economy.

The index has an average value of 0 and a standard deviation of 1. Traders will be looking for a positive reading which will be considered as bullish and showing that the economy is improving, but if the value is negative, it implies that the US economy is contracting or in recession and is therefore seen as bearish.


Here we can see that from as early as the 1970’s the index has been fairly tightly confined to its zero-axis. However, for the year 2020, we can see a huge spike lower to the current levels of – 16.74 for April. Of course, this can only be associated with the coronavirus pandemic, and the terrible impact it is having on the United States economy.


Traders already realise that the economy is in a bad state and that the figure is going to be well below the zero-axis. And so there will be no shocks or surprises that the figure is going to be bad. They will be looking for how greatly the number will be with regard to its divergence from the release for May.

Therefore, a lesser minus figure will show that the economy may be bouncing back and may have hit the bottom with regard to the impact from the coronavirus pandemic, and this will be seen as positive or bullish for the economy and where you would find potentially an improvement in the exchange rate for the United States dollar against its counterparts and also an uptick in us stocks and indices.
However, should the minus figure be even greater in value you and the previous release, this will show that the worst is not yet over for the US economy, and we might find that the US dollar loses value against its counterparts and stocks and indices may fall as a result.
The higher the divergence from the previous month’s figure in either direction, the greater the risk of market volatility.

Categories
Forex Videos

Forex Expiry Options Review 19-06- 2020! Making Forex Easy!


FX Options Market Combined Volume Expiries. A weekly retrospective review for the financial week ending: 19, 06, 2020


Hello everybody and thank you for joining us for the daily FX Options Market Combined
Volume Expiries review for the trading week ending on Friday, 19th June 2020. Each week we will bring you a video taking a look back at the previous week’s FX option expiries and how they may have attributed to price action leading up to the maturities which happen at 10 a.m. Eastern Time, USA.

If it is your first time with us, the FX currency options market runs in tandem with the spot FX market, but where traders typically place Call and Put trades on the future value of a currency exchange rate and these futures contracts typically run from 1 day to weeks, or even months.


Each morning, from the FA website, our analyst, Kevin O’Sullivan, will bring you details of the notable FX Options Market Combined Volume Expiries, where they have an accumulative value of a minimum of $100M + and where quite often these institutional size expiries can act as a magnet for price action in the Spot FX arena leading up to the New York 10 a.m. cut, as the big institutional players hedge their positions accordingly.

Kevin also plots the expiration levels on to the relevant charts at the various expiry exchange rates and colour codes them in red, which would have a high degree of being reached, or orange which is still possible and where these are said to be in-play. He also labels other maturities in blue and where he deems it unlikely price action will be reached by 10 a.m. New York, and thus they should be considered ‘out of play.’ Kevin also adds some technical analysis to try and establish the likelihood of the option maturities being reached that day. These are known as strikes.
Please bear in mind that Kevin will not have factored in upcoming economic data releases, or policymaker speeches and that technical analysis may change in the hours leading up to the cut.
So let’s look at a few of last week’s option maturities to see if they affected price action. Firstly, there were no notable options for Monday 15th June.


There were two expiries for the Euro US Dollar pair at 1.1260 and 1.1300.
Kevin said that the pair was oversold during the early morning session. And that the likeliest candidate would be a strike for the 1.1260 one.


Here we can see that price action gravitated around the 1.1260 level during the late morning and early US session.


And we can see that the spot price was 1.1277 at the cut. Just 17 pips away.

The second set of option expiries were with the USD Japanese Yen pair. And here is the early market analysis. Kevin suggested the price action would remain at the current levels as the two expiries were close to the spot price, and they were large in value.

And here we can see price action did as expected.


And here we can see the price action at the 10 a.m. cut was 107.38 which was 23 pips
above the 107.15 option.


Tuesday the 16th saw two maturities at 1.1300 and 1.1250 and where the emphasis was placed on the bull trend with the caveat that there was ZEW data coming from Germany and Retail sales from the USA, which came in much stronger than expected and gave the Dollar a lift. As such, the pair’s bull run faded.


The price action left a huge void, and the pair drifted lower, reaching 1.1269 at the cut, just 31 pips lower than the 1.1300 maturity.


There was also a maturity at 107.30 for the USD Japanese yen pair, and the analysis was that the pair was in a tight consolidation phase.


At the time of the cut, the pair hit 10742, just 12 pips away from the maturity and in line with the analysis as provided by Kevin


On Wednesday, there were two option expiries for the USD Japanese yen pair as e can see here, and Kevin suggested that price action was in a continual sideways consolidation period and likely to remain there.


At the time of the cut, the exchange rate was 107.26. Just a single pip away from the maturity at 107.25. remember some brokers will have been quoting 107.25 in which case this is likely to have been a strike.


DolCAD had a maturity at 1.3500 on Wednesday.


Price action maintained the downward pressure but eventually broke out of the wedge to the
upside and hit 1.3563 at the cut.


Also, on Wednesday, there was a maturity for the EUR GBP pair. Kevin’s analysis suggested

that the pair was overbought and likely to pull back to the 0.8925 option maturity.


Here we can see that price action did indeed pull lower. A nice trade had you gotten in and sold the pair in the morning. Price fell to within 13 pips of the maturity and remained in a downward trend well into the European and US session.


However, here we can see that the exchange rate at the cut was 0.8946, just 20 pips higher.


Turning our attention to Thursday, we have three option expiries for the USD Japanese Yen pair. And this is Kevin’s analysis at around 8 a.m. BST, where he calls all three as out of play and suggests price action will conform to the support becoming resistance theory.


Let’s fast forward, and we can see price action did exactly what was expected, it followed the support becoming resistance pattern, and all three options remained out of play.


And here, we can see that the exchange rate was 106.76 at the cut.

Still, with Thursday, there were three options with EURO USD, and Kevin’s early analysis was that price would likely come for a retest of the 1.1200 level if the 1.1250 could be breached. If not, the two red options would remain in play.


Fast forward a few hours, and we can see that 1.1250 was breached, and that price action did test the 1.12 level.


Before the exchange rate hit 1.1212 at the time of the cut.

Please remember, Kevin’s technical analysis is based on exchange rates, which may be several hours earlier in the day and may not reflect price action at the time of the maturities.
We suggest you get into the habit of visiting the FA website each morning just after 8 a.m. BST and take the levels and plot them onto your own trading charts and incorporate the information into your own trading methodology in order to use the information to your advantage.
Remember, the higher the amount, the larger the gravitational pull towards the exchange rate maturity at 10:00 a.m. Eastern time.
For a detailed explanation of FX options and how they affect price action in the spot forex market, please follow the link to our educational video.

Categories
Forex Videos

Forex Position Size! The most crucial factor in trading!

Position Size: The most crucial factor in trading


Bob is an average guy that has seen the Forex markets as a way to get rich quickly. He has seen lots of accounts on copy-trading sites jumping from $1,000 to $1 million in less than one year and dreams about doing the same with his, but he lost it all in less than a month. Indeed it might be possible to raise an account from $1,000 to $1,000,000 in 12 months, but the odds of achieving that feat are low because the risk of bankruptcy is too high. Most people think they are smart but are mostly focused on forecasting the market. It is now natural to have the skills for position sizing decisions.

Even high intelligence does not help. Ralph Vince directed an experiment on position sizing utilizing forty PhDs. They were initially given $10,000 in a computer game with 100 bets having a 60% chance of winning each bet. The rules were that they would win or lose the amount they bet. The game had a clear edge for the players, but only 2 PhDs end up making money. The other 38 PhDs ended with less than the initial $10,000. The main reason for this result was that almost all the Ph.D. players risked too much money on each bet. The other interesting fact is that even when the game was profitable, almost nobody made money.
This result is what is typically found in the Forex markets. People start with a tiny account and want to obtain even double their initial funds every month. As a consequence, people apply extremely large position sizes that get their account wiped out at the first market turn against them.


Let’s say you have $4,000 in your account and risk $1,000 on each trade. A losing streak of four trades will wipe your account. Losing streaks are common in trading, and four losing positions in a row is a very common event. Even 10 to 20 consecutive losses are possible in some trading systems, that are quite profitable using appropriate position sizing, but deadly when overtrading.

This experiment shows that position sizing is the component of a trading system that allows the trader to optimize the profits. That means, from zero to one, there is an optimal fraction of the trading capital, which, when risked on each trade, will optimize the results of a trading strategy.


Of course, that optimal fraction may result in a max drawdown much higher than psychologically accepted by the trader. Thus, a limitation on the trade size should be set by this parameter.
The best description of what a proper position sizing strategy should do was written by Curtis Faith in his book Way of the Turtle: “the art of keeping your risk of ruin at acceptable levels while maximizing your profit potential.” If we combine profits and drawdowns into the concept of “trading objectives,” then, Position Sizing is the art of achieving the trading objectives.
Finally, the key goal any trader should aim at is to find a system with a positive edge and then trade it using position sizing levels that allow him to achieve his trading objectives.
In the following videos, we will explore several position sizing methodologies that will help forex traders optimize this crucial part of their trading profession.

Categories
Forex Signals Forex Videos

Free Forex Signals App! – Forex Academy’s FA Signals App Now Available For Android & IOS

Welcome to our Forex Academy Signals app!


It is a pleasure to announce the FA signals app! Available in iOS and Android, the FA Signals app is a terrific complement to our Forex Academy Signals service, that started on March 20 and which has currently accumulated a total of 3,319 pips and 68.53% winning accuracy.

The FA Signals app will allow our users to get timely signal notifications for them to profit from our pro approach to trading. In this article, we will explain the symbols and working of the app so that you can benefit from it.

The app was devised as a notification tool; therefore, it is quite simple. But we wanted to pack as much information as possible in it, so we created specific icons to compress the information and make it available at a glance.

In the figure below, we can see the main layout of the FA Signals app. We can see a series of icons on the left column that explain the type and direction of the trades. The top of the app shows the legend:

Spot Buy: Buy at the current price
Spot Sell: Sell at the current price
Pending BL: Pending order, Buy Limit
Pending SL: Pending order, Sell Limit
Pending BS: Pending order, Buy Stop
Pending SS: Pending order, Sell Stop

We see also that the app has two tabs: Primary Info and More Info. In the primary Info tab, we have packed the needed information to make the trade:

Assets: The Forex Pair that is the subject of the trade
Entry: Entry price. This value can be the spot price at which the entry has been taken, or, in Pending orders, the limit or stop level at which the order should be placed.
Stop: The stop-loss level
Target: The Take-profit level
Pips: the current pip count of the live and closed trades. In a green rectangle, the pips are gains, in a red one, losses.

The More info tab shows the following information:
Assets: The Forex Pair that is the subject of the trade
Exit Price: The price at which the trade was closed or blank in the case of live signals
Exit Date: The date and time of the close
Method: This is a link to our article explaining the trade setup. We recommend our traders to look at the articles because not only is it a practical lesson on trading, but we also give detailed information on the risk and reward figures of every trade. Position size is critical to succeeding in the Forex markets; thus, it is an integral part of our trade reports.

R/R: The reward/risk ratio of the trade.

Finally, at the top of the page, we present our current total stats: Pips:3,319.99, the pip balance of our trades since the beginning. Gainers: 69.53% the percent gainers since the beginning.

How does this work?

You will receive notifications on new signals, modifications of a live signal, and the close of the signal. The closing will occur by reaching the target, by manual closing, or if the price hits the stop loss. If you follow the instructions, you would have set the stop and target levels at the beginning of the trade; thus, you need only to take care of the modifications and manual closing of a signal.
When you receive a notification and click on it, the app will open and show the referred signal highlighted, so it is more easily identified. By touching the highlighted signal, you acknowledge the notification and will be de-highlighted. Therefore, we recommend that you do that after doing your mods.

We wish you successful trading, helped by our integral signal service. But, please take this as an opportunity to learn and be self-sufficient. Our philosophy is not to give signals, but to help you achieve your own by learning through practical examples, which are supported by our vast educational resources.

Categories
Forex Videos

Forex Fundamental Analysis For Novices – Policymaker Speeches!

Fundamental Analysis For Novices – Policymaker Speeches


Thank you for joining our educational video section for fundamental analysis for novices. In this video, we are going to be looking at policymaker speeches.

Most brokers provide an Economic Calendar. And traders use them to keep them advised of various types of economic data releases because these can significantly affect market volatility depending on the level of impact they will have upon their release. If you are not already using one, we strongly recommend that you start doing so. You can plan your trading day around them And try to avoid opening trades close to the release of such data until you are a seasoned trader who understands just how such information can affect price action.


Most economic calendars are similar. However, the types of information which are key to traders are the release time, the type of events – in this case, we are looking at speeches -, the day and date, the likely impact that any speech might have on the market. In terms of general economic data releases, you will find that the actual data is released at the time signified on the calendar and where typically you might find a consensus by economic specialists as to what that data might be, and also the previous data release and where this can be compared to the actual data release, and the traders will gauge what effect that might have on an economy and of course thereafter the related currency exchange rates and stock market indices.


On the economic calendar for Monday the 22nd of June, we have highlighted four speeches by various policymakers. Typically these are announced ahead of time, and you will find them listed in an Economic Calendar. Some policymakers comment on the market unexpectedly, and a good example of that would be President Trump, who often tweets potentially market-moving comments pertaining to economic relevance, mostly in the United States.
So let’s look at some examples.


AT midnight BST, Philip Lowe, who replaced Glenn Stephen as governor of Australia Central Bank, will be making a speech regarding the health of the Australian economy, and this has a high impact value attached to its importance.
Therefore, Traders will be paying particular notice to his comments because he has the power to influence interest rates and also monetary stimulus within the Australian economy, which is particularly significant at the moment due to the impact of the coronavirus pandemic.
Negative sentiments from Mr. Lowe will be seen as bearish for the Australian economy. This could affect their stock market and also lower the value of the Australian dollar against other counterparts in the forex market.

It would be advisable not to trade the Australian dollar during this event.


3:15 BST again on Monday the 22nd of June, the vice president of the European Central Bank, Luis de Guindos, a Spanish politician, will be making a speech regarding the eurozone economy.
The impact level of the speech is set as medium, and any unexpected comments, especially negative ones, could cause market volatility, especially with the euro, including the EURO USD and cross currency pairs.
During a recent speech from Madrid during May this year, Mr de Guindos Stated that the eurozone had left the worst of the pandemic behind in terms of economic impact from the coronavirus pandemic, although he mentioned that it was likely that the eurozone would take two years to recover. This type of comment is both dovish and hawkish. Hawkish because he says the worst is over, and dovish because he says there are still two years of recovery ahead of the eurozone economy. He finished his speech by saying that the eurozone economy is facing a deep recession due to the coronavirus pandemic, and therefore analysts and Traders will be looking at this forthcoming speech to ascertain if he is Leaning more one way than the other.
Dovish comments would be seen as bearish for the euro currency and might cause a lowering of the euro exchange rates against its counterparts.
It is highly unlikely that his comments will be hawkish and therefore have a bullish effect on the market after such recent comments, as mentioned above.


At 4 p.m. BST, again on Monday the 22nd of June, the Bank of Canada governor Tiff Macklem, will be making a speech about economic policy in Canada and where this has been given an impact value of high.

The Canadian dollar is highly sensitive to policymaker speeches and where the currency can be particularly volatile during economic data releases and speeches. Again traders and analysts and economists will be looking for policymaker decisions from the governor that offer strong potential of keeping the country’s recovery on track from the fall out of the pandemic.

They will also be looking for hints from the governor regarding future interest rate decisions and stimulus packages to keep Canada from going further into recession.
As mentioned previously, the Canadian dollar is highly susceptible to volatility during these types of economic events and is strongly recommended that you do not trade during such times of release. Wait until trends are developing post data release, and try and get on those rather than trying to second guess which direction the currency will go at the actual time of economic release.

Categories
Forex Videos

The Golden Rules of Trading III


The Golden Rules of Trading III – Trading like a Business

The majority of new participants approach Forex trading with no idea in mind but to trade and win. They did not make a plan, and their objectives aren’t clear as well. They enter the market with one dream: getting rich, starting with a $1,000 or less trading account. Usually, they did not make a plan, don’t know the needed skills, their strengths, and weaknesses, and think that trading is just predicting the market. The outcome of this mindset is failure and frustration. To succeed, trading must be considered as a business.
In this video, we are going to talk about the importance of treating trading like a business.


1.- Initial Assessment
You need to create an initial assessment document. On it, you’ll need to define the following:
Your current beliefs about yourself and the market. Your vision about you, your life, and your goals.
List your strengths ( what are you good at- programming, recognizing patterns, math skills…)
List the resources you will need
Determine your weaknesses and how to overcome them.


2.- Establish your objectives
Set your monthly profits goal, then divide it by 20 to determine your daily profits goal. Finally, establish how many market signals you take on average using your trading plan and decide on your average profit per trade.
Define your tolerance for drawdowns. Will you allow 10%, 26%, 40%, or higher max drawdown? Max drawdown is a critical value you should know for you to set your dollar risk per trade. That was dealt with already, but let’s remember the key fact: Max drawdown, together with the percent losers of your system will help you set a likely max losing streak. For example, a well known trend-following system with only 35% winners will sometimes show up to 20 losers in a row. If a trader using this system establishes its max drawdown to 30%, the dollar risk per trade must be set to 30%/20, which is 1.5% risk. Determine how much you will pay yourself and what percentage of your profits will be reinvested to grow your trading account.


3.- Operating rules and contingency plans:
Establish the maximum number of consecutive trades you’re going to take
Set the maximum daily dollar losses you will accept before stopping to trade for the day
Set the maximum dollar gains you are going to take before halting your day-to-day operations. That way, you keep your trading rational, avoiding losses due to your child’s side take control.
Define also your weekly and monthly loss sizes. In the case these amounts are reached, you should switch to paper trades until the next week or month.
Establish a trading record with the relevant information needed to measure and analyze your performance and the system’s improvement/adaptation to the current market conditions.
Define the reviewing period for the performance analysis of your systems. Use statistical methods to analyze them.

4.- Markets, Timeframes, diversification
Define the best timeframe for your needs and time availability. Please beware that shorter timeframes are more costly because the costs of trading (commissions, spreads, and slippage) do not change, but the trading ranges shrink, and so do your profits.
Define your basket of pairs to trade. Criteria for the list should include liquidity, volatility, and trendiness. Avoid illiquid markets or excessive volatility.
Ensure diversification to lower your overall risk. For instance, trading only major pairs will be sensitive to the dollar movements; thus, a sharp dollar move against you will affect all your trades at the same time. In this case, make sure you have 50% of your positions long the dollar and 50% short the dollar.
Know the big picture of all the pairs on your basket. We should remember that Fundamental Analysis is the driver of the underlying trend, and that surprising figures will trigger price shocks.

5.- A basket of Systems
Make sure your systems have an edge and that the average Reward/risk ratio is greater than one.
System diversification: Use at least two different and facing systems. One of them might be a trend-following system, while the second system fades the trend. That will help when there are no trends, and the pair is ranging. Sometimes one will lose, and the other one will win. If both systems are profitable, the long-term result will be the sum of their performance, but the downside is limited, as one of them will tame the other system’s losses.
Use the position sizing as explained above, ensuring that your maximum risk per trade is limited to fit your preferences for drawdown.
Continue developing new ideas and strategies, doing paper trading on them if the backtests are worthwhile.

Categories
Forex Videos

Bitcoin Is Not Even In The Top 10 Crypto’s!


Chinese Officials Say Bitcoin isn’t even in the Top10 Cryptocurrencies

China’s Center of Information and Industry Development, CCID for short, revealed that its 18th CCID Global Public Chain Technology Evaluation Index. This index has ranked 37 well-known global cryptocurrencies using technical specifications.
Local media Chainnews posted the CCID publications showing that Bitcoin was placed in the 12th place, scoring 106.2 points, which it earned based on its basic technology, applicability, performance, features, safety, creativity, as well as decentralization.
EOS leads the ranking with a score of 156.1 points, closely followed by TRON with 138.43 points and Ether with 136.4 points.
Bitcoin’s rank is improving

An interesting thing to note is that Bitcoin scored even lower in the previous ranking. Last year’s evaluation placed Bitcoin at 17th place, with a score of only 43 points in terms of innovation and 19.9 for applicability.

Tron leads the rankings despite tension with the Chinese authorities

Justin Sun, Tron’s founder and CEO, warned that the Chinese authorities raised suspicions over Tron’s legal status. A 2019 incident involving Tron led to the Chinese police surrounding the project’s office in Beijing.
Even with all this, Tron is still ranked second by the Chinese entity.

Categories
Forex Videos

Fundamental Analysis For Novices – China Fixed Asset Investments


Fundamental Analysis For Novices – China Fixed Asset Investments

Welcome to the educational video on Fundamental Analysis For Novices. In this session, we will be looking at some Chinese economic data, including Fixed Asset Investment, NBS Press Conference, Industrial Production, and Retail Sales.


If you are not already doing so, we advise you to check a reliable economic calendar each day to be forewarned about economic data releases from countries that might affect your trades.


Economic data releases impact the market in various degrees, and you should pay particular attention to the date of the event, the time, and most importantly, the likely impact it will have, which usually is in 3 degrees, low, medium, and high.


Reliable calendars will provide you with the previous data release in each category, the consensus, or the expected data release. This will have been compiled by analysts and economists who have come to an average consensus value and the actual figure, which is updated with the data upon release.
Each country releases similar titled economic data into the market, mostly on an embargoed basis, in order not to give traders an advantage and to avoid market manipulation.


China typically releases economic data releases during the Asian session. It is released by the National Bureau of Statistics of China. And due to the complex nature of the coronavirus pandemic and due to the fact that China was the first country to be severely affected by the disease and the fact that it is the first country to have significantly recovered from the disease, data coming out of the country is of greater market focus at the current time, than perhaps previously.
It is also important to remind ourselves that there is a brewing amount of this quiet between the United States and China and other countries and China who feel that China should have been more proactive when the disease initially broke out.


In the first instance, we can see that there is data due for release for fixed asset investments, year-to-date, year on year, and for the month of May, in monetary value.
Fixed asset purchases is a comprehensive index in the area of construction. These are also known as tangible assets, including machinery, land, buildings, installations, vehicles, and technology. The figure itself shows the scale of pace with regard to overall economic growth within urban investments. In general, a higher number he seemed as bullish for China while a lower number is considered negative. As the whole world looks towards China with regard to how it improves its economic position post epidemic, outside countries who trade with China view this as a significant release.


The data release is followed by a National Bureau of Statistics press conference where a prepared text is usually offered to the media and which will also shed light on the economic situation within China.

Also simultaneously released into the market is industrial production year on year on year for May. Again this has significant importance because it shows the volume of production within Chinese Industries, including factories and manufacturing. This data can also have an effect on inflation and, in which case it is closely monitored by the People’s Bank of China who will adjust monetary Policy if inflation falls outside of its target range.
Generally, high industrial production growth is positive, both in sentiment terms and economic terms for the country, and is seen as bullish. If the reading is low or negative, it means that China is still struggling to improve its economy post epidemic.


And finally, also simultaneously released into the market is retail sales year on year for May. This will also be viewed by all markets as important because it shows the recovery status for China and whether or not the general public is feeling confident enough to go out and purchase goods where they are available in outlets which have been allowed to reopen or have the confidence to post epidemic.
The figure measures the total receipts for retail consumer goods for household purchases, and in general, a high reading is positive because it shows the economy returning to normal, while a low reading is seen as negative, meaning that the Chinese economy is still struggling.
Therefore during the Asian session, you might expect that stock markets rally if the news is good, and you might find that stock markets fall if the news is bad. Commodity countries such as Australia and New Zealand who export heavily into China, might find that their local currencies improve against the dollar if the numbers are high, is because it means China is improving its economy and likely to be importing goods from these countries. And the opposite applies if the data from China is poor.

Categories
Forex Videos

Fundamental Analysis For Novices – Consumer Confidence


Fundamental Analysis For Novices – Consumer Confidence

Thank you for joining the fundamental analysis for novices’ educational video. This time we will be reviewing consumer confidence.
Hopefully, you will be reviewing all the fundamental analysis for novices videos in the series is comprehensive, and we fully recommend that you work through each educational video.


As a trader, it is imperative that you regularly refer to an economic calendar, such as this one, which is provided by most brokers. Consider this to be your Bible. Use it as a tool to plan your trades, and most importantly, use it as a facility to tell you when to trade and, more importantly, not to trade, especially at times of release of very important and potentially highly volatile producing economic data releases.


The key information that you need to take particular attention to is the time of the event, the economic event itself, the day and date, the impact level, which typically comes as low, medium, and high, the actual economic data release as listed at the time of the event, which is usually subject to an Embargo, and before this pay particular attention to the general consensus of what the actual figure might be. This is put together by leading economists and market analysis. Also, pay attention to the previous release of this data.

So what is Consumer Confidence?

The consumer confidence index, or CCI, is an economic barometer that tells the story via the consumer. This measure is how optimistic or pessimistic consumers are regarding their financial circumstances. If consumers are optimistic, they tend to spend more money, and if they are pessimistic, they tend to save more. If consumers aren’t spending, economies are failing, and if consumers are spending, it usually follows that economies are doing well.
The CCI is conducted by Nielson Inc. as a survey of over 5000 households within the United States, as an example, and is administered by the US conference board on the last Tuesday of every month. Households are asked five questions, 1: their view of the current business conditions, 2: their view of current employees conditions, 3: their expectations regarding business conditions in the next six months, 4: their expectations regarding employment conditions for the next six months and 5: their expectations regarding total family income for the next six months.
Financial markets look towards this barometer with regard to the varying degrees of the fluctuations up and down.


On Wednesday the 10th of June at 1:30 AM BST, Australia released its consumer confidence data for the month of June, which was considered to be a medium level of impact and which came out at 6.3%. No consensus was offered, and the previous figure was 16.4%. Straight away, we noticed that the actual figure is lower than the previous figure, and we will explore this further on in the video.
In Australia, the CCI is produced by the Melbourne Institute and published by the Westpac Banking Group. Countries vary slightly with regard to the questions asked of households. In Australia for example 1200

Australian adults asked their opinions on the household financial situation currently, compared to 12 months ago, their expected household financial situation for the coming year, their anticipated economic conditions over the coming year, their anticipated economic conditions over the next five years, and their buying conditions for major household items.
However, essentially the results are treated almost identically on a country-by-country basis.


Upon the release of the data, traders look for the actual figure, and in this case, it comes in lower than the previous, which suggests that consumer confidence is lower during the month of June and below the figure released for May.
Potentially this means consumers are spending less, and this is therefore bad for the Australian economy, and we might expect a weakening of the Australian dollar against its counterparts. This is referred to as bearish.
Had the figure been higher than 16.4% for May, the reverse would have been true and would have shown the economy growing, with consumers more confident and potentially spending more money, and this would have been good for the Australian dollar against its counterparts. This is referred to as bullish.

Categories
Forex Videos

Fundamental Analysis For Novices – Average Hourly Earnings

Fundamental Analysis For Novices – Average Hourly Earnings

Thank you for joining the fundamental analysis for novices’ educational video. This time we will be looking at.

Hopefully, you will be reviewing all the fundamental analysis for novices videos in this series of educational videos.


Professional traders regularly refer to an economic calendar, such as this one, which is provided by most brokers. Use it as a tool to plan your trades, and most importantly, use it as a facility to tell you when not to trade via expected volatile periods in the market, which potentially follow high impact or high importance regarded data releases.


The key information that you need to take particular attention to is the time of the event, the economic event itself, the day and date, the impact level, which typically comes as low, medium, and high, the actual economic data release as listed at the time of the event, which is usually subject to an embargo, and before this, pay particular attention to the general consensus of what the actual figure might be. This is put together by leading economists and market analysis. Also, pay attention to the previous release of this data.


In this video, we are looking at average hourly earnings, year on year, for May 2020. This data is typically more important within the United States and has a maximum impact value. It is always released on the first Friday of each month, along with the non-farm payrolls.
This particular session of releases he’s very widely anticipated by the markets because it gives a clear picture of the economic conditions for the United States, which is one of the biggest economies in the world.
The data is released by the US Bureau of Labor Statistics. It reflects labour cost inflation and throws light on the conditions of the Labour market. The board of the Federal Reserve uses this as a leading indicator when setting interest rates, along with the unemployment figures.


Here we can see that the average hourly earnings figure for May came in at 6.7%, which was below the consensus value of 8.5% and below the previous figure of 8% for April. The deviation is also shown as -0.98%.
A higher reading would have been positive or bullish for the USD, while this reading is negative or bearish for the USD.

This is why it is always imperative to wait until the market has analysed all of the data, including average hourly earnings before you jump in and start trading purely on the non-farm payrolls figure only.

Tread cautiously and wait for a trend to begin and then join that in either direction. When trading this data always expect the unexpected because the market can become extremely volatile post data release.

Categories
Forex Videos

Fundamental Analysis For Novices – House Price Index

Fundamental Analysis For Novices – House Price Index

Welcome to the educational video for Fundamental Analysis For Novices. In this session, we will be looking at the House Price Index.


If you are not already doing so, we strongly recommend that you regularly check a reliable economic calendar each day to be forewarned about economic data releases from countries that might affect your open or planned trades.


Economic data releases impact the market in various degrees, and you should pay particular attention to the date of the event, the time, and most importantly, the likely impact it will have, which usually is in 3 degrees, low, medium, and high.


Most calendars will also provide you with the previous data release in each category, the consensus, or the expected data release as analysed by economists and analysts who have come to an average consensus value, and the actual figure which is updated with the data upon release.

Each country releases similar titled economic data into the market, mostly on an embargoed basis, in order not to give traders an advantage and to avoid market manipulation.

Today we are looking at House Price Index!


Here we can see there are two releases due for the 15th June 2020; one has been collated by Rightmove property website for the UK where the numbers are a sample only and are reflected of the period for May and are devised on a month by month basis and the second which is updated on year by year basis. and the other
The impact level for this type of indicator is typically low and does not usually cause market volatility.


So what is the House Price Index, and how do you trade it?

The house price index or HPI, as it is also known, measures the price change in the value of residential houses. The data is typically released into the market on a month-by-month basis or updated on an annual basis.


The data, in all cases, is calculated as a percentage figure from a specific start date. In most cases, the statistical method to calculate price swings is called a hedonic regression model.

In the UK, the HPI is released by the Office for National Statistics. In the United States, the HPI is published by The US Federal Housing Finance Agency, where it measures those family homes that have been sold or refinanced in 363 metropolises. Not to be confused with the FNC Residential price index as published by FNC Incorporated, which records value in non-distressed home sales and is widely used by the mortgage sector as a tool to gauge price movements.

The basic rule of thumb is that house prices that are falling in value are reflective of an economy that is struggling and whereby perhaps unemployment is high, wages are low, and the growth of an economy is slowing, stalled, or in recession. This would have a negative impact on the currency of a particular country. Therefore you might find the value of a local currency falling in value in terms of exchange

rates.
On the flip side, a higher than expected HPI number might be reflective of an improving economy, in which case it is better for the local currency, and you might find it increasing in value on exchange rates.
Always compare the actual HPI release number to the consensus value and the previous release and remember that markets do not like shocks. Deviations from the consensus and previous releases can cause market instability.

Categories
Forex Videos

Decentralised Exchanges Are the Future! Where are you putting your money!


Decentralized Exchanges Are the Future


Decentralized exchange tokens’ year-to-date returns are more than five times higher than that of their centralized counterparts, according to the latest report on Decentralized Finance by the cryptocurrency research platform Messari.

Decentralized exchange tokens have increased 241% on average in 2020, while centralized exchange tokens managed to gain only 44%. The report said that Kyber’s token was leading the charge with a massive increase of more than 420%.

Decentralized vs. Centralized exchanges

Spot volumes on Decentralized Exchanges have increased from $5 million all the way to $25 million, therefore increasing the DEX’s share of overall trading volume to 0.5%, doubling its share before 2020. While they are still quite insignificant when compared with centralized exchanges, decentralized exchanges are growing at a much faster rate than centralized exchanges are. After all, decentralized exchanges are the only type of exchange that does not stray away from the initial goal of cryptocurrencies.

The main advantage of DEXs

While the volumes of top centralized exchanges are still unmatched, there is one simple advantage do DEXs, which is that they don’t rely on the existence of a centralized entity, which could prove to be a more scalable solution, both economically and in terms of user trust.

Categories
Forex Videos

The Golden Rules Of Trading Part 2! Becoming A Full Time Trader…

The Golden Rules of Trading -II


In part I of the Golden Rules of trading, we have developed the rules to accomplish the well-known rule of “cut your losses short and let your profits run.” In part II, we will discuss the next rule.

5.- Understand your trading strategy or system in terms of average, standard deviation, and Drawdown.

Any system or strategy produces a stream of results. These results can be expressed in terms of Multiples of a standard measure of risk, R. The denominator of the Reward/risk ratio. By applying statistical computations to these results, we will be able to obtain its average and standard deviation.

The Average

The average, when obtained from R-based results, is the mathematical expectation (E), and it will tell the expected gain (on average) for every trade in terms of R.
For example, if your E is 0.25, it tells you that your system delivers an average of 0.25 cents on every dollar risked. If your risk is $100 on each trade, your system will produce an average of $25 on every trade. Thus, if your system gives you six signals daily, 120 signals monthly, you will know that your monthly results will be $3,000 on average. But this result was made using $100 risk on all trades. If you were able to raise the risk to $200, you would double the results to $6,000 monthly. Thus, knowing the expectancy E of your strategy is key to define your profit objectives as a trader.

Variability of Results:

The Standard Deviation

The standard deviation (SD) is the other side of the knowledge. It tells you how much your results vary. It tells the risk side of your system. A small standard deviation tells you that the results do not vary much. A large figure will tell you that your results can be substantially different.

Let’s suppose a trader has a system with 0.25R E, but the SD is 4. After 30 trades, the expected gain will be 7.5R, but since it has a huge variability, that trader will have less than 50 percent probability of being profitable.


Drawdown

Drawdown is a metric that will tell the trader how much of its trading capital is risked in, long term. Drawdown is related to position sizing, but if we create risk-based statistics, it can be normalized.
To compute an approximation to the max Drawdown, we need just one value: the average loss, which, as said, is normalized to R.
Drawdown is closely related to losing streaks; thus, an approximation to it is to compute max losing streaks. We can define a max losing streak for a trading system as streak with a probability of occurrence of no more than one percent. That will catch 99% of all streaks.
The probability if a repeated event is an individual probability multiplied by itself n times, being n the number of the repetitions.

For example, the probability of obtaining two tails on a coin toss (50% chance each) is 0.5×0.5 = 25%. The probability of getting four tails is 0.5×0.5×0.5×0.5 = 6.2%.
In a 50% chance game, a streak of six repeated events is 1.56%, and the probability of seven repeated events is 0.78%. If this was a trading system, I’d set my max losing streak to seven to ensure it will cover over 99% of my trading situations.
That means I would need to plan my position sizing for a 7-streak event.
That will cover 7xR Drawdown.

Position size

How is this related to Position size? A max drawdown figure is a key decision for a trader. How much of your capital are you willing to lose before quitting? The answer is directly linked to the ideal position size.
Let’s assume Angie is not willing to lose more than ten percent of her capital, while Bob is willing to accept 50 percent. And let’s assume both are using the same 50% winner system with 1,000 USD in his trading account.
For Angie 7R = 10%, then her risk per trade should be 10%/7 = 1.43% of her account balance.
For Bob 7R = 50%, thus his risk per trade will be 50%/7 = 7.14% of his account balance.
We see that this will define the results, as well. The same system, when using different position sizes, will deliver quite different results.
If the system gives 120R monthly, on a trading account balance of $1,000, Angie will get about $1,714 while Bob will get $8,571.

Now we understand the importance of knowing our system and its parameters. This knowledge will provide us with the needed information to make important decisions and plan our trading objectives.

Categories
Forex Videos

The Golden Rules Of Trading Part 1! Becoming A Full Time Trader…

The Golden Rules of Trading -I

In this series of videos, we will deal with two subjects not much appreciated, less understood, and less valued topics: Evaluating the quality of a trading strategy, and position sizing strategy. We will also discuss the relation between these two important topics.


The Golden Rules of Trading -I

Van K Tharp, in his “Definitive Guide to Position Sizing Second Edition,” states the ten rules of trading. In this article, we will discuss the first four rules, as these should be the basis to succeed in the trading profession, especially when working in a leveraged environment such as in Forex.

1.- Never open a position in any market if you don’t know your dollar risk.

By dollar risk, we mean the dollar amount a trader would lose if the trade goes against him and the stop-loss gets hit. Thus, with this, we assume ALL TRADES will have a stop-loss level. That is mandatory in a leveraged environment.
In Forex, the dollar risk is easily computed with the following formula:

Dollar risk = (Pip distance from entry to stop-loss) * Pip-Lot-value * Position size in lots.

As an example, let’s assume we are going to trade the EURSD, and we have 55 pip distance from entry to stop, and our position size is 15 mini lots. We know that the pip-lot-value = $10, and that 15 mini lots are equal to 0.15 lots. Thus:

Dollar risk = 55 * 10 * 0.15 = $82.5

Knowing the risk of a trade should be vital to any trader.

2.- Define your profit in terms of your risk.

That seems a silly rule, but in fact, it is essential because it helps a trader think in terms of reward/risk ratios. It is easier to know if the trade is a good business or a bad one. A good business is a trade in which the potential loss is smaller than the potential gain. A businessman does not sell below cost. A trader must not accept a trade on which the profit is lower than the cost.

3.- Limit your losses to 1R or less.

This rule is a consequence of the first two. Traders must respect the settings of the trade. Moving or disregarding the stops shows a lack of discipline and also creates random effects in the trading system. This, in turn, makes the system random. That means it is wrong since a random system tends to have zero mean profitability.

4.- make sure your profits, on average, are higher than your risk.

As stated in point two, it is good business to have profits larger than the assumed risk. Also, thinking about trades with over 2xRisk is a mind state that helps traders to keep their portfolio healthy. Imagine a trader with 10XRisk trades. He can be wrong nine out of ten times and still be break-even. That is the power of the is philosophy. You cannot control the market, but you can control the Reward/risk ratio of your trades.


These four rules can be summarized as the famous golden rule of trading:
Cut your losses short and let your profits run. But even though this is a well-known adage in the trading world, traders usually forget it. That was well studied by Daniel Kahneman and his colleague Dr. Amos Tversky. They called it “prospect theory.” They showed that the natural bias of people under uncertainty conditions is just the opposite: cut gains short and let losses grow.

Categories
Forex Videos

Fundamental Analysis For Novices – Fed Interest Rate Decision

FOMCFundamental Analysis For Novices – Fed Interest Rate Decision

Thank you for joining the fundamental analysis for novices educational video. In this session, we are going to be talking about the federal reserve interest rate decision.

So what is it, and how can you trade it?


Professional Traders keep a careful eye on their economic calendars, and you should do the same, paying particular attention to the daily activity of economic release information, especially as you plan your day or week ahead, with regard to trading.

The critical information is the time of release, the name of the event, the impact that it is likely to have upon release into the marketplace, the previous data release, and the consensus of professional economists and analysts as to what the figure is likely to be.


The US fed interest rate decision, as seen here, is released to the market at 7 PM BST, and is subject to an embargo. The impact of status is a full red bar on this particular calendar, and in fact, this economic release is one of the most important data releases, and especially at this time during the coronavirus pandemic.
The Federal Open Market Committee or FOMC is the branch of the Federal Reserve Board that has the power to set monetary policy and alter interest rates for the United States.
The FOMC comprises of the board of governors and includes seven members and five federal reserve bank presidents.
The board of governors of the Federal Reserve, which is also known as the Central Bank for the United States, meet at intervals of 5 to 8-weeks, and this is where they decide to set their interest rates, where this will have effects on loans and advances to commercial banks in the United States, especially if they are changed.


The interest rate decision is simultaneously released with the FOMC’s economic projections, monthly budget statement, and, more importantly, the fed’s monetary policy statement.


Thirty minutes later, there is an FOMC press conference to explain the rationale behind the decisions for any changes interest rate changes, or not, as the case may be, and also to explain the monthly monetary policy.
The conference lasts for around an hour and includes a prepared statement, and then the floor is opened to press questions that are unscripted and often leads to market volatility as traders and analysts try to decipher future policy decisions and directions.

How to trade fed interest rate decisions?

Firstly, pay particular attention to the consensus. Deviations from the consensus can cause market volatility.

As a rule of thumb, When the Fed increases interest rates, it typically tends to attract investors to buy dollars because they get a better yield from the higher interest rate. This is typically better for the economy.
On the other hand, a rate cut is seen as a sign of a poor economy with inflationary headaches for the FOMC, and in turn, investors tend to move out of Dollars, and this weakens the local currency.
Always trade this economic data released with extreme caution because it will typically cause extreme volatility, and sometimes this may not occur until the FOMC press conference and especially when the board member is answering questions from the press. Wait for a trend to develop and pick an opportunity to join it.

Categories
Forex Videos

Forex! We Are In The Eye Of The Financial Storm!


Are we in the eye of a financial storm?


Are We are in the midst of the most turbulent market conditions we have seen since the financial market crash of 2008.
Although the world is nervously tiptoeing out of the clutches of the coronavirus pandemic, there is still no known cure for the disease and as governments around the world ease the lock-down which has become the norm for many of us since March this year the virus Is still rife amongst us in our communities.


But on the 5th of June, when the non-farm payrolls were released at 1:30 British Summer Time, and where the market was expecting an unemployment figure in the USA of 20%, as warned by the Federal Reserve bank committee, and in fact, the number was better than expected at just above 13%, the Dow Jones industrial index rose 1000 points, almost instantly. One of the sharpest increases in the shortest amount of time that it has ever seen.


If we go back to the 23rd of March, just a few short weeks ago, when the Dow Jones index crashed to just above 18,000, where 3.3 million people filed for unemployment under the lock-down measures. At the time, 31,000 Americans had been diagnosed with Covid-19, and 400 had died.
Now fast forward to where there are almost 2 million confirmed cases of Covid-19 with more than 111,000 deaths, and vastly more unemployment and yet the Dow Jones’ rise to current levels in which case the rise in US equities has been quite staggering when you take into consideration that the American industrial machine has been ground to a halt since all this time, with mass lay-offs in unemployment – 5% GDP, many people still not able to return to work, companies such as hertz filing for bankruptcy, with the Airlines in the United States in a quagmire situation, how on earth can we be seeing one of the biggest bull runs in history United States stock markets and indeed others around the world?

Many financial analysts and economists all over the world are asking the same question. In a recent survey of 150 chief financial officers from major companies across the United States, the majority said they had no confidence in the so-called v-shaped recovery for the United States economy, which has been predicted by many from the Federal Reserve.
Insert D. So, what exactly is driving stock markets higher?

On a typical bull run such as we are seen with the Dow Jones, you would typically expect strong fundamental information to be driving the market such as high rate of employment, strong gross domestic product, stable inflation, strong GDP across the globe which is essential for all countries to grow, other fertile conditions including strong leadership and stable domestic issues. In fact, in January, the United States had all of this in abundance It had just signed phase 1 of a massive trade deal with China, it had the best employment records in history, strong gross domestic product, and a thriving economy. All of these conditions helped the Dow Jones to rise above 29,000, its highest point in history.
And yet here we are, with massive unemployment, a huge dent in the gross domestic product, companies filing for bankruptcy, weak leadership, rioting on the streets because of racially aggravated police brutality, relations between the United States and China at an all-time low, and with the United States

threatening contingency action against China because of the damage that the virus has caused the US economy and where this is laid blame by the US directly at China’s door.
And so where fundamentals have gone out of the window, and where earnings to share price ratios are vastly overinflated, the American stock markets can only be driven by fear of missing out by huge hedge funds and financial institutions, and where they believe there will indeed be a sharp v-shaped recovery and that the United States will quickly return to financial health which enjoyed just a few short months ago. Indeed most of them have simply jumped on the bull run bandwagon for no other reason than to milk it for all it’s worth.

But back in the real world, many analysts believe that a bubble is looming and that we are, in fact, in the eye of a financial storm the likes of which will be far greater than the 2008 financial crash.
And here is the reason why, unlike the 2008 crash, people cannot just return to work as if nothing happened, well nit without repercussions, the virus is still as virulent as ever and has only been contained due to social distancing, and where that social distancing is relaxed, and in fact has to be relaxed if people are to return to work in factories, aviation, entertainment industry including restaurants bars and clubs, banks and financial institutions, and almost every walk of life, in which case there is a danger that a second wave will occur.
This is a huge cloud over the United States economy, coupled with the fact that there will be a huge debt burden for the government and companies and even the normal person on the street to face in the months and years to come. The mighty industrial machine that is America, where there is no cure for this virus at the moment, cannot simply shrug its shoulders and say everything is ok and back to normal we go. Expect shocks ahead, because this situation is not over yet, as much as we all want it to be.

Categories
Forex Videos

Forex Options Market review 05-06-2020 – Making Consistent Profits


FX Options Market Combined Volume Expiries. A weekly retrospective review for the financial week ending: 05, 06, 2020

Hello everybody and thank you for joining us for the daily FX Options Market Combined
Volume Expiries review for the trading week ending on Friday 05th June 2020. Each week we will bring you a video taking a look back at the previous week’s FX option expiries and how they may have attributed to price action leading up to the maturities which happen at 10 AM Eastern Time, USA.

If it is your first time with us, the FX currency options market runs in tandem with the spot FX market, but where traders typically place Call and Put trades on the future value of a currency exchange rate and these futures contracts typically run from 1 day to weeks, or even months.


From the FA website, our analyst, Kevin O’Sullivan, will bring you details of the notable FX Options Market Combined Volume Expiries, where they have an accumulative value of a minimum of $100M + and where quite often these institutional size expiries can act as a magnet for price action in the Spot FX arena leading up to the New York 10 AM cut, as the big institutional players hedge their positions accordingly.
Kevin also plots the expiration levels on to the relevant charts at the various expiry exchange rates and colour codes them in red, which would have a high degree of being reached, or orange which is still possible and where these are said to be in-play. He also labels other maturities in blue and where he deems it unlikely price action will be reached by 10 AM New York, and thus they should be considered ‘out of play.’ Kevin also adds some technical analysis to try and establish the likelihood of the option maturities being reached that day. These are known as strikes.
Please bear in mind that Kevin will not have factored in upcoming economic data releases, or policymaker speeches and that technical analysis may change in the hours leading up to the cut.
So let’s look at a few of last week’s option maturities to see if they affected price action.


On Monday, the 1st June Kevin’s early morning analysis suggested the euro USD pair was overbought and had the potential for a pullback to the 1.1100 maturity at the 10 AM new york cut.


In this picture, we can see the same pair where the exchange rate was 1.1127 at the cut. You will, however, note that the price action had previously gravitated to 1.1100 before moving higher by just 27 pips at the maturity.
Tuesday was light on the options maturity calendar, and so let’s move straight into Wednesday.


We have the US dollar Japanese yen pair with Kevin’s early analysis suggesting price would

move higher to the resistance line before falling lower to one of the two maturities at 108.70 or 108.50.


Here we can see a later slide of the pair which ran exactly as predicted and where the exchange rate was ranging between the two red maturities.

Here we can see that the price hit 108.66 at the 10 AM cut. Just a few pips in-between the two.

Still, on Wednesday, we had a slew of options between 1.1175 and 1.1220, and price action remained concentrated around these levels.


Price hit 1.1215 at the 10 AM cut, which was an official strike.


Again on Wednesday, we had a maturity at 1.2560 for cable. Kevin’s early technical analysis here where he suggested the price was capped and due for a pullback.


As you can see here, price action a few hours later confirmed the analysis with the exchange rate hitting 1.2566 at the cut. Just six pips away from the maturity.


On Thursday, Kevin’s early analysis of the EUR-USD pair was that it was oversold on the one hour chart and that there could be a great deal of volatility after the Eurozone interest rate decision and US jobs data.


Indeed we see that volatility was born out in this chart at just before the time of the maturity.


Price hit 1.1268 at the time of the cut, where the exchange rate hit 1.1268, just 23 pips above the 1.1245 maturity. This might suggest option maturities play a part in even the most volatile trading sessions. Because the EUR-USD pair was at multi-month highs, we can estimate that most of the options were calls, where all traders would have been in the money at the cut.


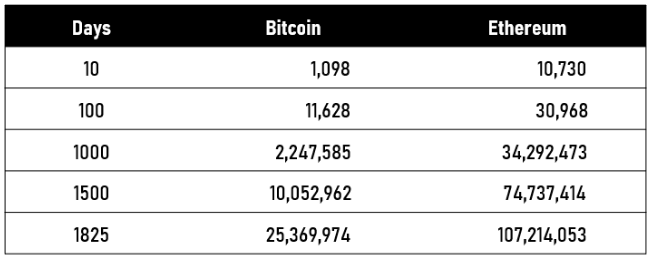
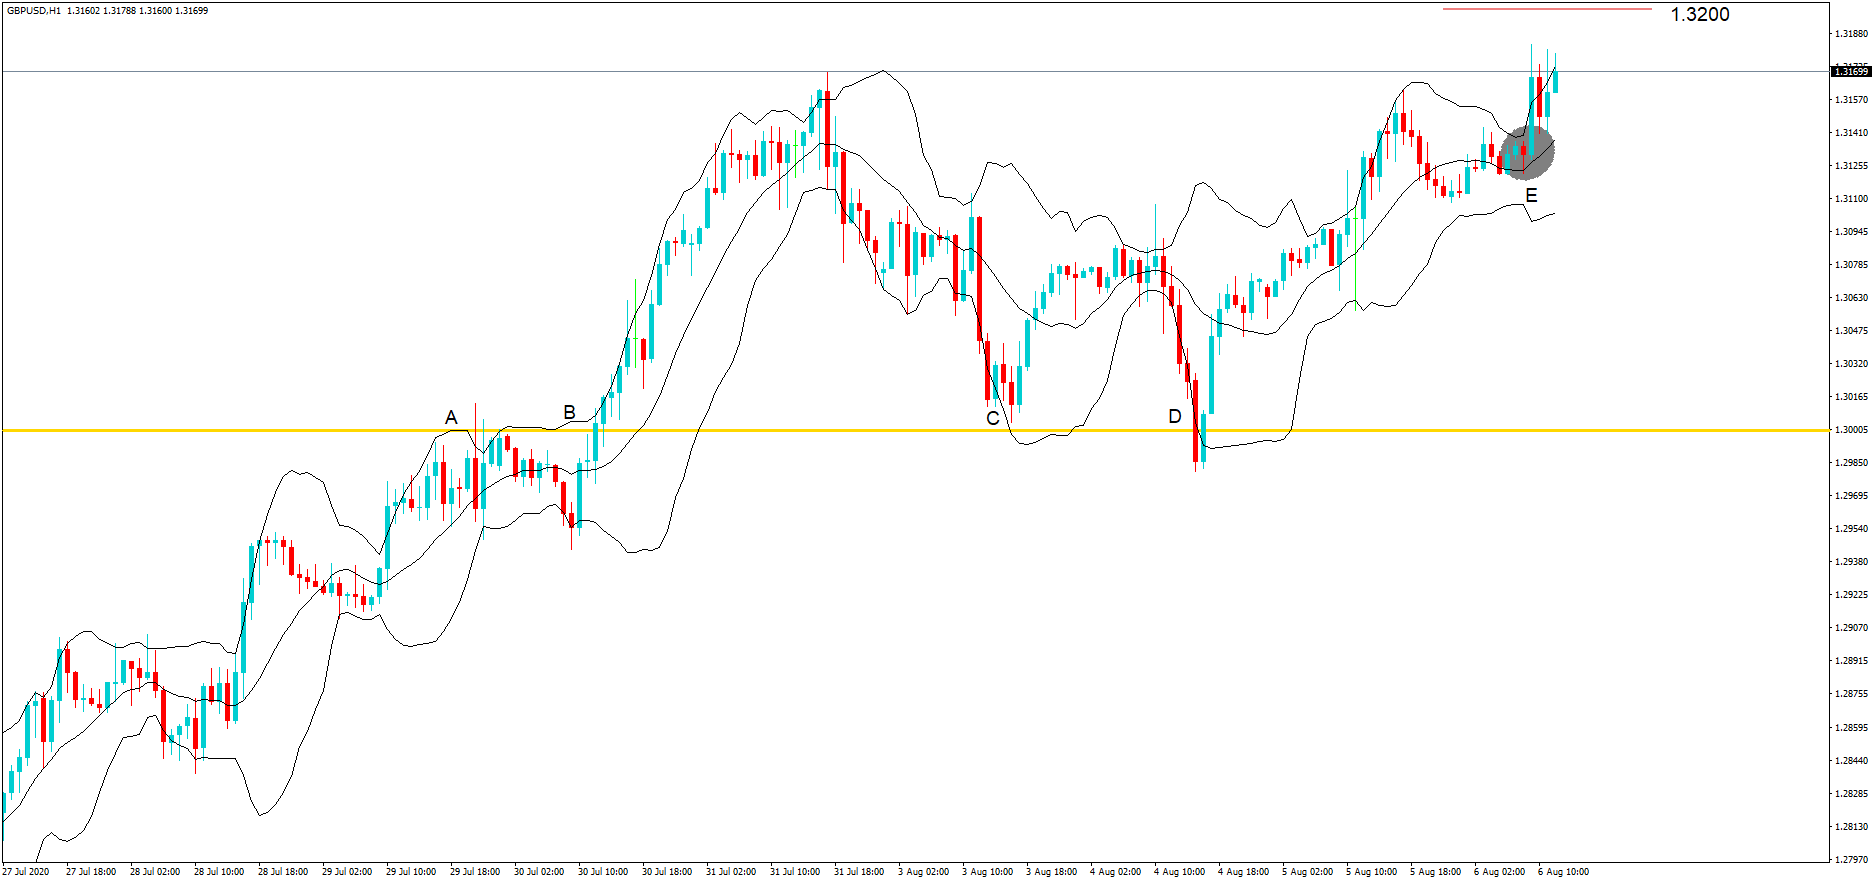
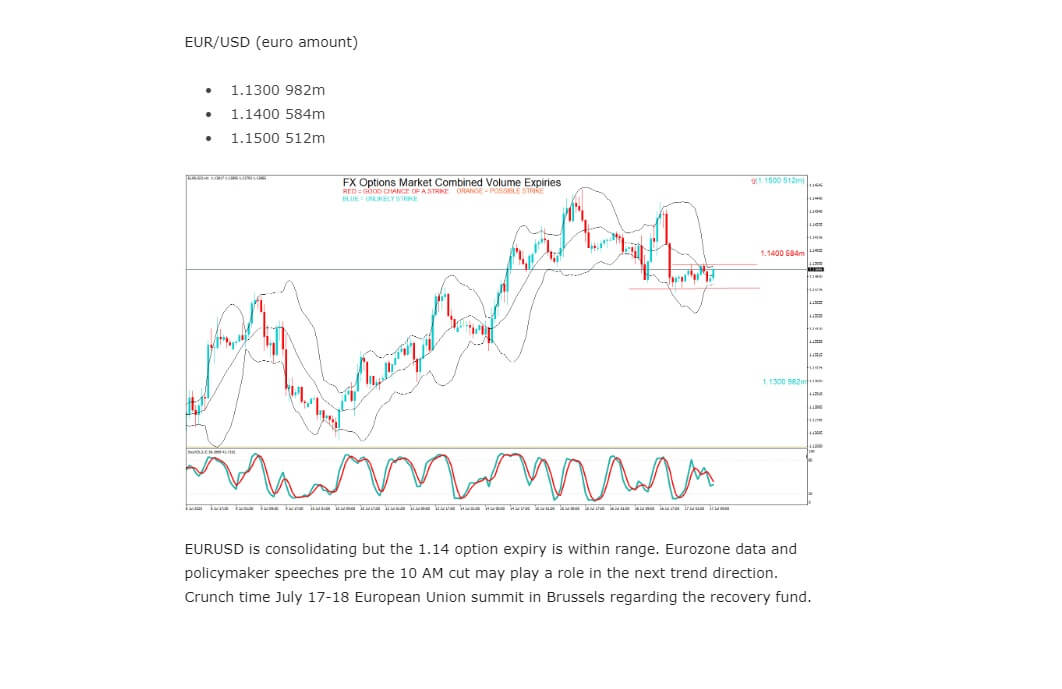
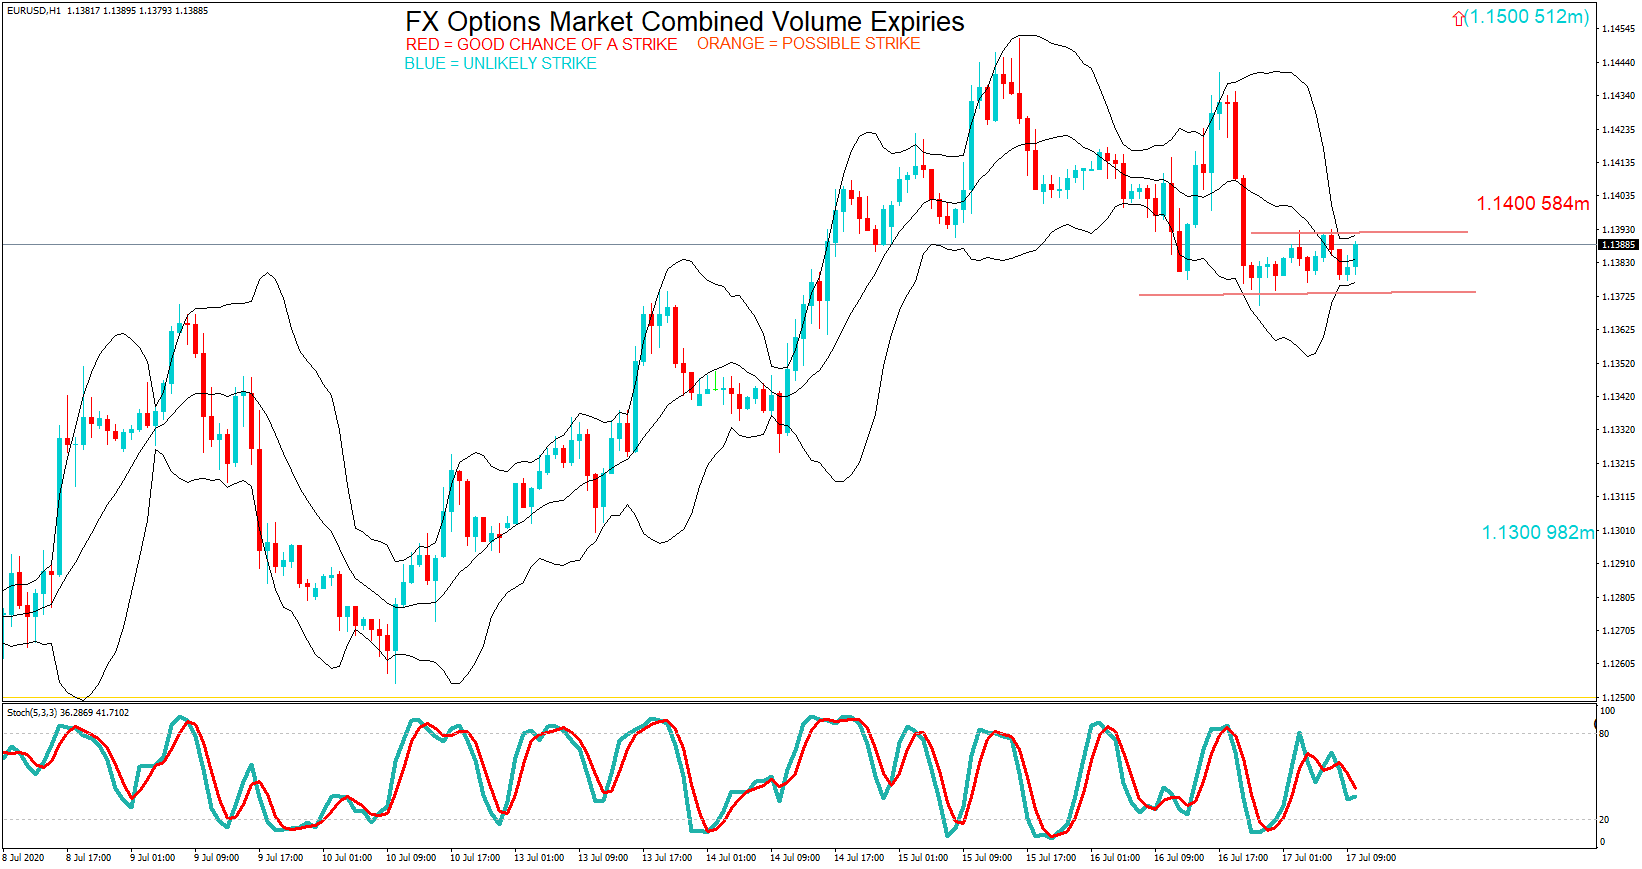
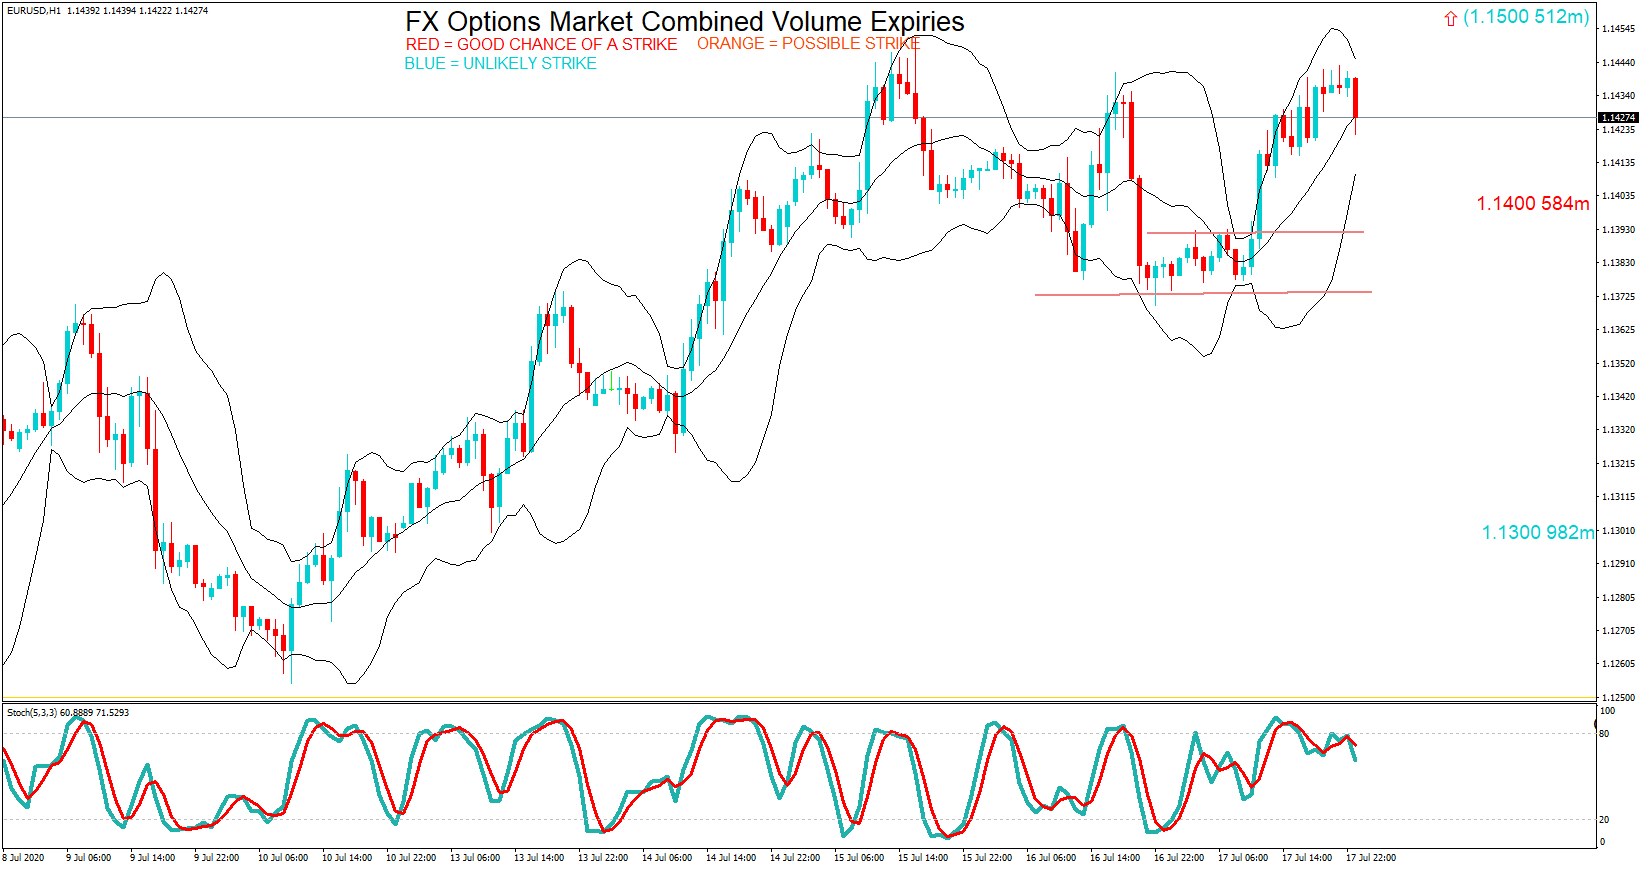
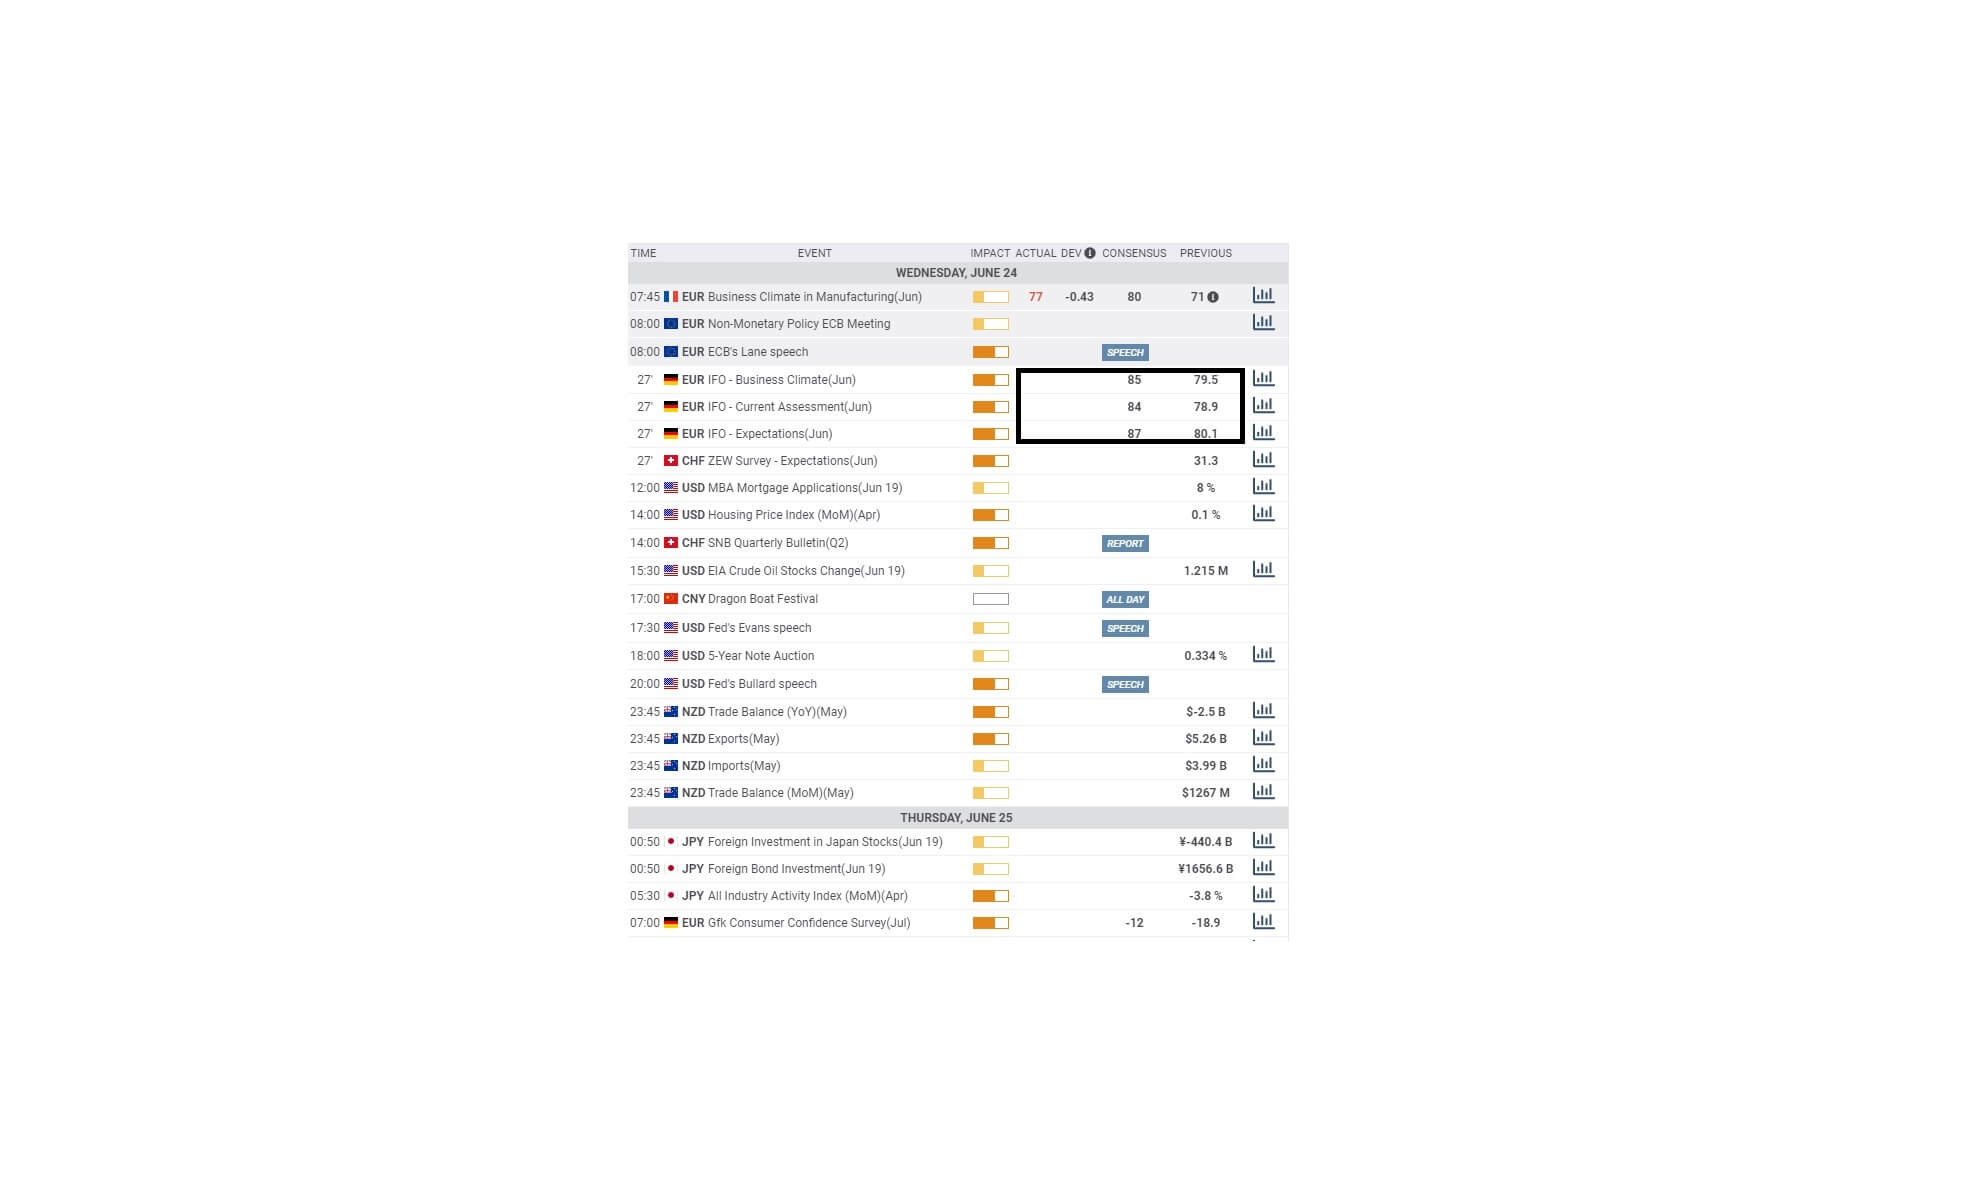
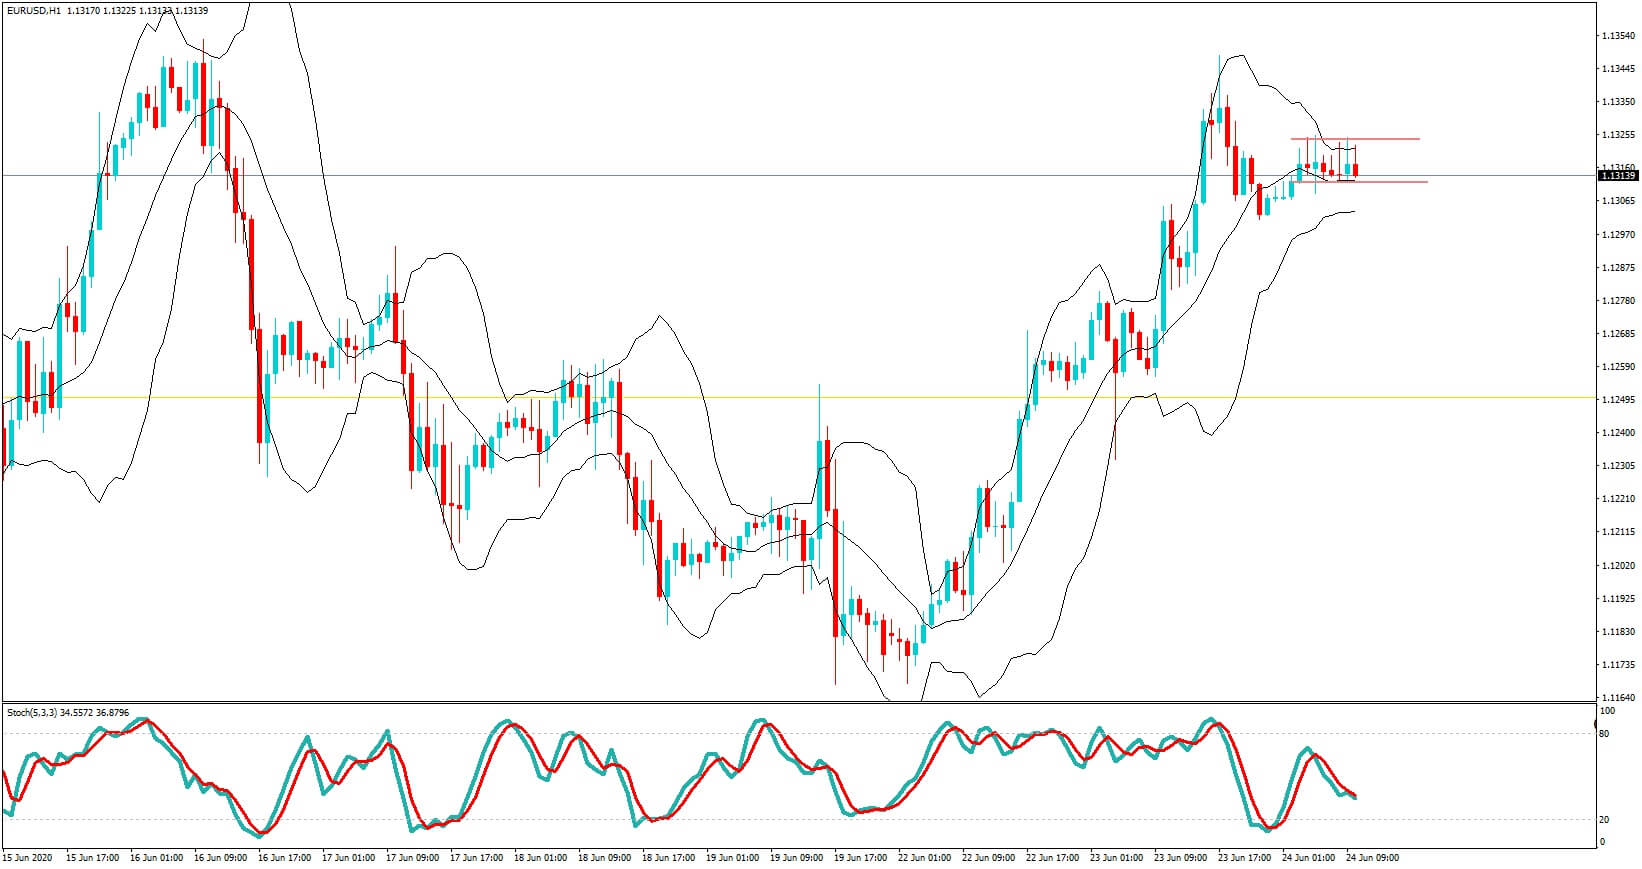
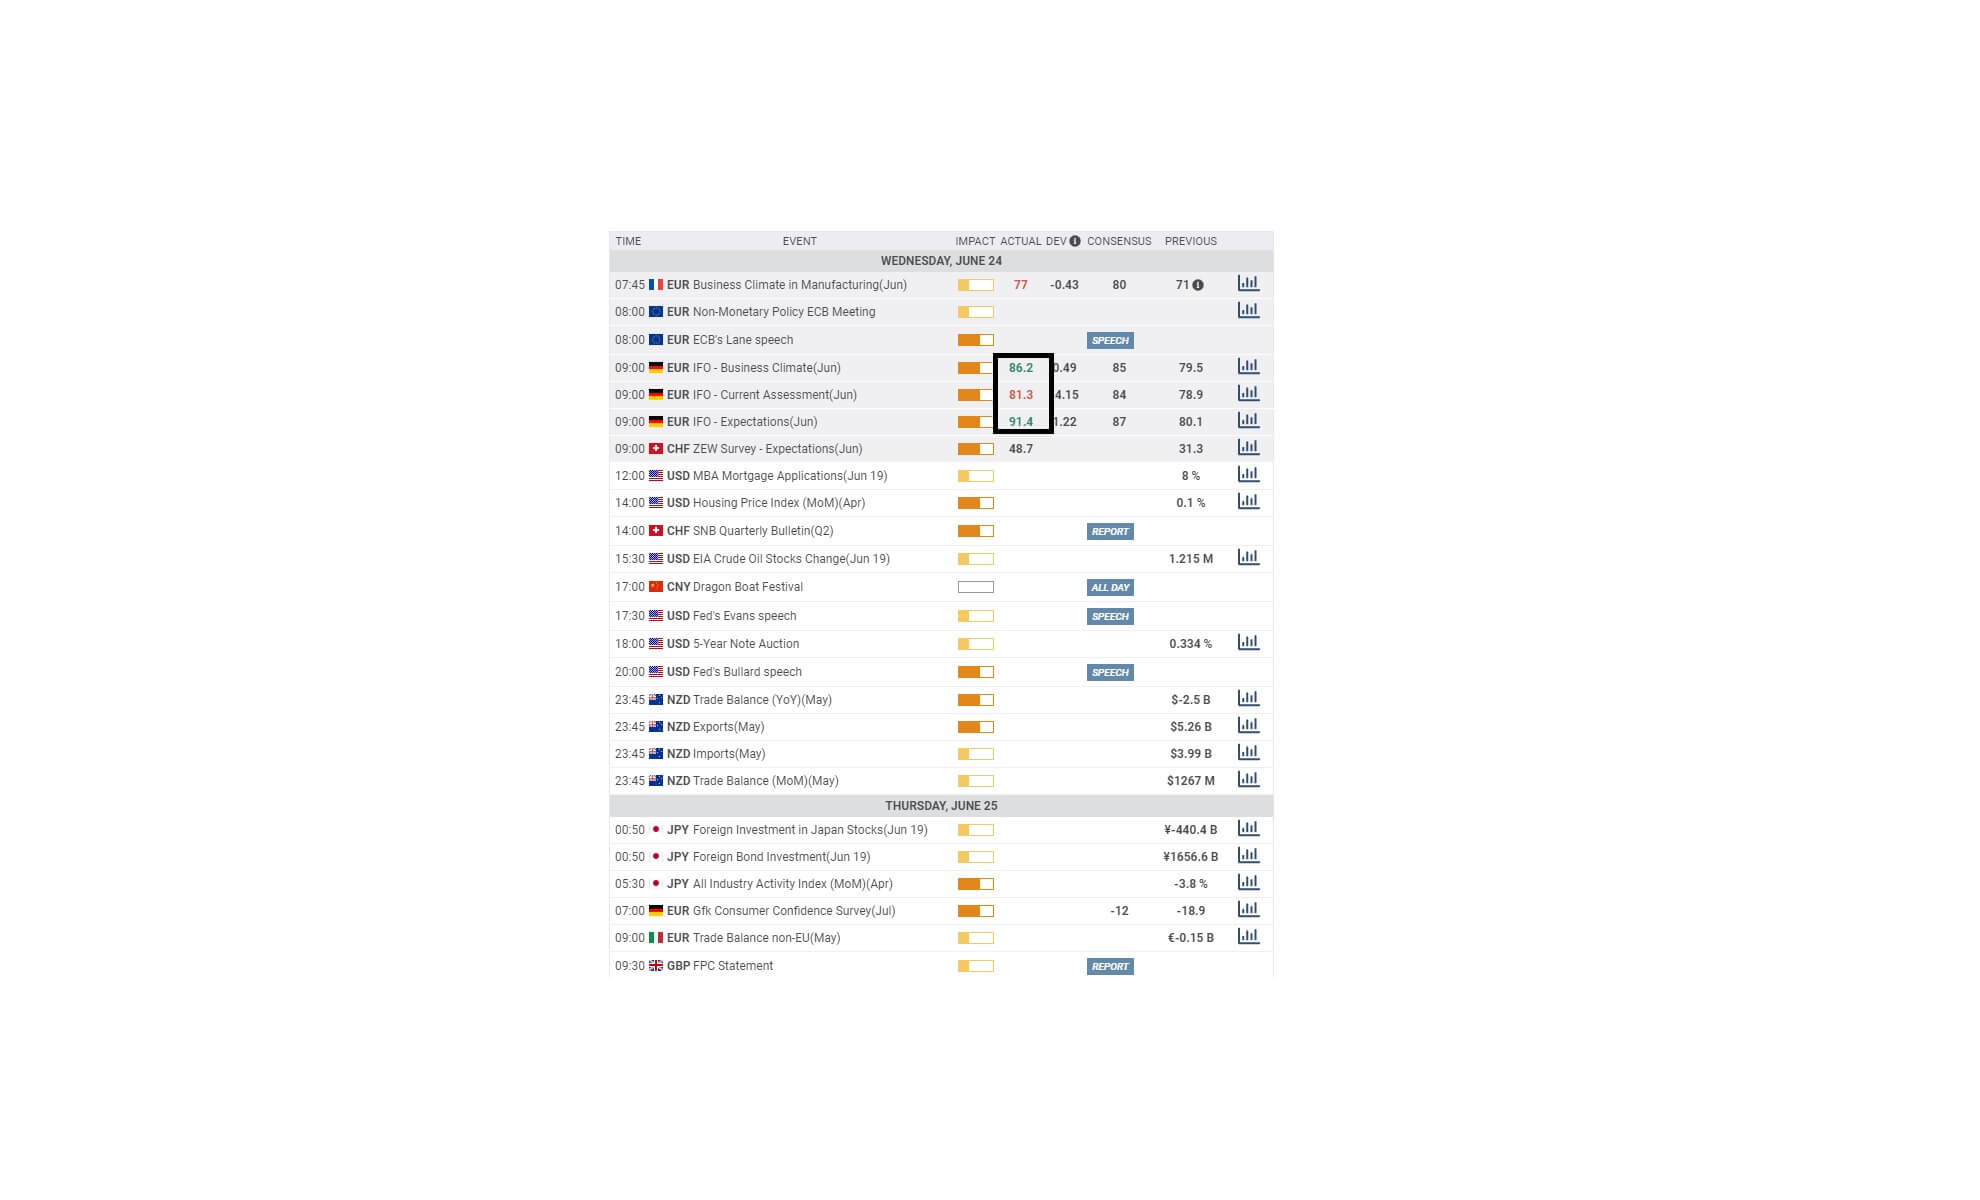
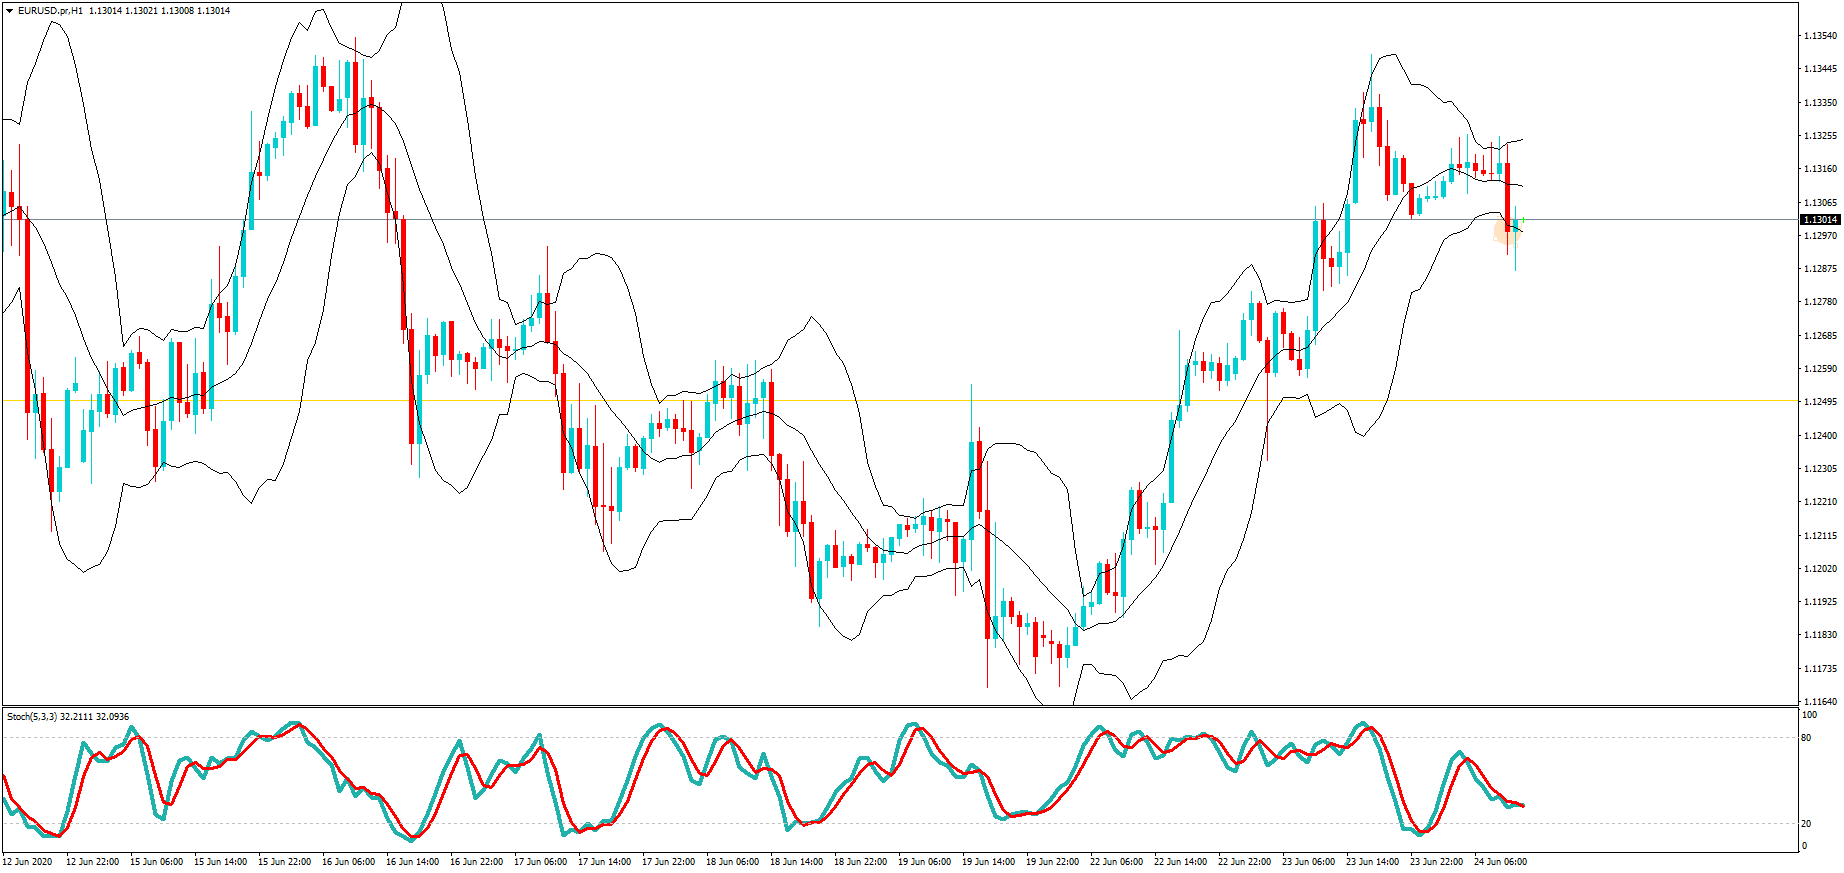
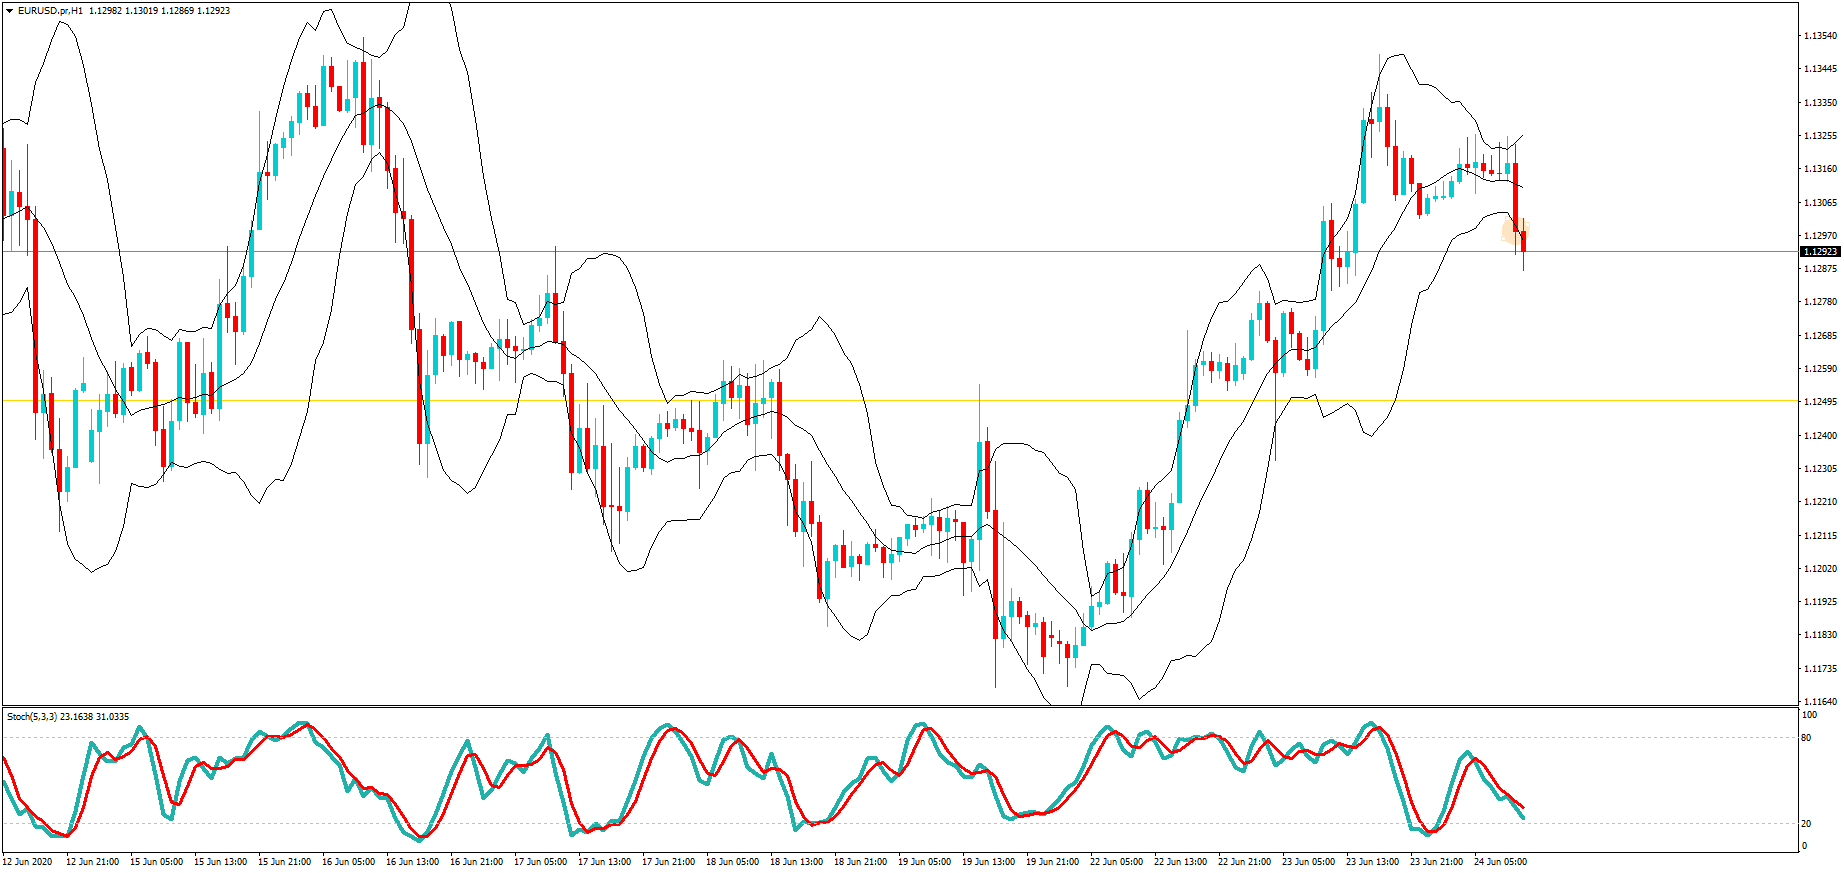
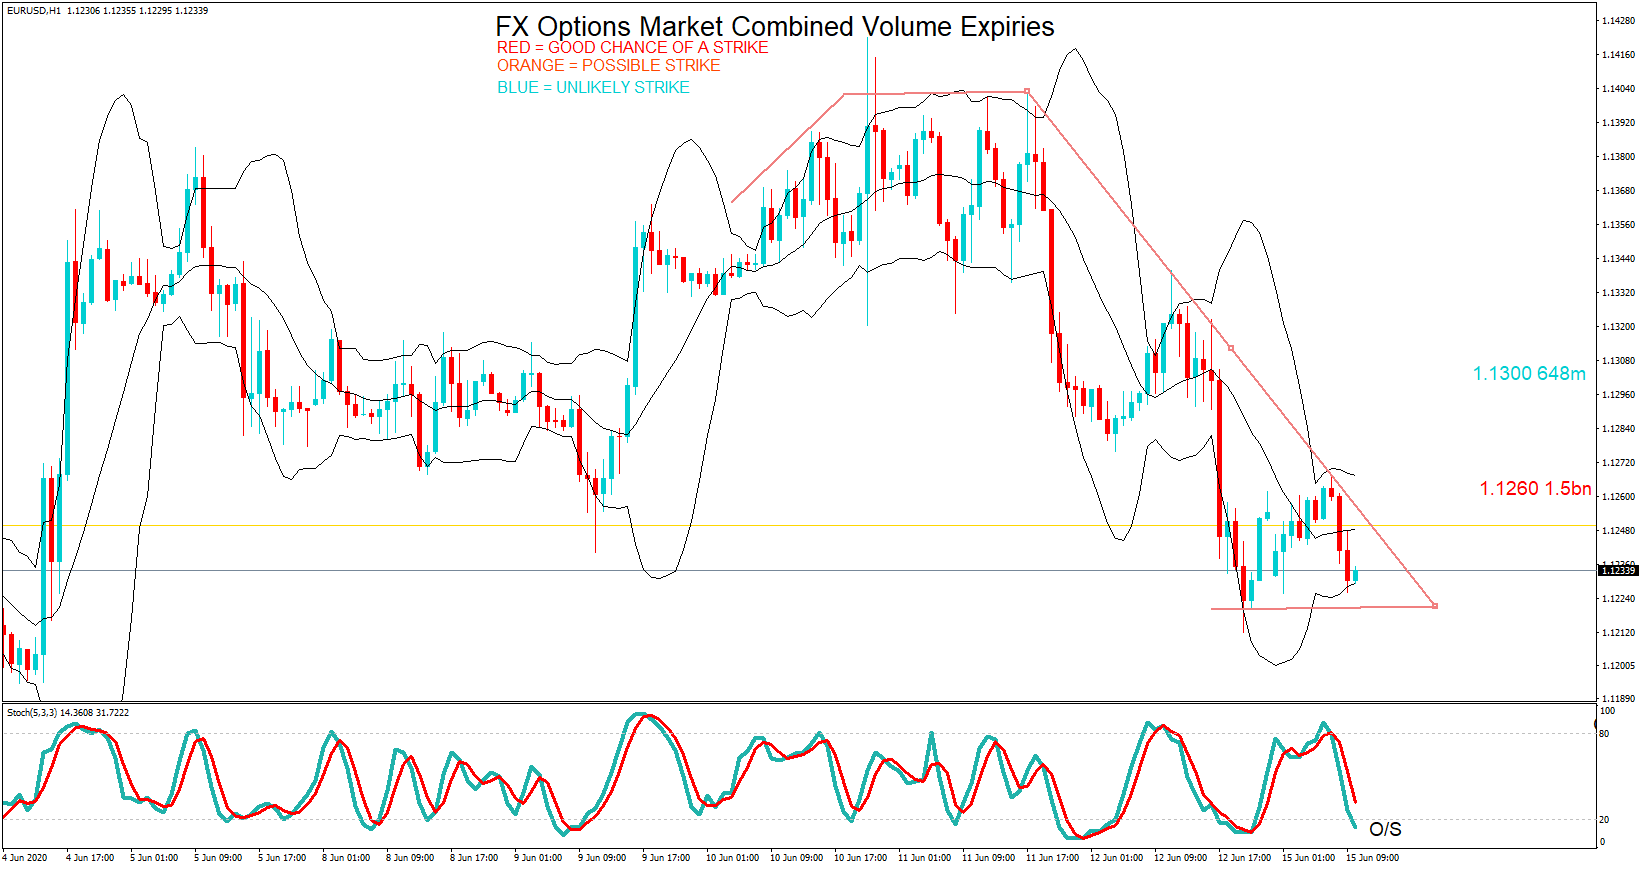
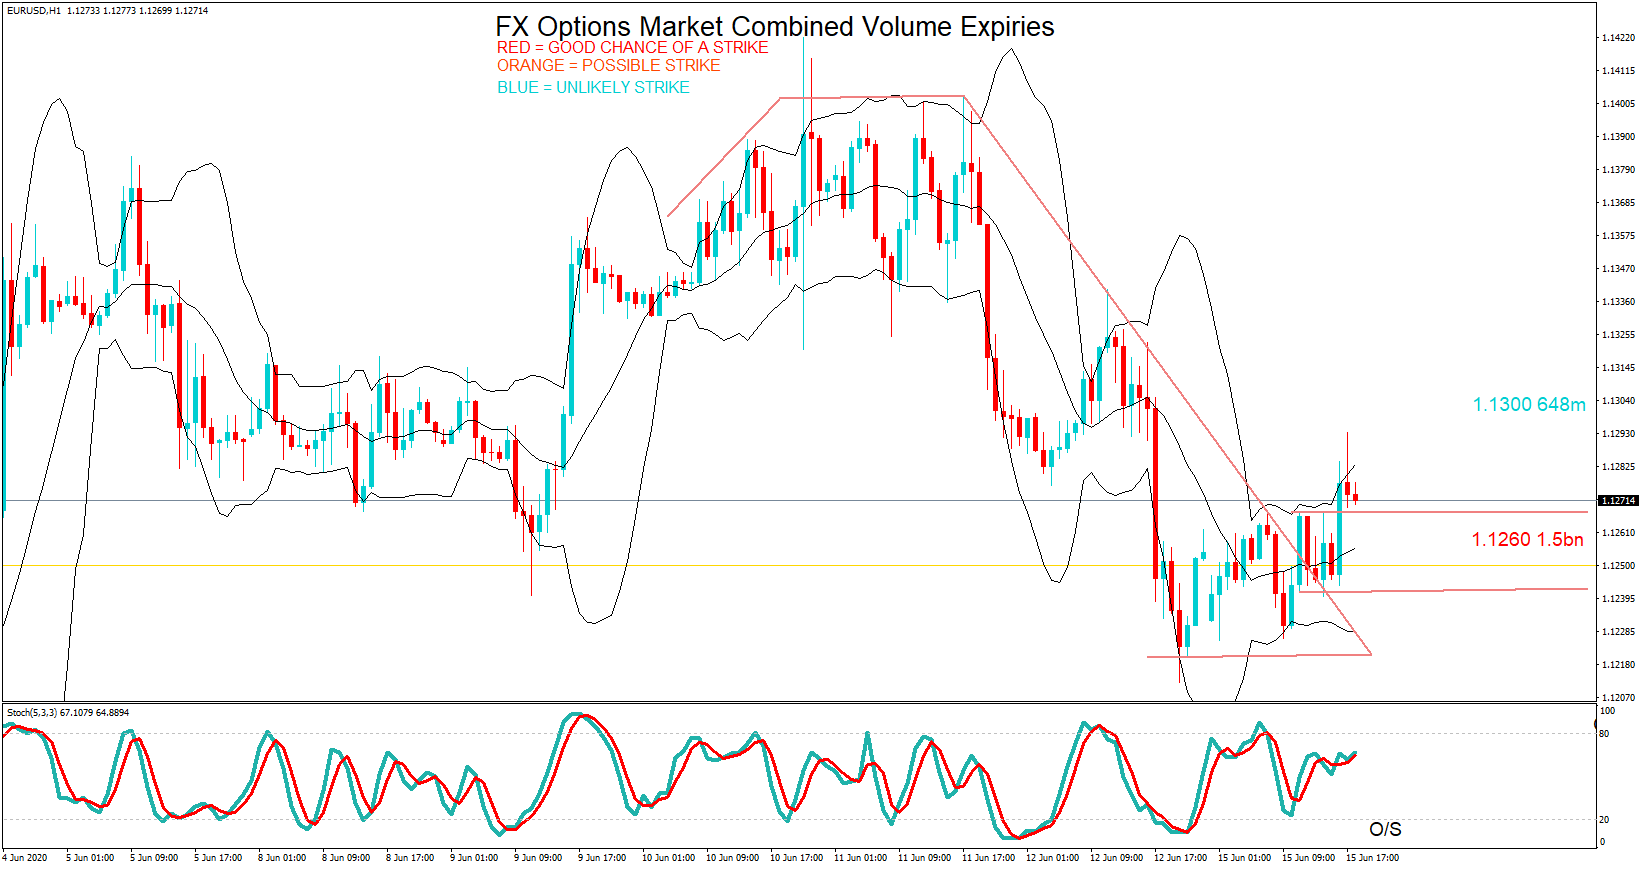
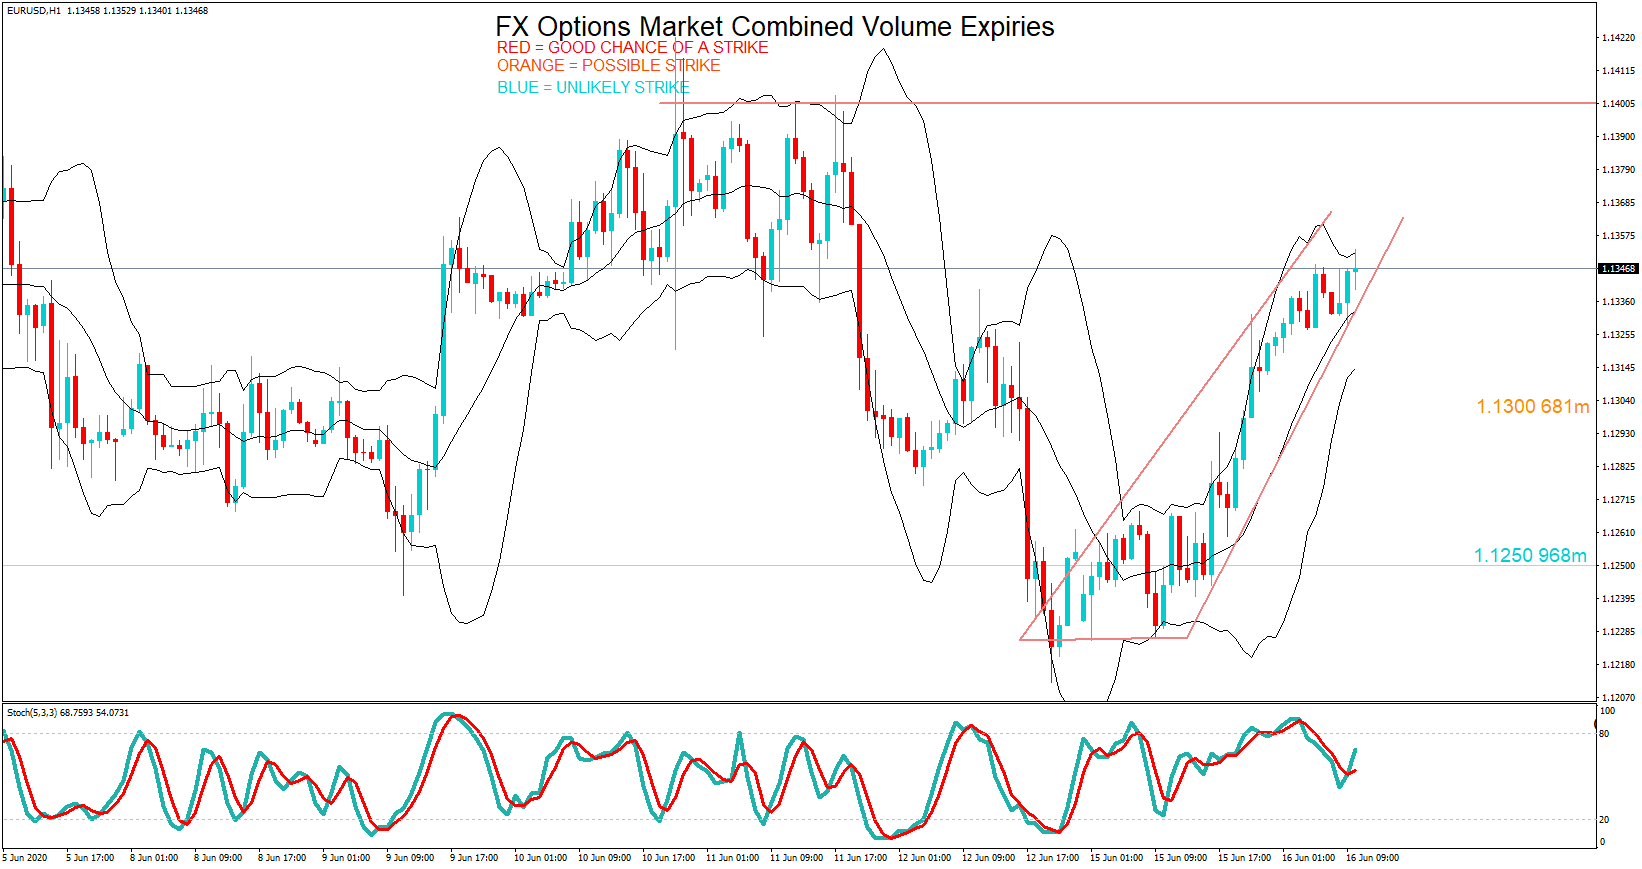
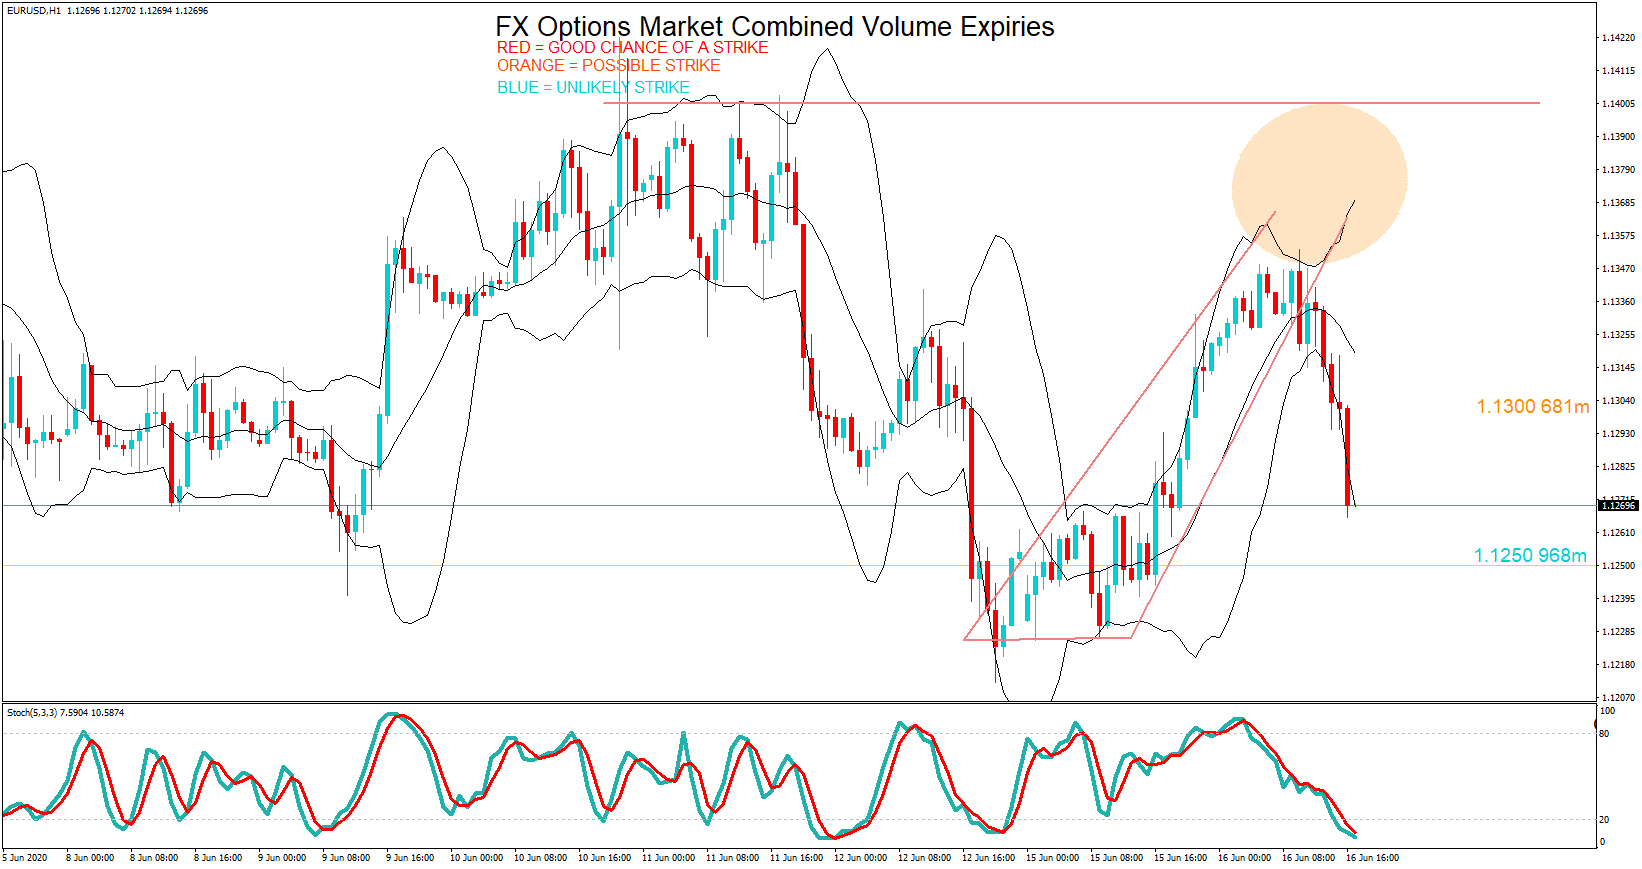
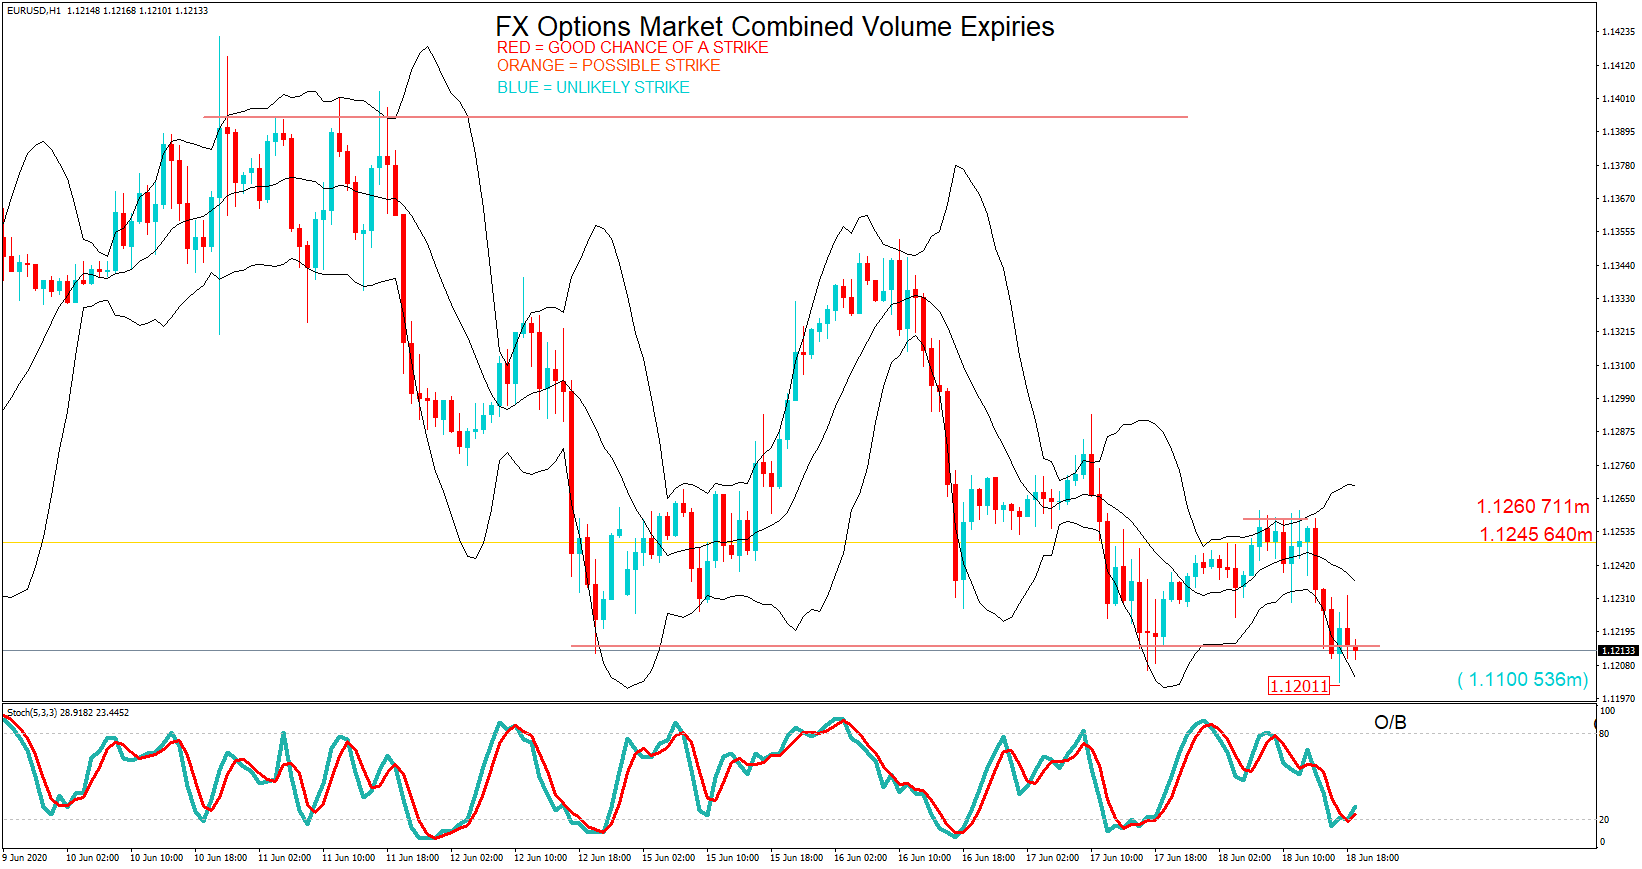
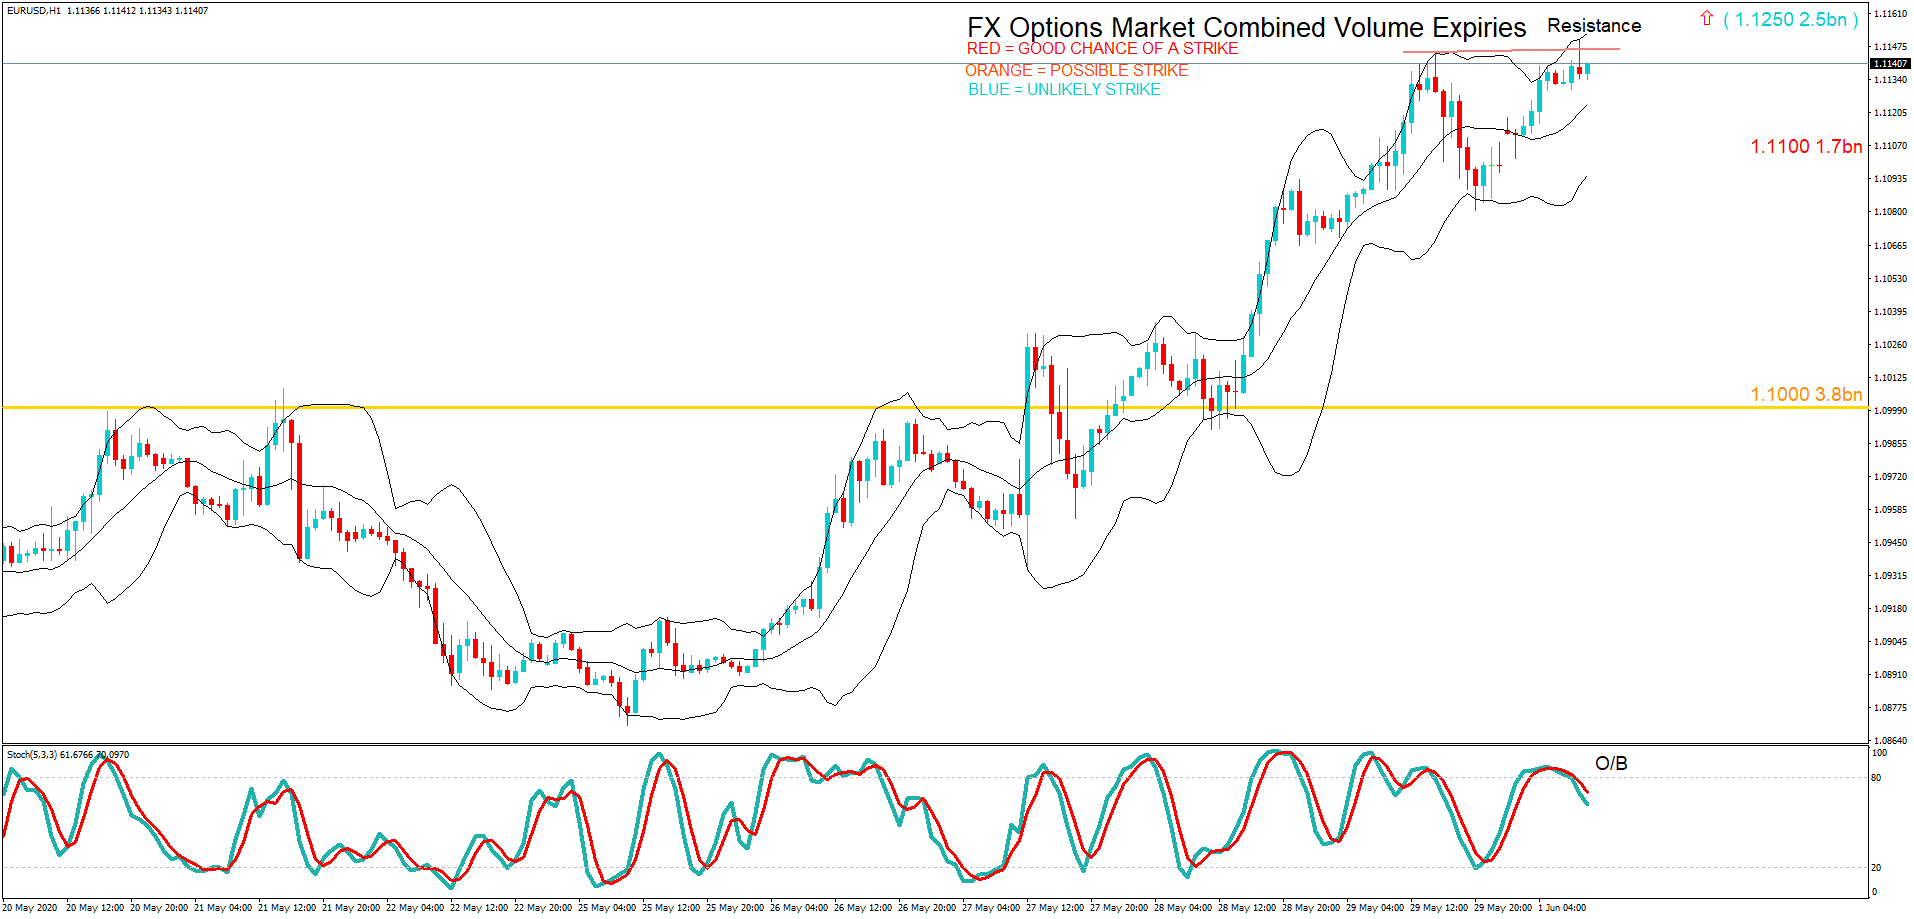
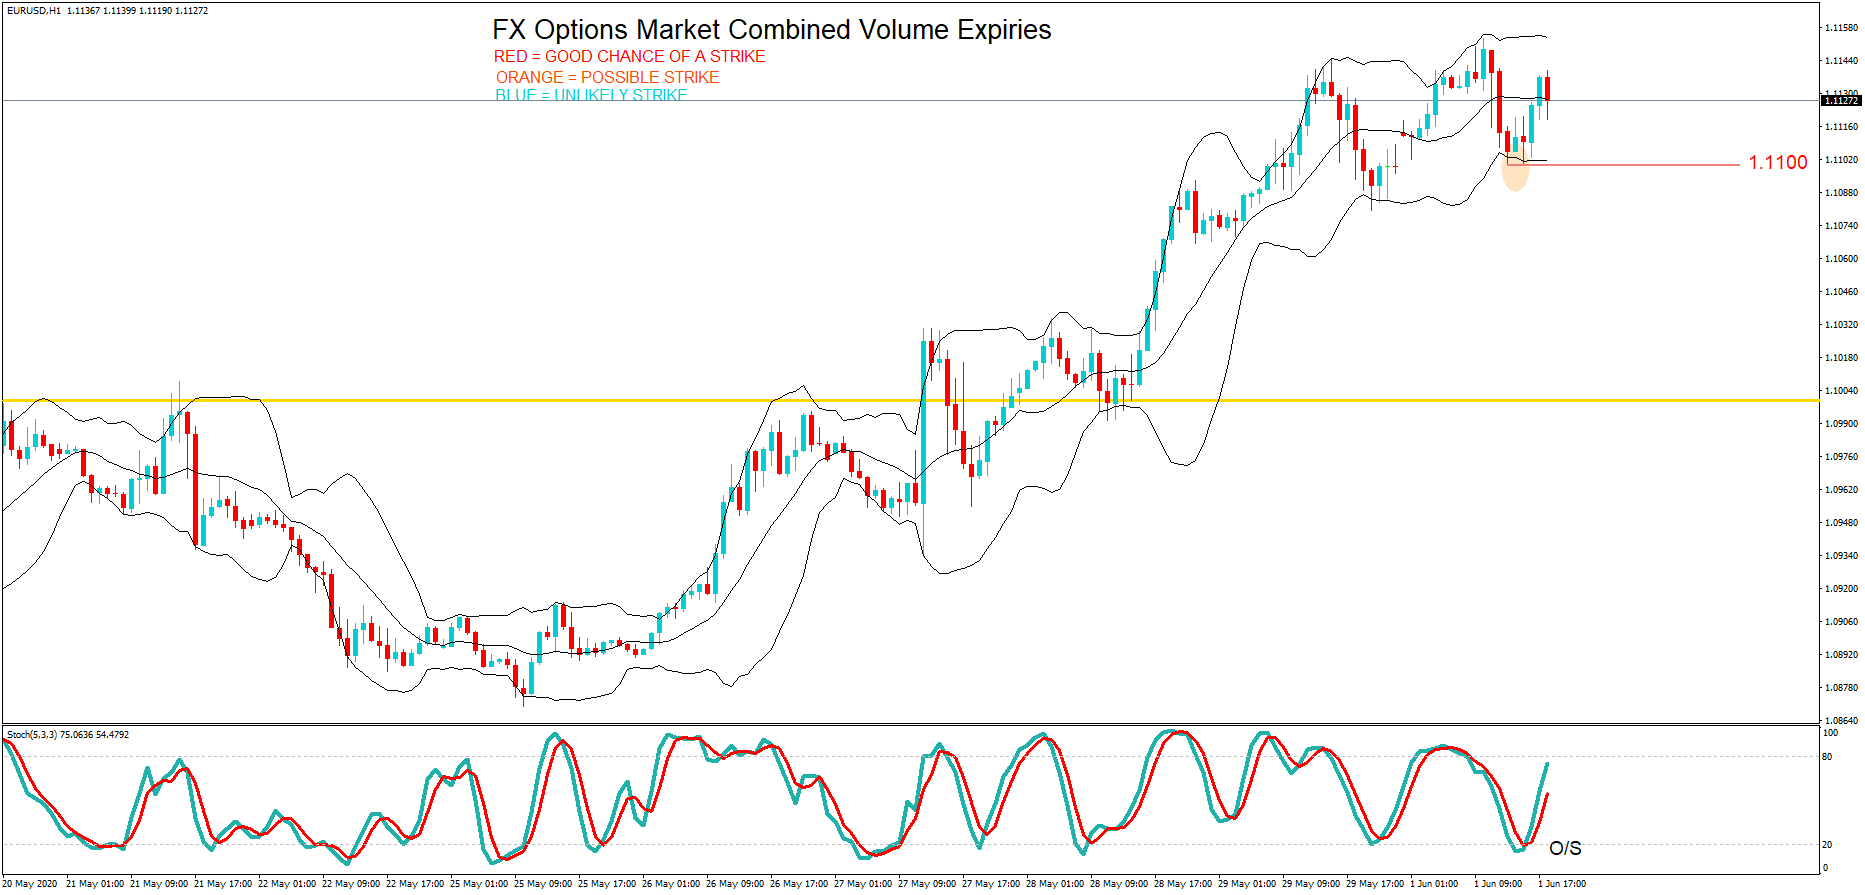
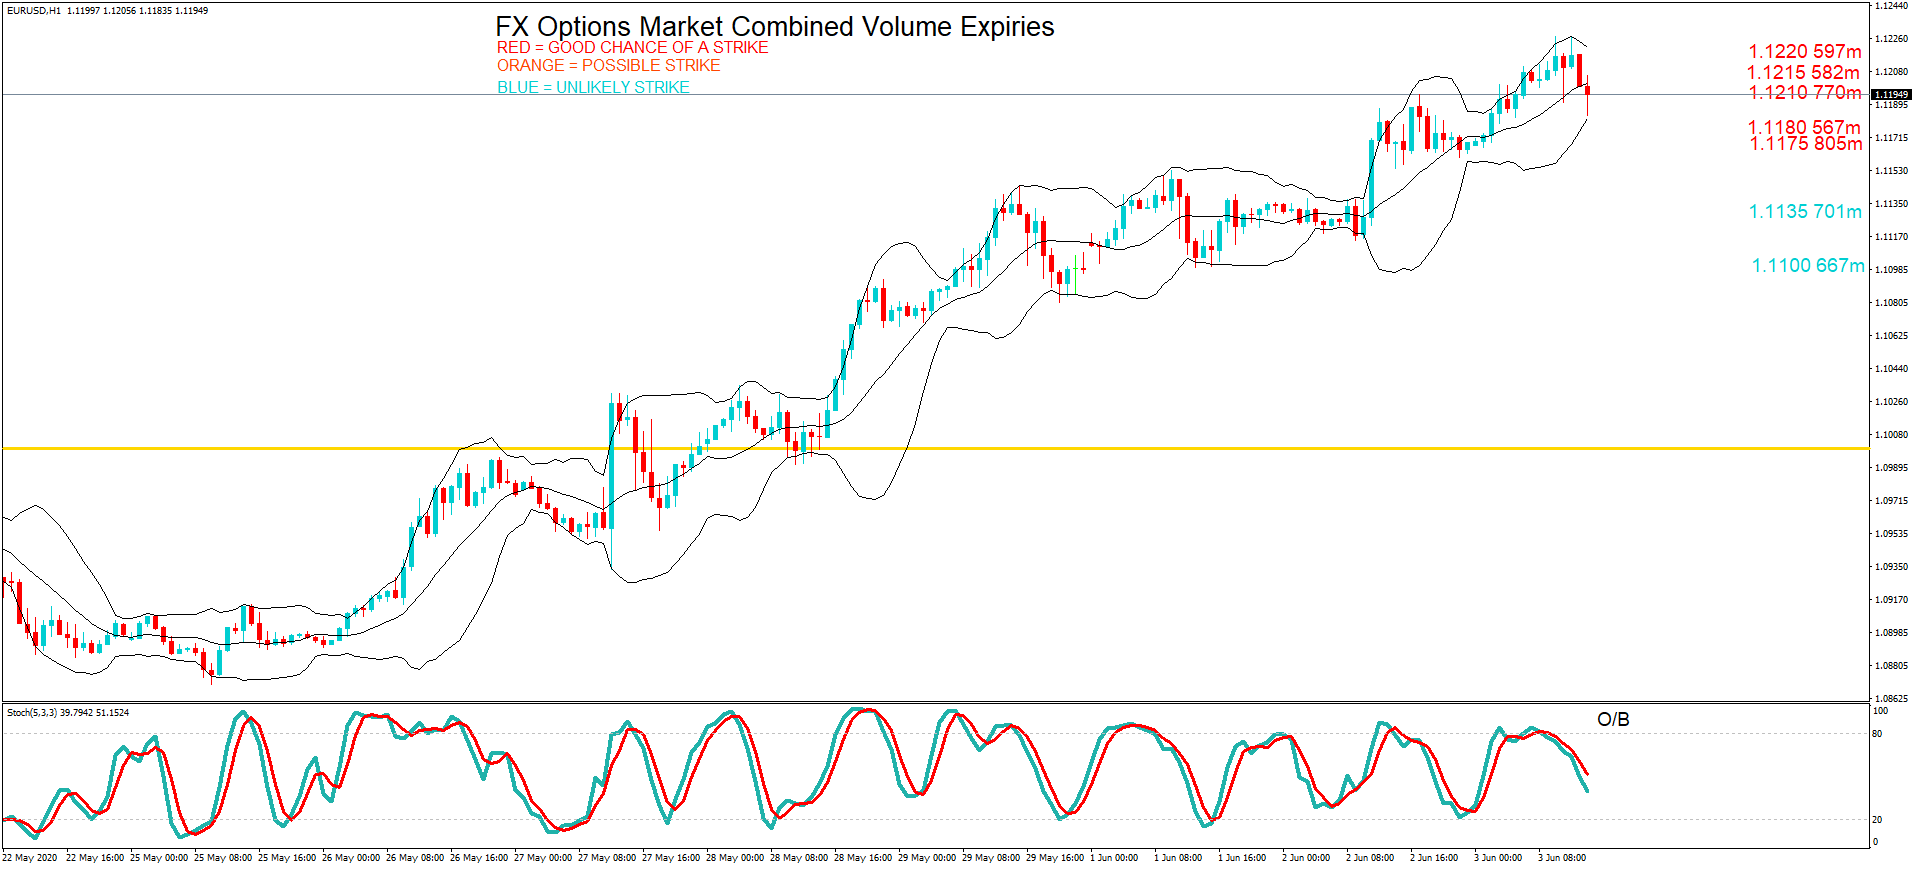
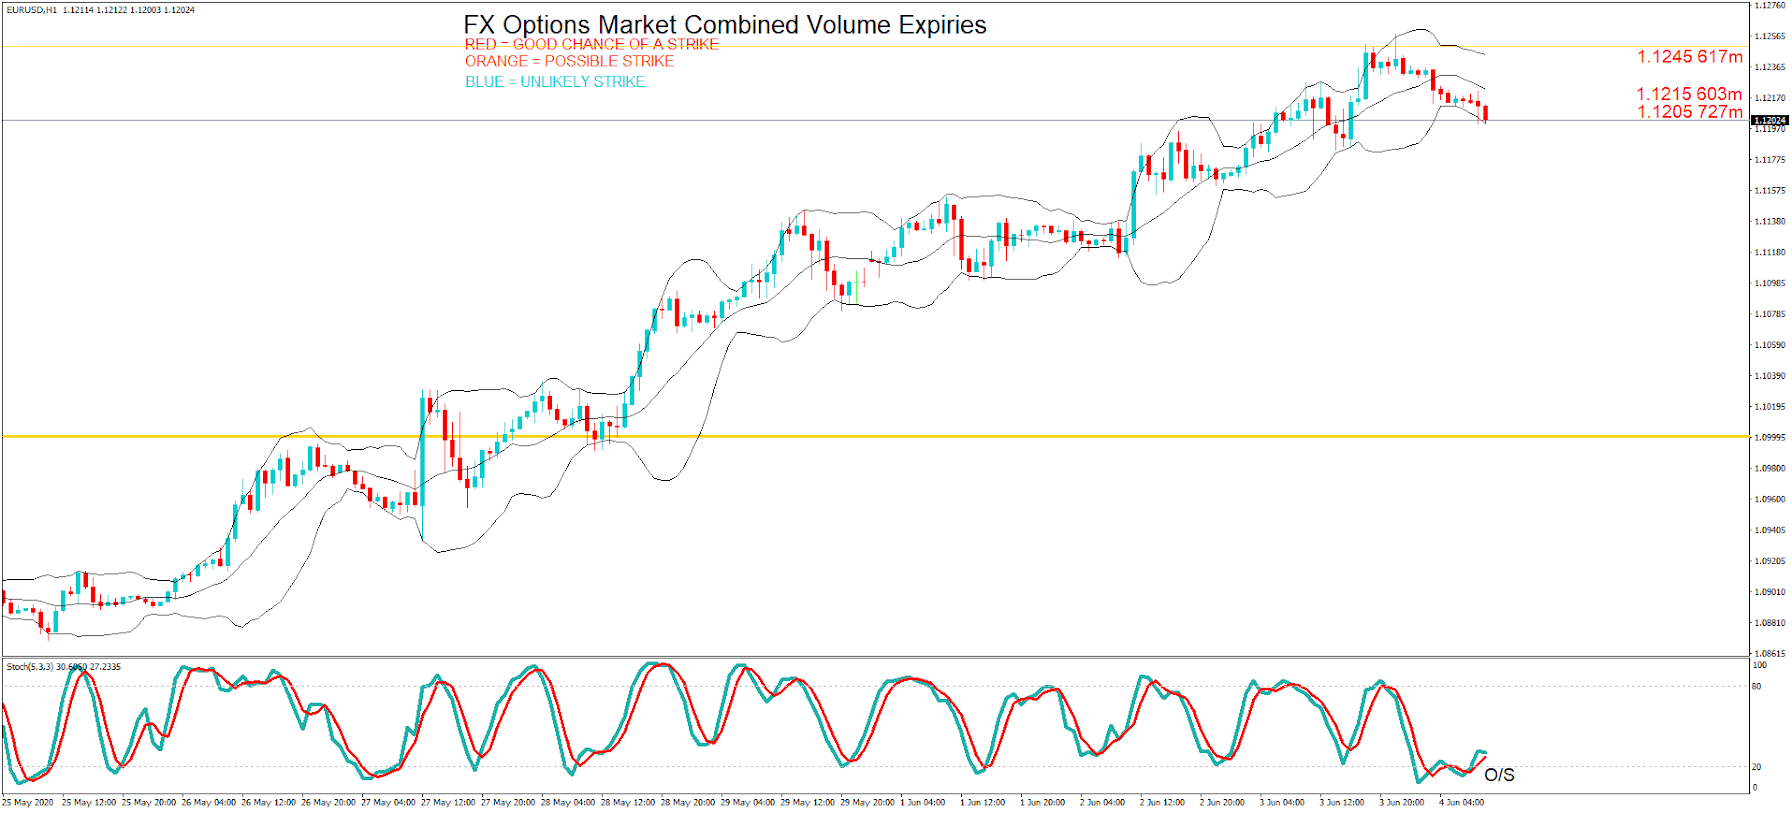
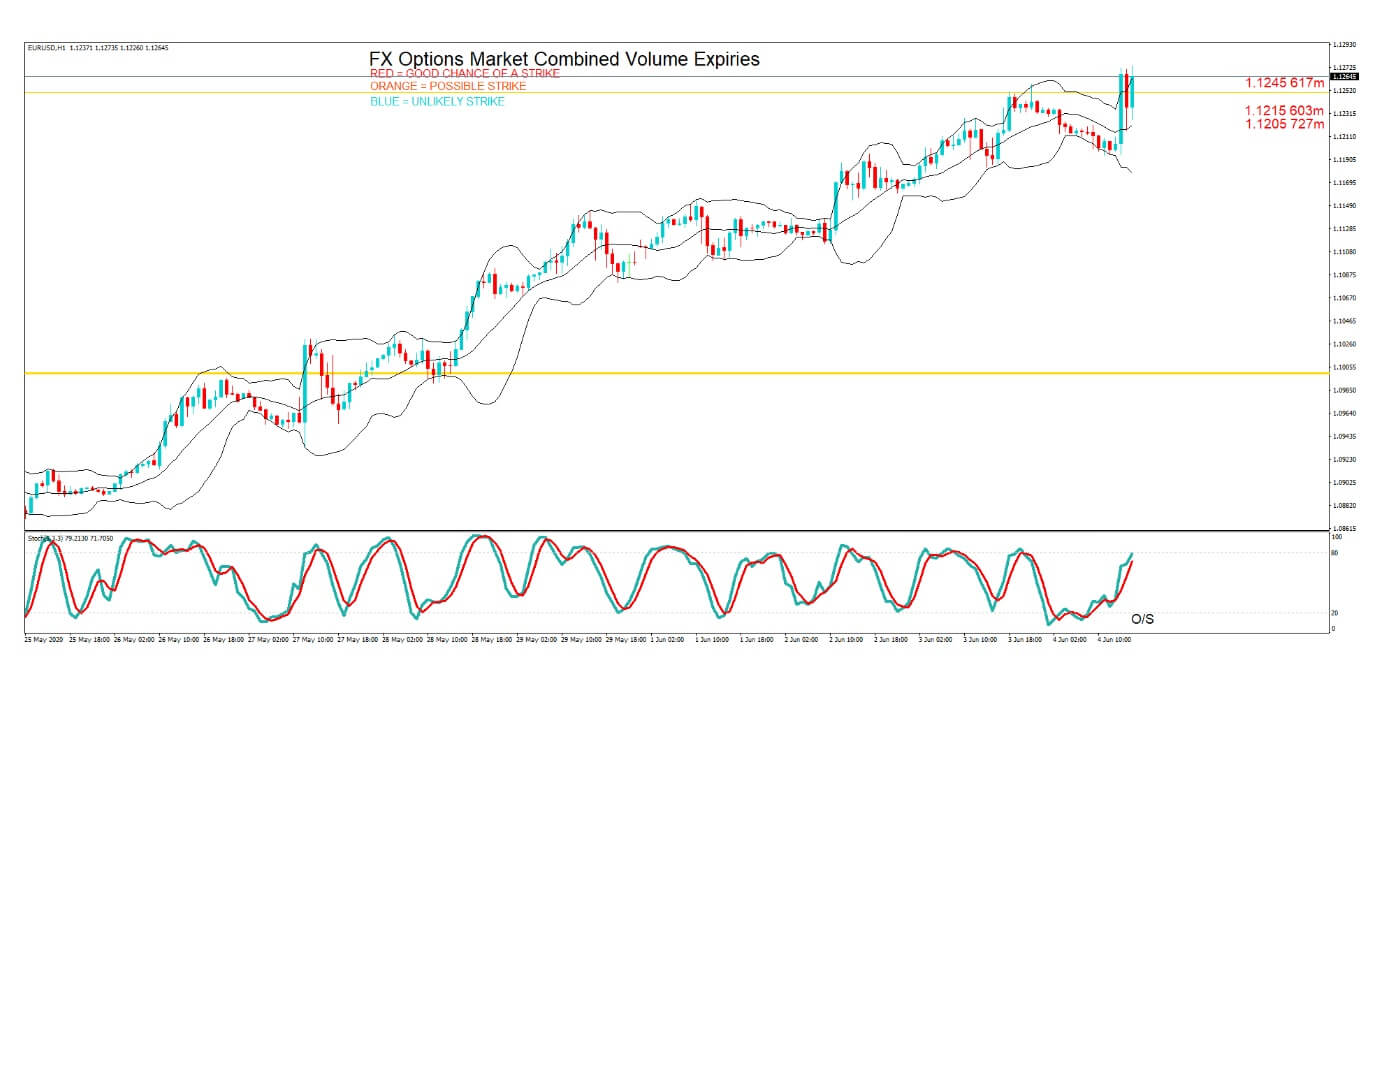
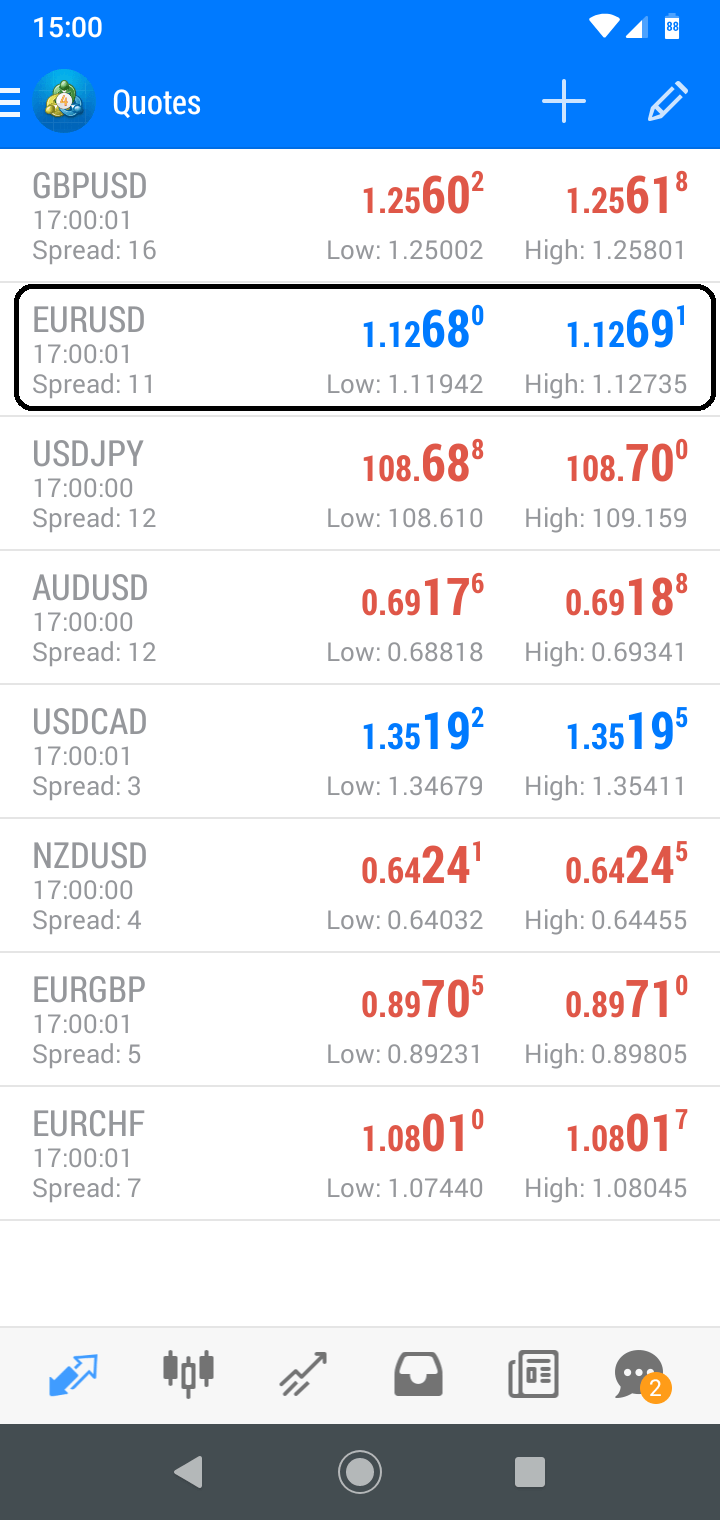
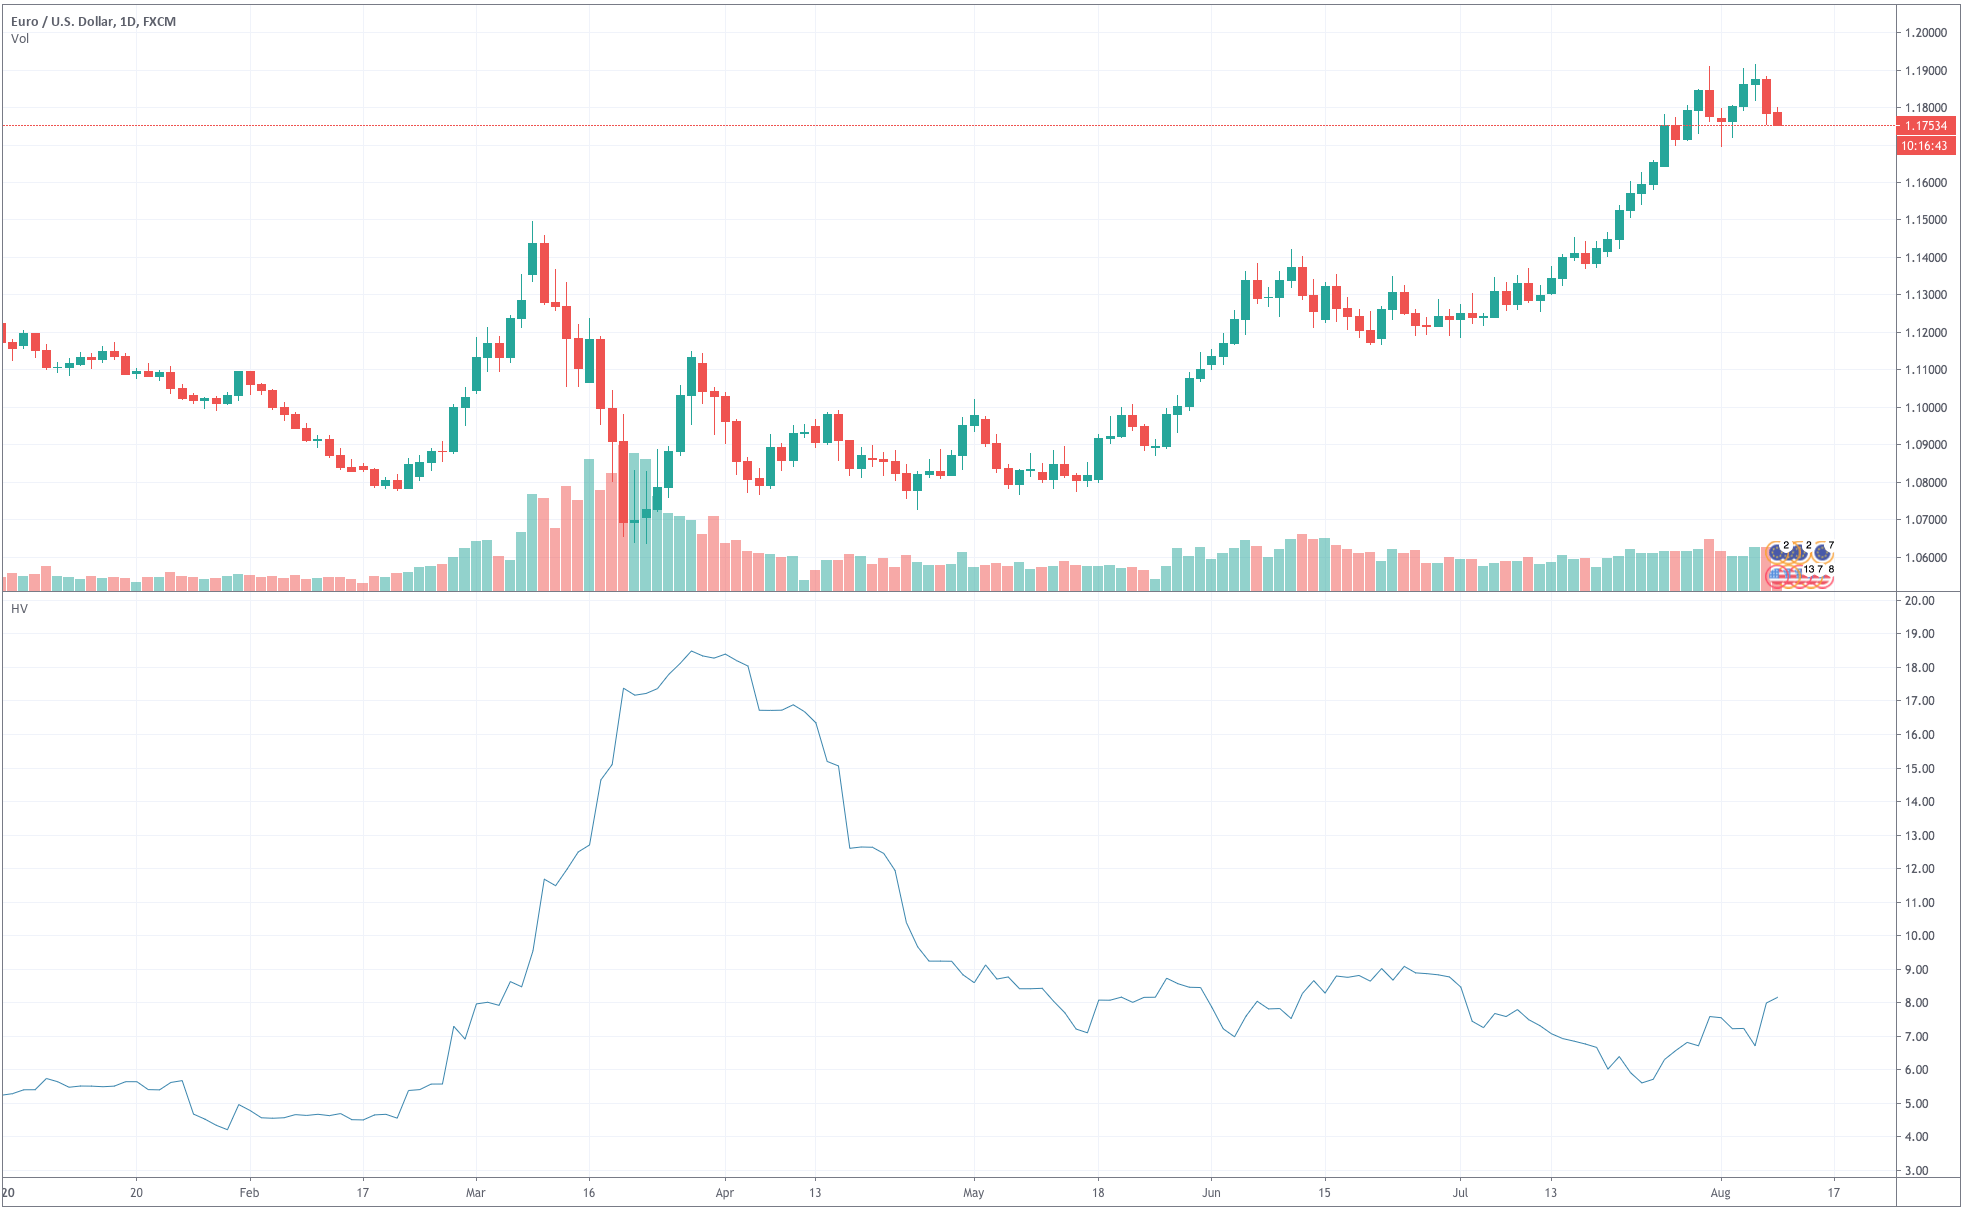
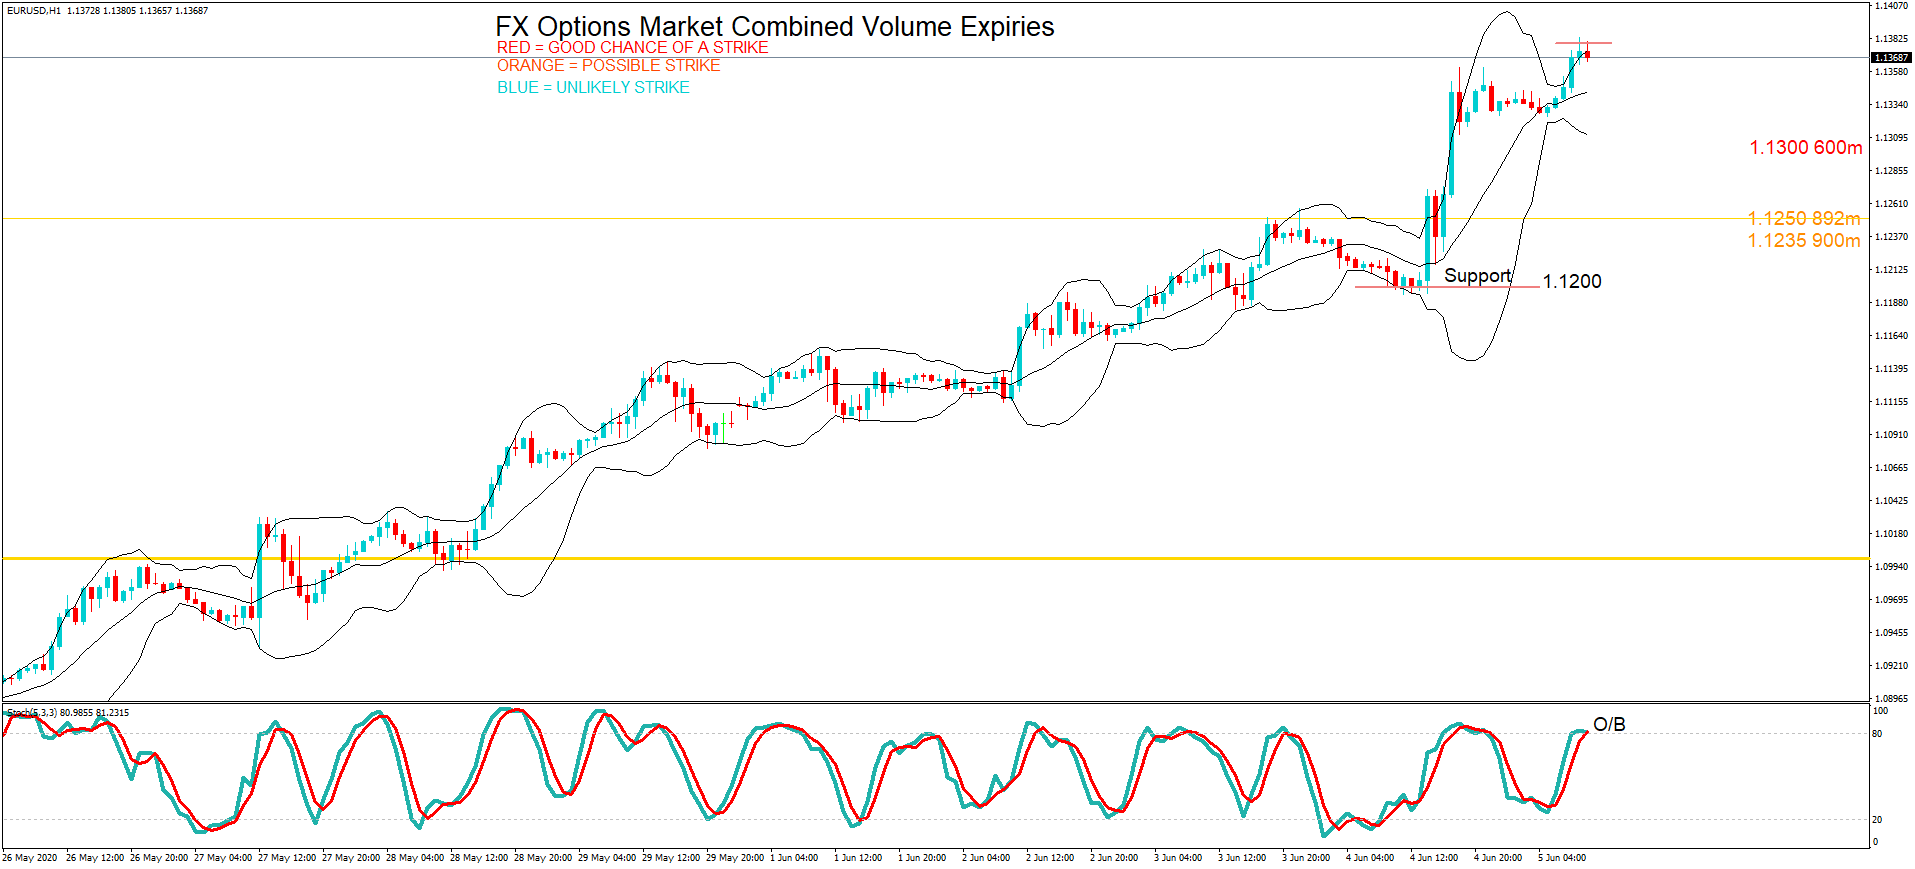
On Friday, we have the Euro us dollar pair in focus again with Kevin’s analysis suggesting the pair was overbought, and in fact, the pair did pull back in volatile trading.


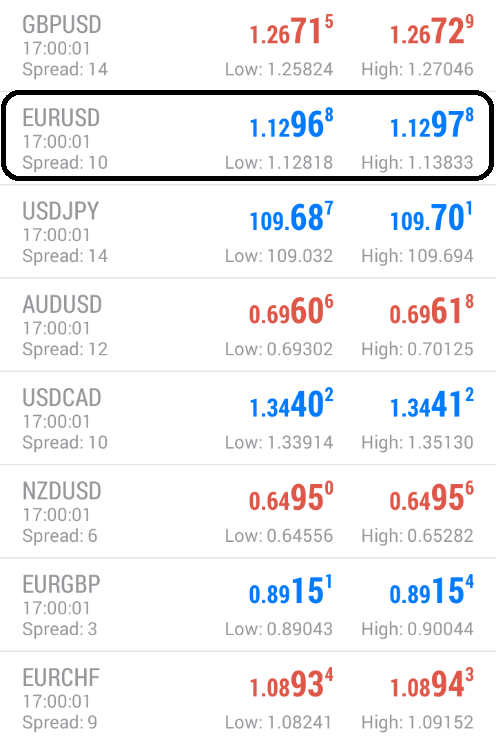
Price action for the pair hit 1.1297 at the cut. Just three pips below the option at 1.1300, which Kevin had labeled in red.
All in all, this was a very successful week where our analysis and option maturities levels have helped traders make profitable trades in this very difficult market.

Please remember, Kevin’s technical analysis is based on exchange rates, which may be several hours earlier in the day and may not reflect price action at the time of the maturities.
We suggest you get into the habit of visiting the FA website each morning just after 8 AM BST and take the levels and plot them onto your own trading charts and incorporate the information into your own trading methodology in order to use the information to your advantage.
Remember, the higher the amount, the larger the gravitational pull towards the exchange rate maturity at 10:00 AM Eastern time.

For a detailed explanation of FX options and how they affect price action in the spot forex market, please follow the link to our educational video.

Categories
Forex Videos

Forex Fundamental Analysis For Novices Exports & Trade Balance

Fundamental Analysis For Novices Exports & Trade Balance

Thank you for joining our educational video on fundamental analysis for novices. In this presentation, we will be looking at exports and trade balance. Today we will be looking at a snapshot of this data as it is due on an economic calendar and pertaining to the country of Germany.


The best way to approach trading is to plan your day and week in advance, and one of the best tools that you can utilise here is the economic calendar, which is provided by most brokers.


Always check that you are looking at the correct day’s economic releases.


Always keep a careful eye out for the level of impact for any data release pertaining to the financial asset which you want to trade. The more importance attached to the impact, the greater amount of volatility which could occur after it’s release.


In this example, we will be looking for a couple of days ahead to Tuesday, June 9th, and paying particular interest to German imports and exports and trade balance.
As we can see here, we are expecting for economic data releases for German exports, month on month for April, where the impact is low and where we have a previous month of March coming in at – 11.8 with a consensus of – 5% expected for the release at 7:AM CEST.
The trade balance for April has more significance associated to it, where we can see a 12.8 billion euros surplus for the month of March and where this is anticipated to rise to 18.9 billion Euros by economists and analysts.

So what do all these mean for the German economy and also for the Euro currency?
Firstly the information is collected and released by Statistisches Bundesamt Germany and is subject to an embargo.
The first segment exports, which is expected to come in at – 5% for April, provides details of All goods and services which were exported i.e., sold outside of the country of Germany.
Countries’ exports are extremely important to their economy because it influences the level of economic growth and provides a picture of employment. The bigger the export figure, the healthier an economy is likely to be.
In the post-war period, lower transportation costs have made it much cheaper to export to other countries around the globe. This globalization, as it is known, has an effect of making international trade far easier.

The second element is the trade balance, and this is more important, and this has a greater impact significance because now we are looking at the difference between what a country exports and what it imports.
Germany is the biggest economy within the Eurozone. Typically it exports more than it imports.

Therefore traders and economists will be looking for a positive figure on release because this shows that there is a trade surplus. A negative value would show a trade deficit.
The next segment is the current account, which measures the difference in value between exported and imported goods, services, and cross border interest payments. It also includes payments to overseas investors and other payments, such as foreign aid.
Again we are looking for a surplus or a deficit, which will show whether the country is a net exporter, which is good for their economy, and thus the Euro, or if it is a net importer of goods and services, which is bad for their economy and thus the Euro currency exchange rate.
The last segment is imports month on month for April. This provides a percentage plus or minus for the value of imports of goods and services from countries outside of Germany for the previous month.

How to trade Exports and trade data releases. Remember, a negative value on the trade balance shows more goods are being imported than exported; this is bad for an economy and affects growth. As a result, the Euro might depreciate against other currencies. Conversely, if there is a trade surplus, the opposite should apply.

The economic data release is similar for all countries, and the methodology to trading its release applies to all. Look out for data that is out of sync with the general consensus, as this might cause shock waves in terms of market volatility.

Economies do better when they export more than they import, and this is the basic premise to trading this type of data.

Categories
Forex Videos

Fundamental Analysis For Novices! Redbook Index!

Fundamental Analysis For Novices: Redbook Index

Welcome to the educational video for novices on fundamental analysis. In this video, we will be looking at the Redbook index.
So what is the Redbook index, and how can it help you trading forex?


Successful traders keep a close eye on their economic calendar. They review it at least once a day. This is a typical calendar which is provided by most brokers.


The information that you are looking for is the type of economic event, the time of its scheduled release, which is usually subject to an embargo, and the impact that it is likely to have upon its release. You will also be able to look at the previous weekly, monthly, quarterly or annual release of this data if applicable, and you will be able to study the consensus value which will have been put together by economists and analysts and whereby this is the figure which is generally expected by the market upon its release.


Here we can see that on Tuesday the 9th of June at 13:55 BST, the red book index year on year and month on month is scheduled for release.
The Johnson’s Redbook index is a sales-weighted proprietary indicator as released by Redbook research incorporated in the United States since 1964. This indicator only applies to the US, where it represents the weekly, monthly, quarterly, and annual sales activity of 9000 stores. The data is released every Tuesday at the same time to its subscribers via a conference call or an email prior to its public release. The data forms 80% of the total data as collated in this sector and is officially released into the market by the US Department of Commerce.
Although it is a private indicator, it is closely watched by traders on Wall Street, including the Forex community, because it identifies trends in the short to medium term relating to the retail sector.

The stock market finds this information useful because it ranks retailers across categories including apparel, books, toys and hobbies, department stores, discount stores, footwear, furniture, drug stores, home Improvements, home furnishers, electronics, jewelry, and sporting goods and miscellaneous.
But all traders recognize that it provides an advance warning of changes in consumer spending that, in turn, affect the business growth in this sector and shows warning signs of inflation fluctuations and interest rates.


So, how to trade the Redbook Index?
Information is provided on a percentage basis, and we can see that the previous figures for year on year and month on month were minus figures, and this is related to the coronavirus epidemic. If the actual numbers are released and as percentage terms are worse than the previous numbers shown here, this would be considered to be bad for the US economy, and therefore bad or bearish for the US Dollar. Conversely, should the numbers come in higher than the previous numbers, this would show a pickup in retail sales and a continuing overall trend in the upturn of the US economy, which is filtering through at the moment, and therefore this would be good or bullish for the US dollar.

Categories
Forex Daily Topic Forex Videos

Fundamental Analysis For Novices! Housing Starts!

Fundamental Analysis For Novices Housing Starts


Welcome to the Fundamental analysis video for novices. In this session, we will be looking at housing starts.

So, what are housing starts?

If you are reviewing your Economic Calendar and you come across the term Housing Starts, it refers to this key economic indicator, which is released around the 17th of each month by the US commerce department. The information is subject to an Embargo, and when released, it refers to the number of new residential homes that had begun construction during the month in question. Only housing starts where construction has begun on the foundations of the property are included in the data.

In the United States, housing starts comprise of three sectors of residential homes, which include single-family homes, town homes and condominiums, and multi-family dwellings with more than five units such as apartment blocks.
Analysts and traders compare the monthly data to previous months figures, in order to ascertain if the month or month and annual housing starts are growing in numbers or falling.

So why is Housing Starts so important in fundamental analysis, and why is it considered a key economic indicator?
Housing starts help to give a clear picture of the economic health of a country because when houses are being constructed, it usually means that people are moving home, buying homes or investing in properties such as buy to let or with a long term view to buy, hold, and sell. These types of home buyers are speculators. Sometimes this area of activity is referred to as flipping, especially in the renovation sector.
The important thing is that this activity usually grows in a growing economy and will typically contract during periods of recession.

The 2008 financial crash which started in the United States was due to the subprime mortgage sector failure, where bundles of mortgages were bought and sold in the financial markets, and where many mortgages were packaged as been A-rated but were in fact blended with mortgages that were considered as high risk due to the fact that the mortgages were large in size and those taking on the mortgages could not necessarily afford them.

When the 2008 recession started, and people were unable to pay their mortgages, the knock-on effect was, banks losing money in failed mortgages, which started a knock-on effect and caused the crash. Housing starts can be affected by the weather, and this is generally factored in by economists when the data is released. They will also consider the business sector surrounding this industry, which include banks, mortgage suppliers, mortgage brokers, builders, construction workforce, and suppliers of goods and materials.

How to trade housing starts?
Because of the coronavirus pandemic, which has caused a contraction in the housing market, traders and analysts and economic commentators will be keeping a close eye on Housing, starts data over the next few months. They will use this data to try and ascertain if the crisis is over and that things are gradually getting back to normal with an uptake in house buying.

When the number is released, which usually happens on the closest business day to the 17th of each month, for the US housing starts data, keep a close eye out for the number, if it is as the market expected, we should not see too much volatility in the markets. If the number is much lower than that which is expected this would be bearish and you might see the dollar exchange rate fall in value against his counterparts, and if the number is higher than expected, this should be considered bullish because it is good for the economy and you might, therefore, see dollar exchange rates move higher.

Categories
Forex Videos

Fundamental Analysis For Novices- Building Permits!

Fundamental Analysis For Novices Building Permits

Welcome to the Fundamental analysis video for novices. In this session, we will be looking at building permits.

So, what are building permits?

Before residential house construction, or business premises can be built, or remodeling projects can commence on such properties, permits have to be granted from an officially approved local government agency to allow contractors to proceed with the work. This allows for standards to be maintained and improved and allows for Governments to keep tabs on what is happening for statistical analysis of their economies.
The actual building permit itself will allow for the structural integrity of the framework, water and sewage lines, fire and gas connectivity, fire protection, zoning, and sanitation.
The granting of building permits varies from country to country because not all home construction and renovation projects require a building permit. However, typically, projects which require major constructional changes and certainly new build projects require building permits.

Building permits within an economy are important indicators of growth or stagnation in particular segments of the economy. An upturn in commercial building permits is a good indication that businesses are expanding. An upturn in home construction is a good indicator that employment is going well and that people are moving homes, buying new homes, and renovating. In other words, there is a need for new homes. These are positive signs that economies are doing well. Conversely, the opposite is true.

There is a knock-on effect with regard to financing, employment, and manufacturing
and supply of associated materials. And so building permits are seen as an important barometer to the financial health of a nation and are carefully observed by economists, analysts and traders.


Each month countries such as New Zealand, in this example, on our economic calendar, releases statistics for their building permits. The information is scheduled for release during the usual business hours of the country in question, and typically in the mornings, and is subject to an embargo.


Let’s take a closer look at the New Zealand permits which are due for release on Monday the 1st of June, we have been inserted red arrows to show you the impact significance of the release, where an updated month on month building permits data for the month of April is due, and where the previous figure for March came in at – 21.3%.

So how to trade using building permits data release?

The larger the economy, the more significant the building permits data release is taken. So let’s take a look at the USA, where the Building Permits report is released by the U.S. Census Bureau on the 18th working day of each month, having conducted a survey of 9,000 permit issuers before publishing their findings into the financial markets. The Census Bureau has been gathering this data since the 1960s.
Typically, a growing number of permits above previous months’ data release is seen to be bullish for an economy, and numbers that are lower than the previous months’ data release are seen to be bearing.


Keep an eye out for the consensus figure which will be updated prior to the release,


And then compare it to the actual number after the release. Markets hate shocks, and therefore if the number is markedly lower than that of the consensus, where professional analysts and economists have been carefully monitoring events in order to draw their conclusions, you might expect a negative effect on the value of that particular country’s currency against other counterparts. But, if the data is higher than expected, then you might see that particular country’s currency gain in strength against other counterparts being traded.

Categories
Forex Videos

Forex Fundamental Analysis For Novices – Factory Orders!

Fundamental Analysis For Novices Factory Orders

Welcome to the educational video Fundamental Analysis For Novices regarding factory orders
What are factory orders, and what do they tell you as an economic indicator?


Each day when you look at your Economic Calendar, you will see different types of economic events due for release on particular days.
At the top of the economic calendar for Friday the 5th of June, we can see factory orders highlighted for Germany for both year on year and month on month.

Factory orders provide a picture of the financial health of countries that produce durable and non- durable goods. Durable goods are things such as sports equipment, machinery, household appliances, and generally things that are not consumed. Typically they will have a lifespan of a minimum of 3 years. Non-durable goods are produced by consumers and typically have a short shelf life of fewer than three years, Such as toothpaste, laundry detergent, soaps, deodorants, light bulbs, paper plates, and clothing.
Factory orders comprise four sections, new orders, unfulfilled orders, shipments, and Inventories. This data will show whether there is a backlog in production and trends in current sales. All of these taken together will show the strength of the current and future production for an economy.
In America, factory orders are so huge they are reported in the billions of dollars and are released by the Census Bureau of the United States Department of Commerce. All countries report their data as a plus or minus a percentage of previous reports.


The market attaches a certain amount of importance to all economic data releases, and here we can see color bars that depict the impact that the release of this information will have. We can see that the month on month has a higher impact status than the year on year figure.


Hey, we can see that the actual data has been released at 7 AM CET and which was subject to an embargo. And when compared to the consensus, which is what the market was expecting and also the previous release from the month of March, the numbers are badly down at – 36.6 % year on year and -25.8% month on month for April.
These are bad numbers and can be put down to the fall out from the coronavirus pandemic, which has severely affected economic activity around the world.

Germany is the strongest economy in the Eurozone, and analysts and economists, as well as financial traders, keep a particular eye open for this type of underperformance.
Factory orders show an overall direction of an economy. When factory orders increase, it means the economy is expanding, and consumer demand is high for goods. If a country is contracting, it will show up as bad economic data, such as we have just seen for Germany.
INSERT G: How to trade factory orders data release

Look out for the previous factory orders number and compare it to the previous release and, more importantly, the consensus which will have been formulated by economists and analysts. Big differences between the consensus and the actual number can cause market shocks or volatility. Remember, a higher percentage than the previous month and increase year on year indicate that the economy of a country is likely to be improving. This will reflect in higher consumer demand and is good for the exchange rate of a particular currency, which may move higher against its counterparts.
Conversely, if the data release is lower than the previous month and shows a decline this is a sign that the economy of a particular country is stagnating or contracting and therefore there is less consumer demand, and this could have the opposite effect of an exchange rate moving it potentially lower against its counterparts.