Categories
Forex Videos

Pfizer Covid 19 Vaccine Fuels Market Volatility – Vaccines Used On Children Without Parents Consent!


Covid-19 Vaccine hopes fuel market volatility

In this session, we will be looking at the announcements on the 9th of November, where Pfizer announced they had successfully concluded a trial of their Covid-19 vaccination, which had the effect of reducing the infection rate by 90%.

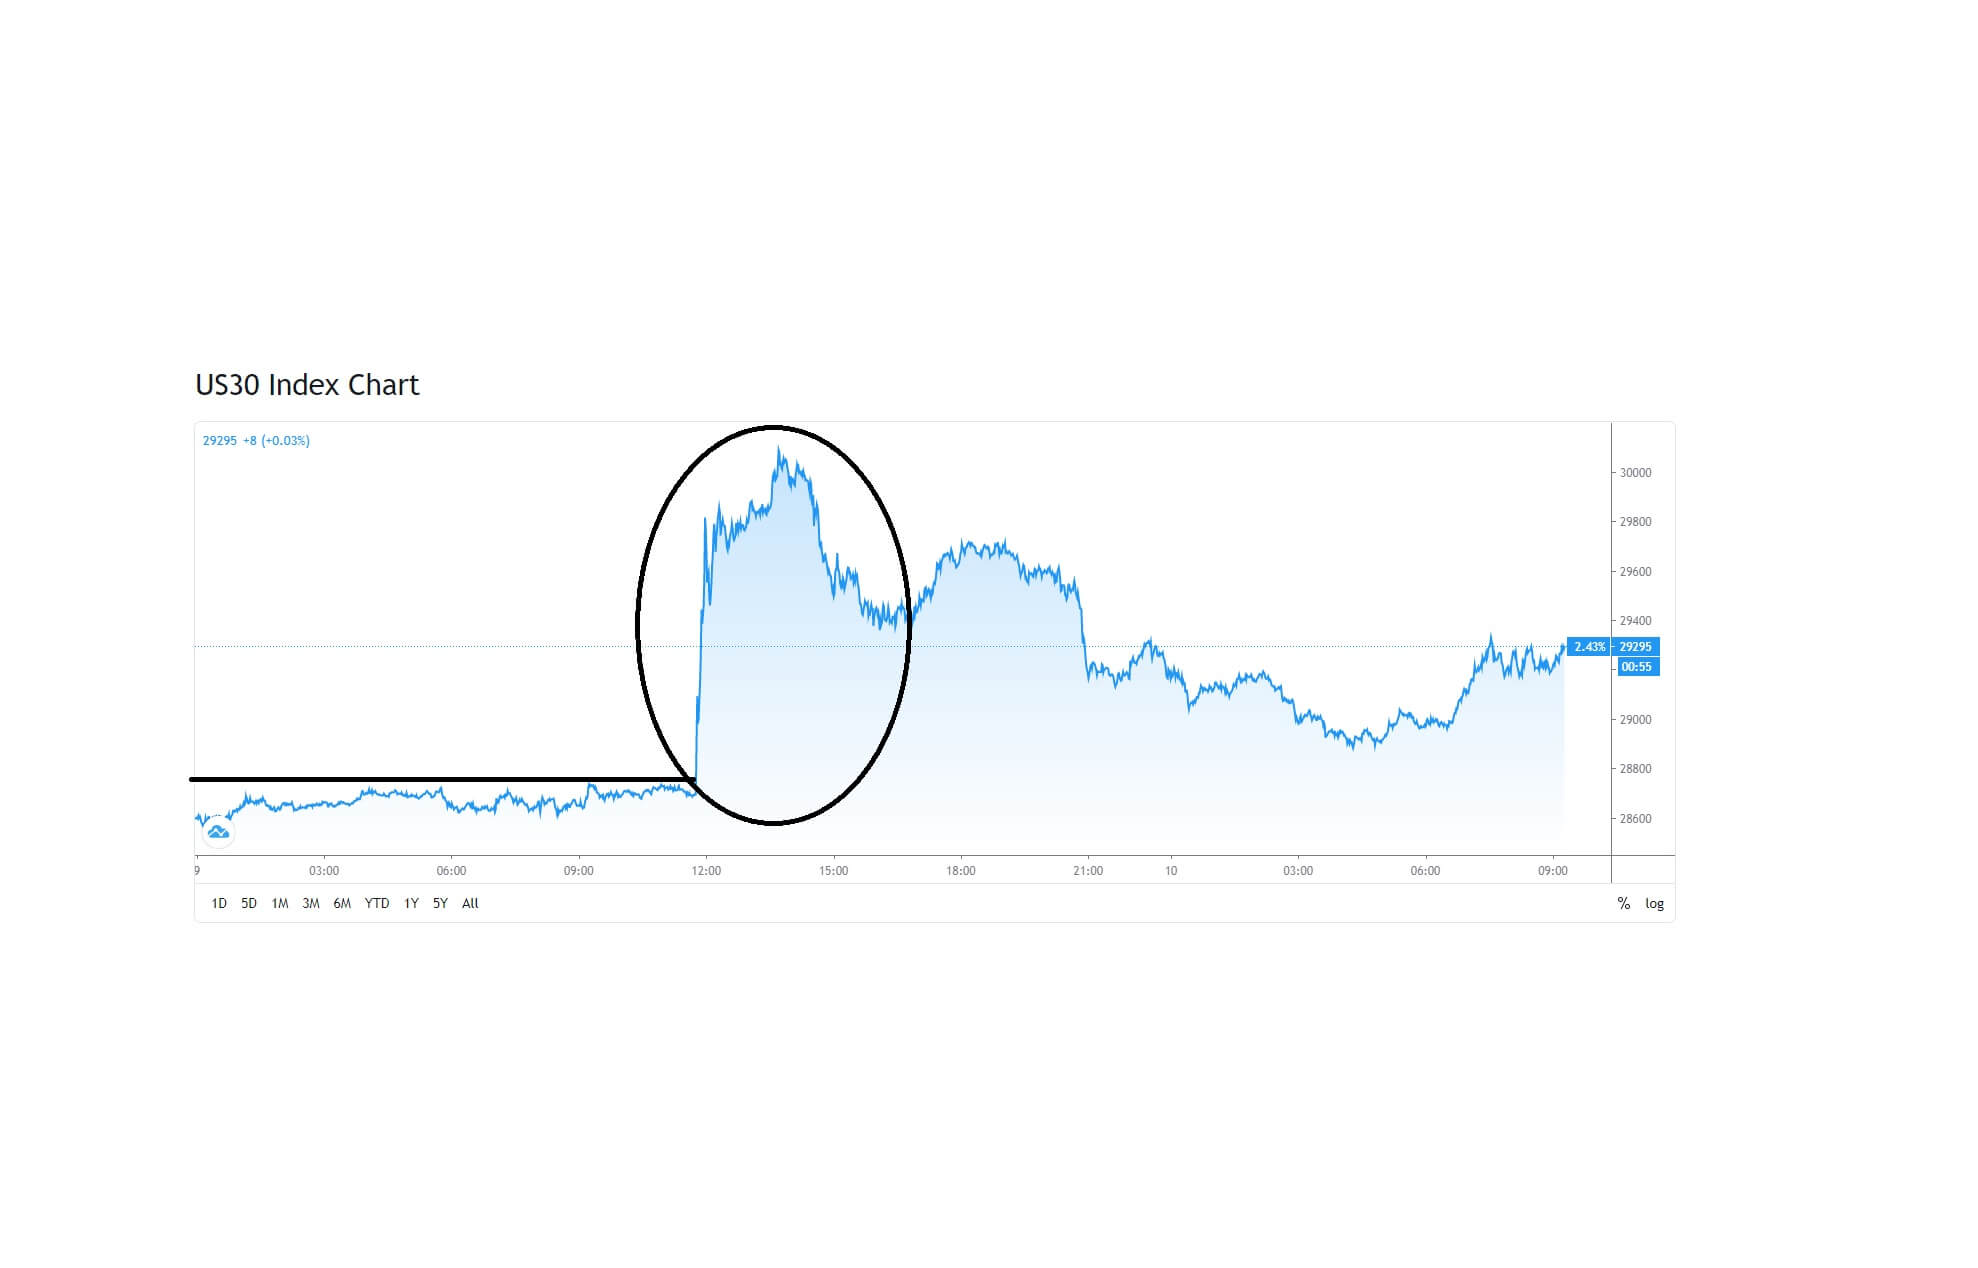
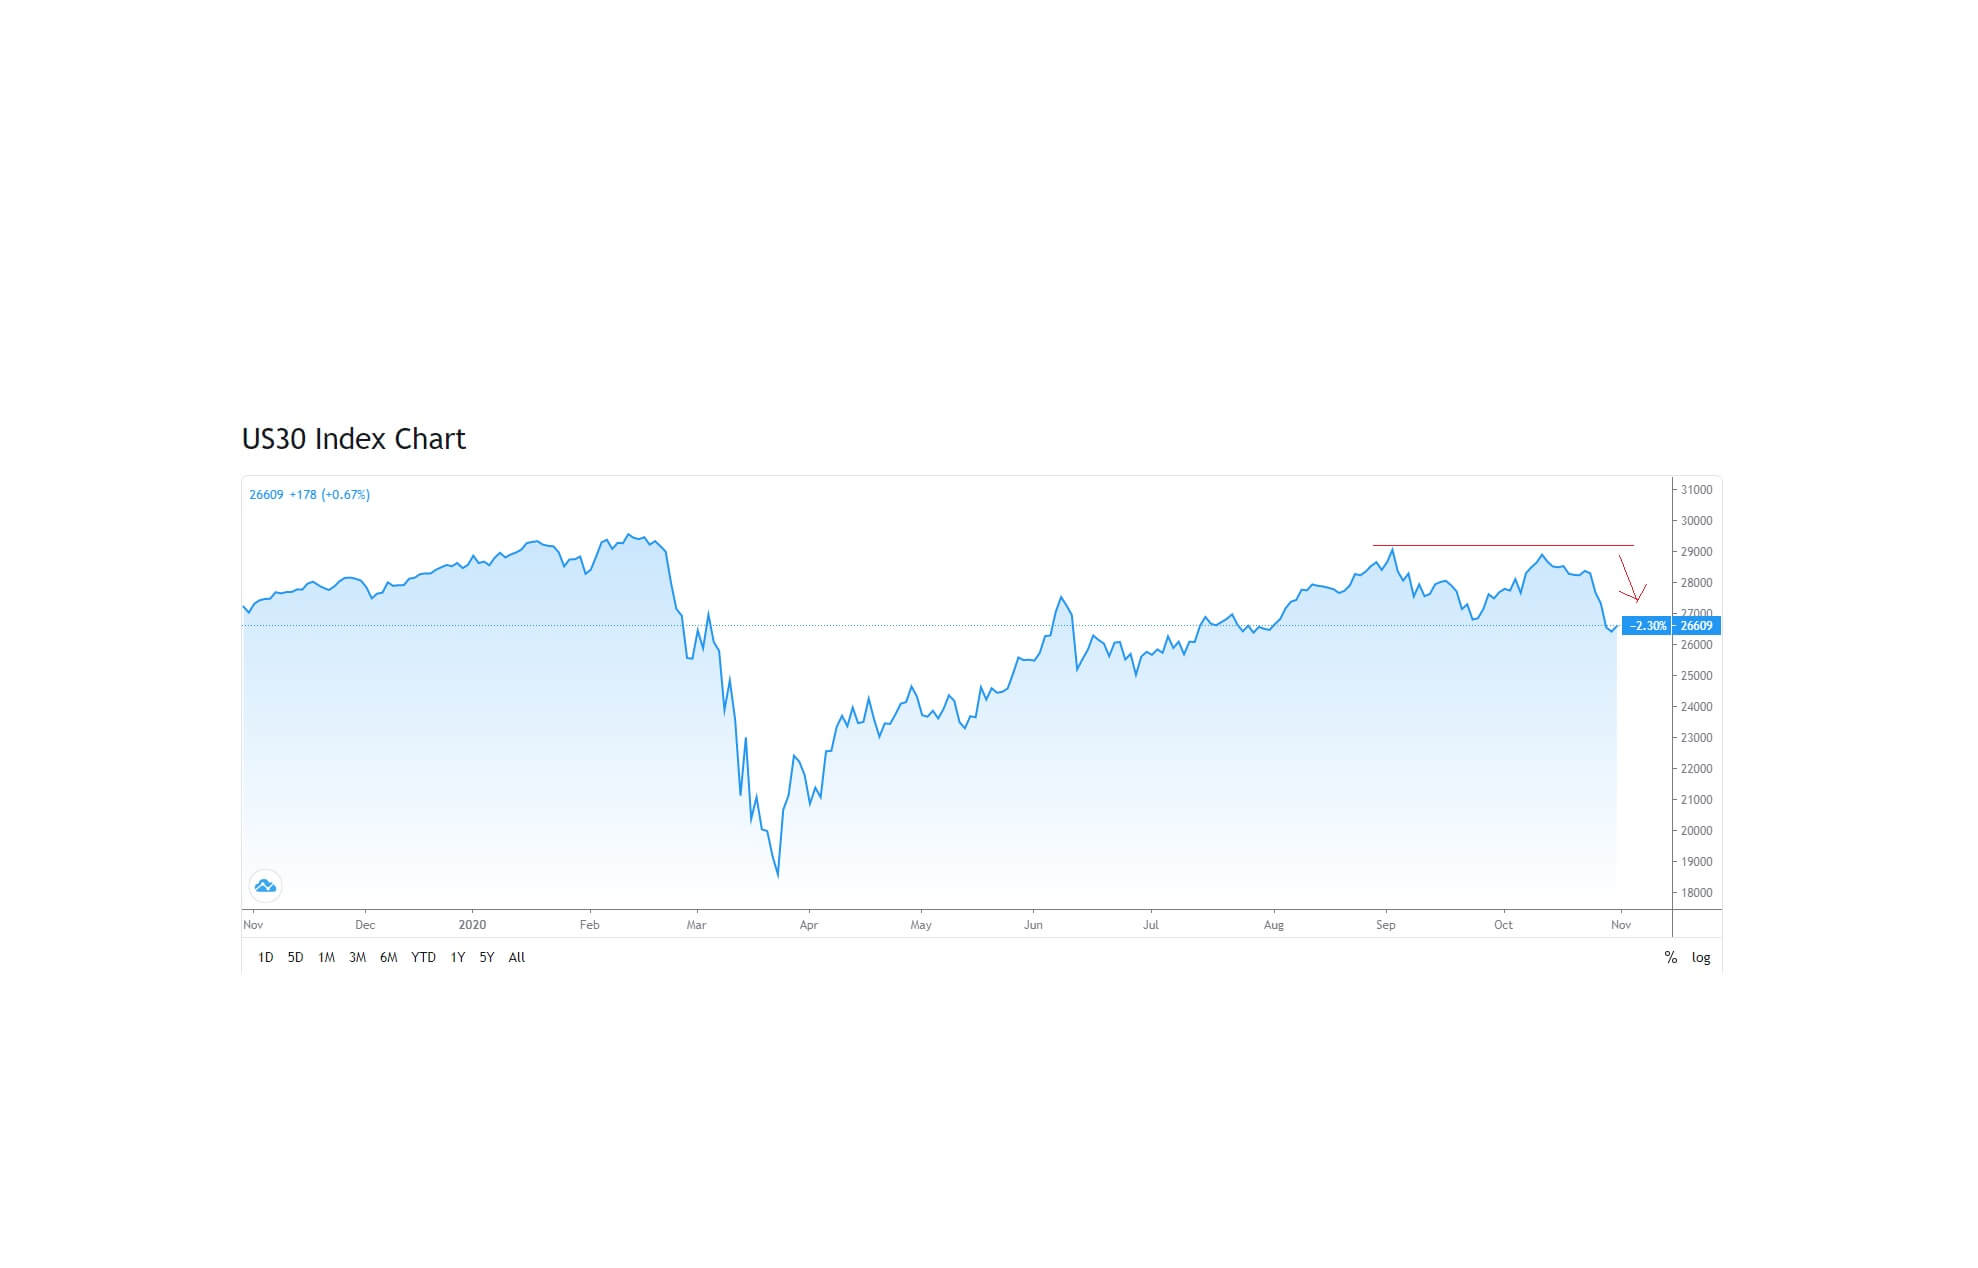
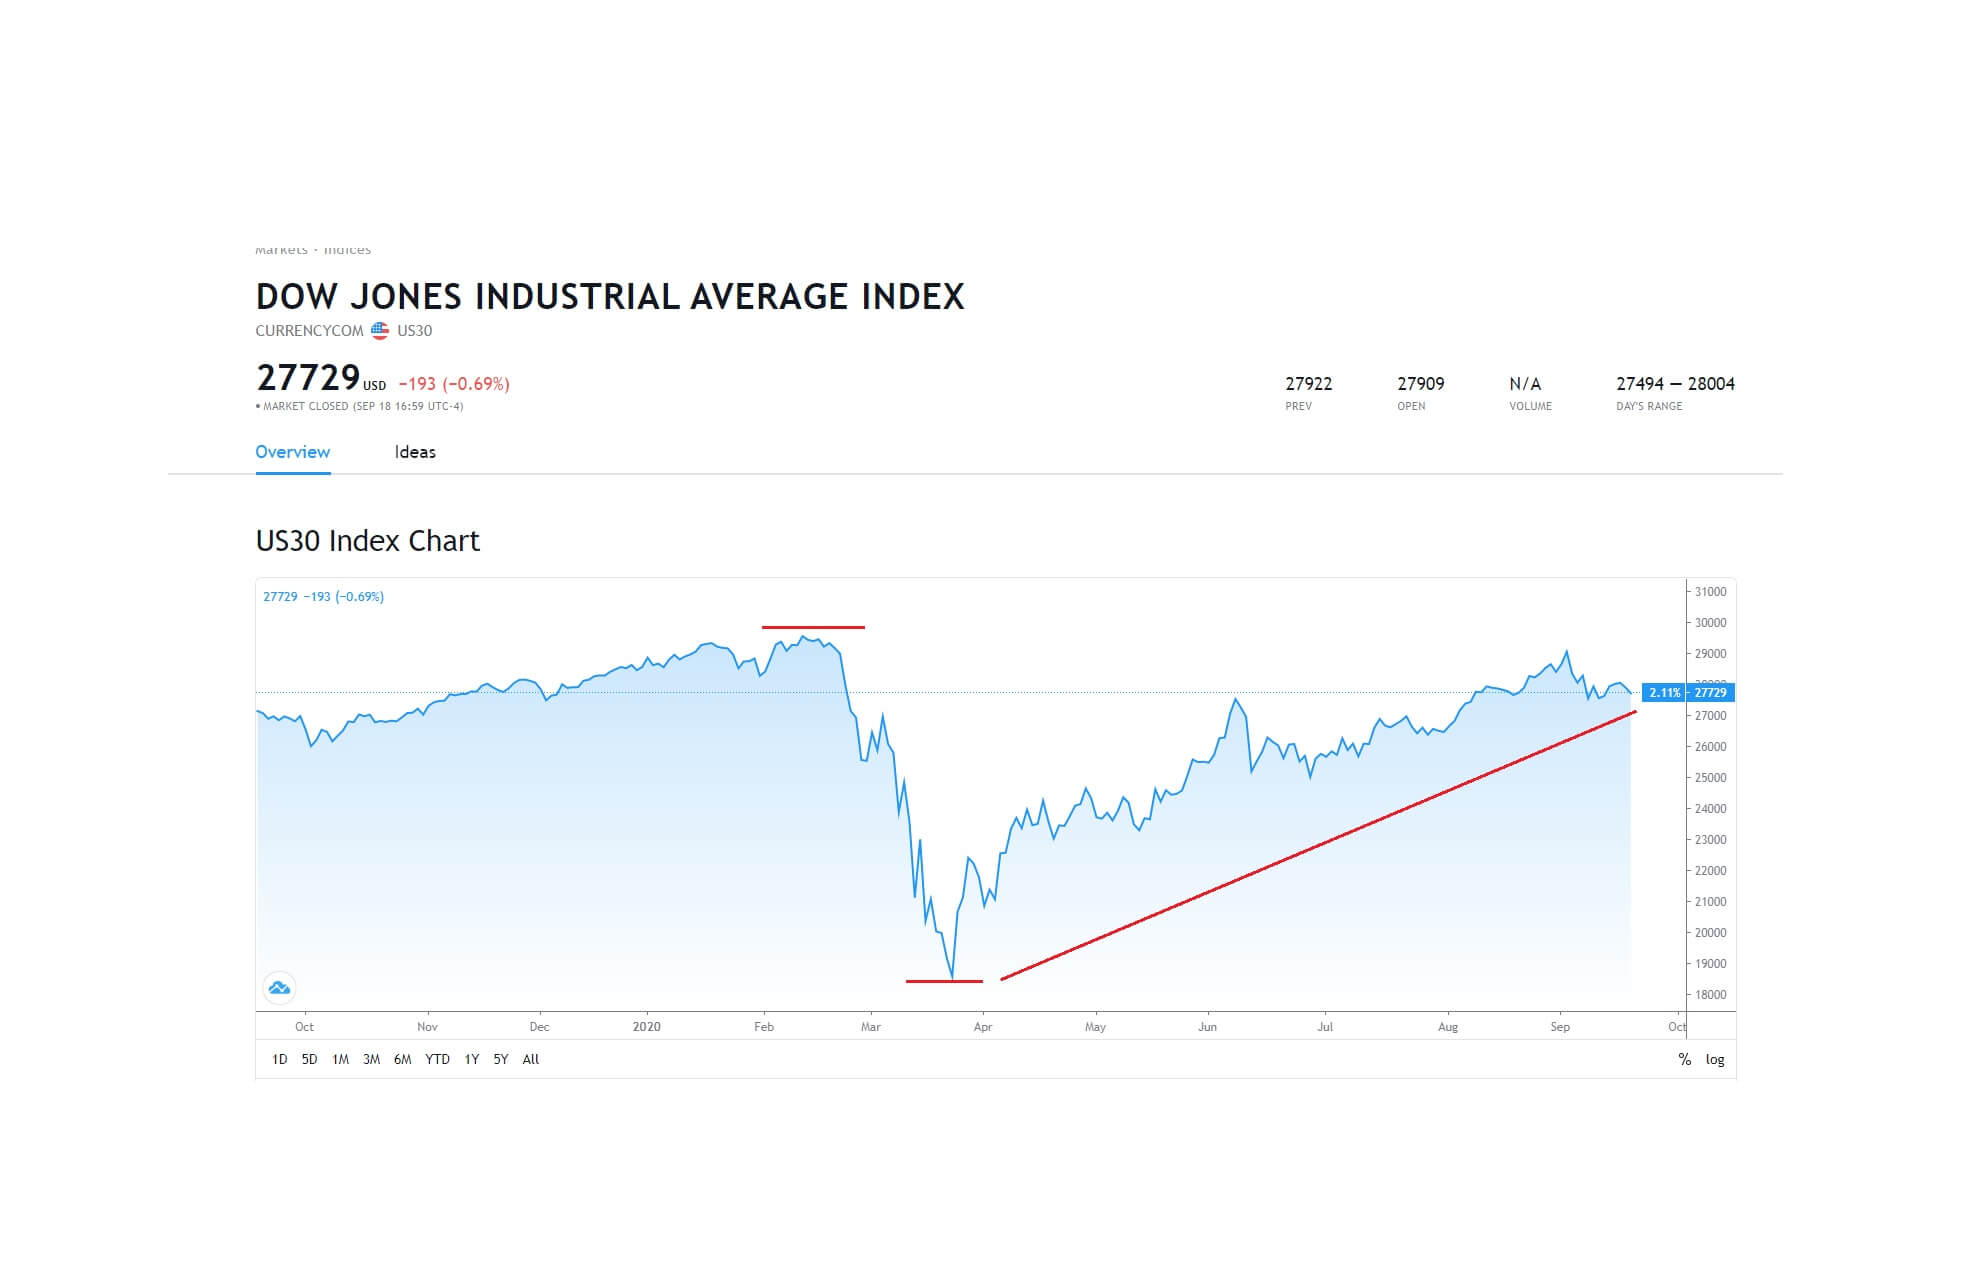
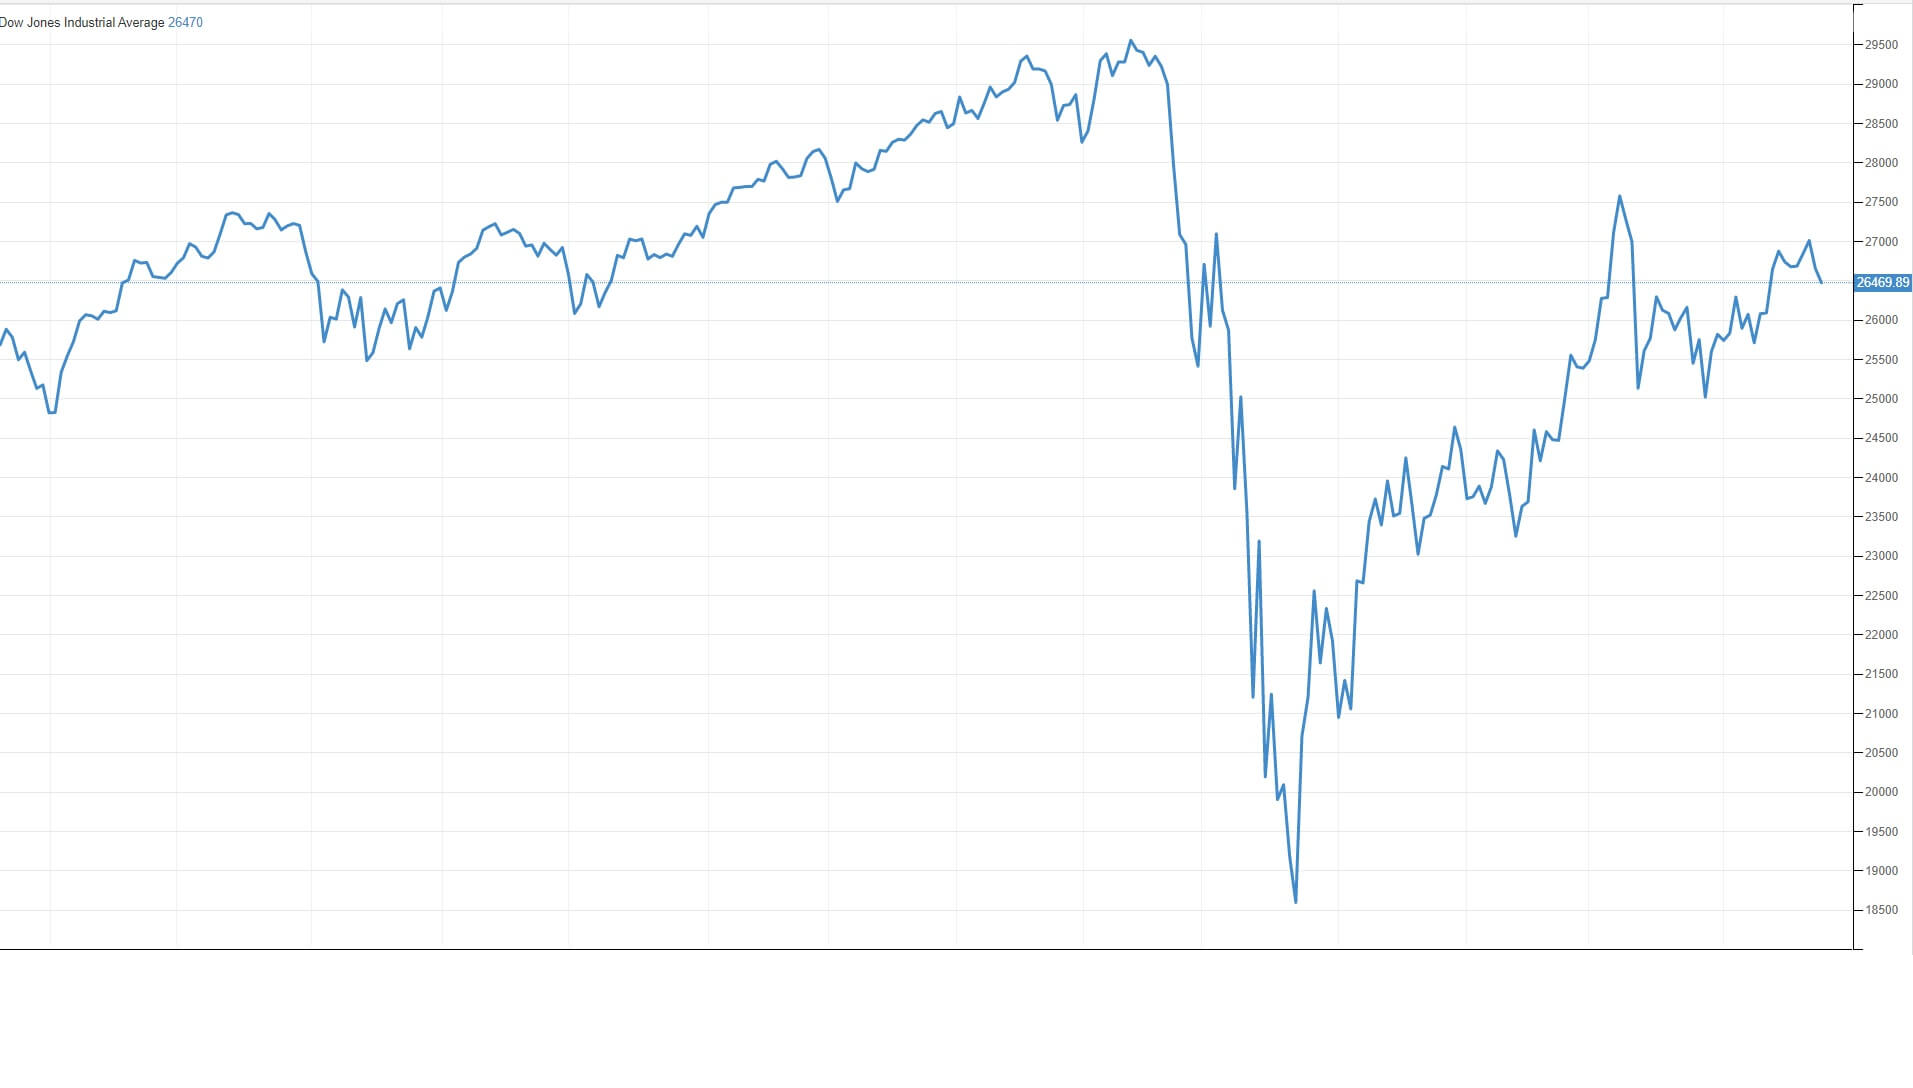
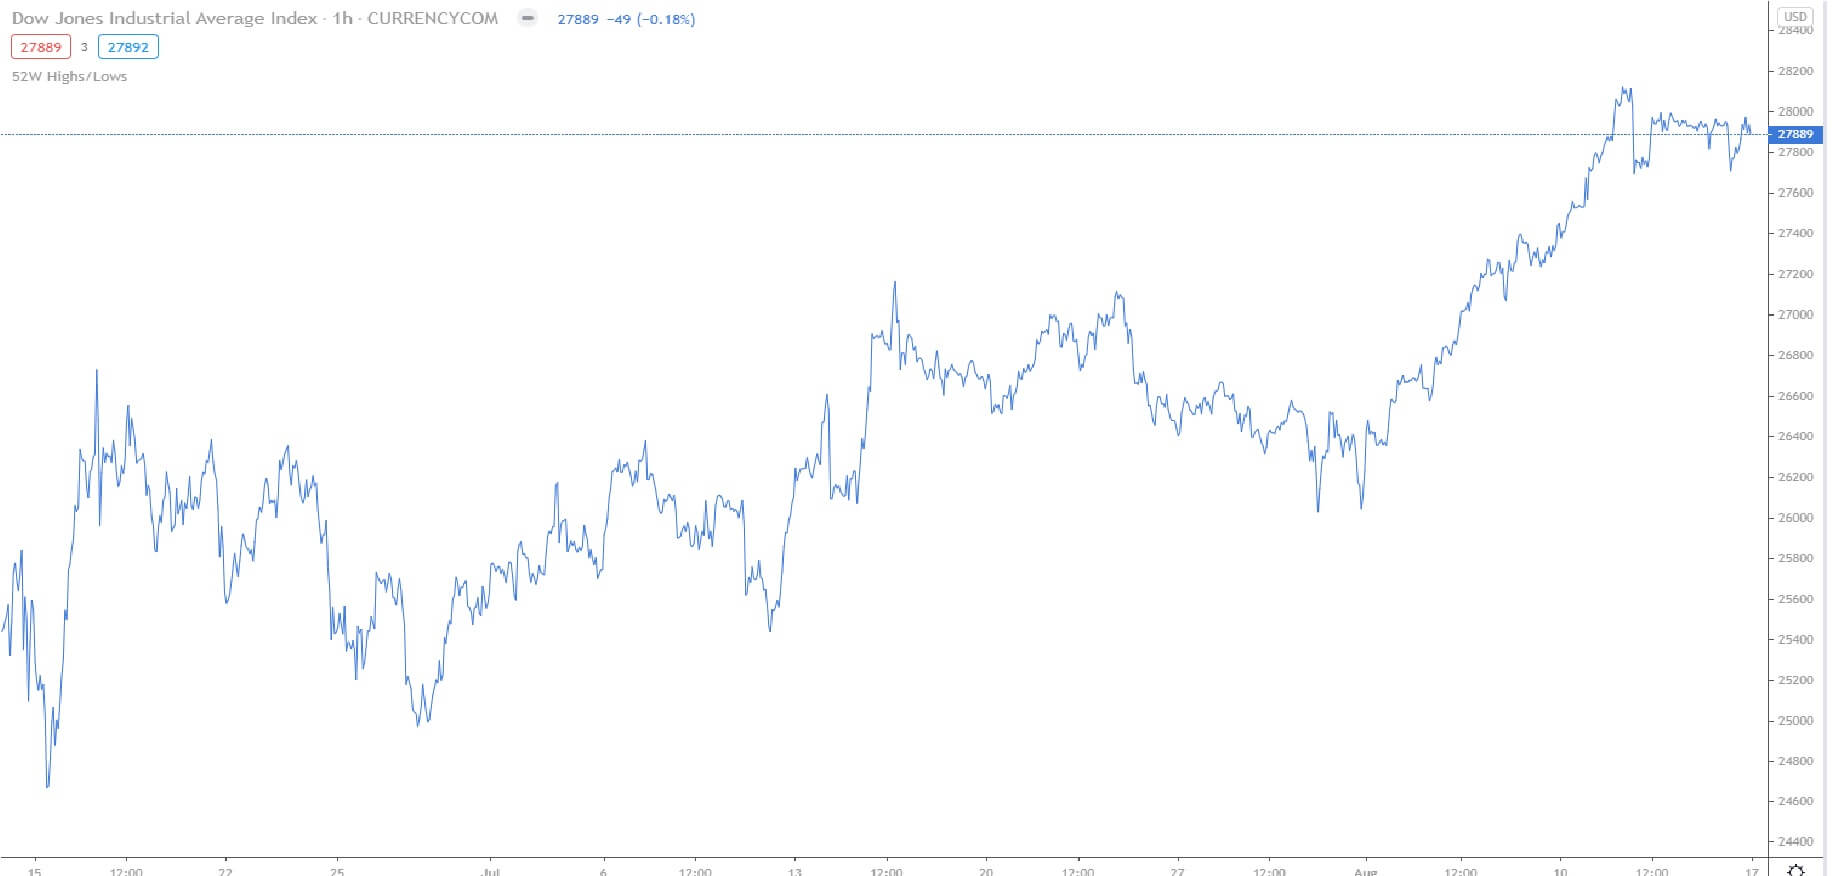
The effect in the markets was immediate, and almost every asset class saw volatility while traders and investors saw the news as bullish. The Dow Jones 30 index took the brunt of the volatility, where it had been fairly steady after the US Presidential election with relative calmness, and not selling off as expected when Joe Biden won, it went monstrously bid, rising by over 1500 points to an all-time record high of over 30.000 before pulling back due to profit-taking.

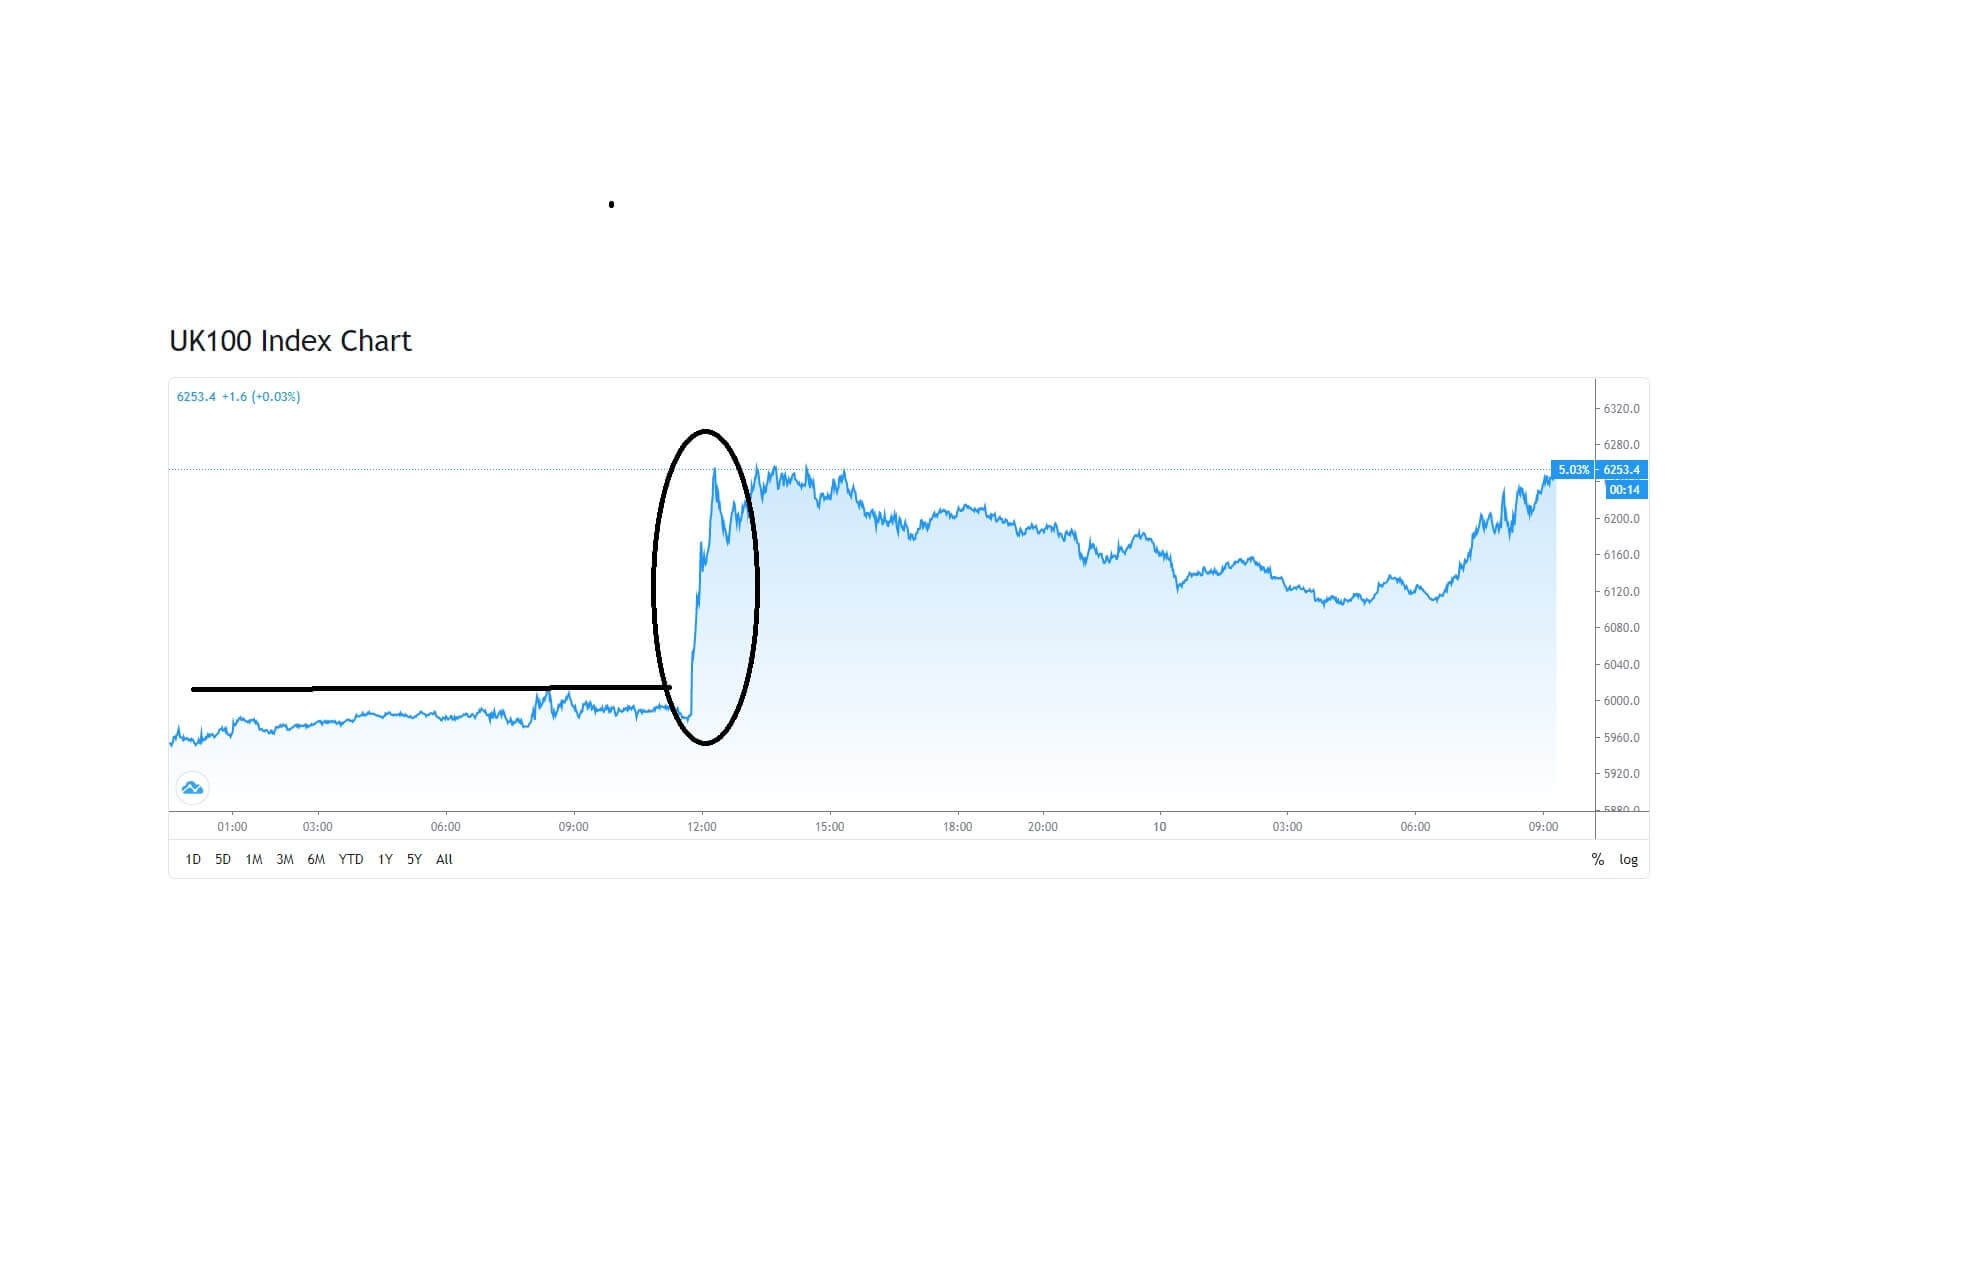
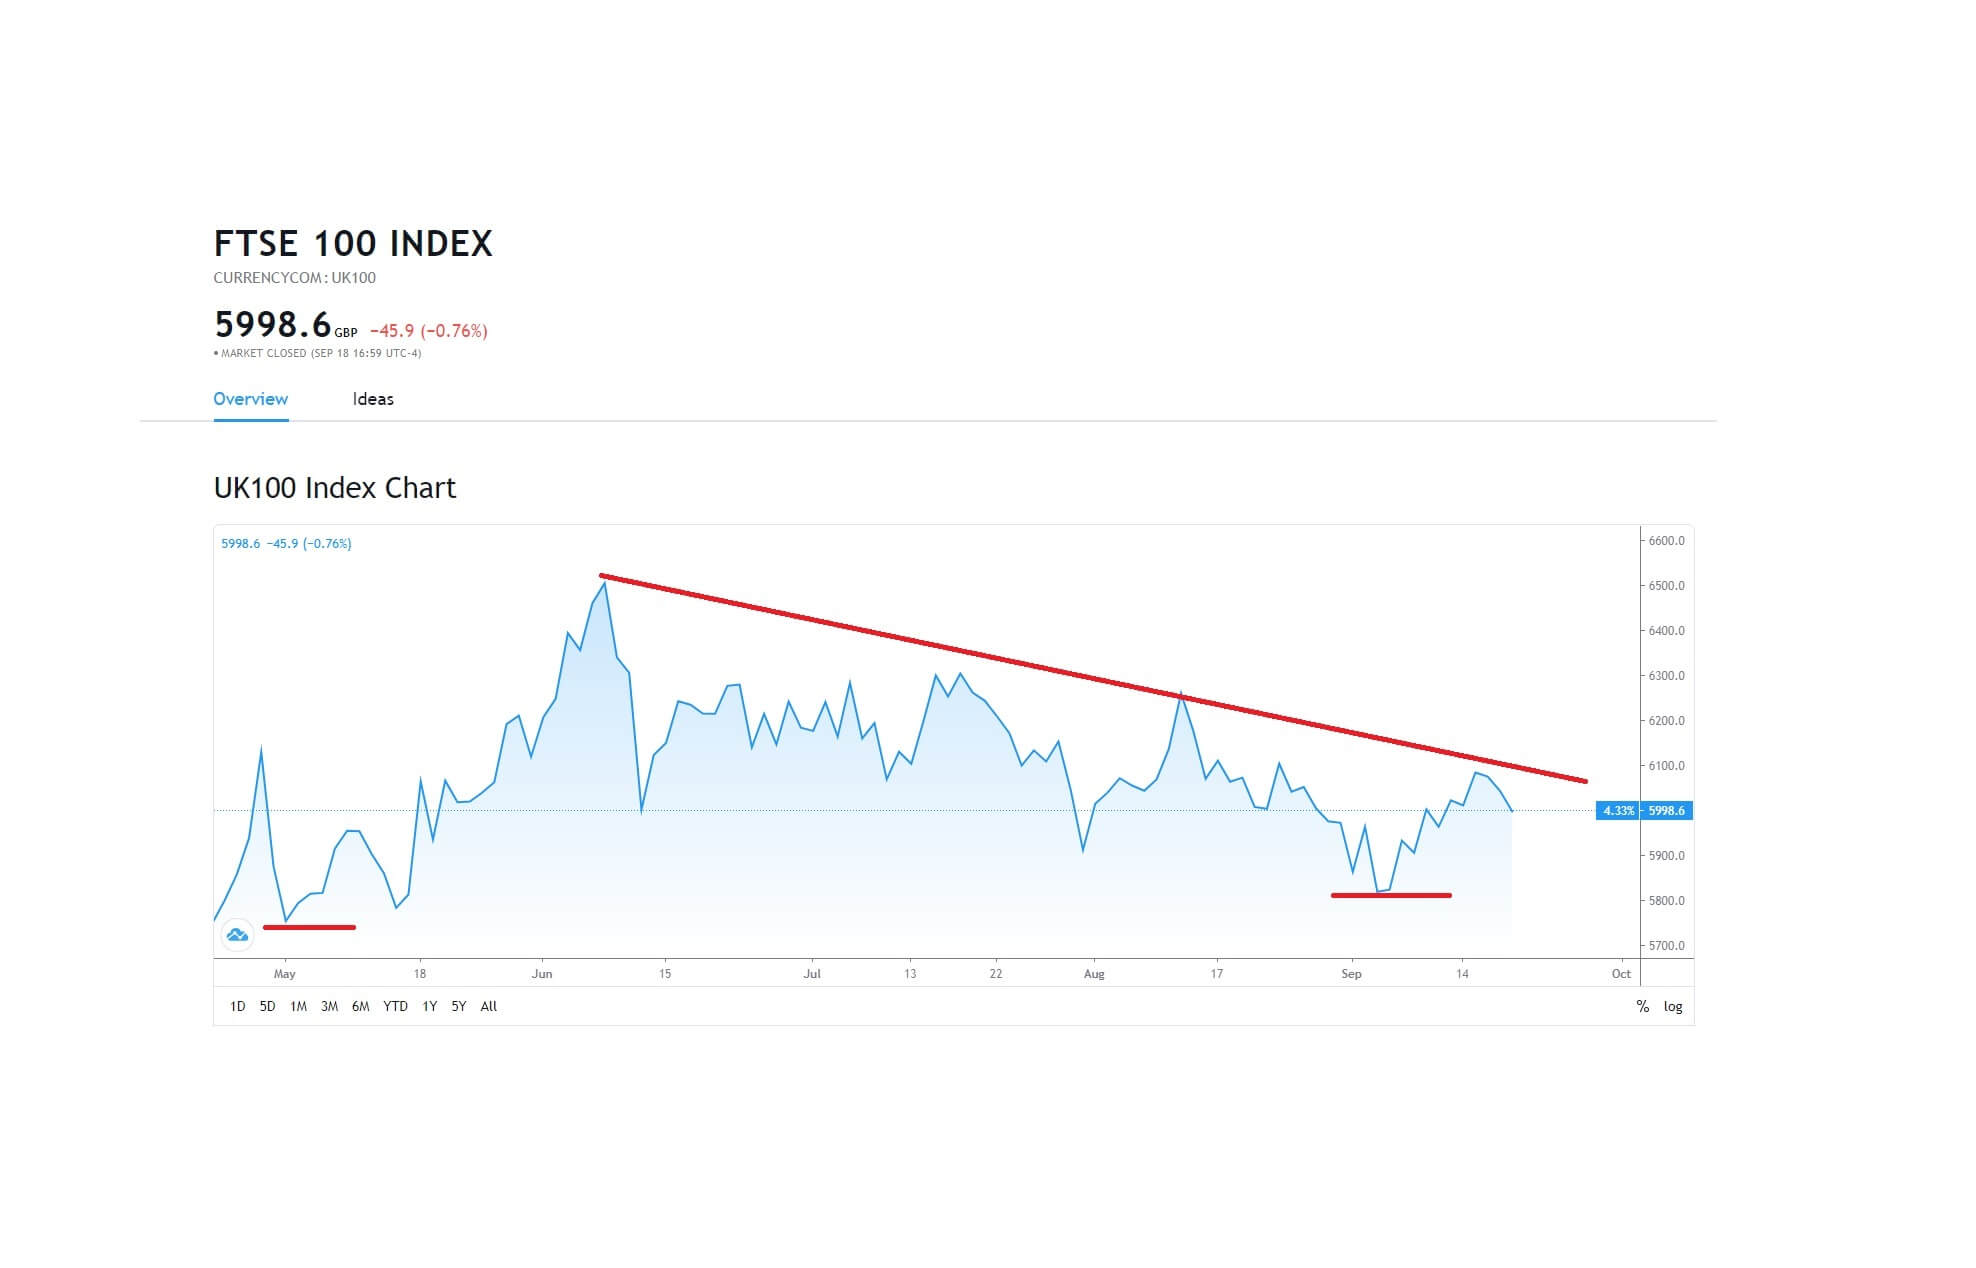
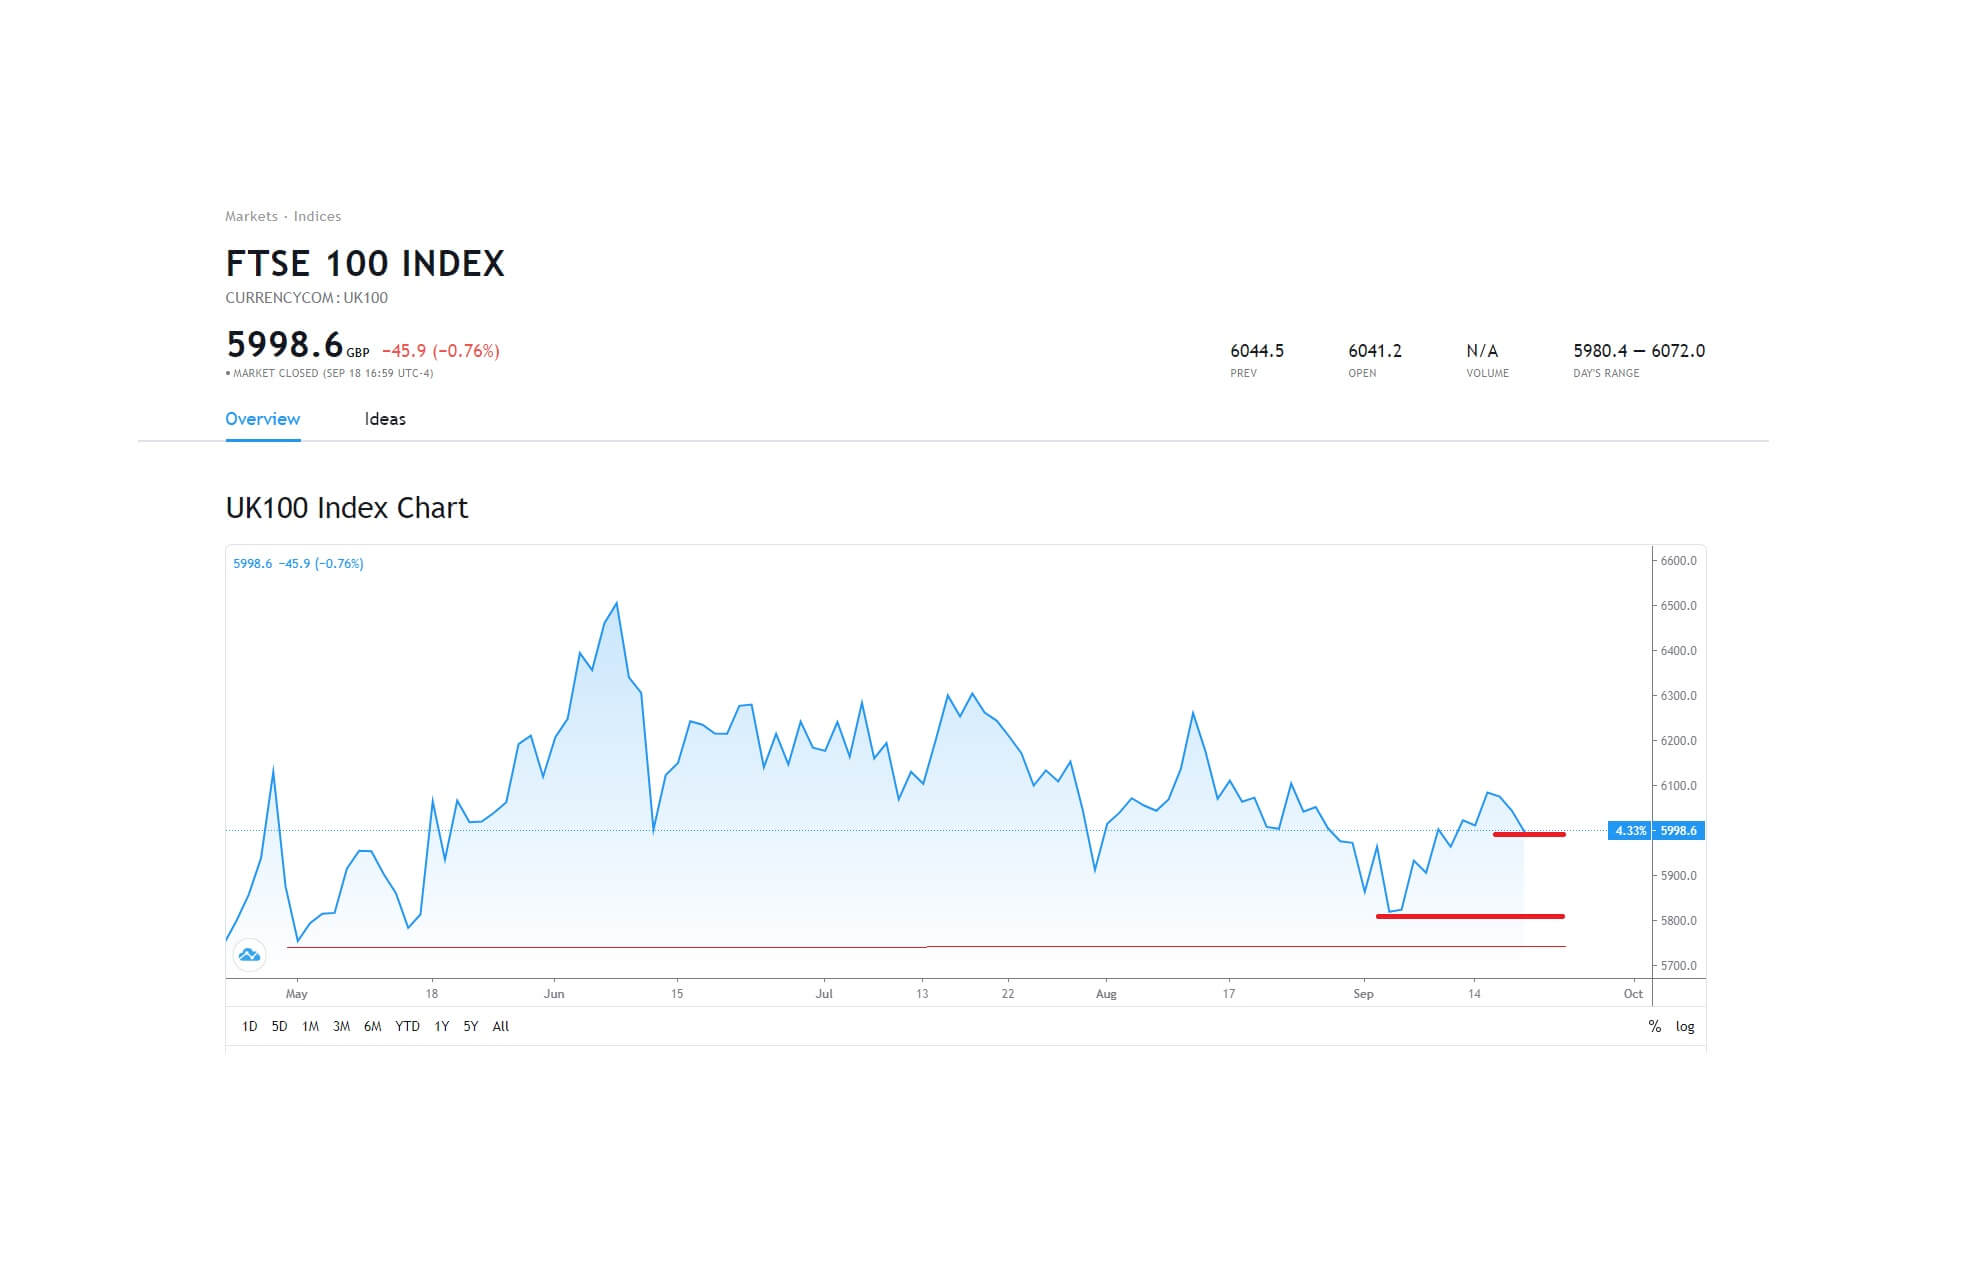
The FTSE 100, which had also been flatlining, also punched above the previous 6.000 ceiling to record a 5% bull move.

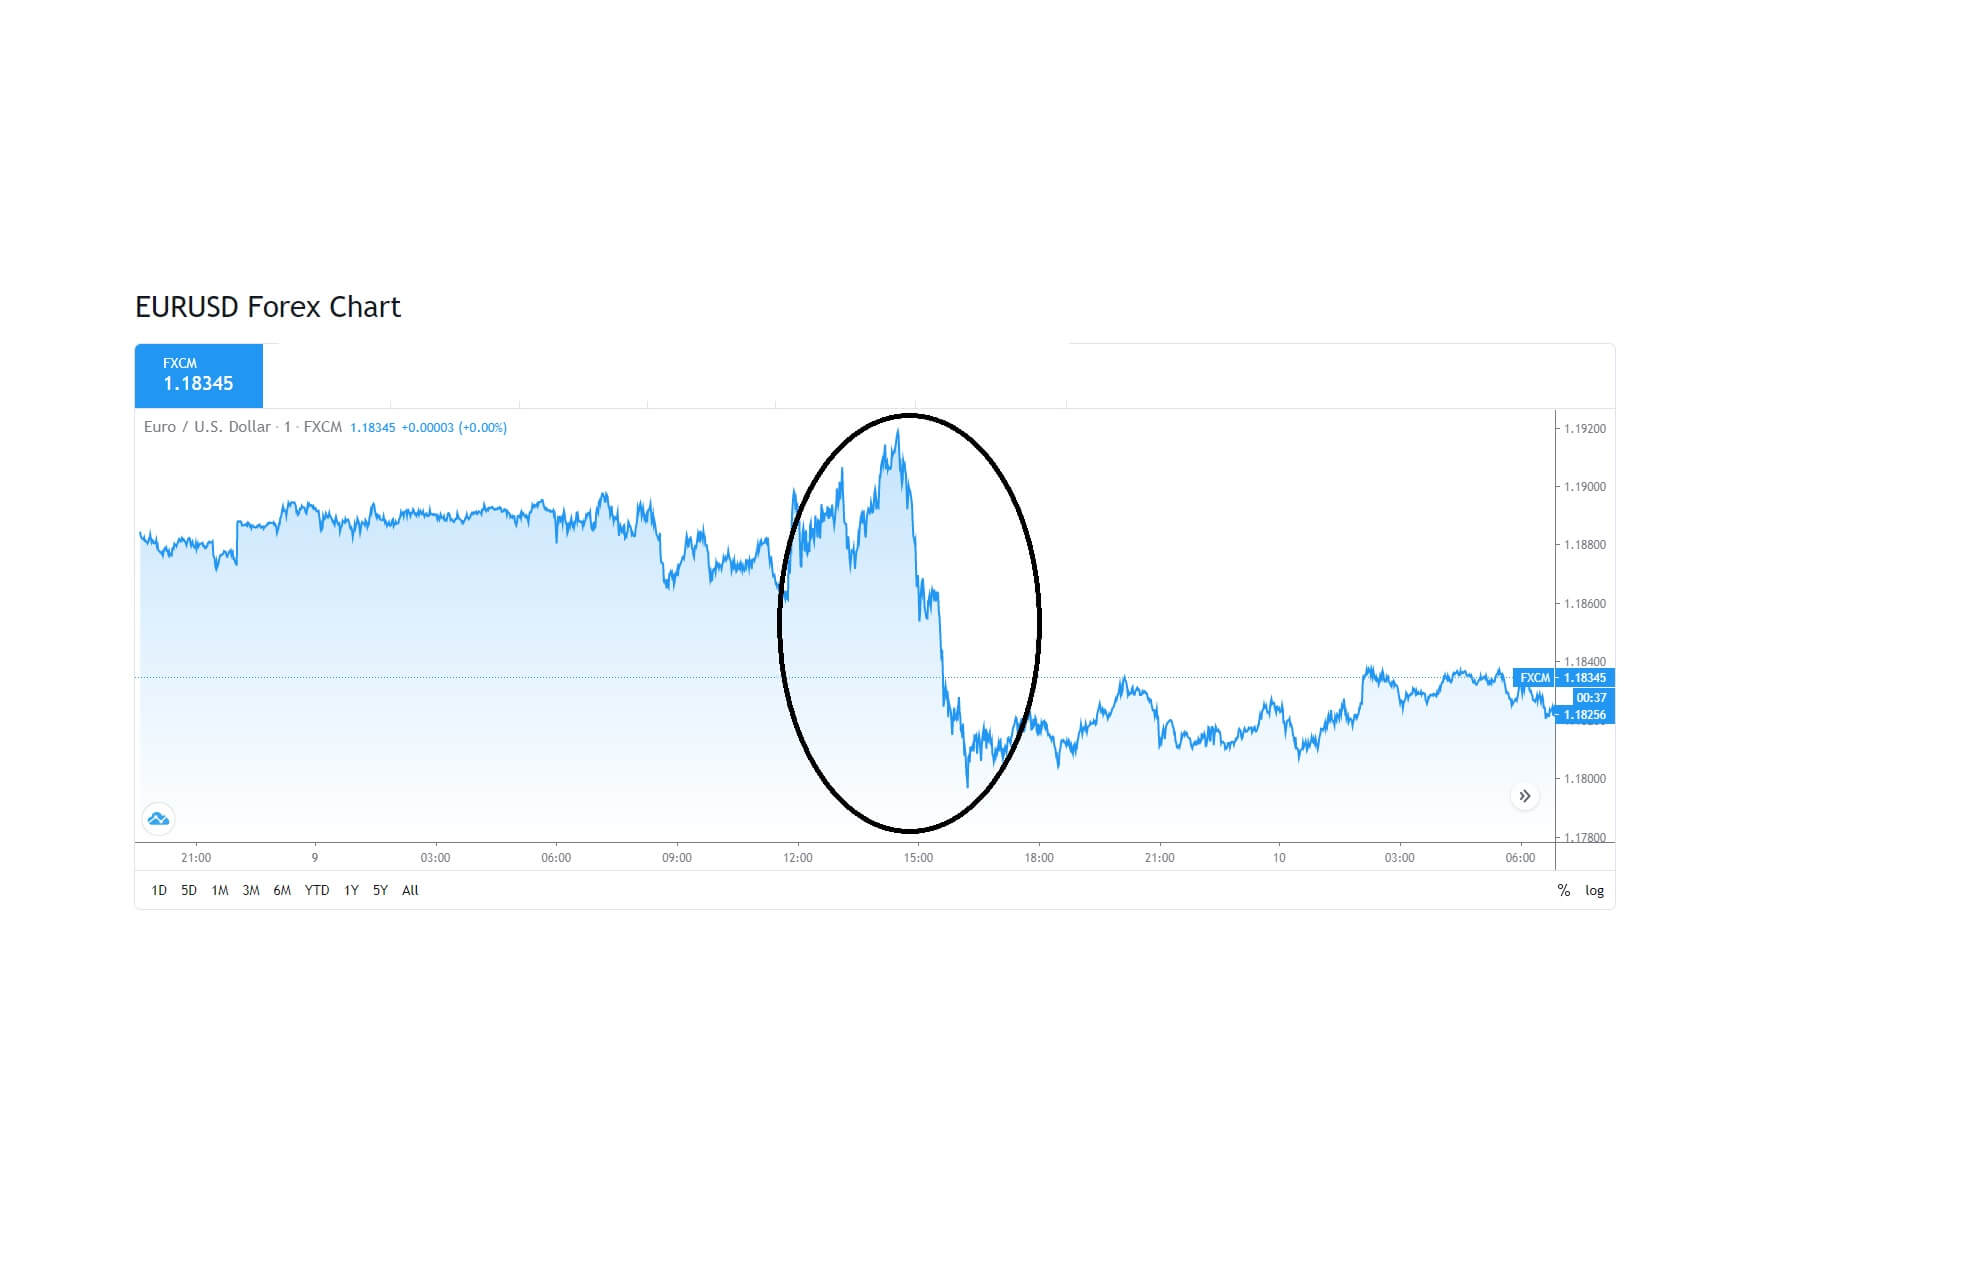
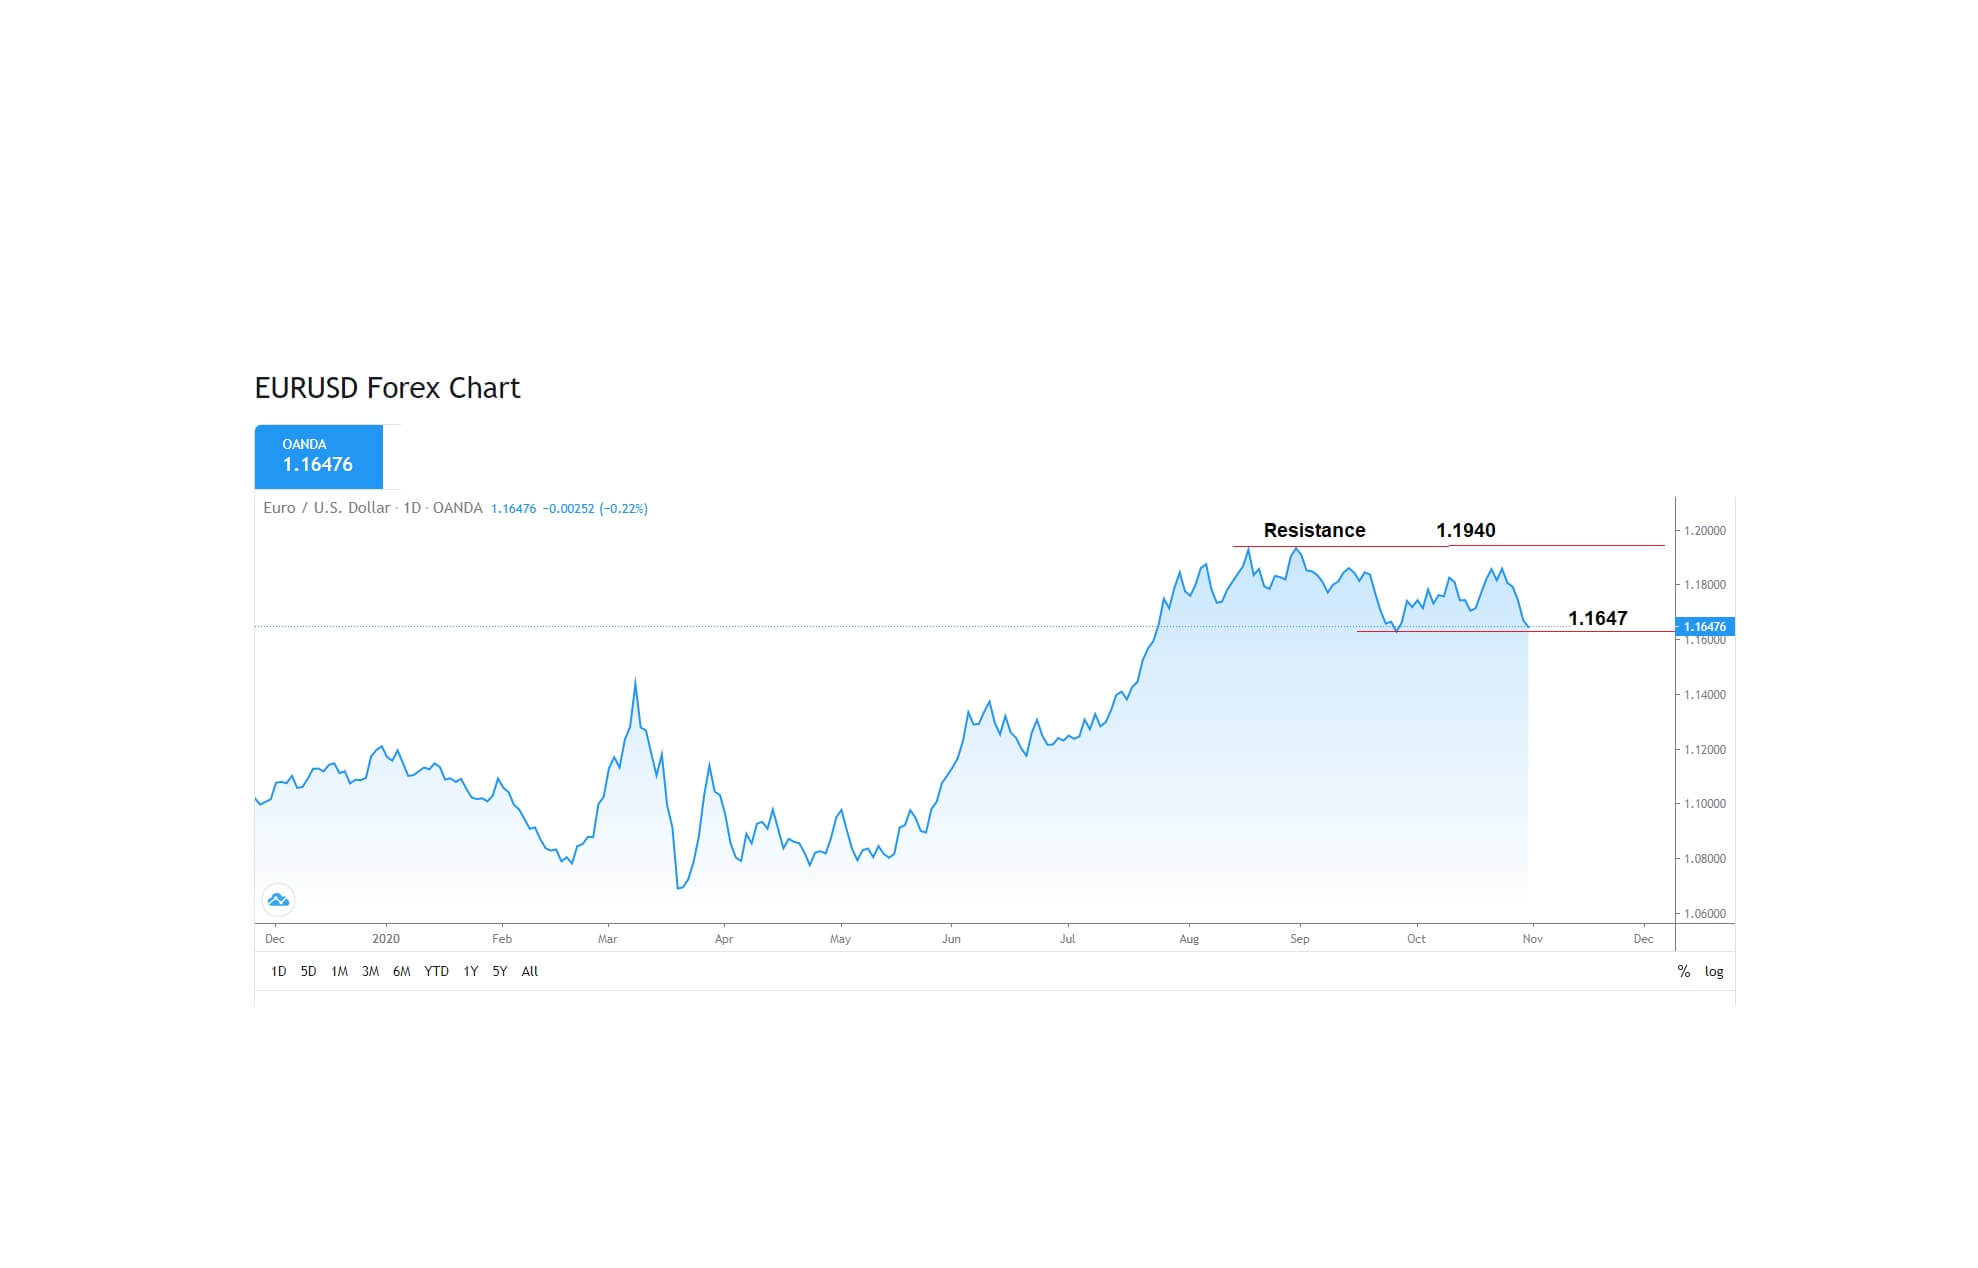
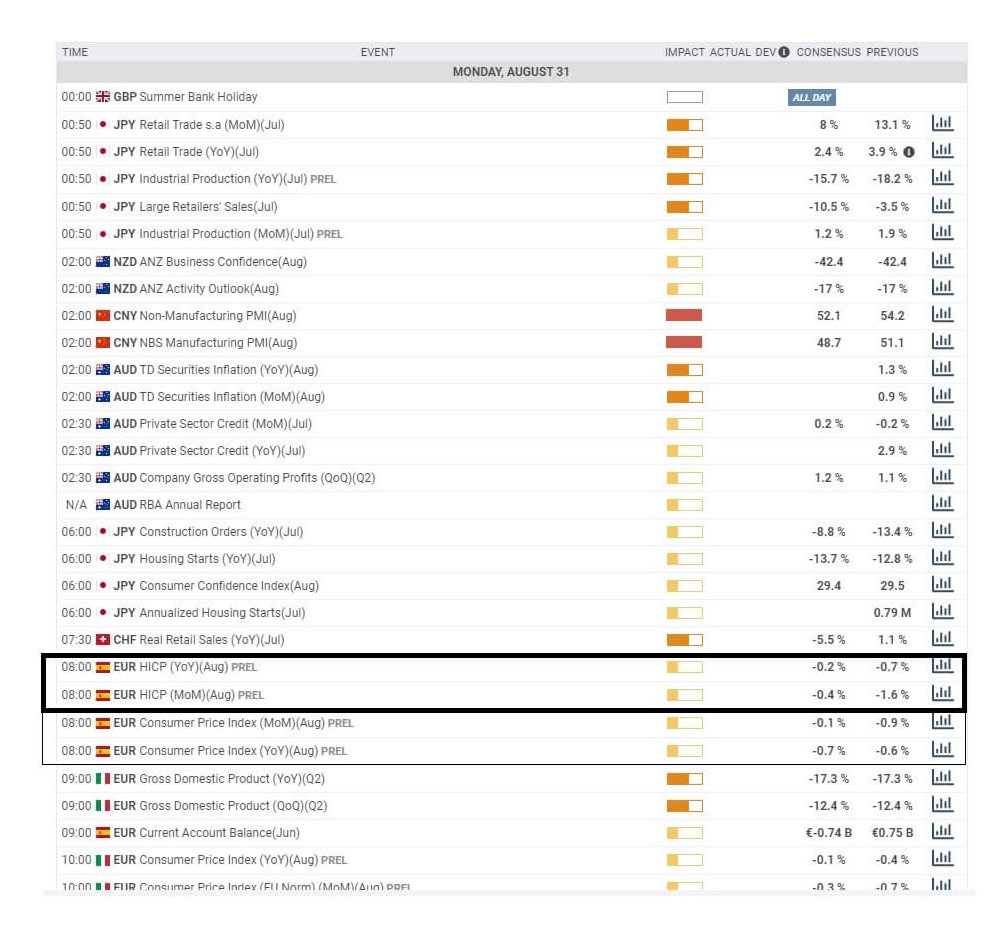
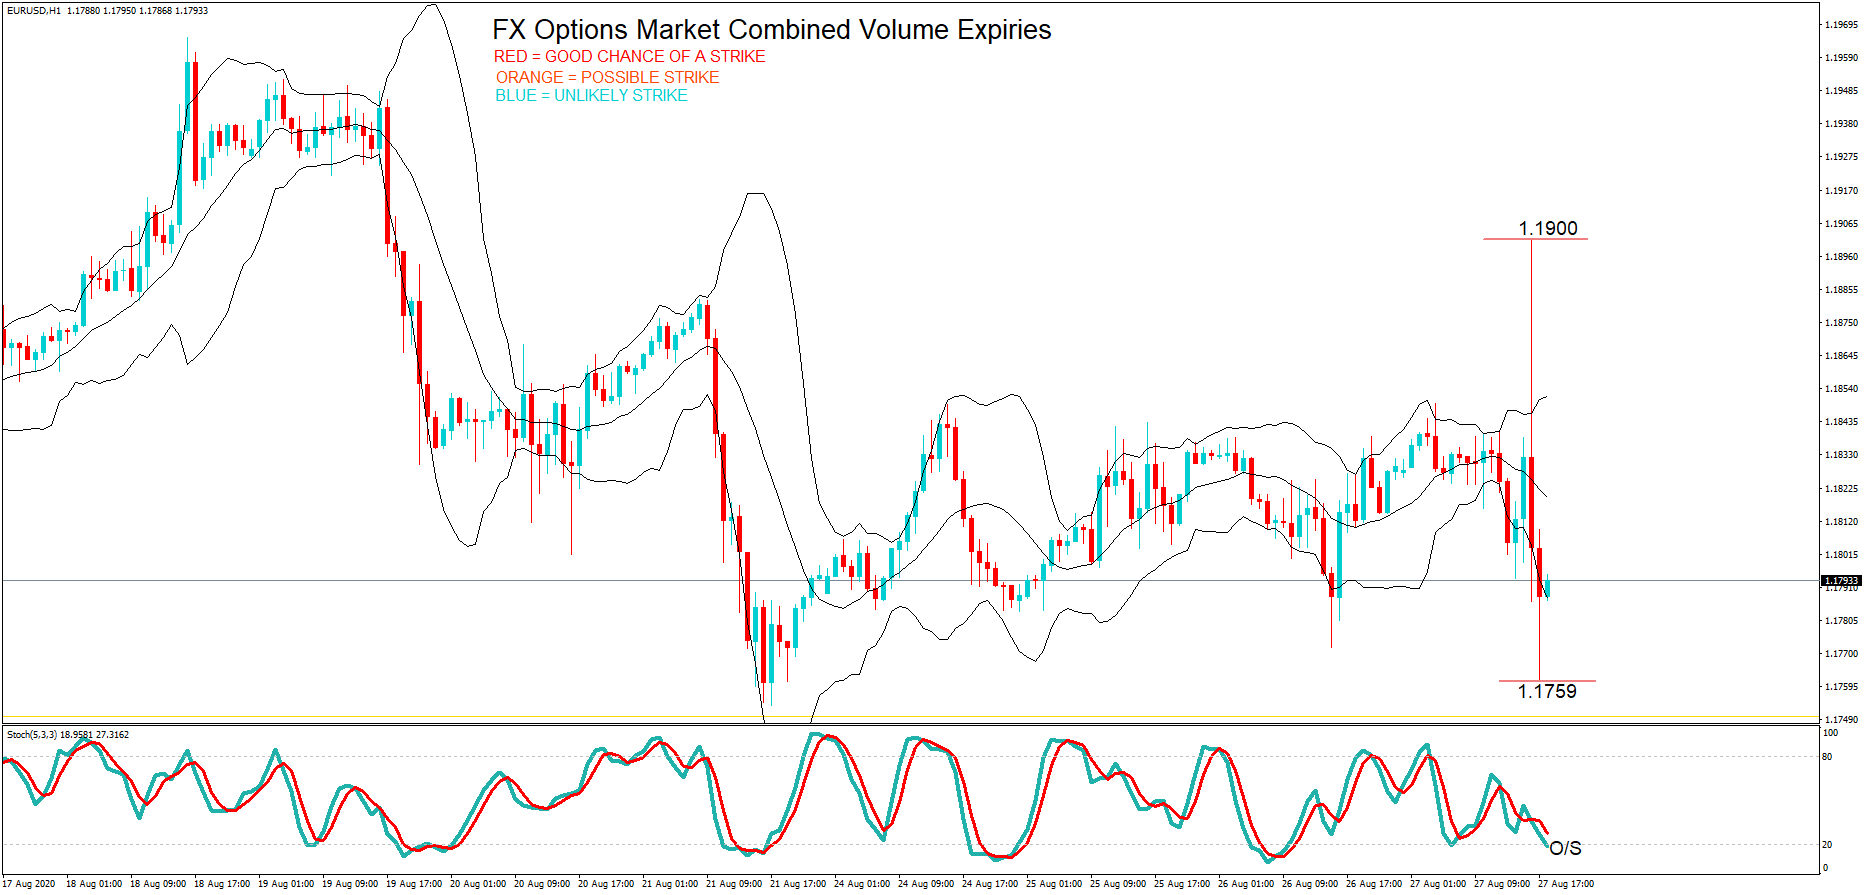
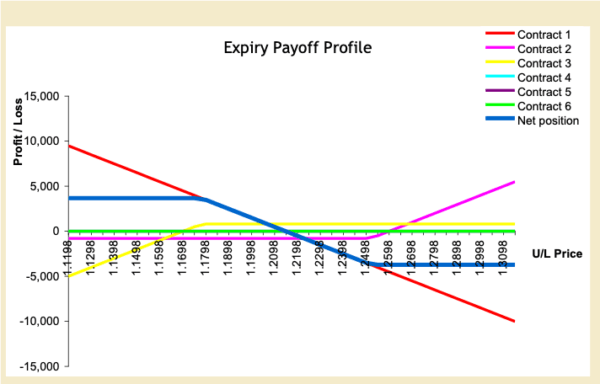
The EURUSD pair saw a jolt of heaving buying to a high of 1.1920 before heavy selling pushed the pair to below 1.1800

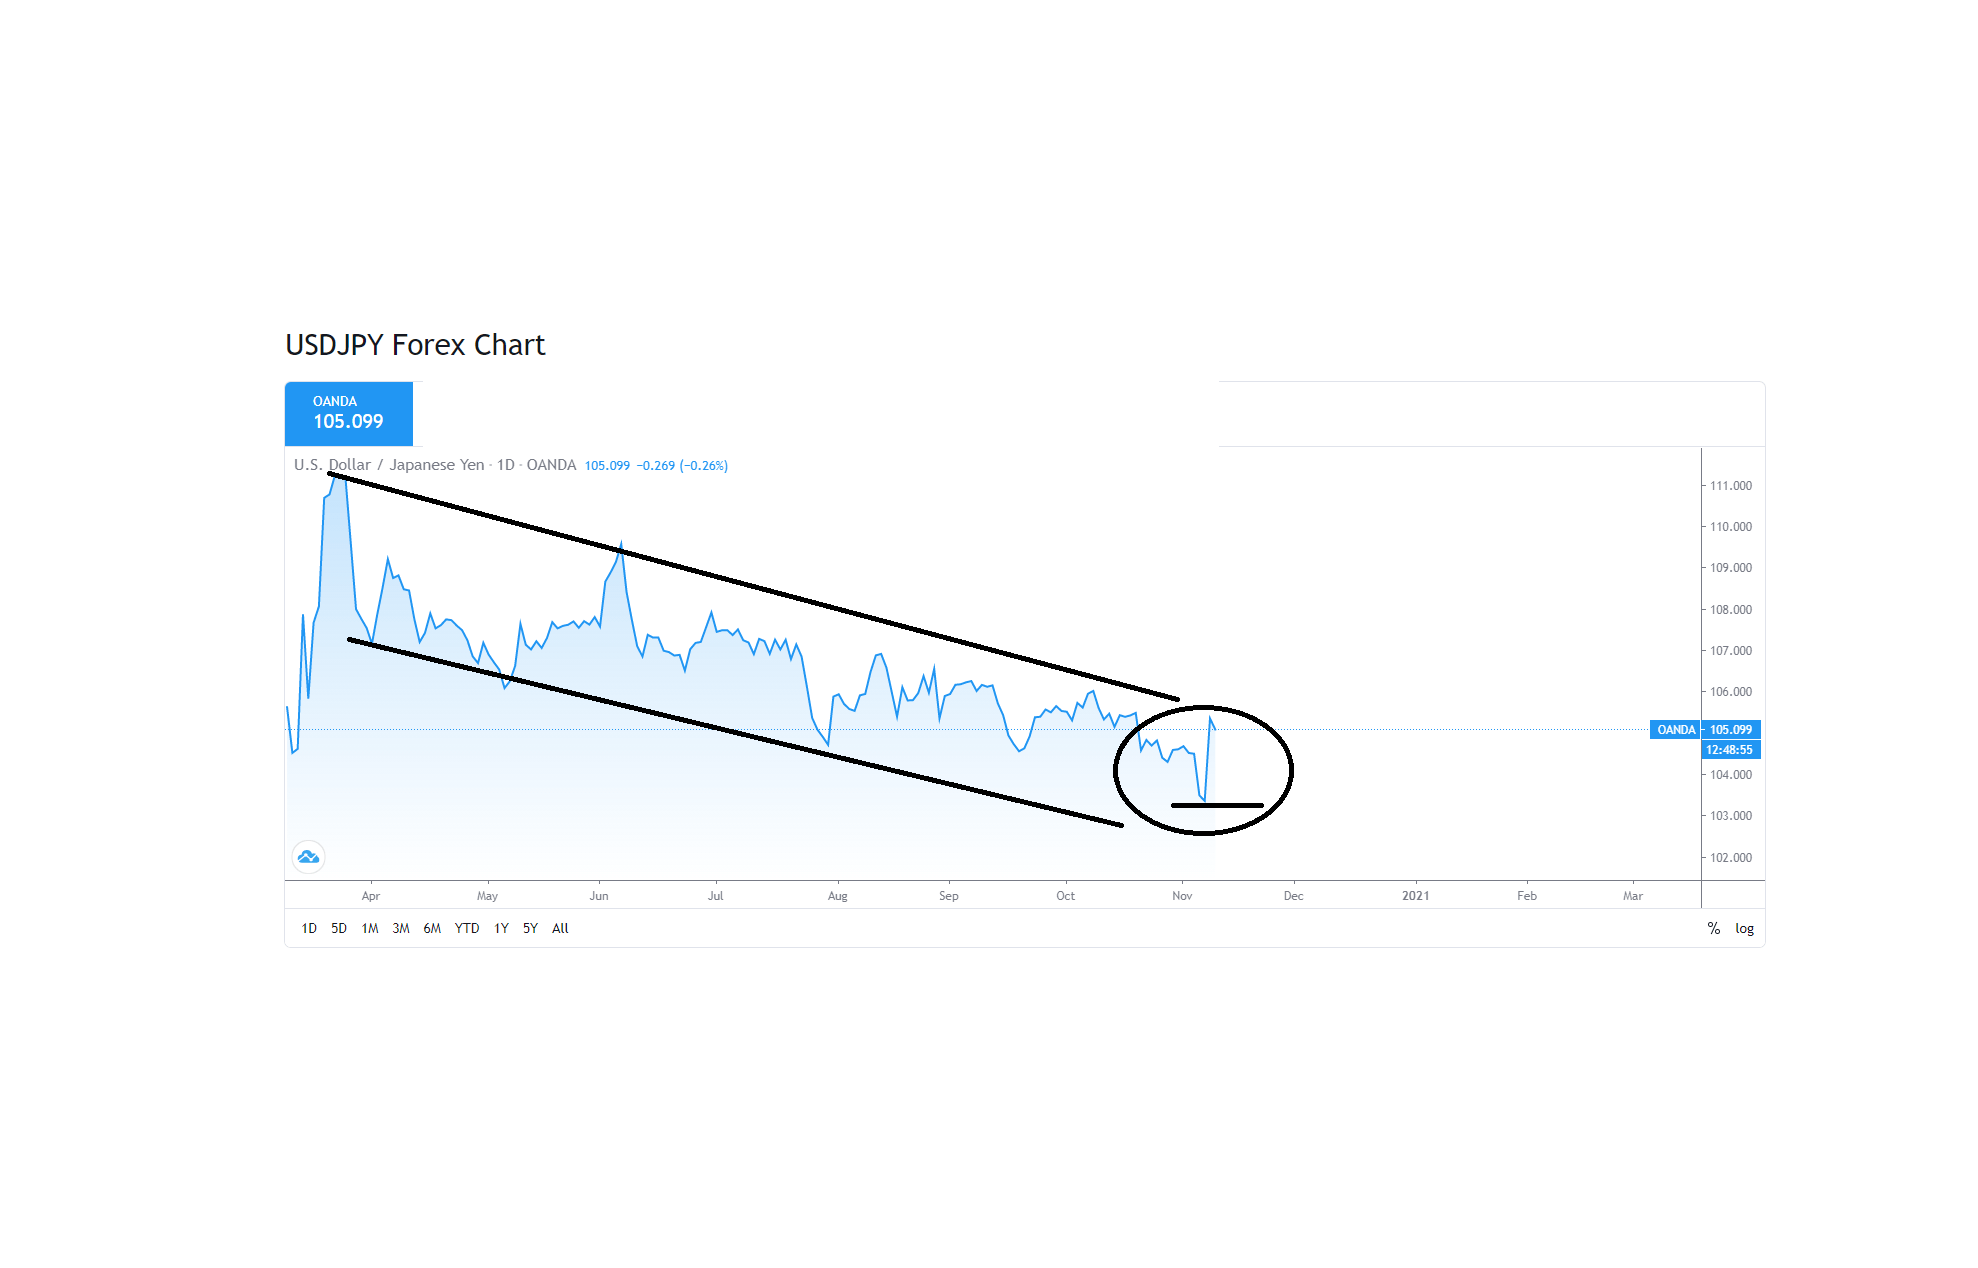
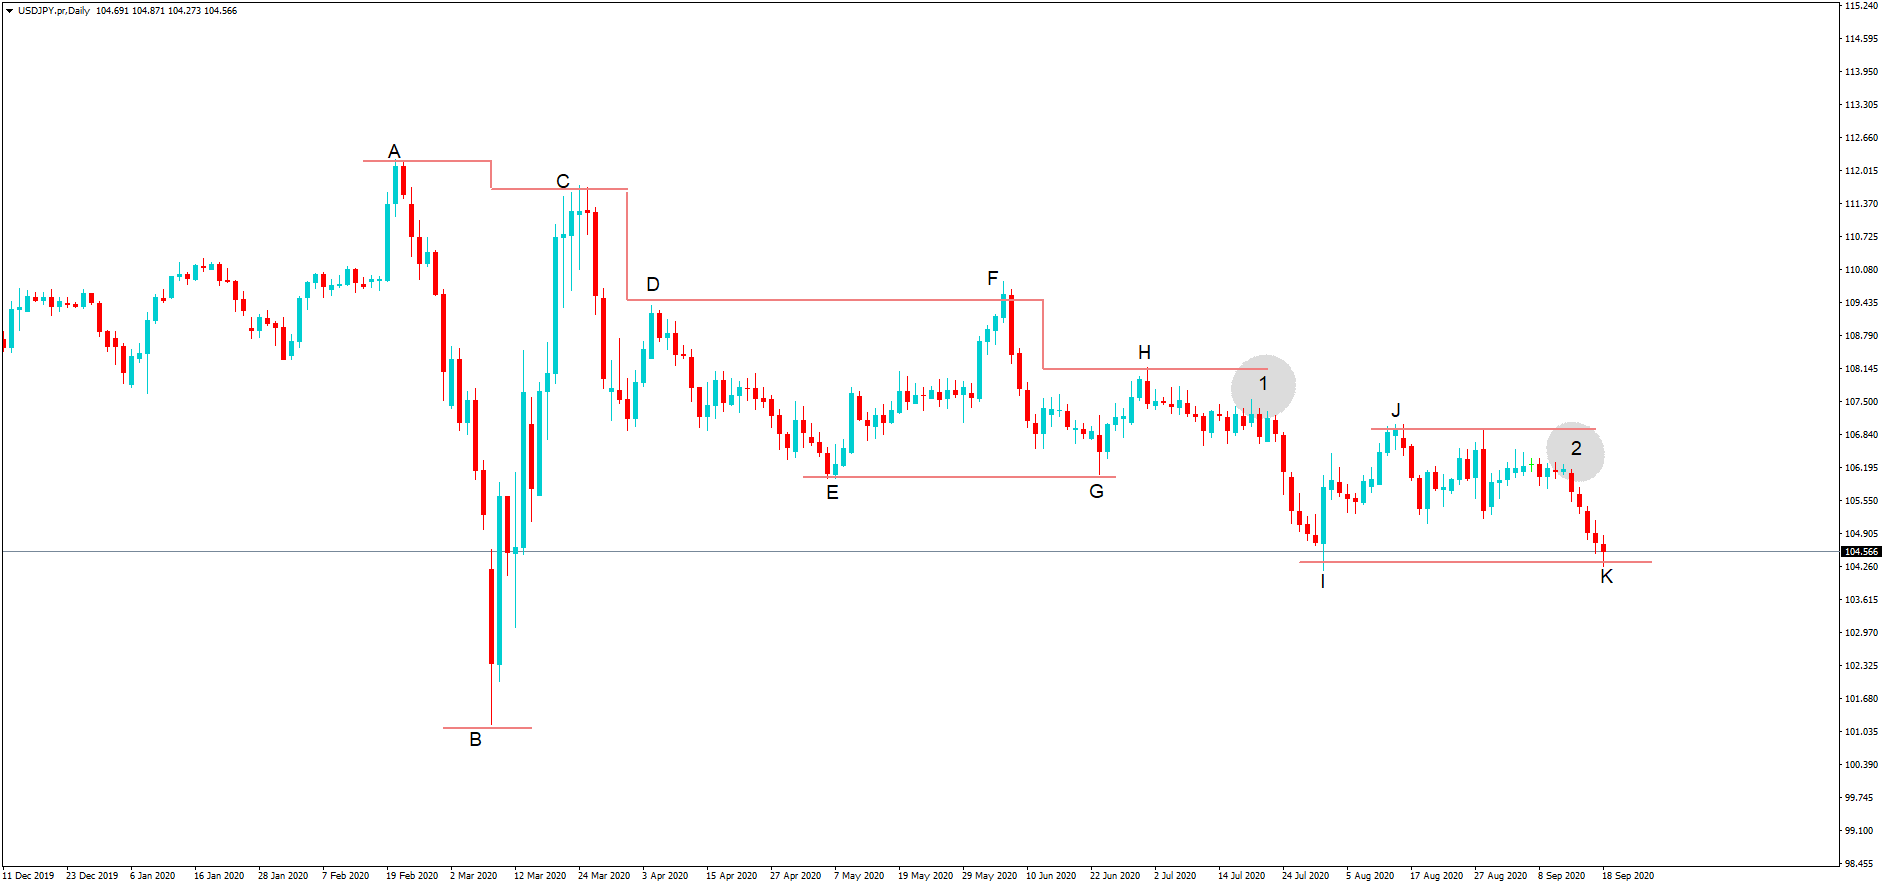
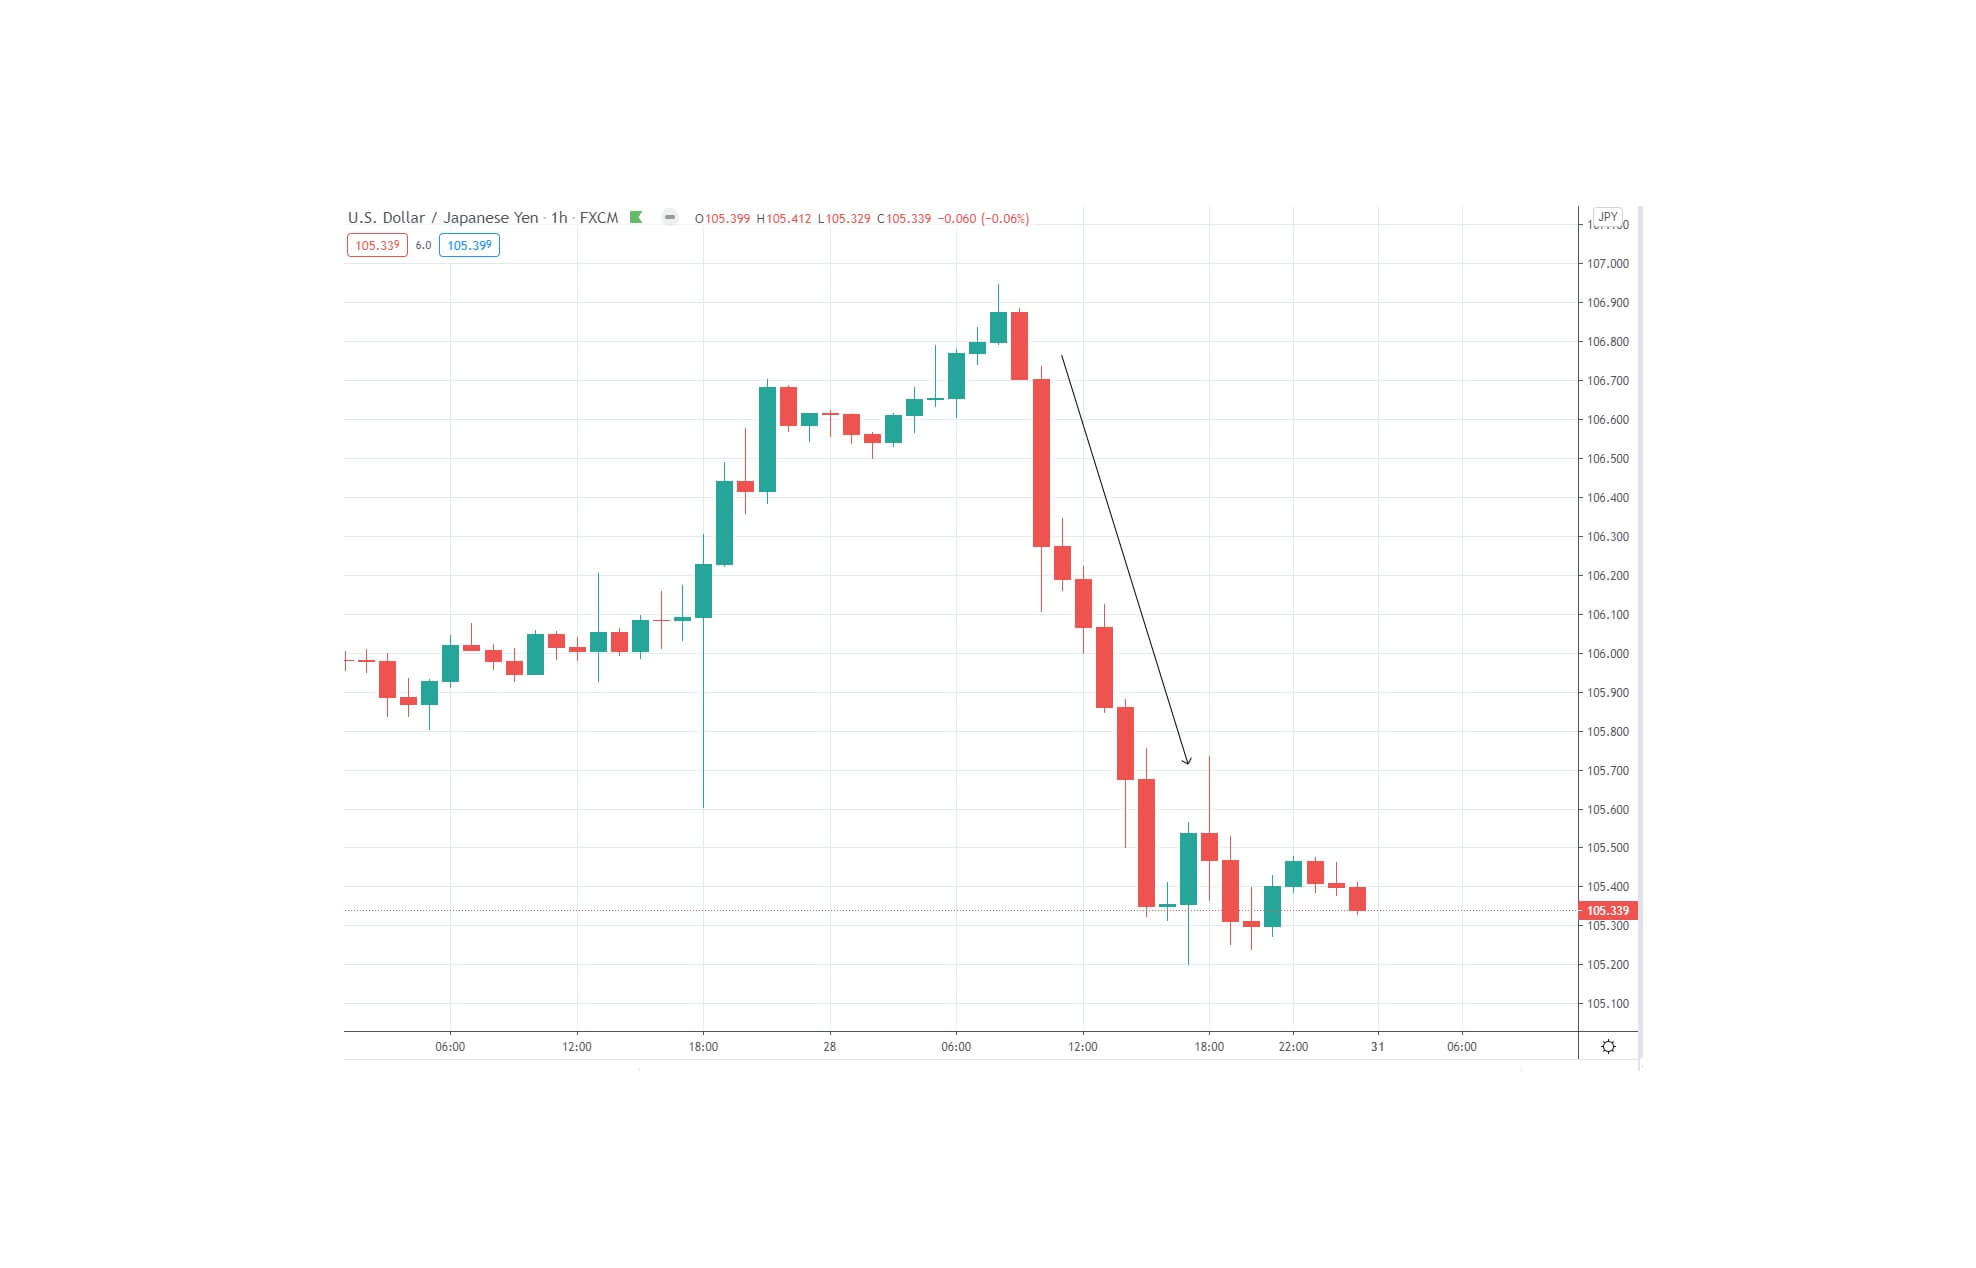
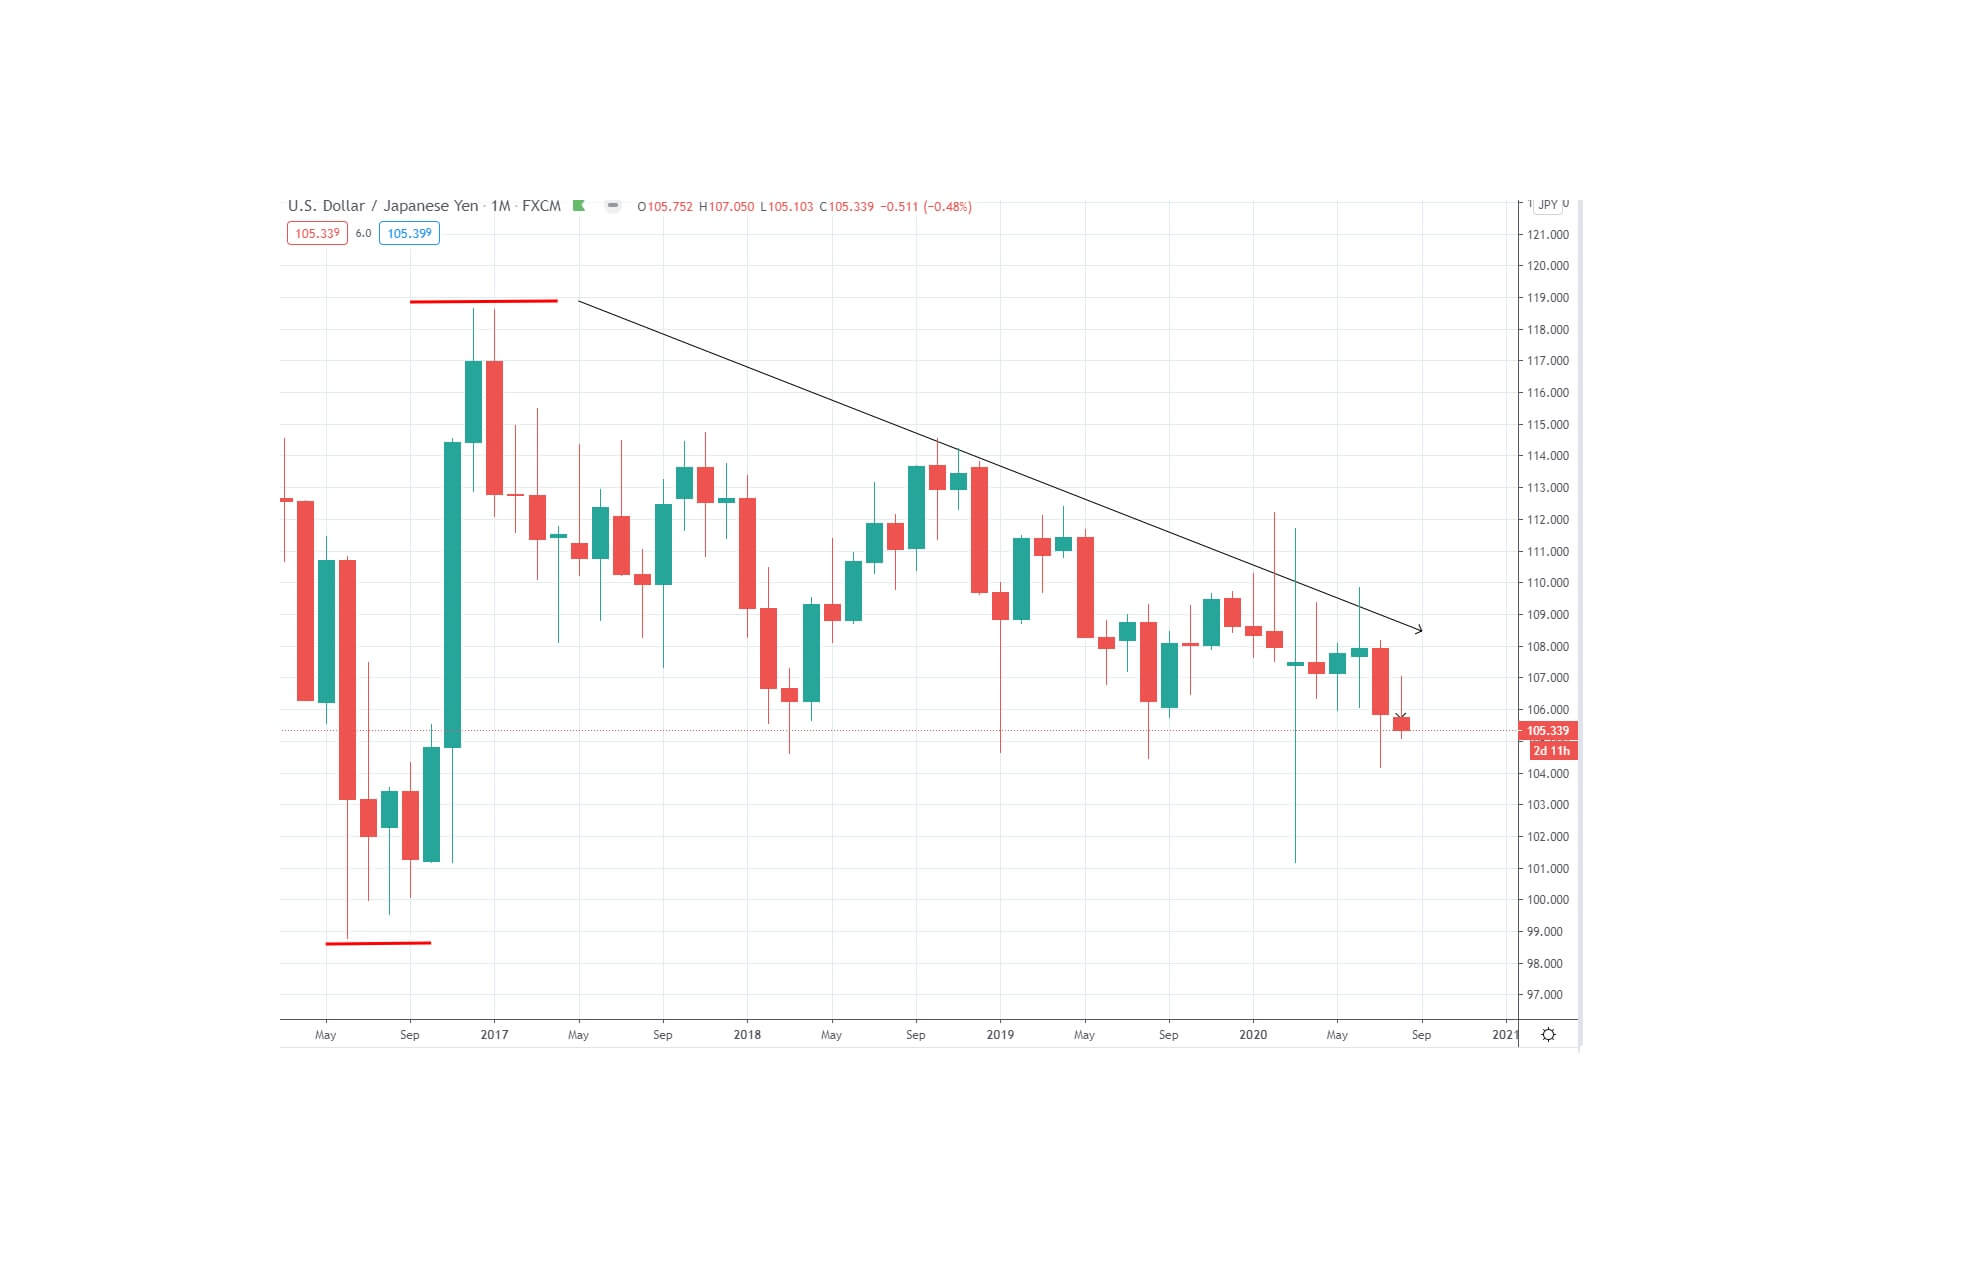
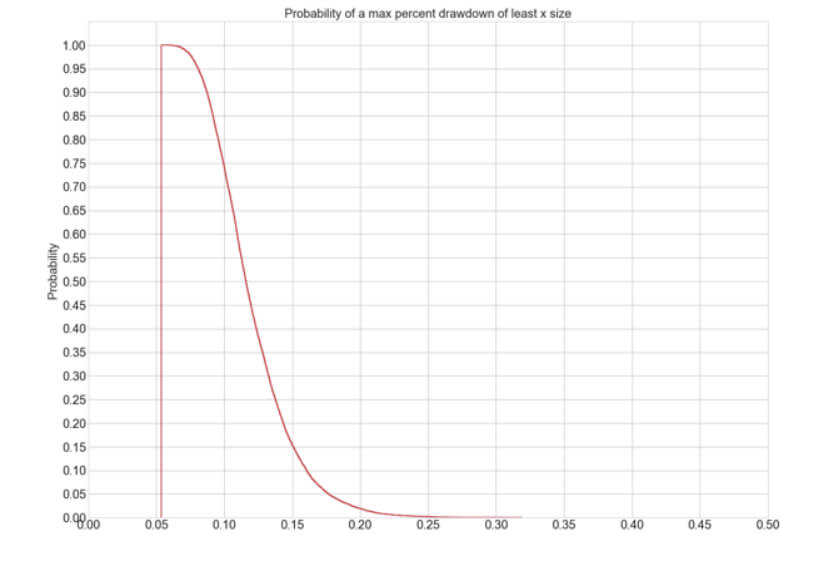
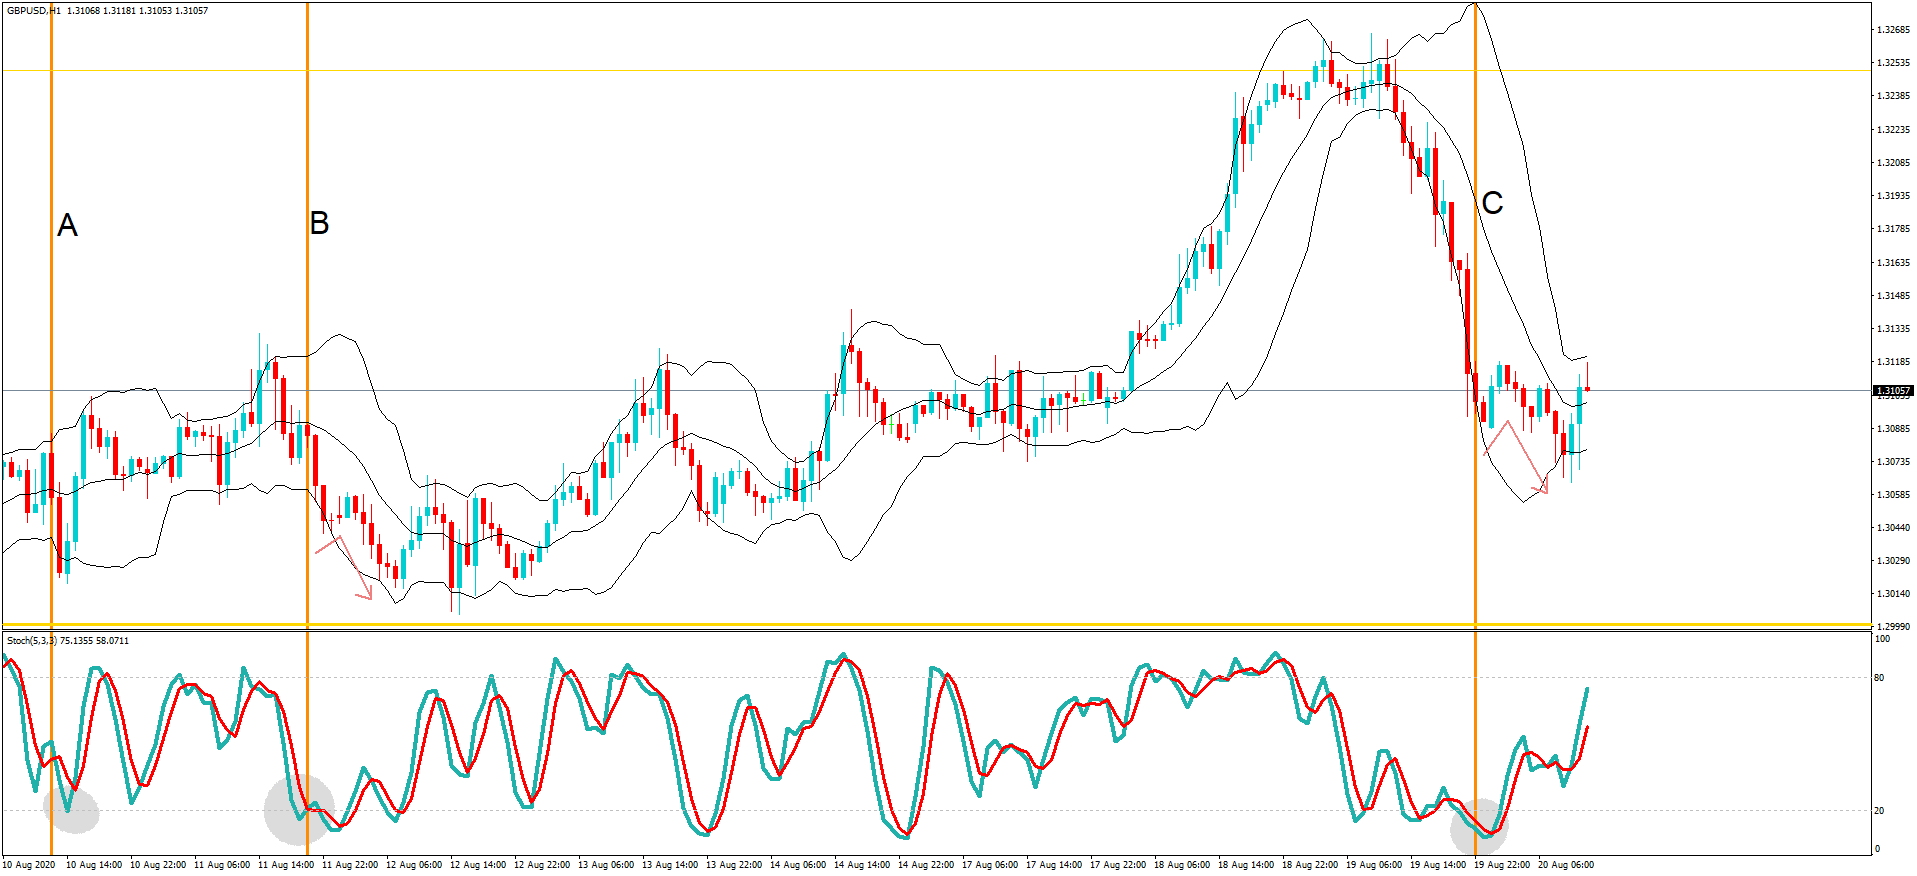
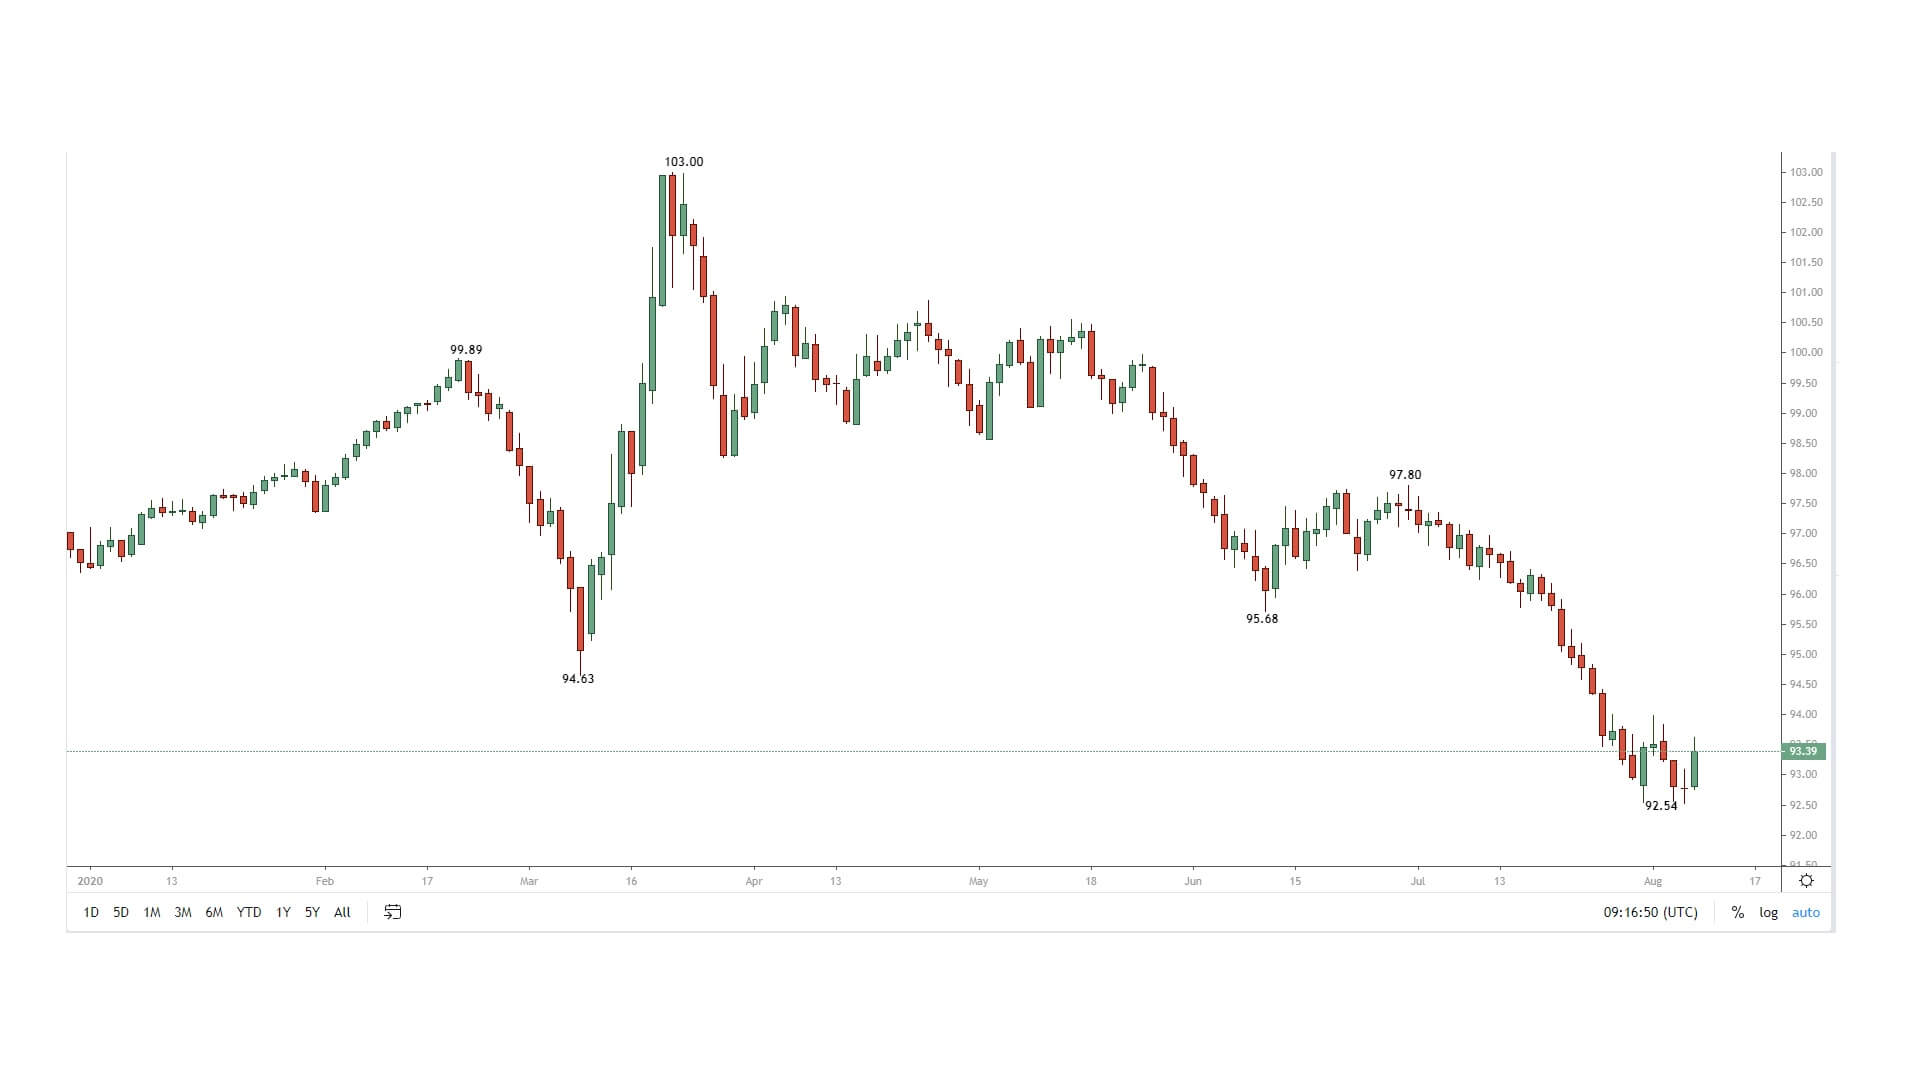
And the selling pressure on the USDJPY pair, where the yen was being bought as a safe-haven currency, immediately lifted the pair over 200 points to 105.65. Traders had been anticipating a move lower within the channel shown here on the daily chart to a possible test on the 101.00 level.
While the use of an effective covid vaccine has been eagerly awaiting by the entire population of the world, the financial markets took the view that life will gradually get back to normal for all of us in the next few months. And this means that economies around the world will go back to full production and turn around the losses they have incurred over the last 12-months as they gradually get back to normal, thanks to the vaccine.

But the markets have a reputation of buying the rumor and selling the fact, and we wonder if things aren’t just a little bit overcooked. Why, may you ask, are we downbeat about this wonderful news. We would say cautious rather than downbeat, but let’s just take a look at the facts about the company behind this vaccine, and then we will leave it to you to decide whether people are looking at this situation through rose-tinted glasses.
Pfizer Incorporated is an American pharmaceutical company; it is one of the largest in the world. It’s got to be so huge by buying up competitors, which led to market dominance.

But its reputation has become tarnished along the way. It has been fined in the USA and other parts of the world, including Nigeria, for testing antibiotic drugs on Nigerian children without the parent’s consent, effectively using the children as human guinea pigs. The Nigerian courts settled $75M with an undisclosed amount being settled in the USA.
It received the biggest ever fine in US history of over $2B for mis-promoting medicines and giving kickbacks to doctors.
They also mislead regulators for defective heat valves where people died because of a lack of testing, resulting in a $10.75m US court settlement.
It was fined $60M for an ineffective diabetes medication, which caused severe liver damage killing patients.
They have paid $20M to doctors to promote their drugs.
The list goes on.
And yet the British government, who saw the Competition Watchdog fine Pfizer over £90 million, for ramping up an epilepsy drug by over 2000% to the NHS, have ordered 30 million doses of this new Covid vaccine, to be delivered by the end of the year which will be licensed for emergency use, initially.
With Pfizer producing the wonder drug that the whole world needs in just a few record-breaking months before specialists said that it would take 18 months to develop, we have the right to wonder if corners have been cut. Where no peer reviews have been done on the vaccine to date, in which case, drugs cannot be authenticated by third-party specialists at this time. And with such a dubious reputation, and where this drug will only be effective should be the whole population take it, I asked again, have we been looking at the situation with rose-tinted glasses? We certainly hope that the drug is effective, but with a criminal record as long as your arm, it is very wise to be cautious about this covid vaccine breakthrough.
Traders are advised to initiate very tight spot losses and expect the unexpected with his new layer added to the financial markets, mixed in with the US election President election, new levels reached in all assets, and many traders will be scratching their heads wondering where will things go next.

Categories
Forex Videos

FOREX – Will Fishing Be The Boot To The Throat For A Brexit Trade Deal? GBP Looking Bleak!

Will fishing scupper a Brexit trade deal between the UK and EU?

In this session, we will be looking at the topical issue of the ongoing Brexit talks between the EU and UK regarding the future trading arrangement, where the United Kingdom is seeking a new future tariff-free trade deal.

One of the reasons why the United Kingdom chose to leave the European Union was because of the pressure the government was put under by the fishing industry in the United Kingdom, who saw fish stocks depleting heavily because the EU has the right under the old agreement of fishing in British waters. A system of quotas dividing up specific stocks goes back to the 1970s, and the UK fishing industry says it was a bad deal for British fishermen. This has been very a very contentious issue for many years.

The British government wants to set a limit around the United Kingdom’s coast of 12 nautical miles, which will be an exclusion zone for EU fishermen to enter, without a formal new quota arrangement in place as a part of the future trading relationship.
Currently, under the Common Fisheries Policy, European boats are still allowed to fish in British waters, and British boats are allowed to fish in other European countries’ waters until the UK formally leaves the EU on the 31st of January 2021. Until then, it is still bound by the European Union rules pertaining to the fisheries policy.
The EU and UK are at loggerheads with regards to access to UK territorial waters, which are important because they offer a bountiful supply of fish.
The German and French governments have issued statements saying that they will not alter their position with regard to their firm stance on future access requirement to British territorial waters and where the two are trying to battle out a quota arrangement which would form a part of any future trading relationship.
Both sides say that the bridge is just too wide between what is being offered from either side in order to be able to move forward and close the future trade deal and where Britain has set a red line for the 15th of October, whereby if no such arrangement is set in place which would allow time for the agreement documentation and laws to be set in place, it would not be able to have everything done in time for the end of the current transition period. Boris Johnson has said he will walk away from a deal if talks are not completed by the 15th of October.

This is causing major volatility on the British pound as the 15th October deadline looms, and the pound is beginning to gain ground against the United States dollar and his firming against other currencies because traders and analysts and economists believe that the two parties will be able to come to an agreement in time. If not, the United Kingdom will leave the EU on the 31st of January with no formal agreement in place with the European Union and will enter into world trade organisation trading arrangements with the EU.

Other problems have also to be finalised, such as Northern Ireland where no border exists between the North and the South, which remains a part of the European Union, and which leaves itself open to the unchecked and unregulated movement of people, animals, and goods, between the two countries, and other areas including market standards and practices throughout the various sectors.
One thing is for sure volatility will continue you right up until the wire and potentially be locked beyond when boundaries are pushed, and potentially deadlines may have to be shifted if realistically some kind of deal can be done.

Categories
Forex Videos

Forex Fundamental Analysis For Novices – New Zealand Visitor Arrivals!

Fundamental analysis for novices: New Zealand visitor arrivals

In this session, we will be looking at fundamental analysis for novices and taking a look at the New Zealand visitor arrivals’ economic data release and how it might impact the New Zealand dollar.
If this is the first time you have seen one of our fundamental analysis or novices videos, we place a great deal of emphasis on the importance of regularly studying an economic calendar for the release, by governments and agencies, of economic statistics, which paint a picture of the health of an economy.

These economic data releases happened weekly, monthly, quarterly, or annually with regard to statistics, but also so provide important information for upcoming events such as key policymaker speeches, upcoming interest rate decisions, and other significant future events which may cause shifts in exchange rates for the various currency pairs.

Obviously, if you are trading a currency pair and are unaware of such key market-moving data releases, it might adversely affect the trade you are in, causing losses.
All professional traders keep a close eye on their economic calendar because it is another tool in their arsenal to help them make the right call when trading.

This is a typical economic calendar. Most reliable brokers will offer this free of charge on their Website.

Typically they will have a filter section so that you can look at past or future economic events or adjust to the various types of impact that events might have, such as low medium or high impact, and the various categories including events such as holidays 0 filtering out events such as holidays auctions bond auctions inflation, or interest rate data.

The critical components of an economic calendar are the day and date, the type of event, the time of the event, the country, the likely impact that that data release will have on a currency pertaining to that country, which might be low impact, medium or high, and where the higher the impact level, the more likely you will see volatility around that currency, post-release.
As we can see here, the information relating to the event is populated on the calendar just underneath the titles section.


The economic events we are interested in this session is the New Zealand visitor arrivals, the data of which will be released at 22:45 British summer time for the month of August, where the impact level is low, and where we can see that the previous release was – 98.5% and a consensus is – 114.9%. The consensus is put together by leading economists. Here we can see that they have a gloomy outlook for visitor arrivals for September and where the consensus is that the figure will be worse than the previous month year-on-year basis.

The visitor arrivals data is collated and released by Statistics New Zealand, which is the official data agency, and it shows how many people visited New Zealand. This is significant because tourism is a key part of the country’s gross domestic product, and they are heavily reliant on visitors, which is therefore important for the health of the economy.

This graph from 2010 to 2020 by the SNZ shows a steady number of visitors over the years until the pandemic hit and where New Zealand closed its borders to tourism in order to protect itself from the disease.

In this graph of the New Zealand dollar to the US dollar, we can see that in the middle of March, at the peak of the pandemic, the currency pair hit a low of 0.57 before bouncing back to its current levels of 0.6670, proving that although the economy is suffering from a lack of visitors, confidence is returning to the New Zealand dollar, because of the way the government has handled the economic fallout, but this also factors in a weakening US dollar, which has not been faring so well, and where the USA is still pretty much in the grip of the pandemic.
Upon release, a better than expected reading, i.e., more visitors, would typically be seen as positive for the New Zealand economy, and therefore the New Zealand dollar would move higher against the United States dollar and perhaps other pairs it is trading against, while a low reading would be negative for the New Zealand economy, in which case we might expect to see the New Zealand dollar falling against those counter currencies.

However, as previously mentioned, the New Zealand dollar is proving extremely resilient at the moment, and where we might consider that traders are confident in the government’s handling of the crisis, where the infection rate is extremely low, and where the long-term view is favorable for the New Zealand economy.

Categories
Forex Videos

Which Broker To Choose? A Or B Book Brokers? Is It In Their Interest For You To Loose?

A book, or B book – a trader’s choice

In this session, we will be looking at the difference between trading via an A book or a B book and why it matters in forex trading.

There are literally hundreds of brokers for new forex traders to choose from nowadays, and as growth continues in the forex market, which is the biggest business on the planet, it is not surprising that broker firms are cropping up all over the place, try to cash in on a slice of the action.


Most traders don’t consider how their trades and orders are executed. They tend only to focus s.com there trade-in and trying to make money.
Therefore, A book and B book is the last thing they think about. They simply trust that the broker they are dealing with has the right framework in place to be able to offer tight spreads and trades that are executed without glitches.

As liquidity and technology have advanced since the onset of retail forex trading, these issues have become more reliable, and with the ever-increasing dependency on social media, it is so easy now for new traders to research their broker of choice to find out if they have an adverse history, including complaints and bad recommendations from current or previous traders.

So, what is an A book in Forex?

Brokers who use an A book operation will pass your market orders either instant execution or pending into a liquidity pool of providers such as Banks as Deutsche Bank, Barclays Bank, or JP Morgan, for example, who then act as the counterparty on your trades.
This is also known as straight-through processing or a non-dealing desk broker, which you may have heard also referred to buy the name of an ECN broker.

Some traders prefer this route because they feel there is no conflict with their broker. They’re orders simply go into a pool where there is a huge amount of liquidity by third parties, which will typically act to provide tight spreads during the busiest hours of the trading day, particularly the European and US sessions. These liquidity providers have no details about the trader and cannot formulate counter trading strategies regarding potential trading styles, which could be detrimental to the trader.
Typically, A book brokers usually charge a commission on the trades, which is the fee that you pay when you open and close trades. This fee is somewhat negated by the tight spreads being offered by the deep liquidity pools in this model.

What is a B book in Forex?


Some forex brokers have their own dealing desks, and this is known as B book.
In this model, if you place a trade onto your platform, either as an instant execution or pending order, your broker is the counterparty for these trades. This causes concern for some traders who worry that the broker who offers this kind of setup may call spikes during volatile times to deliberately stop losses where they are booking the profit from such loss.
Also, there is a possibility that these types of brokers can use technology to set up trading recognition software in order to determine trading styles, which might then influence trades to their favor.

However, if we discount such practices, which may well have gone on during the early days of retail forex trading, but are not so prevalent nowadays, because brokers value their reputations and want to attract as many traders as possible, there are some advantages to trading with ab brook broker.

The main advantage for a trader is that this is typically where you will find and fixed spreads. These kinds of spreads are more favorable during out of market hours; such as after the American trading session in the run-up to the Asian morning session and after the Asian session leading into the European session.
B book traders will also typically offer tighter spreads on more exotic currencies, including cross currencies, where A book brokers may only be able to offer much wider spreads.
The things to consider are what type of instruments you are looking to trade, whether it’s a major currency pair, a cross currency or exotic pair, the time-zone you are trading from, and the spread, with or without the commission structure being offered by the broker. And of course, your type of trading style; for example, if you are a scalper, you want the tightest possible spread you can get, but if you are a long-term swing trader, this will not be so important to you.

Categories
Forex Videos

How Forex traders factor in President Trump – The Enemy Of Predictability!

How do traders factor in President Trump?


Thank you for joining this forex academy educational video.
In this session, we will be looking at how President Donald Trump affects the financial markets and what precautions traders have to take since he came to power.
First of all, we need to remind ourselves that President Trump has never been a politician, he has never been a diplomat, and some members of the democratic party in the United States, and a lot of other people besides, might argue that he doesn’t have a diplomatic bone in his body.
President Trump inherited a fortune from his late father and made himself a name in reality TV. He has brought a certain element of reality TV to his presidency. Often his style is considered to be chaotic, argumentative, belligerent. He has been accused of lying, and the democratic party tried to have him impeached halfway through his presidency.

Certainly, there seems to be a great deal of animosity between himself and the speaker of the House, Nancy Pelosi, who, not happy with losing the opportunity to have him impeached halfway through his term in office, is now working to have him removed from office over concerns about his inability to run the office. Where, under the 25th Amendment, should she succeed, vice president Pence would take over.

This will only serve to cause more friction between the pair. And when Donald Trump’s cage is rattled, he tends to be reactive, which may be causing the delay to the proposed stimulus bill. The longer is stalled, the more it will adversely affect Americans and American companies. The current impasse between the republicans and the democrats is the difference between 1 trillion or 2 trillion dollars. Surely it would make sense to at least start with the smaller of the two amounts and build from there, rather than make people suffer.
And one has to ask if this is a personal vendetta because it certainly seems to be a power struggle. And of course, this is all a part of Donald trump’s leadership style: one day he says there will be a stimulus bill, the next day he says there will not be a stimulus bill until the US Presidential election is over. This, of course, affects the United States stock markets. The knock-on effect is felt by other global markets and numerous assets, including treasuries, bonds, and of course, it is also affecting the United States dollar and every currency traded against the dollar.

But singularly, the most disruptive way that Trump affects the financial markets is his use of Twitter. With a single tweet, Donald Trump can move markets dramatically, where in years past, high-level economic data releases have been subject to an embargo. President Trump will simply issue a tweet at any time he sees fit, the consequences of which can cause the financial markets to suffer extreme volatility, with some traders benefiting and, of course, many others losing money because of this style alone.
And so, if you are relatively new to trading, we suggest you add President Trump to your Twitter feed to keep abreast of his tweets, or better still, only trade when he is in bed asleep. Remember to expect the unexpected from him.

Categories
Forex Videos

Halloween Forex Week – Don’t Trade Until You’ve Seen This!

Halloween for forex traders – the scariest event on the calendar for a long time!

Trading in the financial markets is inherently risky. And professional traders will try and mitigate risk by using an economic calendar to either deliberately trade risky events such as interest rate decisions by central governments or gross domestic product announcements, etc. or to avoid them at all costs.
But now and then, risk events come along that truly worry professional traders and investors. The financial week commencing the 2nd of November 2020 has the potential to cause a tsunami of price action movements in financial assets, including currencies, stocks, and bonds, metals, cryptocurrencies, oil, and commodities. Essentially, everything that can be traded will undoubtedly see volatility during this week.

So why should traders be worried about this week?

The financial markets are in a state of flux with large investors and institutions looking to mitigates risky forthcoming events. This means juggling their portfolios in order to diversify against the risk of a huge stock market falls, especially in the United States should Joe Biden become the next president. This is due to fears that he will have a negative impact on the markets with regard to democrats’ policies, including higher taxation and increased regulations for businesses across the USA.

We have already seen increased volatility in the financial markets, especially with currencies where the US dollar has broadly strengthened against other currencies, especially the major currency pairs. While some of this may be attributed to the month-end readjustment by financial institutions and upcoming planning for year-end rebalancing, the bulk of this activity is due to the forthcoming and tightly contested key economic calendar event for this year, which is the US presidential elections on the 3rd of November.

This just happened to coincide with the Japanese monetary policy meeting minutes being released on Tuesday, as well as the Reserve Bank of Australia releasing its interest rate decision. While the election winner will not be announced on the same day, markets will be braced for when the announcement eventually does come. The completely different styles of presidency being offered by both parties are said to have positive and negative impacts for stock markets, with President Trump’s policies of low taxation and low corporate red tape seen as positive for the economy and where Biden’s policies are the opposite and thus create a negative sentiment for the economy.
This event, which is dynamic and has the potential to cause huge market swings on its own, but it happens to coincide with an increase in the Coved transmissions globally, and where a second wave of the pandemic is sweeping across Europe and the United States, where last week 70,000 cases of the infection were reported in a single day.

It also coincides with the United Kingdom, Germany, and France initiating lockdowns for their peoples to try and contain the virus. As if that wasn’t enough to contend with, financial traders have to keep an eye on the Brexit future trade deal negotiations, which are a critical junction, with just a few days remaining to allow the United Kingdom and European Union to agree on a tariff-free future trade deal. If they are unable to do so, the United Kingdom will exit the transition period at the end of December without a formal trade deal with its European friends, and this, coupled with the economic situation unfolding due to the coronavirus, will be seen as a boot on the throat of the ailing British economy, which is struggling because of the ongoing Covid crisis.

And if you have been looking at your economic calendar for the forthcoming week, the sea of red, in terms of high impact events, continues on Thursday with the Bank of England interest rates decision and the United States federal Bank interest rate decision also compounding nervousness for the jittery markets.
And as if it needed a cherry on the top, on Friday, the US non-farm payrolls for October numbers are released. Historically a huge market-moving event could cause spikes as volumes lessen due to risk and where this would impact liquidity, causing wide spreads.
The best thing is to trade with tight stops, expect the unexpected, and even better still, sit back if you don’t need to trade and watch this incredible week unfold.

Categories
Forex Market Analysis Forex Videos

Forex – New Zealand Dollar Set To Remain Powerful! How to Trade The Coming Weeks…


Is the New Zealand dollar bucking the trend?

Thank you for joining this forex academy educational video. In this session, we will be taking a look at some technical analysis for the New Zealand dollar.

As many countries in the western world are still in the grip of the Coronavirus pandemic, and with many western countries now seeing a second wave, New Zealand has managed to maintain a low infection rate.
The New Zealand dollar, also known as the kiwi, is a major currency and one of the top currencies traded against the United States dollar.

Other major currencies have seen huge swings against the United States dollar and other currencies. The kiwi has remained one of the best performers.

In this yearly chart, if we go back to the beginning of the year, we can see that the pair topped out around 0.6700 before being sold off heavily in the middle of march, and this was largely attributed to the United States dollar being bought as a safe-haven currency and before the pandemic really began to take hold in the US.

Since then, the New Zealand dollar has climbed up to record highs for the year to a peak in September at 0.6765, and although it is off of that high, a clearly defined line of support can be seen on the chart, and where this support line is moving higher, potentially offering a squeeze back to the resistance line and possibly beyond.
At the time of writing, the exchange rate was 0.6610, and with a high of 0.6765, it represents a fall from the high of only 155 pips.

If we now take a look at the EURUSD pair, we can see that while the NZDUSD pair was peaking at its high, the EURUSD pair was also peaking at a defined area of resistance at 1.1940. It subsequently pulled back to its current low of 1.1647, which may become an official support line if it moves higher, and where this move is -293 pips or almost twice the fall in pip value of the NZDUSD pair. This is another indication that traders believe the kiwi is worth buying.
This was further helped this week by the reserve bank of New Zealand, which stated that it would begin to cut back on its government bond purchases and that the economic activity was rising while the coronavirus was under control.
Safe-haven currencies saw some buying with continual downward pressure on the USDJPY pair last week, which tried to hit the key 104.00 level, and the US dollar also becoming a safe-haven currency, moving to fresh highs of above 94.00 on the DXY index, and yet again this did not cause a huge sell-off in the New Zealand dollar, as it held to the support line.

The week ahead is a monumental one with potentially a change in leadership for the US presidential office, and it is extremely difficult to predict where things might go from here. However, once the dust has settled, the economic indicators favor the New Zealand dollar, and we believe this will become a bid currency.

Categories
Forex Market Analysis Forex Videos

Forex & The US Presidential Election – How To Trade Biden VS Trump!

The US Presidential Election – what to expect from the Forex space?

Thank you for joining this Forex academy educational video. In this session, we will be looking at the upcoming US Presidential Election and what could happen in the Forex space in the run up to it and after the winner is announced.

It is a time of uncertainty in the global financial markets, with many Western countries seeing a second wave of the coronavirus, with massive unemployment and peaks and troughs in global gross domestic product, where no sooner can an economy begin to get back on its feet than a second lockdown offers the prospect of greater unemployment, more economic uncertainty and whereby governments are required to bail out their citizens and businesses with vast amounts of quantitative easing, which will see huge debt burdens emerge for generations to come.
Add to this the most contentious US presidential election ever, and it can only mean one thing: uncertainty. And traders and investors, including institutions, do not like uncertainty. It means that they have to diversify their portfolios in order to mitigate against risk.

The basic premise is that should Donald Trump managed to secure a second term in office, he has pledged to continue with the corporate reforms, and he has promised and to continue easing taxes. Whereas Joe Biden has promised to raise corporate taxes, and where he will undoubtedly increase liability on corporations with regard to further reforms and red tape, which has the effect of strangling the performance of the business. Not what you need in times like these.

Before the pandemic took hold in the United States, President Donald Trump was riding high with record-breaking high levels of employment, and record-breaking values in stock markets, largely because of his tax and corporate red tape roll backs and reforms. The investors loved him. He was undoubtedly one of the most successful presidents of all times in terms of the economic performance of the USA.

Fast forward a few months, and he could potentially go down as one of the worst presidents, and this has largely been down to what has been termed by many journalists, economists, and analysts, as well as great swathes of the population in the United States, has having lost grip of the pandemic to the point that he wilfully ignored the damage that it could do in terms of health to its citizens and to the health of the economy.

The polls suggest that he will pay the price and lose the election to Joe Biden.

And because we may see higher taxation and a rollback of reformed policies should Joe Biden become the next president of the United States, this is why we are seeing a pull-back in the US equities markets, and here we can see that the Dow Jones industrial average of the 30 leading companies had made incredible rebounds from the lows of middle of March when the pandemic really hit America hard, add where we almost saw a 100% rebound of the record-breaking high from February of over 29,000 for the index, on the basis that the market believed that the US federal reserve bank was handling the coronavirus well in terms of its interest rate policy and the amount of stimulus being offered by the government and hopes that a vaccine would quickly help the US to recover to pre-crisis levels and beyond.

In this yearly US dollar index chart, which measures the value of the US dollar against the most other widely traded currencies, the so-called majors, including the yen, euro, pound, Swiss franc, and Australian and New Zealand dollars, we can see that it found support at 92.00 in September, after heavily losing out against the majors, and more recently found support at 93.00 before pushing above 94.00. This is what we might expect as the US dollar has often been bought as a safe haven asset in uncertain times, and while the markets try to determine the amount of risk of the unknown, which is what would happen if Joe Biden and the Democrats took power. The dollar is also being bought and stocks sold because the democrats and republicans have not yet been able to reach an agreement on a much-needed extension to the financial stimulus aid package to help keep American firms and the public afloat.
Therefore, no stimulus deal could possibly now be agreed until after the elections, which will lead to more uncertainly, therefore more of the same for stocks and the dollar.
But if Donald Trump is elected for a second term, stocks should rally, and this might have the effect of a stronger US dollar and softer counter currencies, including the majors, perhaps with the exception of the British pound, but only in the event that the UK and EU manage to secure a free trade deal, and also perhaps with the exception to the New Zealand dollar, which is currently being very resilient to the recent upswing in the US dollar.
But if Joe Biden takes power, we would highly likely see extreme market volatility in all financial assets and where the fear of the unknown would offer no real directional bias for the markets in the short term. We also should look at the possibility that even if Biden swept to power, the markets might believe that he could handle the pandemic better than Trump, be less provocative to foreign powers – which could help investment in the USA – and this might also bring back investors into the equities space as a direct result. With the democrats then holding all the aces in Congress, a stimulus deal would be more likely to get through more quickly, and more stimulus should, theoretically, mean a softer US dollar, in which case traders will be looking for opportunities to short it against the majors in particular.
One thing is for certain; the markets are in for a bumpy ride. Traders, be warned.

Categories
Forex Videos

Forex Position Sizing 11 Part 2


Forex Position Sizing 11 Part 2

In Part I, we have discussed how position size should depend on the trading system’s quality and how that quality can be assessed. Then, we presented a practical method to simulate nine different systems with SQN from 1 to 5, to be used in our position size simulator. In part II, we will explain how to simulate 10,000 years of trades and the maximum position size required for a desired max drawdown level.

Risk of Ruin

The term “ruin” is usually associated with the burn-out of a trading account. In this case, we will associate it with the odds of reaching a determined level of drawdown. The level at which a trader no longer would trust the system or considers himself unfit to trade.
Since this drawdown figure is particular to every trader, we will consider drawdown points starting from 5% and up to 50% in 5% steps.

The study

We have designed a computer simulation using Monte Carlo resampling of the original 10,000 trades computed for every system created. The simulation will create 10,000 resamples of 500 trades, each simulating one year of activity, thus creating 10,000 years of market activity.
We initially created a range of position sizes, starting from 0.2% up to 10% in 0.2 steps. As we saw that the max position sizing was below 5%, we have created a second round using position sizes from 0.2% to 5% in 0.1% steps and defined as ruin if in more than 1% of the 10K simulations the max drawdown reached the predefined level (from 5% to 50%). The table shows the max position size allowed for a defined max drawdown (ruin).

We have made a second simulation using 10% instead of 1% as the trigger level. Thus, the later table summarizes 10% odds (1 in 10 years of activity) that the max drawdown of a system touches the predefined levels.


Discussion

Considering both tables, a novice trader should be cautious and go to the safe side while learning the job. Thus, If I were new to trading, I’d assume the system’s quality to be low for two reasons. One, My system is the combination of technical signals and my interpretation of them and random factors. Also, the theoretical results of a back-tested system are always higher than the real-time results. Two, being new in this field, I still do not know my psychological reactions to losing streaks and drawdowns.

Thus, my first choice would be SQN 1 and 10% drawdown using the second table, which gives me one year in ten of 10% drawdown and one in 100 years of a 15% drawdown, but usually much less than 10%. That will mean my preferred position size will be 0.5% risk on the current account balance. After achieving 100 live trades and experience with drawdowns, we should recalculate our strategy’s parameters and consider a new position size.

A trader with 2-3 years of forex experience would prefect his strategies and reactions to the market action. Thus, an SQN 3 system is within reach. He would also accept up to 25%-30% drawdown risk. For a trader like this, a 2.5% risk would be quite reasonable.

Successful traders with over ten years of forex experience, combining fundamental and technical analysis with his trained intuition, will likely reach an SQN 4 level and taking the slight risk of 40% drawdown. To successful traders, a position size of 4-4.5% is acceptable if they feel the right pair begins moving as they planned.

As we can see, your personal experience, risk tastes, and system performance are the variables you should consider when deciding which position size best fit your needs.
Finally, this study considers that the trades are made one by one; therefore, the position size should be split into the number of open trades usually taken by the system.

Categories
Forex Videos

Forex Position Sizing 11 Part 1 – System Quality and Max Position Size!

Position Sizing XI- System Quality and Max Position Size

In this video presentation, which will be made in two parts, we will analyze the role the quality of a system has over how much risk we can have on trades, and compute the position sizes needed to avoid surpassing a desired max drawdown level.
It seems quite understandable that the system’s quality is directly correlated to the amount of potential profits it can deliver. What is less evident to many traders is it is also related to the drawdowns, and thus, to the risk amount it can withstand before drawdown goes below the trigger point beyond which a trader feels it is too much.

Measuring the quality of a system

To evaluate the quality of a system, we need to acquire a certain amount of past trades, so as to have enough data points to apply simple statistical tests. It is recommended to have a minimum of 100 trades, although as more trades are collected, the statistical results would be much accurate.

There are several ways to compute the quality of any system. The more common takes the ratio of the mathematical expectation (ME) over its standard deviation (SD) multiplied by the squar e root of n, the number of trades. This method’s results, though, vary with the n. For the purpose of evaluating the performance of trading systems, it is better just to take the ME/SD ratio and multiply it by ten. This is the method proposed by Van K. Tharp, which he calls System Quality Number (SQN)

SQN = 10 x ME/SD

SQN makes the system quality evaluation Independent of the number of trades. The only requirement is to ensure a collection of at least 100 trades.

Normalising the data

Of course, for this method to have sense, the data collected has to be normalized. That means, all trades must be normalized to one trading unit, that is, all trades must be taken at the same position one lot ( or one mini, micro-lot). To further normalize it we should take the reward/risk ratio instead of the raw profits.

Let’s say we have a list of trades, made using the same position size. Thus the collection can be normalized with the following Python code:

loss = [ x for x in trades if x < 0]    # the collection of all losing trades
avloss = -np.mean(loss)    # taking the average of loses ( sign changed)
norm_trades = [trade/avloss for trade in trades]

Now, we have all trades normalized for the application of the average and standard deviation. Furthermore, the average obtained will reflect the expected one-dollar-risk average profit on every trade.

Position Size and Downside Potential

in our previous videos on position sizing, we have already shown that all things being equal, the position size is what determines the max drawdown of a determined sequence of trades. Being capital preservation the primary goal of every trader, knowing how much downsizing will deliver a specified system is critical to optimize the returns, but taking care drawdowns do not pass the psychological point beyond which the trader considers the system has failed.

Simulating a trading system

To generate a synthetic trading system of the desired quality, it is relatively simple in Python. All trading systems can be modeled by two parameters: The winners’ percent and the payoff, or average reward/risk ratio. To make it more standardized, we have set the percent winners in all the generated systems to 50%, modifying only the payoff.

We created nine systems with SQN figures from 1 to 5 in 0.5 steps. The first system is of low quality, but perfectly tradeable. In fact, we consider SQN 1 to be an average trading system. SQN 2 is already a very nice system. All systems beyond SQN 2 are great systems, and if by chance you own an SQN 5 type system, please keep it safe because it is a real gold mine.
The basic Python code to make 10,000 trades with 50% winners is:

t = np.random.binomial(1, 0.5, 10000) # Creating a random sequence of heads and tails

This is half the job. We need to add a payoff to complete it. In the case of SQN 1 this is the code:

payoff = 1.27
trades = [payoff * x if x > 0 else -1 for x in t ] # creating the W-L sequence


Please note that, even when we aimed at 50% profitable trades, the inherent randomness of the process resulted in only 49.09% of them profitable. Also, we used the same sequence for the payoff application and get the different SQN figures; this makes this analysis more robust, as only one parameter was changed.


Categories
Forex Videos

UK FTSE looking to retest May’s low?

UK FTSE looking to retest May low?


Thank you for joining this forex academy educational video. In this session, we will be looking at the FTSE 100 index.

In this yearly chart, we can see the red highlighted low of 5,750, which was the low point from March having crashed down from January’s peak of just under 7,600 as a result of the Covid related pandemic causing the UK to go into lockdown. And while the higher peak shows a sharp rebound to 6,500 at the beginning of June, the value of the top 100 UK firms has been falling steadily since then to the current 6,000 at the time of writing.

Buy sharp comparison this is the Dow Jones industrial index yearly chart, showing a record high for the index in February of 29500 falling to a low of just above 18000 before a V-shaped recovery took it back to over 29,000, where practically 100% of the original crash was reversed. The NASDAQ fared even better, as did the S&P 500, both of which moved to all-time highs.
While it is impossible to suggest that the two economies are identical, the USA has enjoyed a bull run while the FTSE 100 has faded. And while the US economy is very slowly showing signs of a recovery, the numbers by no means suggest the economy of the USA is in a better shape than before the pandemic. So, what is the driving factor for one and effectively put the breaks on the other?

This can largely be put down to sentiment: the American economy is perceived to have the ability to achieve the same growth as before the pandemic, once the virus is defeated. Therefore, traders and investors have taken a long-term view that the US economy will recover and go on to see growth, and they are taking the risk that the stock market will reflect this at some point in the future. In other words, they see the economy catching up with the stock market rather than the traditional view that the stock market reflects the value of the economy.

However, investors in the British economy are slightly more subdued because of the worries that the British government and the European Union are at loggerheads heads with regards to any future trading relationship now that the UK has left the EU. This is because the European Union wants more regulatory alignment with Britain regarding its future trading arrangements and whereby financial services regulations need to be reflective of both economies and where, for example, safety standards and hygiene standards, remain level pegged, because the European Union has a duty to ensure that the citizens of the EU do not receive substandard services, or substandard food and food substances, or substandard electronics and motor cars and equipment, etc.

The EU has also placed pressure on the British government regarding fishing rights for the EU in British waters and where there seems to be no possibility of an agreement on this subject. And also another major stumbling block is the fact that Ireland is a part of the EU you and Northern Ireland is a part of the United Kingdom, and there is no border in place, in which case unchecked goods and services could move between the two areas, leaving the door open for infringements, including tax revenue losses and the movement of people without passports and livestock movements without regulatory checks by the EU. The whole thing is extremely complicated. But the bottom line is if these issues cannot be agreed upon in the next few weeks, there is a distinct possibility that no official trade agreements will be set in place, where the United Kingdom was hoping to have a free trade deal with the EU and in which case the UK will need to revert to world trade organization trading rules, which will be more expensive for the United Kingdom economy in the long run.
So where now?

The FTSE 100 is currently in a critical area, which is of psychological importance: 6,000. Should price action fall just under and then push up and find that the 6,000 area becomes a line of resistance, we could see price action fall down to the previous low of early September of 5,800 and, then, perhaps a retest of May’s low at just above the 5,700 level.

The longer that the EU and UK remain at loggerheads and cannot agree on a future trading relationship, the more chance we will see that this index will push lower and if the UK ends the transition period without a formal agreement at the end of December this year, the pressure will be on the FTSE 100 to fall even lower because we are still in the grips of the pandemic, coupled with WTO trading rules and no formal trading agreements in place with the EU or the USA, which will leave investors wondering how badly this will affect the British economy in the next 12-months.

Categories
Forex Videos

Forex! USDJPY Forecast – Support & Resistance Areas Explained!

Where next for USDJPY – Support and Resistance areas explained

Thank you for joining this Forex academy educational video. In this session, we will be looking at a daily chart of the US dollar Japanese yen pair and looking at support and resistance lines.

It has been a tumultuous few months for the US dollar Japanese yen pair. With a high in February of 112.00 down to a low a few weeks later in March of 101.16. Many investors will have been completely caught offside, and wins and losses for those who got it right or wrong will have been substantial.
When analyzed on the daily chart adding simple support and resistance lines, we see clear patterns emerging of price action and where the exchange rate forms peaks and troughs.
The fall in the pair from position A to position B was down to the coronavirus’s impact and where the Japanese yen is favored in times of such crisis due to its safe-haven status. However, this huge move had to become oversold, and of course, it did just above the key 101.00 level, and where we saw a rally back to position C, which incidentally is a step lower than position A. Typically, we find that institutional traders will pull out of a huge upside momentum trade slightly before a previous high, or a previous low if the situation was reversed because they fear that in this situation sellers are lurking at the previous high level, and that is proved when the pair pulls lower.


We then see a period of consolidation between positions D E and F. And a subsequent lower step to G and where the pair only manages a following high at position H, again a defined step lower than the previous high of position F.
Now things become interesting because price action fades in a tight consolidation period and at position 1 does not reach the previous high of position H and collapses down to position I. Again, we have a shift lower to position J and where we again see price not able to pull back to that resistance line at position 2, and price again begins to fade down to position K which incidentally is a double bottom formation aligned with position I.
These fading areas of price action are unable to reach previous highs, as shown by positions 1 and 2 and very strong telltale signs that price action is about to move lower. Obviously, the opposite applies. But with the USDJPY pair, we are looking for reasons to go short due to the overall fading trend and the nature of the yen being bought in times of uncertainty.


And with the market being extremely volatile right now and US elections only a few weeks, we can reasonably expect a continuation in the strength of the Japanese yen and, therefore, more movement to the downside in this pair.
Add these simple trend lines of resistance and support to your own charts and look out for fading price action to these lines, such as described in positions 1 and 2.

Categories
Forex Videos

Fundamental Analysis For Novices – Foreign Investment In Japanese Stocks


Fundamental analysis for novices: Foreign investment in Japanese stocks


Thank you for joining this forex academy educational video. In this session, we will be looking at foreign investment in Japanese stocks.

If you are serious about trading, you must be responsible for knowing what factors are likely to influence the movements of exchange rates in the forex market. One of the biggest movers is the release of fundamental economic data, which is collated, released, and usually subject to an embargo by governments or professional economic statistician specialist firms.
Luckily for us traders, most of this information can be found on economic calendars, which are readily available by most brokers.

Keeping up to date with economic calendar events is just as important as placing the trades. Because if you are unaware of a high impact data release that might fall shortly after you place your trade, it could potentially have a negative impact and incur losses. Therefore, get into the habit of looking at your economic calendar every day and look out for what high impact data may be released in the following few days ahead. Most institutional traders will take a long-term approach based on data that may be released at these future times.
The most critical components of an economic calendar are the day and date, the time of the release, the type of event, the likely impact, which usually is measured as low, medium, and high impact, with the latter potentially causing extreme market volatility. The actual data will be populated on the calendar shortly after the embargoed release. And this can be compared to the previous data. Whether that is on a weekly, monthly, quarterly, or annual basis, and where typically there will be a consensus as to the actual data, which will have been put together by economic forecasters.

Here we can see that on Thursday, September 3rd, at 12:50 a.m. BST Japan issued its economic data release for investment in Japan stocks to August 28th and where this was a low impact event. There was no consensus, but we can see the actual and previous statistics based on yen amounts. The data was released by the Japanese Ministry of Finance. The data refers to the difference between investments in the Japanese stock market by foreign entities, and the ‘actual’ data on the calendar refers to the net difference between the inflow and outflow of those investments.
Although this is a low impact event, the balance between inflow and outflow of funds gives an indication of the strength of the economy and, more importantly, shows that overseas firms such as pension funds, government funds, hedge funds, and investors see value in investing.
Traders should be looking for a higher capital inflow if they want to be buying yen and a lower capital inflow to support trading setups for selling the yen against counterpart currencies, especially the US dollar.

Categories
Forex Videos

Forex & The Recent Market Drivers – What You Need To Know Trading The Next Few Weeks!

Recent market drivers


Thank you for joining this forex academy educational video. In this session, we will be taking a snapshot of the recent market drivers, which might explain the moves in bitcoin, the Dow Jones, and a couple of major currency pairs.

Festival we have the dollar index charts also known as the DXY, and where the dollar is measured against a basket of 6 major currencies, including the yen, the pound, the Australian dollar, the New Zealand dollar, the Swiss franc, the euro, and the Canadian dollar, and where the dollar index reached and high of 103.00 at position A, during the middle of March when Europe was in the grip of the pandemic and where the United States was not yet at its peak. We then see a low at position B, of 92.00, and where there is the dollar strength subsequently began to return, and now we can have a look at the possible reasons why.

Firstly we should take a look at the Dow Jones industrial average index whereby around the middle of February this year, Dow Jones hit an all-time record at 29,500 points, before crashing all the way down to 18,400 as the pandemic started to grip the United States. Although circumstances remain bad with the United States economy, the Dow Jones has rallied all the way up to a recent high above 29,000, almost approaching the previous record high, but where the fundamental economics do not match the previous rise from February. This may well have been a tipping point for traders who were already expecting a reversal in price action, and potentially we and see profit-taking at these levels.

Now let’s take a look at the GBPUSD pair, AKA Cable. In December, when Britain voted to leave the European Union, the pair was on a high at 1,3350 at position A. Still, when the pandemic hit, Cable went down to just above 1.1400, again we have seen an incredible rally all the way back up to a high at position B of 1.3380. And then a pull lower to the current level of 1.2950 at the time of writing. The shift higher can only be attributed to dollar weakness because the United Kingdom is still suffering from the pandemic’s fallout and where no agreement has yet been reached regarding a future trading relationship with Europe. The pair will likely find further weakness the closer the UK gets to a no-deal arrangement with Europe.


If we now turn our attention to the EURUSD pair, we can see that at position A, at the height of the pandemic in Europe, the currency pair was trading at 1.0600, before moving to a recent high of 1.1936, before falling lower to its current level at 1.1760 at the time of writing.
The sharp reversal in the Cable’s high at 1.3380 and EURUSD pair at 1.1936 can be attributed to the DXY reversing from its fall and bouncing off from its low of 92.00
The reversal of the DXY from 92.00 to its current level of 93.50 at the time of writing can be attributed to the reversal in the Dow Jones from an almost double top formation of a previous record-breaking high. The economic fundamentals are not working as in a normal stable market.

Let’s take a look at the bitcoin to the US dollar, which is currently trading at 10,230 but found resistance at 12,000 recently, and whereby this is no coincidence that this price rejection coincided with the DXY bouncing off of the key 92.00 level.

While some analysts will argue that the markets that we have looked at today are not correlated, either positively or negatively, the numbers and charts speak for themselves.
When trading, always try and factor in as many assets as possible to try and established which might be affecting the other and how that might, in turn, might affect the asset that you are trading.


Categories
Forex Videos

Forex Fundamental Analysis For Novices – How To Trade Mortgage approvals!


Fundamental analysis for novices: Mortgage approvals


Thank you for joining this Forex academy educational video for novices. In this series, we will be looking at economic data releases by governments around the world, but specifically focusing on Western democracies and whereby this data acts as a barometer of the health of a country’s economy. In this session, we will be looking at mortgage approvals and focusing specifically on the United Kingdom.

If you are new to trading, one of the main reasons that new traders fail is because they are unaware of economic data releases, where governments release information in the form of statistics, which market analysts and traders use to value the health of a country’s economy. Such data causes various levels of impact on the financial markets, which is typically low, medium, or high, and where high impact data can cause a currency pair’s exchange rate to stop in its tracks and reverse, which is often detrimental to a trend and therefore may cause losses. By using an economic calendar, which is offered by most brokers, you will learn to use the data releases to your advantage and know when to trade and when to avoid the markets, especially at such time as high impact data is being released.

The critical components of an economic calendar are the time of the release, the type of event, the day and date, the likely impact that such data will have on the market, which is measured in 3 values, low medium, and high. The actual data will be populated on to the calendar very shortly after the data release and is typically subject to an embargo. The consensus, which is a value of the expected data release, is usually fairly accurate as put together by economists and analysts. And the previous data release which should also be used in conjunction with the consensus as a gauge. The larger the deviation between the actual release and that of the consensus will likely cause more volatility in the market, depending on the expected impact level.

Here we can see that’s on Tuesday the 1st of September 2020 at 9:30 AM BST, Great Britain will release data statistics for mortgage approvals for July, where the impact level is low, and where the consensus is 33.9 k and where the information that was released for June came in at 40.01 k. The data will be simultaneously released with market manufacturing PMI, net lending to individuals and consumer credit, plus M4 money supply.
Therefore, this information will be looked at holistically by traders, and because the manufacturing PMI is a medium impact, potentially there is room for greater volatility than just the information pertaining to mortgage approvals.

Mortgage approval statistics are released by the Bank of England each month and show the number of mortgages approved for July. This acts as a leading indicator for the housing market within the United Kingdom. Higher mortgage approvals mean that the economy is healthier and recovering from the pandemic. The higher the reading, the more positive for the pound, while a low reading is negative and shows that people are not confident with the economy and are therefore not buying homes. As such, this is bad for the pound and could see weakening against other currencies. As mentioned, always look at the whole basket of data releases rather than one single component.

Categories
Forex Videos

Forex Fundamental analysis for novices – Dallas Fed Manufacturing Index!

Fundamental analysis for novices: Dallas Fed Manufacturing Index


Thank you for joining this forex academy educational video. In this session, we will be looking at fundamental analysis for novices and discussing the Dallas fed manufacturing index.

Most brokers offer an economic calendar where you will see economic data release events that fall due daily, weekly, or even monthly.
It is critical that you know when these events are going to occur because many of them cause extreme volatility in the market and may affect any open trades or trades that you are about to take, while not realising that an event is about to happen and where these events might reverse price action, to your trading detriment. Professional traders plan around such events, and you should do the same so that you understand what is going on in the marketplace at all times.

The key components of an economic calendar are the day and the date, the time, the type of event, the impact, which is a barometer of the likelihood of the event causing volatility and which is normally low, medium, or high, and which is measured on this calendar with the strength indicator filling the box, the more likely volatility will occur, and where the high volatility impact releases will typically fill the box in solid red.
Also, the actual data box will be populated very quickly after the embargo announcements, and you can also see a general consensus of what the market believes the data is likely to be as compiled by market analysts and economists. And you will also see the previous data, whether that is for the previous week, month, quarter, or year.


Here we have scrolled forward to Monday the 31st of August, and we can see that at 3:30 BST, the Dallas Fed manufacturing business index for August was due to be released and where the impact value is low, there is no consensus available, and the previous figure was -3.
The United States Dallas fed manufacturing index pertains to the state of Texas, which is the second-largest state in America, with a gross state product of nearly 2 trillion$. Many of the top fortune 500 companies are domiciled in the state of Texas.

The index itself measures the performance of manufacturing in Texas, where the information is taken from around 100 businesses and is based on output orders, and prices, and employment within Texas. Therefore, it is an important indicator of the economic health of one of the largest states in America.

Although no the economic calendar impact box shows this as being low for potentially causing market volatility, the American economy is in a precarious position with the covid virus still highly prevalent across all states, and where the American economy is struggling to regain anywhere near the levels, it reached before the pandemic started.

Therefore, traders should be mindful that any information regarding economic activity in any of the States is likely to cause volatility. Traders will be looking for a figure better than –3, which would be considered to be strong for the United States dollar, which might firm, and if the number is worse than –3, it will be bad for the economy and where you might find the American dollar loses ground against the other major currency pairs.

Categories
Forex Videos

Forex Fundamental analysis for novices HICP!

Fundamental analysis for novices: HICP

Thank you for joining this forex academy educational video for novices. In this session, we will be looking at fundamental analysis for novices, and we will be discussing h I c p.

If you are new to trading, you will need to have access to an economic calendar, such as the one shown here, where governments around the world release economic statistics, usually weekly, monthly, quarterly, or annually, and whereby the financial markets look at these statistics in order to try and gauge the strength or weakness of an economy based on the release of this information. Such data releases can cause the relating currency of that country to stay the same or gain in strength, or lose value against other currencies. Therefore, it is vitally important that you understand how economic calendars can help your trading.

The most important aspects of an economic calendar are the time of the release, the type of event, the day and the date, the impact level likely to be received by the market, which is usually low, medium, or high, the actual data, which is usually subject to an embargo and will be populated on the calendar usually just a few moments after its release. The consensus, or what the market thinks that information is going to be based on forecasts formed by economic and financial analysts, and the previous data, whether that be weekly or monthly, etc.

Here we can see on the economic calendar for Monday the 31st of August 2020 at 8 a.m. BST that Spain will be releasing their harmonized index of consumer prices or h I c p data and simultaneously releasing consumer price index information for both month on month and year on year, and these are all preliminary readings.
Spain has the 13th largest economy by gross domestic product in the world, and because it is part of Europe, it is measured as the 6 largest EU member in Europe. The harmonized data is a component of the overall data for the eurozone. Therefore, because Spain is a relatively smaller component of the overall picture for the eurozone index of consumer prices, it has a low impact upon its release. The statistics are weighted and are used as a way of measuring inflation and price stability across the eurozone. Inflation is tightly monitored by the European Central Bank, which will have a benchmark target of around 2%, which is fairly typical for Western economies, although the United States has raised that bar slightly due to the ongoing pandemic and the devastating effect it is having in America at the moment.

Typically, a high reading is positive for the euro, and a low reading is negative. However, all economic data is taken very seriously due to the fallout from the pandemic, but economists and therefore the consensus reading is usually fairly accurate with the smaller member states, which typically means there are fewer shocks and again because Spain is a smaller member of Europe, it is unlikely to cause market volatility upon its release. Nonetheless, one should always be guarded, just in case.


Categories
Forex Videos

What The Japanese PM Shinzo Abe’s Resignation Meant For Forex!

Japanese Prime Minister Shinzo Abe resigns where next for the Yen?

Thank you for joining this educational video. in this session, we will be looking at the impact of the Japanese yen now that long-standing prime minister Shinzo Abe has resigned.


If we look at this one-hour chart of the US dollar Japanese yen pair from Friday 28th of August, rumours started to enter the financial markets during the European session that prime minister Shinzo Abe was about to resign due to ill health. The currency pair declined as investors sought to buy Japanese yen. Typically, when uncertainty surrounds a country, such as an important announcement that the long service serving prime minister was about to resign, you might expect the currency to the devalue.
However, the Yen is also seen as a safe-haven currency due to the American economy’s continuing uncertainties because of the ongoing pandemic and upcoming presidential elections. A lack of any kind of stimulus package being agreed on between the democrats and the republicans did not help the US dollar, coupled with the fact that the day before the Fed’s chairman, Jerome Powell, change policy with regard to allowing inflation target to move higher than the 2% benchmark that it had worked to for many years, thus allowing the potential for low-interest rates to remain at record lows for years to come.

On the flip side, we have a fairly strong and stable Japanese economy, which Shinzo Abe will be attributed for, being one of the longest-standing prime ministers in Japanese history. He was liked and respected around the globe, and his tight policy-making has proved an asset or the Japanese economy. He managed to negotiate a trade deal with America, which was beneficial to both countries and is proving successful, but he also stood up to China with regard to what the Japanese saw, as is an infringement on Japanese businesses being able to work within China. Although he stood up to the Chinese government, he did so without any animosity or threats. Such is the high regard that he was held as a statesman for Japan.


If we take a look at this monthly chart of the pair going back to September 2017, we can see that it has not been averse to large swings from lows of 98.00 to highs of 119.00, but where the general trend in the last 12-months has been towards a firmer Japanese yen.
While the Japanese economy will be reeling from its prime minister’s loss, the markets have not been acting adversely, possibly due to the previously mentioned fundamental reasons.

Therefore, it is highly likely that we can expect little change in sentiment for the Japanese yen. The general trend in the pair is lower as investors look to safe-haven assets, such as the yen, and while the market is currently in volatile mode, the downward pressure on this pair will likely remain for the foreseeable future.

Categories
Forex Videos

The Forex Market reaction to Fed Powell speech & What It Means Going Forward!

Market reaction to Fed Powell speech 27 August 2020: The new framework

Thank you for joining this forex academy educational video. In this session, we will look at the extreme market volatility after federal reserve chairman Jerome Powell’s speech at Jackson Hole on the 27th of August.

The United States dollar has remained on the back foot this week with the DXY punching through 93.00. There was a lot of expectation for the US data on Thursday the 27th, especially the 2ND quarter gross domestic product, which came in slightly better than expected and also the initial jobless claims, which again was very slightly better than expected.

However, while that data had a fairly muted effect, keeping the euro US dollar pair just above point 1.1800. It was fed Powell’s speech on monetary policy, which really caused volatility in the marketplace, causing the pair to spike to a high of 1.1900 and a low 1.1759 while the market tried to digest the new policy and how it might affect the markets in general.
Whenever we get spikes and reversals after a policy shift from a major Western government, especially the USA, it is largely because analysts and economists are fairly split on whether or not the new policy will help or hinder the United States economy, and whether or not it is good or bad for investors.

The policy centers around the feds benchmark 2% inflation target and where it says it is now in a position for that to be over-shot to slightly above on occasions. This new policy, to tolerate inflation above 2%, is largely seen by the markets that the Fed will be holding interest rates lower for longer, possibly even years. This, of course, is not attractive for people who want to hold United States dollars. Although interest rates have been low for some time, to assist the United States economy rebound from the catastrophic effects of the coronavirus, the fact that we may see low interests rates in the United States for many years to come is not attractive to Dollar investors, and this is why we are seeing almost pandemonium in the currency markets. Most of this pertains to the US dollar.

So, what can we expect in the currency markets? Posted speech, the Asian session continued the US dollar sell-off, where great volatility has been seen in the market since Powell’s speech. The DXY index has been taking a major beating, and no end looks to be in sight. Therefore, we suggest traders’ limits risk by keeping stop losses tight and lowering leverage until market volatility decreases

Categories
Forex Videos

Forex Fundamental Analysis for Novices – US Construction spending!


Fundamental Analysis for Novices US Construction spending

Thank you for joining this fundamental analysis for novices’ educational video. In this session, we will be looking at construction spending data releases and, in particular, within the United States.


If this is the first time you have viewed one of our fundamental analysis videos for novices, please make sure you search for the many other videos in this series which will help you understand the importance of such data releases when they hit the market and which are usually subject to an embargo.
You should refer to your economic calendar every single day and make sure you plot your trades around these risk events.

The most important sections of an economic calendar of the time of day and date of the release the type of event. For example, here we can see that the first one on the list is the right move house price index month on month for August for Great Britain, which was due for release at 00:01 on Monday, August 17th, where the impact was low.

Most economic calendars will provide you with the likely volatility impact of such news releases, and these will typically be released as low, medium, or high impact. Here we can see that the strength of the impact is measured by a bar where low-impact is a third of the bar coloured in orange, a medium impact such as the EURO group meeting at 1:00 takes up a third of the bar in orange, and a high impact bar which we can see at 12:50 in the morning, where the Japanese gross domestic product was considered to be a high impact and where the bar was completely coloured in red.

Economic calendars will also show you the previous data, which could be weekly, monthly, quarterly, or annually, and they will provide you with a general consensus as compiled by market experts and economists, and of course, the actual release section will be populated shortly after the embargo.

Here we can see a recent data release of us construction spending, which came out on Monday, August 3rd, and was simultaneously released at 3 p.m. BST with other important United States data including ISM manufacturing employment and manufacturing orders and prices.

While the market will look at all of this information simultaneously, some of this has been covered in previous videos, which we would ask you to take a look at. Still, in this video, we will only be focusing on the construction spending component, which was month-on-month for June, where we can see here came in at – 0.7%.

The information is released by the United States census bureau and is a measurement of the total amount of spending in the United States for various construction types. Because it includes a residential component, it is useful for predicting new home sales and mortgages. A high reading is seen as positive for the United States dollar while a low reading he seen as negative or perish for the United States dollar.

While the impact indicator considers this to be of low importance, when taken into to context with the other data being released simultaneously, traders will need to take a holistic view, especially in the current economic climate where the pandemic is still in the grips of the United States at the time of writing this article and where even low impact data can cause shock waves and market jitters. In which place, it is better to be prepared for this and wait for the market to react to the news before spotting trends and trying to get on them.

Categories
Forex Videos

Forex Position sizing Part 10 – Scaling in and scaling out techniques!


Position sizing X: Scaling-in and scaling-out techniques

Scaling in and scaling out are usual techniques to increase the position while maintaining the risk stable. In this video presentation, we are going to explain how to do scaling in and out 3properly.
Scaling-in can be thought of as a means to reduce the risk while increasing the size of the position. Let’s say that you have a trading system optimal with a 10% total position sizing, and you expect to have no more than four open positions at a given time. Under these premises, the risk per position is 2.5%, but this may bring the overall drawdown to over 25%, which is too high for your tastes.

Pyramiding (scaling in) allows you to approximate your position to 2.5 % while using the market’s money to lower your risk to 1.25%, so your drawdown is reduced accordingly.

Scaling-In

There are several ways to scale in. The basic idea is to add another position to an open trade after a determined profit milestone has been reached. This milestone is usually linked to volatility ( or range). Consequently, the stop-loss settings should also be related to volatility. Traders also associate it with new breakouts after consolidation or any other trend continuation signal. Finally, traders could consider adding a new position after the price moves a determined amount in his favor. One way is to wait for a 1R move, move the stop to BE, and add a position.
For example, let’s suppose a trader has a $10,000 account and wants to trade the EURUSD pair, actually trading at 1.1265. On the chart, the trader sees that the 4H range is 27 pips; thus, he sets the stop-loss setting to 81 pips (3X the 4H range). Let’s suppose that his analysis led him to conclude that the following action will completely fade the last upward movement. So, he opens a short trade (sell) with a profit target to 1.885 and an initial stop-loss of 1.1345 for about 3.3R trade. He begins to risk $125, which is 1.562 lots. The price starts moving in his favor, so he sets a new sell order for another 1.562 lots 27 pips below the open, another sell order 27 pips below this second sell order, and a final sell order at 27 pips below the previous order.
At the same time, the stops are moved 27 pips down every time a sell order is triggered. After the third trade, the trader has 4,6 lots., The last one has a $125 risk, the previous one has currently $83.3, and the initial order shows a $41.66 risk. That is so because the stop-loss was moved progressively from its initial value in 27 pip steps. So, even when the total risk should have been $375, the position has tripled after the pyramiding, but the risk has just doubled ($250), which is 2.5% risk the trader was seeking. Of course, there are plenty of variations on this theme. We might choose to split it into more steps 3, 4, 5. Or add positions at larger advances in our favor.

Scaling out

At some point, if the trader continues to add lots to his position, he may risk a swift movement against his position, wiping all then gains. Scaling out is the trader’s right method to plan ahead of time the potential support/resistance zones and set these levels as partial profit targets. Scaling out may be applied using the same volatility concepts. After the last entry, the trader may start scaling out when another measure of volatility or range has been reached, but technical levels should also be analyzed, so a blend of both can be made to make them optimal.

Scaling-In techniques

Scaling-In can be initiated using the following methods:

  1. Volatility/range based
  2. A percentage of the initial risk
  3. Successive continuation signals of the prevailing trend, after consolidation or rejection.
  4. A new entry every time the stop is moved to break-even for risk-free rides.
  5. It can be combined with profit targets to create a series of pyramiding entries: For instance, on the buy-side: 1.-Buy, 2.- Sell at resistance, 3.- buy 2,3,4… units at the pullback. Conversely, so on the sell-side, Sell, buy on support and sell appropriate 2,3,4… units at pullups.

Also worth mentioning is, traders should limit the total number of scale-ins within the desired risk limits, and never above the optimal f of the strategy.

Pyramiding works best on trending markets. But, it can be applied to any large movement to lower initial risk, and only add more positions if the trade continues moving in the desired direction.

Categories
Forex Videos

Position Sizing IX: Improving the Percent Risk Model-Playing with market’s money


Position Sizing IX: Improving the Percent Risk Model-Playing with market’s money


One way to improve the returns of a position sizing strategy without increasing our capital risk is to play with the market’s money. In this video, we are going to develop this idea as a way to improve the percent-risk model.

The market’s money

We define as “market’s money” the gains resulting from the profits of previous trade or winning streak. This is a mentality shift. Instead of viewing recent profits as your own money, you momentarily consider them as a gift of the market to increase the trading size riskless. This has a slight resemblance to moving your stops to break even and let the trade go on. After that action, the rest of the trade evolution is riskless. The concept of the market’s money is especially attractive when the trading strategy has a high percentage of winners because high probability strategies show a higher likelihood of winning streak versus losing streaks.
There are several ways to use this concept, but in this video, we will focus our attention on its use with the Percent-risk model. Precisely, we will use the money gained in the previous successful trades to increase the size of the next trade without increasing the risk of our base money.

The N-Step up position Sizing Strategy

The N-Step-up method uses the N previous successful trades’ gains to increase the size of the next trade. After N trades, the profit is added to the general wallet, to start a new cycle. If there is a loss, the cycle resets and begins again.

The flowchart of this methodology is shown below.
The key idea is that, even when it ends at a loss in the N step, the risk incurred is the only the risk made in the starting position, But if the N-cycle ends as a win, on a 1R reward/risk situation, it will end up with R+2R+3R+… NR gains. On a 2R reward/risk strategy, it will be 2R+6R+ 14R +…
We will try this methodology using the Live Signals Service performance and 1% basic risk to see how the N-Step Up improves it.

Original 1% Strategy

The graph below shows the equity curve growth using a 1% risk over one year of trading, assuming 2 daily trades on average.

When we use Monte Carlo resampling to get 10,000 different 1-year histories, we get the following information.

Average ending Capital: 75,359.86
Max ending Capital : 219,145.26
Min ending Capital: 26,811.62

Probability of Capital ending above 78,604: 43.98 %
Probability of Capital ending above 26,812: 99.99 %
Probability of Capital ending above 10,000: 100.00 %

In the figure below, we can see the likelihood of max drawdown for the 1% Risk model:

Average Max Drawdown: 8.02 %
Maximum Max Drawdown: 27.46 %
Min Max Drawdown: 3.67 %

Probability of a 10% drawdown: 15.44%
Probability of a 20& drawdown: 0.03%
Probability of a 30% drawdown: 0.00%

We can see that the expected max drawdown is 8.38%, with a one in five years ending at 10% and almost no chance to reach 20 percent. Let’s see how this can be improved with one, two, and three N-Step cycles.

The below chart shows the original, plus 1-, 2- and 3-step up position sizing strategies, using semi-log scales to make them fit together in a single chart.

We can see that the advantage of using the methodology is evident, as the 3-Step-up sizing strategy reaches an ending capital of up to one order of magnitude higher (10X), as compared to the basic 1% Risk method.

Let’s see how they perform regarding returns and drawdowns:

1-Step Up Return Stats:

Average ending Capital: 236,427.55
Max ending Capital : 1,306,952.10
Min ending Capital: 34,015.66


1-Step Up Drawdown figures:

Average Max Drawdown: 13.29 %
Maximum Max Drawdown: 33.94 %
Min Max Drawdown: 5.64 %

Probability of a 10% drawdown: 86.21%
Probability of a 20& drawdown: 4.15%
Probability of a 30% drawdown: 0.00%


2-Step Up Return Stats:

Average ending Capital: 625,846.08
Max ending Capital : 8,601,130.02
Min ending Capital: 53,941.54


2-Step Up Drawdown figures:

Average Max Drawdown: 18.02 %
Maximum Max Drawdown: 43.04 %
Min Max Drawdown: 8.31 %

Probability of a 10% drawdown: 99.59%
Probability of a 20& drawdown: 28.29%
Probability of a 30% drawdown: 0.03%


3-Step Up Return Stats:

Average ending Capital : 1,597,715.25
Max ending Capital : 34,224,341.81
Min ending Capital: 53,439.67


3-Step Up Drawdown figures:

Average Max Drawdown: 22.52 %
Maximum Max Drawdown: 58.01 %
Min Max Drawdown: 9.79 %

Probability of a 10% drawdown: 99.99%
Probability of a 20& drawdown: 64.23%
Probability of a 30% drawdown: 0.63%

A variation of this strategy could be made by re-investing only 50% of the profits. This method will significantly lower the returns, although it will also smooth the equity curve. As an example, let’s see the reward and risk figures of a 3-Step Up with 50% reinvestment:

Average ending Capital: 199,952.02
Max ending Capital : 1,181,977.34
Min ending Capital: 34,950.58

Drawdown:

Average Max Drawdown: 12.10 %
Maximum Max Drawdown: 31.89 %
Min Max Drawdown: 5.37 %

Probability of a 10% drawdown: 74.30%
Probability of a 20& drawdown: 1.94%
Probability of a 30% drawdown: 0.00%

We can see that this method is quite similar in performance and drawdown to the 1-Step Up with 100% re-investment, but is not worthwhile, since it reduces the returns to half, while drawdown is only lowered from 13.29% to 12.1%.

Conclusions

We can see that even 1-Step up improves substantially the performance of a strategy (about 4X) with only an increase in the drawdown from 8.% to 13.3%.
We can see also that the best choice for this strategy is 2-Step Up, with a balanced mix returns (average ending equity of $625,846 over an average Max Drawdown of 18%); this is a 10X improvement from the basic 1% sizing strategy with only about 2.2X of drawdown. But, aggressive traders may choose the 3-Step Up strategy, which doubles the 2-Step Up model’s returns with an increase in drawdown from 18% to just 22.5% ( a 25% increment).

Categories
Forex Videos

Donald Trump v Covid 19 – Forex Trading Tips!


Donald Trump v Covid-19, the fight is on, but how will the markets fare?

All the world’s a stage, wrote William Shakespeare in his comedy; As you like it. And one thing is true. The Donald Trump presidency has been theatre, the like of which we have never seen in politics in the western world. Let’s go back to December 2019; the US economy was buoyant with record employment, record stock market highs, and the US was a few weeks short of signing a massive phase one trade deal with China. Donald Trump was on the cusp of going down as the greatest American President ever, in terms of steering the US to economic glory.
Step forward a few months, and the global Covid-19 pandemic has all but reversed the economic fortunes for the US with massive unemployment, an economy in freefall, instability, and with the presidential elections just a month away, at the time of writing. Donald Trump and his management of the Covid crisis in the US now looks likely to leave a legacy of being one of the worst US presidents ever.


Love him or loathe him, President Trump has been a major critic of the Chinese government, who he blames for what he calls the China virus. He has spewed out vitriol against them in many statements, and this has led to threats of tariffs, sanctions, bans on Chinese companies operating in the US such as tik-tok, WeChat, Huawei for so-called security reasons, and now that he has had a taste of the virus himself, one can only imagine how things might be escalated from here, when and if he recovers.
Many would argue that Donald Trump testing positive for Covid is poetic justice for a man who consistently played down the seriousness of the disease, while criticising people such as his presidential opponent, Joe Biden, for wearing a mask, when he himself often refused to do so. In fact, it was likely that a recent event in the White House Rose Garden, regarding the nominee for the vacant supreme court judge, was very likely a super spreading Covid event, where many members of the Republican team are dropping like flies, as one by one, as they test positive for Covid.
People will say that Donald Trump had it coming, and it was only a matter of time and wonder how on earth the most secure building on earth, the White House, with all of its technology, and private hospital wing, could allow the President and so many of his aides and colleagues to become infected. This was probably down to sheer bloody mindedness by Donald Trump, who just didn’t take the disease seriously enough.


And getting back to the important presidential election on the 3rd of November, everything is now up in the air, with a quarantine of 10 days and a period of convalescence required, should President Trump shake off the disease, bearing in mind he is 74 and overweight and has a gruelling schedule that many much younger men would not be able to cope, with is it likely that he will be fit enough, should he recover, continue with the election campaign?


The financial markets will see great uncertainty regarding the prospect of President Trump returning for a second term to the White House. There are constitutional issues with regard to voting, which is already going on, with many ballot papers already having been returned, and if Donald Trump is not able to stand, questions remain about how that might affect votes for the second in command, Mike Pence. And with Joe Biden leading in the polls, institutional investors will be worried about extra regulations and higher taxes, should he win the presidential election. And with all this uncertainty, we can expect a great amount of volatility in the markets where institutions will be recalibrating their portfolios and where a risk-off event will take place, with stock markets edging lower, if not falling, and a great deal of volatility in the currency space, which might see a dollar resurgence. Because this event is unprecedented, it is really hard to call. But one thing is for sure; we will see extra volatility.

Categories
Forex Videos

Nancy Pelosi for President?

Nancy Pelosi for President?

Thank you for joining this Forex academy educational video.

In a shock announcement, President Trump has been tested positive for the Coronavirus, and in a shock, has been moved to a military hospital for further treatment, including….

Receiving the drug Remdesivir in order to try and reduce the viral load and in the hope that it will reduce the length of his illness. The drug has received mixed results in patients, with some having seen no effect at all and others statistically seeming to spend less time in hospital.

Donald Trump was taken to hospital as a precaution, looking pale and tired, while tweeting ‘’it is going well, I think’’, but he 74, and is overweight, and it is well known within his circles that he enjoys a poor diet of hot dogs and burgers and takes little exercise, in which case the odds are stacked against him.
The dynamics of the election has completely changed in just 24 hours, Joe Biden wished the president well and has pulled negative adverts, and the timing of President trump’s illness could not be worse, bearing in mind we are just a few weeks away from the date of the election and that a dozen states have already sent out postal votes to the electorate and many of these will have been returned with votes cast.

But interestingly, the timetable, which is already incredibly stressed, cannot be moved because the day of the election is set in stone by the US Constitution and falls on the 3Rd of November this year. For it to change, both houses, the republicans, and democrats would need to agree to postpone the date of the election, and with the Democrats holding the majority of power in the house, this is very unlikely to happen.

But in a twist, if the votes are not counted, buy a hard deadline in December, and the winning President not be announced, the House of Representatives would need to vote on this and make a decision who would be the next President of the United States. If they were unable to make a decision, in accordance with the Constitution of the United States, the speaker of the House, Nancy Pelosi, will automatically become President.

The financial markets, as will the rest of the world, be glued to their television screens over the next few days watching this situation unfold. Never before in the history of politics has there been quite such a dramatic theatre, the likes of which would make the most incredible novel or enthralling movie. But in reality, people’s lives and livelihoods are all heavily dependent on how President Trump progresses through this terrible illness. Certainly, all of us here at Forex Academy wish him a speedy recovery.

With regards to financial trading at this most uncertain times, one thing is for certain, we will see extreme volatility, and should the President’s health deteriorate, we might see sell-offs in the stock markets within the United States, which could lead to further sell-offs abroad, this might lead to a strengthening in the United States dollar.

And in another twist, should President Trump become critically ill and then recover the unquestionable dislike that he has for the Chinese, and what he calls the China virus, maybe heightened even further, causing an even greater fallout out between the two Nations.

Categories
Forex Videos

FOREX – Fundamental Analysis for Novices – US JOLTS Job Openings!


Fundamental Analysis for Novices: US JOLTS Job Openings


Thank you for joining the fundamental analysis for novices’ educational video. In this session will be looking at United States JOLTS job openings. Jolts defines job openings as all the positions that are opened on the last business day of the month. The criterium is that a specific position exists and that there is work available for that position.


If it’s the first time that you have seen one of our fundamental analysis videos for novices, we strongly recommend that you use an economic calendar every day if you are not already doing so. An economic calendar should act as your Bible in order to trade around it while avoiding high impact news data releases which may have a negative impact on your trades.


The key components of any economic calendar are the time of the release, the day and date, the type of event, and the impact that any such data release will likely have on the market, which is typically low, medium, and high. And where we can see an impact bar here displaying various levels of impact from low, which is in light orange, to medium shown in a darker orange and taking up a third of the box, to the full red impact box, which means that any data release is likely to cause extra volatility on its release.
Most economic calendars will also show you the previous period’s data release, which might be weekly monthly, quarterly, or annually, and also a general consensus of where market analysts believe the data statistics will be upon its release. And then we have the actual release data, which will be populated upon the release of the data. Most brokers will provide this information almost instantaneously to help your trading decision making.


Here we can see an example of the US JOLTS job openings for June 2020, which was released on Monday the 10th of August and came out at 3 p.m. BST and we can see the various data details including May’s release, the forecast or consensus, and the actual number of 5.89 million, which was higher than the consensus and higher than the previous for May.
Although the impact bar for this particular news release was set at low, because of the implications of the virus fallout, especially within the United States, which has suffered a huge economic collapse and massive unemployment, the market will be looking for any signs that jobs are rebounding, and this is a positive sign that job openings are appearing on the market.
This means that United States companies are confidence that they are recovering from the pandemic and that they are growing to a certain extent and need extra labour manpower to fill those vacancies which have been created within those organisations.

Typically, any increase in job openings is good for the United States economy, and therefore you might expect that United States stock indices to increase and where this is also good for the US dollar. However, when we see that job openings are lower, this would be bad for the United States economy and also bad for the US stock markets and the United States dollar.

Therefore, in these unprecedented times, we should not take for granted even US data releases, or from any economy, such low-impact status data, which at any normal time in history be met by a neutered response from the marketplace. Sometimes even low impact releases can cause extra volatility, and you should bear that in mind, especially until such time as the pandemic as gone away and things returned to some kind of normality.

Categories
Forex Videos

FOREX – Swiss go to the polls to vote on limiting EU immigration! CHF Prediction!

Swiss go to the polls to vote on limiting EU immigration: – where next for the Franc?

Thank you for joining the forex academy educational video. In this session, we will be looking at the Swiss who go to the polls to decide on limiting EU immigration and what this might do for the Swiss Franc.

Switzerland is a beautiful country with magnificent scenery and a high standard of living. It has become extremely attractive for people from the EU to visit via the open borders policy, and subsequently move and set up home in the country.

The Swiss national bank or SNB sets monetary policy within the country of Switzerland. The Swiss Franc, which is commonly referred to as swissie, or CHF, it is the fifth most traded currency in terms of global FX liquidity behind the United States dollar. It is considered to be a major currency. It is considered to be a safe haven currency because of the country’s economic stability, low-interest rates – making it attractive to borrow in, and making the currency attractive as a hedging mechanism. The SNB prefers a weaker currency to make exporting more attractive. 65% of its export market is with the EU.


This chart shows the US dollar CHF pair going back to July, the area marked position A shows a high of 0.9465, followed by a bear trend which takes us down to a low of 0.9000, which is a major psychological area of support for the pair, and then a subsequence bull run to its current level of 0.9286.

On Sunday, the 27th of September, Swiss voters go to the polls to vote on limiting immigration from the EU, which has seen a sharp increase in the last ten years of 30%. The vote, known as Ecopop, could see immigration from the EU capped at just 0.2% of the overall population, thus restricting migrants to around 16,000 per year and effectively closing its borders to the EU. It also calls for 10% of its overseas aid to be spent on family planning projects in developing countries.


This is where things get complicated because the Swiss has certain rights and trading privileges, including a free trade deal, and is based on the Swiss open borders’ agreement it signed up to as a part of its preferential trading pact with the EU. 25% of its workforce comes from within the EU. The counter-argument is that if you lose them, you lose the high-quality life that everyone in Switzerland enjoys.
A breach of this mechanism would throw the agreement into the long grass and potentially cause economic uncertainties with the trading partners with which could cause the levies being introduced by the European Union, which in turn would have a negative impact on the Swiss economy. While this may be somewhat negated by a weakening of the Franc, it will likely cause volatility in the markets, especially for the USDCHF and other CHF pairs. More worryingly, it could also cause volatility in the Euro, because this will look similar to the Brexit situation, to a degree, whereby major countries within the block and those exterior trading partners are losing faith in the closely tied and constrictive trading arrangements.

Categories
Forex Videos

The New Cold War Between America & China & What It Means For Traders!

The New Cold War

Thank you for joining this forex academy educational video. In this session, we will be looking at the escalating tensions between the United States and China.


If we believe everything that western media companies tell us about China and, in particular, regarding the Uyghur Muslims of Xinjiang province, we would have a right to be extremely concerned. Human rights advocates are calling it cultural genocide.
Max Blumenthal is an American investigative journalist for The Grayzone, and he believes that US corporate media and the US Government are deliberately sending out false news about China in order to disrupt China’s global rise to being a superpower and advancing the USA as the number one economic and military power. He calls the Executive Commission on China anti-china institutions, while Donald Trump refers to China as liars, thieves, and where he refers to the pandemic as the China virus.


Grayzone uses reliable sources to provide information regarding various US departments, which are actively initiating anti-China propaganda to destabilize China’s continued economic growth.


Max reports that while at a meeting recently in Congress, Capitol Hill, he met Omer Kanat, who is the leader of the World Uyghur Congress, a multi-million US dollar dissident group, which is entirely funded by the US Government. They are primarily focused on regime change and are heavily responsible for providing the western media with reports about the Uyghur’s. Max immediately confronted Kanat about the story from 2018 about the concentration camps in Xinjiang, where millions of these Muslims were supposedly imprisoned. Kanat admitted that he was supplying western media sources with the information about these camps and human rights abuses. And Kanat told him that some stories were provided by other western media sources and some direct witness statements.
This feedback loop, as Max calls, it is the reason why the story is being fuelled by misinformation to portray China as a new Nazi Germany to the West.

Grayzone dug deeper and was only able to find two other sources to back up the concentration camp story: one was Adrian Zenz, an Evangelical fanatic, who, in his 2010 book, Worthy to escape. Zenz has declared he is on a mission from God to wipe out the Chinese Communist Party, which he views as a satanic entity. Zenz believes homosexuals are evil, and yet he has been called as a witness by some US media groups to provide evidence on the human rights abuses of millions of Uyghur Muslims in so-called concentration camps in Xinjiang province.
The other source Max found was the group Chinse Human Rights Defenders, which is a dissident group based in Washington and funded by the US Government. The group says it has testimony from only 8 Uyghur Muslims.
Max says there is simply not enough evidence to collaborate the stories of forced labour, human rights abuses, the extermination of Muslims and their culture, or even that these camps exist.


The Chinese Media Group CGTN, interviewed Gerry Grey, a duel English, Australian passport holder, and Ex UK police officer, with ten years of service, who has travelled extensively five times around China, much of it on his bicycle, since retiring in 2005. He travelled to Xinjiang by plane 2019 and said there were no restrictions there. He could hear the call to prayer 4/5 times per day and witnessed many mosques, something he saw all over China, with some towns having 3 / 4 mosques and where Wiki reports a total of 25,000 mosques in the region alone. He said he could hear the Uyghur’s language being used everywhere and that it was just not true that the Uyghur’s and indeed the Muslim way of life was being eradicated by the Chinese. What’s more, he could find no evidence of concentration camps while travelling freely in the province.
So, are we being fed the truth? The narrative is predominantly being driven by US media groups, and they are being led by the US government. And the flames are then being fuelled by other Western governments, including Great Brittan and many countries in Europe and Australia.

In fact, US officials have been flying around the world looking for support in the so-called fight for injustice and human rights abuses in Mainland China and Hong Kong since the New Security Bill was passed in June 2020.
So who is right and who is wrong? If you believe the above, then it is clearly evident that we are not being fed the correct information about Chinese Muslims and human rights abuses, and it would appear that misinformation and fake news is being used to try and destabilize the Chinese economy, possibly with the effect of slowing it down in order to maintain united states economic supremacy.

But what does this mean for us as traders; well, we are seeing extreme volatility in the markets every single day right now, and while much of this is due to the economic fallout from the pandemic, a great deal of this is because of the continuing spat between the United States and China, and where this looks to have no end in sight.

Therefore traders should be looking out for updates on the status between the relationship of these two powerhouses and expect more market volatility to come.

Categories
Forex Videos

Forex Position Sizing Part 8 – Optimal F Revisited – Why You Must Know it?

Position Sizing VIII – Optimal F Revisited: Why You Must Know it?

Now that we know the properties of optimal f, many of you may ask why we bother with this theme, that Optimal f is just a theoretical limit nobody would even approach.

Well, that may be true ( or not). Nonetheless, information is power, and knowing the optimal f of our strategy or system is quite informative. To begin with, maybe unknowingly, you are trading beyond the optimal point.

The next graph shows several distributions’ f-curves with different percent winners and payoff (reward/risk ratios) that may match different trading systems.


In the graph, we can see that one of them, shown in red, is unprofitable, so the best position size is zero. The first profitable distribution shows its optimal f in the vicinity of 5%. That may indicate the system is poor, and a trader will be beyond its optimal f when several simultaneous trades are taken.
By knowing the optimal f of the strategy we are using, we can assess its quality and figure if we breach the optimal trading limit, risking too much. Thus, optimal f will allow us to compare the real power of a trading system, measured by its geometric mean. The best attainable geometric mean will indicate which trading system to choose among a list of candidates.

A safer way to compute optimal f?

Ralf Vince defines Optimal f as the divisor of the biggest loss, the result of which is divided by the total cash to know how many pips or contracts to have in the next trade. But he assumes that the worst loss has already happened. It is much better for a trader to assume it has not happened.

Due to the properties of the random processes, the statistical properties vary from sample to sample. There is no way to assess the real value, and that is true for all statistical distributions of trading systems.

Montecarlo resampling

With the use of computers and high-level programming languages such as Python, we have on our hands the possibility to create variations of the sequence of trades we took in real life. The use of Monte Carlo resampling will show a more realistic picture of a trading system, signaling its limits and allowing us to be on the safe side.
As an example, let’s examine the performance of forex.academy’s Live Signal service.
The system shows the following basic stat parameters:
STRATEGY STATISTICAL PARAMETERS :

Nr. of Trades: 145.00
Percent winners: 67.59%
Profit Factor: 2.41
Reward Ratio: 1.16

The code to create several thousand different histories is simple. We use Cython to speed up the process. Cython translates Python into C:

The gethistories() function returns a container with the desired number of trade histories, and with the number of desired trades on each history. This function returns just wins and losses, not capital accumulation.

Using a fixed trade size of 0.1 lots, applied to 10,000 paths, resulting from the Monte Carlo resampling of the original path, on a hypothetical account starting with $5,000, we obtain the following graph, representing about one year of trade activity.


The “smoke cloud” seen is typical of resampling. In the figure, we can see that some paths are luckier than others. The less lucky path shows a final equity of about $19,200, while the most profitable goes over $29,700. This will result in differing optimal f values. That happens because the laws of chance change the sequence’s values; so, every sequence will have its optimal fraction. We look for the lowest optimal f, which will minimize the risk of overtrading.

Finding a safer opt f

This procedure will also help us better assess the optimal f. That means we will compute all the optimal f of the resampled paths. As shown in the histogram below, we obtain a distribution of values that follows a normal distribution.


We can, then, compute the mean, max, and min of the optimal f collection. In this case, are:

  • max opt f: 0.915
  • mean opt f: 0.672
  • min Opt f: 0.39

What we look for with this procedure is to find out the minimum opt f value, since we want to minimize the risk of overtrading. In this case, our min opt f is 0.39, which is large enough to be on the safe side when using multiple positions.
For computer geeks, this is the Python code to do optimal f

Using these three functions, we can easily compute the opt f values of a collection of trade sequences in just one line of code. The second line is just to plot its histogram.


Here rawHist is a container of these sequences or histories. Optf is used to store the values obtained.
Stay tuned! The next episodes will explore more position sizing strategies.

Categories
Forex Videos

Forex Position Sizing Part 7 – Optimal Fixed Fraction Trading!


Position Sizing VII – Optimal Fixed Fraction Trading (I)

In the previous video, we have discussed the virtues and drawbacks of the Kelly Criterion. But, the Kelly Criterion formula is valid for fixed outcomes, such as bets, in which the gambler wins or loses predefined amounts, and the probability of success is known. In this video, we are going to explain Ralf Vince’s Optimal f. Optimal f is Ralf’s way of applying the concept of Optimal Fixed Fraction to the markets.

Investing in the markets generates a sequence of wins and losses. If this sequence has a positive mathematical expectation when using a normalized risk unit, ” […] there exists an optimal fraction between zero and one as a divisor of your biggest loss to bet on each and every event.” (Ralf Vince, The handbook of Portfolio Mathematics).

Many people think that the more you bet, the more you’re going to make. That is true in risk-free investing, but it is evident that if you risk 100% of your capital in a trade and lose, you’re losing all your funds. As we have seen in the previous video, there exists an optimal bet size that creates the highest multiplier for your initial capital. This value is different for strategies with distinct parameters.

The figure below shows the return curves of two games after 100 bets. The first blue one corresponds to the fair coin toss game with a 2:1 payoff. The amber curve corresponds to a game with 30% winning percent and 4:1 payoff. We can see that the top of the curves representing the optimal fraction to trade is different, as expected.


How to find the optimal f under market conditions

As said, the Kelly Criterion is valid when the size of the payoff and probability of success is known. When it is not, such as in trading, the procedure to find the optimal fraction is making iterations using different bet sizes to determine the historical best value. Ralf Vince proposes to find it using the Geometrical Mean (GM). He calls HPR to the return of a single trade:

HPR = 1 + f *(-trade/biggest loss)

The product of HPRs is what the calls The Total Wealth Return (TWR)

TWR = ∏(1 + f *(-trade/biggest loss)), where ∏ stands for product.

GM = TWR ^(1/n)

Thus, the Geometrical Mean is the n-th root of TWR, Where n is the number of trades. This Geometric Mean is the growth factor of the strategy.
By looping through f values between zero and one we can find the f for which GM is the highest.

The graph represents the same two games shown above, but depicting the Geometric Mean curves for the different fractions from zero to one. Values below one represent a negative growth factor, meaning the trade size leads to the loss of the capital.
Doing this on Python is straightforward:


To summarize:

  1. We take a list of trades of our trading system, with a standard 1 unit position size
  2. We create a loop from 0 to 100 compute the individual HPR of the trades using the different fractions.
  3. We compute the HPR for each trade fraction
  4. We compute its geometric mean (GM)
  5. We find the optimal f, which is the fraction that delivers the highest GM

Once found, we compute the optimal trade units using the formula

Units = Largest Loss / f.

for example, if our largest loss is $100 and f= 0.2, then Units = $100/0.2 , or $500. This means to trade one unit for every $500 in the cash balance of your trading account.
We see that the optimal fraction is a divisor of your biggest loss that gives you the dollars needed in your account for every unit of trade (lot or contract)
In the next video, we will continue discovering the properties of the optimal f, stay tuned…

Categories
Forex Videos

Position Sizing Part 6 – The Kelly Criterion! How To Find Your Optimum Risk In Forex!

Position Sizing VI: The Kelly Criterion

The Kelly Criterion is a formula that finds the optimal amount to bet based on the percent of winners and the reward/risk ratio. It was published by the Texan-born scientist John L. Kelly, in a paper entitled “A New Interpretation of Information Rate.” The formula is as follows:

f% = P – [(1-P)/R]

were, P is the probability of winning, and R is the reward/risk ratio.

For instance, in a coin toss game in which you win $2 when heads and lose $1 when tails,

f% = 0.5 -[(1-0.5)/2] = 0.5 -0.25 = 0.25%

The formula indicates that you need to bet 25% of the available cash for optimal growth.


Fig 1 – Final equity as a function of the percent bet. Coin-toss game with a 2/1 profit factor after 100 bets, starting with $1.

The fig 1 shows that in a winning game, there is an optimal bet which allows for the maximal growth of the capital. We can see also that after the optimal bet value is surpassed, the risk increases while returns decrease. Therefore, betting beyond optimal is harmful.
Another interesting fact is that the growth curve is steeper as the number of bets (trades) grows, and decreasing the position size by small amounts will significantly harm the overall growth.

The virtues of trading using the Kelly Criterion

Trading using the Kelly Criterion produces the fastest growth. As an example, the next image shows the progression of the equity curve with the same sequence of gains and losses, using 15% and 25% trade sizes in the mentioned coin-toss game. Please, remember, the game started with 1 dollar, so the figure shown in vertical axis of the image is a multiplier. If you’ve started with $1,000 at the end of the 100 tosses, you’ll end with $30 million using the Kelly Criterion (amber curve).


In the image, we can see that the 25% trade had a 30,000X profit in 100 bets, whereas the 15% trade size has a mere 2,200X. That difference grows with the number of bets. We can see also that the difference is not that much in the first sixty trades, but it explodes after trade nr. 70 and especially after trade nr. 90. Thus, the Kelly Criterion does not show its effects in the short-term; thus, trader should let it go long-term.

The downside of the Kelly Criterion

One downside of using the Kelly Criterion is that even on a fair coin-toss game with 2:1 reward/risk ratio in which we know the exact optimal position size (25%), the random nature of the coin toss would make it seem as if the optimal size should be different. The following figure shows 20 different coin toss curves of 100 bets using real random sequences.


The figure is set to log scale because the difference in the outcomes are so high that a linear scale does not reveal what we are looking for. In the image, we can see that the lower curves show its peak below the theoretical 25, while the more successful outcomes show optimal fractions of up to 42. This explains how difficult it is to find the optimal fraction on a trading system in which we only know the historic parameters, not the true parameters.
Linked to this, comes what we already have said: using the optimal fraction sizes may result in huge drawdowns.

Drawdowns

Similar to the growth curves shown, drawdowns cannot be fully predicted but using Monte Carlo simulations, we can create a good approximation of the typical and maximum values. On the next figure, plotting the histogram of max drawdowns, we can see that the typical value for the Kelly Criterion sizing is about 85% drawdown.


In the next figure, we can see the max drawdown probability plot. We observe that the likelihood of a max drawdown of at least 95% is about five percent in sequences of 100 bets, or once every 20 occasions. Therefore, we should assume the possibility of it happening over time is a sure thing.


So, if the Method is not tradeable, why waste our time?
Although it is rather hard to trade using optimal fractions, we can make use of the concept of maximal equity growth. So, stay tuned for practical applications of the Kelly Criterion in the future.

Categories
Forex Videos

Better Bid Or Better Offered – Determining Forex Trends!


Better bid or better offered?

In the old days of currency trading, long before the internet, around the late 1970s to mid-1990s, banks who traded in the foreign exchange market would largely rely on brokers to feed them exchange rate prices. This was much quicker than phoning around 150 banks in London, or the other major financial centres, in order to try and find a bid or offer which matched where they wanted to trade, although many of them would do this as well with preferred trading partners.

It was much easier to call up a broker who had a team who was directly speaking with all the banks simultaneously, and again, this applies to all the major trading centres such as London, New York, and Frankfurt.

Most brokers would call prices, which were offered to them by their banking clients, down a direct squawk box to the banker’s desk, in order to relay movements in foreign exchange currency rates. If the bank liked a rate, they would trade on the bid or the offer. Bank names would be checked for credit and risk purposes, and the deal would be closed within a few seconds, usually.

And because the current technology was not available, the volatility which we take for granted in the markets was pretty much unheard of and where brokers wood simply quote the exchange spreads as prices moved up and down. Nowadays, that would be absolutely impossible because an exchange rate can move 50 pips in a few seconds.

One of the features that brokers wood call out along with the prices was whether the market was better offered or better bid. In other words, whether there was more money on the offer than the bid or vice versa. This would suggest to the bank receiving the quotes that more people were selling than buying, or the other way around, and this type of information would influence how they traded currency pairs and, indeed, other sections of the currency markets like cash deposits, certificates of deposits, and forex forward rates.

In a market such as forex, where the volumes are not known, it is difficult to know where the offers and bids are greater because there are so many brokers and market makers in spot FX it’s difficult to see what volume is going through at any given time, although candlestick sizes and shapes can give a level of accuracy here. But another way is to look at trends to determine where the market is better bid or better offered, and that tool is the stochastic overbought/oversold oscillator.

This is a 1-hour chart of the GBPUSD pair, and at position A, if you follow the vertical line down, you can see that the stochastic indicator reaches the oversold position at the 20 line, with a standard setup of 5,3,3, and the pair acts accordingly and reverses the sell-off and moves higher. Now let’s focus on the vertical line at position B, where we can see that again, the stochastic shows oversold. However, this time, if we follow the vertical line, price action does not move higher. There is a very slight pullback, before a continuation to the downside. This tells a professional trader that the market is not going with the stochastic indicator, and at this time, the market is better offered than bid: in other words, there are more sellers.

If we follow so the chart across to position C, again, we see the stochastic showing oversold at the 20 line, and after a very brief pullback, the pair moves to the downside because there are more sellers than buyers, as you might expect, having seen a recent bear trend.
Always look for when the stochastic is working as per position A and failing as per position B and C. This will tell you where there are more sellers than buyers, or the opposite, as well as the market being overbought or oversold.

When trading, always try and look the where the volume is greater, and if therefore if there are more buyers than sellers, or vice versa, and if you keep this in the back of your mind to help you find weaknesses in directional bias, and this will ultimately will help you in your trading.

Categories
Forex Videos

Forex! China and USA the fire just got stoked – How To Trade The Ongoing Feud!

China and USA, the fire just got stoked


Thank you for viewing this forex academy educational video. In this session, we will be looking at the continuing tensions which have been escalating between China and the United States of America.
Tensions began to rise just after the Chinese phase 1 trade deal purchasing agreement with the United States came into effect after causing a record-breaking move higher on US equities,

especially the Dow Jones 30, as the market expected the US economy to grow as a result. The ink was barely dry on the agreement when the coronavirus broke out in China and eventually spread across Europe before catching hold in the United States of America.
President Trump often refers to the disease as the China virus, and an escalation between the two nations has been growing ever since. Recently, President Trump banned:

WeChat and TikTok from being used by the American public and organizations in the United States and where President Trump has been putting pressure on European countries to stop using Huawei for 5G g-technology. The reasoning behind this is that the Chinese companies which own the technologies might send the collated personal data of US citizens and firms to the Communist Party of China. This has led to tit-for-tat escalations building between the nations, which could not have come at a worse time bearing in mind the global slowdown with economies suffering due to the ongoing Covid pandemic.

On Saturday, the 15th of August, the United States, and China were due to have had a videoconference meeting to discuss the 6-month anniversary of the signing of the phase one trade deal between the two Nations. However, this was surprisingly canceled, with American officials citing a delay due to apparent scheduling conflicts and where the United States requested more time to allowed China to purchase more United States exports.
This should have been a 6-month compliance review you wear the US trade representative Robert Lighthizer, US treasury secretary Steven Mnuchin and Chinese vice-premier Liu He had agreed should have taken place. Bearing in mind that this would have been arranged six months ago, it seems rather than usual that all of a sudden, there should be a scheduling issue. Surely this must be down to the fact that there is a growing breakdown in the relationship between the two Nations. One has to wonder what is going on in the background? Are the Chinese sticking to their part of the deal with the enormous purchasing requirements of American goods and services, especially products from United States farmers, which runs into millions of tons of products. And as a result of which saw US equities pushed to record highs.


With the United States in the grip of the worst economic turndown in its history, the last thing it needs at the moment is for the Chinese to renege on the deal.

Donald Trump has said that the trade is, and I quote: ’’ is doing very well’’, but has not so far commented on the delay of the meeting. The Chinese side is saying that, and I quote: ’the new date has not been finalized yet’’.

But it is known that China is behind with the purchasing agreement. However, markets are predicting that this is purely a knock-on effect from the Coronavirus lockdown they had earlier on this year ear and that this is the reason for them not being able to honor the agreement which would contain a clause such coving a force majeure.
Nonetheless, the financial markets have been twitchy as the escalation grows, but US stock indices have not suffered, but where the American dollar is currently on the back foot due to the ongoing pandemic within in the United States and, no doubt, tensions between America and China will be playing a part also.
The failure of the phase one deal would be a political scoring point for the democratic presidential candidate Joe Biden who recently said that the historic agreement was ‘’failing’’.
So, what can we expect? Certainly, escalations in relationships between these two Nations is likely to continue, and we will see market turbulence as a result. Stock indices in the United States seem to be running on helium and are largely unaffected by the coronavirus. However, should the Chinese pull out of phase one deal, this would cause a potential sharp fall in the United States equities.


The American dollar remains under pressure, and this would also see great volatility should any such announcements occur. During these times, which are unprecedented, and where no end seems to be in sight, traders are advised to tread with caution and used tight stop losses at all times.

Categories
Forex Videos

Where Next for the Dow Jones US Elections In sight!

Where Next for the Dow Jones? US Elections in sight.


Thank you for joining this forex academy educational video. In this session, we will be looking at the Dow Jones 30 industrial average index.

In this chart, we can see price action going back to the 15th of July why where the index was at 24,659 and where it had since rallied to 27,889, which is quite staggering when you realize that’s the record high before the coronavirus was just above 29,000, and where the United States is still in the grip of the covid pandemic and where businesses are suffering badly and where unemployment is still at historic highs not seen since the second world war.

And yet the Dow Jones stock markets, one of the benchmark indices in the United States, is flying in the face of fundamental analysis, and indeed common sense, and is rallying to the upside almost at a record-breaking pace. Market analysts, traders, and leading names in the stock markets investing arena have been suggesting that the Dow Jones would collapse down to the levels we witnessed in march where the index was at 18,200: A total collapse from the high of a few weeks previously.

And while the index causes for a breather before the next push in either direction, traders will now be in to focus on the United States elections in a few week’s time, And where Republican Donald Trump is not doing well in the ratings due to his handling of the Covid virus within the USA, and where it was commonly believed that Donald trump’s policies on low taxation and less regulation, and a push for lower interest rates were of great benefit to American corporations, thus pushing the Dow Jones to the highs we saw before the virus pandemic. The US stock market loved Donald Trump. It is now believed that the Democrat opposition, Joe Biden, may sweep to a November election victory and that if this happens, many of Donald trump’s policies, including taxation, would be reversed.


Therefore, we should presume that if Joe Biden won the election and the democrats reversed Donald trump’s policies that the American stock market, including the Dow Jones 30 industrial average index, would suffer and where analysts predict a 20% fall on the basis that Biden reverse Trumps’ policies and would likely increase capital gains tax to as high as 39% for upper-income individuals, bearing in mind that it is the higher earners that tend to buy more stocks.

In times gone past when the biggest factor to determine the value of stocks was companies earnings, it would appear that this no longer matters, fundamentals have gone out of the window, and where if an incredibly disruptive and economically devastating pandemic cannot crush the Dow Jones industrial average, we should in fact not be at all surprised that not even an election defeat for Donald Trump will necessarily mean a collapse in the Dow Jones index. In fact, if the market is purely driven by trend, which it appears to be, we could see the previous highs breached. Sellers beware.


Categories
Forex Videos

Buffett dumping Wells Fargo benefits Bitcoin


Warren Buffett and its company Berkshire Hathaway have substantially cut their position on Wells Fargo, selling a whopping number of 100 million shares. The, as they call him, Oracle of Omaha, is continuing to trim his position in bank stocks, which subsequently means that he is bumping up the bull case for gold and Bitcoin.
Berkshire Hathaway reportedly held $32 billion in Wells Fargo stocks at one point, while the investment conglomerate now owns only 3.3% in equity of the lender, coming up to just $3.36 billion.

Why Did Buffett Dump Wells Fargo


Throughout his career, Buffett always spoke about the importance of value investing and cash flow. He typically prefers businesses that have quite predictable and stable operations and results in consistent profitability.
In July, Wells Fargo posted a loss of $2.4 billion, recording its first loss since the 2008 financial crisis. Following the disappointing quarterly report, the bank said that its dividends would be cut to 10 cents per share.
This month, Moody’s financial analysis report showed its rating going down from stable to negative. The reason for this was mainly how slow the process to overhaul its governance was. Allen Tischler, a Moody’s analyst, said:
“Our change in outlook reflects Wells Fargo’s slower-than-anticipated pace when it comes to resolving its legacy governance, oversight, compliance, as well as operational risk management deficiencies. The aforementioned slow pace weighs on its expense base, further undermining the company’s earnings potential.”


The confluence of the quarterly loss, the dividends being cut, and the downgraded outlook presented by analysts likely led Buffett to trim his position in Wells Fargo.
Berkshire’s portfolio has had a reshuffle in recent months as its investments shifted more towards Barrick Gold. While decreasing its exposure to the US banking sector, Buffett invested in gold as well as in Japanese trading companies.
How Does This Benefit Bitcoin?
The decisions Buffett made recently show that he is seeking safety in terms of cash flow as well as a hedge against inflation. The large Barrick Gold investment fuels the bull case for Bitcoin simply because the perception of BTC as a store of value is greatly improving, especially given the tight correlation between gold and BTC since the March 2020 crash.

BTC would “cannibalize” gold in the future


While Buffet doesn’t want to get involved in cryptocurrencies, other notable investors, including the Winklevoss twins, have very strong beliefs that Bitcoin as “digital gold” could compete against gold over the long term. Of course, Bitcoin is also interesting to investors because of its immense upside potential. When comparing the size of the two markets, Bitcoin’s market capitalization is still only around 1.5% of gold.
Cameron Winkelvoss, the co-founder of Gemini, announced that Bitcoin already has significant advantages versus gold. He said:

“Bitcoin has made significant ground on gold —going from white paper to over $200 billion in market cap in under a decade. Bitcoin will continue to cannibalize gold dramatically over the next decade.”
Wall Street veteran and the host of the Keiser Report, Max Keiser, also believes that Buffett exiting the dollar is quite a bullish signal for the price of gold and Bitcoin.

Categories
Forex Videos

Position Sizing Part 5! Optimise your returns using the Percent Risk Model

Position Sizing V: Optimize your returns using the Percent Risk Model

Besides the constant position size, the Percent Risk Model is the most used method. The Percent Risk Model allows us to define the number of lots (or mini/micro Lots) as a fixed percentage of the available cash in the trading account.

The risk is defined as the loss incurred if the trade hits the stop-loss order. Thus, every trade must have at least a pre-defined entry and stop-loss. The monetary value in pips from the entry point to the stop-loss is the risk of the trade. The size is determined by MCP simple formula, as already stated in a previous video presentation.
M=C/P
M is the number of mini-lots, C is the cash at risk, the percent risk decided by the trader, and P is the pip distance from entry to stop-loss.

C, the cash at risk, can vary widely, and it will determine the profitability of the strategy and, also, the max drawdown incurred.

From the MCP formula, we can deduct that M increases as P decreases. So tight stops wold allow traders to increase M without increasing the dollar risk C, but, before analyzing this methodology, we have to emphasize that the stop-loss setting must be set at its optimal place. Setting them too close to the entry to increase the position size will force the trader to close a position that would be profitable with a proper stop setting.
In our site, Forex.academy, we have already published several methods to optimize the stops. We recommend you to give them a look.

Masteting Stop-Loss setting: How about using Kase Dev-Stops?

Maximum Adverse Excursion

The Case for Average True Range-based Stop-loss Settings

The Constant Size Risk Model

The Percent Risk Model is a compounding method. The constant-size trading method uses a single size, independent of the amount of cash available, so it has drawbacks. The first one is that the size of the position does not decrease on drawdowns. Imagine a trader risking One-tenth of the initial cash, experiencing a 10-losing streak. He will be wiped out! Also, If he is successful, this position sizing method does not allow him to use the money gained in the markets to make more profits. It is like having a constant account and withdrawing all the gains. Thus it is much more difficult to create wealth.

To see the importance of compounding, let’s look at the difference between a constant mini-lot size and a compounding 1% risk in one year of trading using the trade signals of our Live Signal Service, starting in both cases with $10,000:


In the image, we can see that while the profits of the constant-sizing methodology are linear, the equity curve of the percent-risk model is exponential. We can also observe by the ripples of the curve that the Percent Risk Model has higher drawdowns, which grow (moneywise) with the trading account’s growth. These are the main features of these sizing models.

Optimizing Our Percent Risk Model

The figure below, shows the hypothetical position sizing curves of 1%, 2%, 5%, 10%, and 20% risk models in log-scale, for the same segment of a trading system with 68% winners and 1.1 reward/risk factor, which shows similar figures as our Live Signal Service. We can see that the theoretical account growth can be made astronomical by increasing the position sizing. Unhappily, the future is not written in stone, and future returns can vary substantially from past performances. Thus, the trader must set his trading goals taking into consideration no only the growth but also the drawdown.

For instance, in the figure above, the steepest curve, corresponding to the 20% risk model, shows several 90% drawdown segments. Are you willing to accept to lose 90% of your hard-earned profits to push your returns to the sky? Indeed, there is a limit to the amount a trader can withstand to lose. Thus, it seems reasonable to define our desired maximum drawdown and set the percent risk accordingly.
Let’s say our risk appetite allows us to lose up to 25% Drawdown, and that our system is well below 10 losing streaks. An approximation of our ideal Percent Risk Model Size is to divide 25% by 10 and set our trade size to 2%.

To verify this figure, traders with programming abilities could create a code to produce a Monte Carlo simulation of futures trades. That is what we have done here. The curve below corresponds to the drawdown histogram of 10,000 synthetic trade histories.

Mean Drawdown: 21.02 %
Our little exercise tells us that the average max drawdown is 21.02%, but there is a 3% chance that we could experience a 30% drawdown in a year. A small sacrifice to convert $10,000 into $2.5 million in 12 months.
In a future video, we will discuss improvements on this basic model.

Categories
Forex Videos

Position Size Part 4! Equity Calculation Models ( Mastering The Markets )

Position Size IV – Equity Calculation Models

In our previous video, we learned the basics of calculating mini-lot sizes for a single position. But how to proceed if we have concurrently open positions? This video is aimed at providing different solutions to the theme.

Core Supply Model

Using this guideline, you determine the dollar risk for the next trade by taking the remaining cash left on your account. For example, your initial account cash balance is $5,000, and you have risked 2% (or $100) in your first trade. To compute the next position size, you should consider the $4,900 remaining cash; thus, if your position sizing method told you to use a 2% risk, the size of your next trade should be $4900 *2% or $98.

Using the Core Supply Model, open profits are not considered until the trade or trades are closed. The formula subtracts all the initial risk of the previous trades until the trades are closed. New positions are always computed using the cash calculated with the formula:

Cash = Total equity – Open-trade risks

Balanced Total Supply Model

This method is similar to the Core Supply Model, but it adds the profits of the positions in your favor, but only if a stop-loss level protects them. For example, let’s assume you currently have a paper gain of $260 in your first trade, as in the following figure, and you’ve placed a trailing stop that is now protecting $200 of it. In this case, the available cash for the second trade will be $4,900+$200 = $5,100.

Total Supply Model

The total available cash is calculated by adding and subtracting all the open positions’ gains and losses. This model is a bit riskier than the previous model, as all the profits are added without the requirement of protecting them with a stop-loss. This makes it very simple, although it delivers slightly larger sizes. If we use the previous table, the $250 current profit on the first trade will be entirely added to the $4,900 base supply for a total supply of $5,150 available for the next trade.

This risk model is very much used by account managers, as it helps them keep their position size (their risk) constant, because the next trade size it will always be a percentage of the total available equity.

Boosted Supply Model

This model is made of two “pockets”: The Conservative Money Pocket and the Boosted Money Pocket. This central approach uses a low-risk sizing model on the Conservative Money Pocket and an expanded risk sizing model on the Boosted Money Pocket. The Boosted Money Pocket can be filled using two methods. The first one is to allocate a percentage of the equity ( from 5% to 20%) to the Boosted Money Pocket. The second method is to wait for “market money.” Market money is money resulting from your net gains.
The Boosted Supply Model’s main idea is to be conservative with most of your trading funds and be speculative with the market’s money or a small part of your equity.
Also, the key to this methodology is that the Boosted Money Pocket be rebalanced. We can set a rule to rebalance every week, 15 days or one month, or set a profit target for this pocket that, when reached, will trigger a rebalance action to set it to a pre-defined 5%-20% level.

Using this boosted model, a trader is willing to set a max drawdown much higher to profit from the accelerated equity growth. It is well known that equity growth grows in a geometric progression while drawdowns move in an arithmetic progression. That means that we could obtain over 10X equity growth with just a 2X drawdown increase. We will develop more on this with specific models in future videos. But, as an example, if a trading system delivers a 10% drawdown using 1% position sizing, a boosted pocket could be set to 6X this risk (6%) for a 60% projected drawdown on this 10% portion of the funds of the market’s money. That would triple the profitability of the system but remaining conservative on the core funds of the trader.

Categories
Forex Videos

Forex Position Sizing Part 3 – The Advantage!

Position Size III – The Advantage

After deciding the current price movement was a good trading signal, position sizing answers the question of “how much shall I take,” which is a crucial question to ask, especially on leveraged trading. But position sizing defines not only the Risk and drawdown but also the overall profitability of a trader.


Van K. Tharp usually presents his learners a game, There are commonly near 300 traders attending to his courses, and the game consists of a bag of 30 marbles with defined gains and losses representing trades. A marble is pulled out randomly and then replaced each time. Everyone gets the same results in terms of reward/risk ratios or R. The participants only have to choose the size of R. At the end of the game, except for those who went broke, everyone ended up with different equity, although the trades are the same.
Van K. Tharp also mentions a study by G. Brinson appearing in “Financial Analysts Journal” in 1991 that studied the performance of 82 portfolio managers over a 10-year period. Their primary variable was how much was invested in bonds, stocks, and cash. The study concluded that over 90% of the variability in performance was due to “asset allocation,” which is a word used by professionals to refer to how much to invest. That means position sizing modeling results in considerable variations in the performance of a trading strategy.


The Three Components of Position Sizing Settings

1.- Psychology:

People with no knowledge of position sizing methods modify the size of their position based on their current emotions. Traders with no regard for Risk usually overtrade. Their account balance is likely insufficient; thus, they go broke at the minimum flip of the market against them.

2.- Objectives:

A person with only profitability objectives will have a different result from a trader with a combination of profit/risk objectives.

3.- Position sizing Method

Some people use a single position size, no matter how large is his current trading account. Others use a percentage of the account balance, while others vary the position size, pyramiding or downsizing, as their trading results evolve.

The combination of these three elements can create a wide variety of models.

Simplifying the model

Indeed, there are trading strategies in which trades are correlated, or dependent, which may be improved by the use of trading sizes adapted to the past results, such as the Turtles trend-following methods, which might benefit from pyramiding schemes. Still, the majority of trading systems show independency. Thus, we are in favor of separating the decision part from the sizing part.

Thus, the trading system should deliver the entry and exit signals, with a precise R-risk- figure, its results as a stream of multiples of R. This allows the trader to measure and determine the profitability and drawdown, adapting the size of future trades to fit his trading objectives.

The MCP Model

A simple shortcut to help you define the size of every trade is the LCR formula.
C: Cash, a trader, is willing to risk. That part comes from your position sizing strategy. For example, if you’re ready to risk 1% of your current $3,500 trading balance, C will be 3,500×1% = $35

R: Risk of the trade: The dollar distance between entry and stop-loss level.
L: Position size in lots

L = C/R

In Forex, the definition of Risk is in pips. So, the first thing you need to know is the dollar risk of one pip. For instance, in the EURUSD, the dollar risk of one pip is $10 for one lot. If you think in mini-lots, this goes to $1, which is a nice figure since it is mathematically “transparent.” Also, the majority of pairs have a pip value close to $1 on mini-lot sizes; the only one exceeding this value is the EUR/GBP, which is $1.28. Therefore, we can simplify the formula to calculate P in mini-lots with the formula for practical uses.

M = C/P

Where M = mini-lots, C= cash at risk, P= Pip distance from entry to stop-loss.

As an example, If our C is $35, and we have 20 pips distance between entry and stop-loss,
M = $35/20 = 1.75 mini-lots.

This methodology is valid on systems with only one open position at a time. For more than one open positions, there are three additional modes needed to compute C. That will be left for another video. Stay tuned…

Categories
Forex Videos

How to read a volatile chart! EURUSD Price Analysis…

How to read a volatile chart: EURUSD Price Analysis for 13th August 2020

Thank you for joining this forex academy educational video. In this session, we will look at one of the most frustrating things that a trader will find and about a complete turn in price action, which does not necessarily go with technical analysis.


This is a one-hour chart of the euro US dollar pair, and I’m interested in the period between the 12th and 13th of August.
We can see that at position A, on the 11th August, the price action high, is at the same level as on the 10th of August, suggesting a price action double top reversal formation, and indeed the market reacts accordingly, and price action begins to fade back to position B, which breaches the previous lows going all the way back to the beginning of August, suggesting that the bears were in control of the pair, and price action might continue lower into the high 1.16’s
However, frustratingly for those sellers, the price could not be maintained in the downward direction and then completely reverses, retesting the high at position ‘A’ and finally breaching it to the upside, and where now we might expect a retest of the 1.19 level.


So, what is going on here where our chart suggests the bears are in control, and then all of a sudden, during the Asian session on the 12th of August, things just completely reverse, and the pair is driven higher?
One of the main factors to consider during the current economic crisis throughout the world caused by the global covid pandemic is the continuous change in sentiment for one country against the next, which at the moment is causing such a volatility and where the market can turn for no apparent reason with regards to technical analysis.


This pair was simply unable to bridge the 1.1700 key level, and this became a significant turning point. Key level trading such as round numbers can often reverse an exchange rate in its tracks, and that is what happened on this occasion. However, we must also take into account market sentiments, and a critical component of this reversal was the continuing spat between the democrats and republicans of the United States Congress who have so far not been able to come to a solution with regard to the continuation of the covid relief fund, which expired the previous Friday, leaving millions of Americans wondering how they are going to cope financially without the support that they had been relying on in the last few months.
Until such time as the Americans have got their act together and implement extra financial relief, we can expect more market volatility and a weakening United States dollar. Watch out for key number reversals and spikes in price action, where technical analysis must be used in combination of market sentiment while keeping fundamentals in the background and remembering that these are not the key market drivers during the continuing crisis. Keep informed with up-to-date news, especially pertaining to the United States covid relief status. And Keep stops tight.

Categories
Forex Videos

The Next Financial Crisis Is Brewing! How Can We Profit From This Debt Bubble?

The next financial crisis is brewing already; this time, it will be caused by debt!

You will probably have heard the old adage that history repeats itself. We only need to look back to the 2008 financial crash, which decimated some banks and institutions, many of which had been pressured to lend more money to consumers, especially in America, specifically to buy homes. Many of these mortgages were taken out by people who simply could not afford them. Some had clauses offering very low initial interest rates, which ballooned after a few years, which centers around the time of the crash in 2008. These were subprime mortgages, and these bad loans were the spark that lit the fire, which became an inferno.
This lending culture was not restricted to mortgages. Banks were competing against each other to lend money to consumers for everything including renovating or extending homes, car loans, holiday loans, white goods, and other consumer household products. Banks were simply throwing money at consumers. The result was a mountain of debt, which caused a recession in the west. Some banks, including Lehman Brothers, which was founded in 1847, and the 4th largest U.S. investment bank at the time, went under. Many other banks such as the Royal Bank of Scotland and Bradford and Bingley and the Alliance and Leicester came very close to bankruptcy and had to be bailed out by the U.K. Government.

Move on to the 2020 coronavirus epidemic, and we find ourselves in a post-2008 catch-22 position. Companies that have seen growth hammered by the coronavirus, including airlines, car manufacturers, hoteliers, and the entertainment industry, including bars and theatres, have all seen their incomes throttled as a result of the continuing virus. Restrictive legislation and fears by consumers of returning to any kind of normality before a vaccine can be found means one thing: these companies and individuals are being artificially propped up in the form of Government debt. It is either that or there will be carnage in the form of bankruptcies, increased unemployment and people failing to meet their mortgage payments, which will have a potential knock-on effect to those banks providing the finance. Does this sound like a repeating cycle of 2008?


In trying to stop a total financial crash, the only solution which can be found by governments is to issue more debt, which is tantamount to stoking up the fire with more debt. The west is not yet in a situation to offset the need for this debt by economic growth, which is the only way to achieve it properly in economic terms.
Companies that are struggling to survive are borrowing more debt from banks to prop up their companies in the hope that earnings will pick up soon. This increases their debt burden and the longer the virus continues the more it increases their chance of going under.


With a mountain of corporate debt growing in the West, this curtails central banks from increasing interest rates, which is what the Fed did after the 2008 crash, as things return to normal because this could cause companies to fail to be able to meet their debt obligation payments. This is another catch-22.


But, with the virus still in in the grip of Europe and America and much of the world, we are unlikely to see strong economic growth for the foreseeable future. Certainly, the increasing spat between the United States and China is not helping the situation. With the West generally bashing at the door of China over the issue of the Hong Kong national security bill, and Donald Trump banning Chinese owned companies such as tik-tok, WeChat and Huawei, we can expect more tit-for-tat sanctions, tariffs and bans on Chinese and American companies working in respective countries.


One thing is for sure we have a long way to go, it could be many years before things are back to what we used to consider normal. As traders, we must expect the unexpected; this will mean shocks and sonic waves exploding through the financial markets, causing volatility in the stock market and huge swings in currencies, especially the United States dollar, the Great British pound, and the euro.

The Dodd-Frank Act
In the U.S., the Dodd-Frank Act, enacted in 2010, requires bank holding firms with more than $50 million in assets to abide by rigorous capital and liquidity standards, and it sets increased restrictions on incentive compensation.

Categories
Forex Videos

Banks Actually Launder More Money Than Crypto! Are You Surprised?


Banks Launder More Money Than Crypto, a New Report States

The Financial Intelligence Unit of Mexico recently published the results of its second-ever National Risk Assessment. The report stated that the risk of money laundering in the banking sector exceeds the issues encountered by fintech companies by a large margin.

According to El Economista, a well-respected Mexican newspaper, the so-called “G7 banking” group, which consists of BBVA, Santander, HSBC, Citibanamex, Banorte, Scotiabank, and Inbursa, registers a lot more money laundering in Mexico than all the Blockchain firms combined. Brokerage companies, exchange firms, as well as institutional banking providers are also included in the report, where they have been classified as “high risk” companies.

Although the fintech sector is still considered a possible propagator of both money laundering as well as the financing of terrorism, the 2020 UIF report chose not to classify the sector. While the reasons for this are unknown, many speculate that it is because crypto doesn’t pose as much of a risk as the mainstream thinks.

During a virtual conference in Aug, an official from the UNIF mentioned cryptocurrencies, saying that the sector does pose a risk for illicit activities. He also noted that the entity still considers the technology to be a possible “emerging risk” rather than it already being a risk, as many say.
It is worth noting that Mexico’s fintech, as well as blockchain industries, have nearly doubled in size in just over two years.

Categories
Forex Videos

Donald Trump Ramps up the heat with China! Forex Traders Beware!


Donald Trump Ramps up the heat with China


Thank you for joining this Forex Academy educational video. In this session, we will be looking at for little events surrounding the ratcheting up of tensions between the United States and China.


In the ratcheting up of the tensions between the United States and China, Donald Trump sites the risk of companies such as Huawei and now TiK ToK and we-chat, which are viewed as major security risks, because the American government believes that Chinese tech firms will have back door access to United States data, including access to the American population’s personal data where they use such technology.
Donald Trump has now signed an executive order banning the use of TikTok, a sort video platform owned by Bytedance Ltd., and WeChat, which is a messenger app owned by Tencent Holdings. The order will come into effect within 6-weeks of the time of writing this article. This is almost unprecedented where such apps could be banned from use to millions of us citizens. United States citizens and American companies will be banned from doing business with either of these two firms.

In a twist, TikTok, which has global downloads predicted at 2 billion + with a valuation of 100 billion US dollars, may find a reprieve in the United States if Microsoft can secure a license to run the application in the United States, Canada, Australia, and New Zealand and where such a license may cost Microsoft between 20 and 50 billion US dollars. The idea being that Microsoft would be the only company to collate user information, stating that this would be safe Microsoft and not passed onto the Chinese government.

Tiktok, which was seen until fairly recently as a harmless video for children, has been embraced by celebrities and influencers, which has helped it attain exponential growth within the United States. However, US national security concerns that its parent company will share valuable information with the Chinese government, and the same can be said for WeChat.
While the digital market remains open in most western countries, including the United States, where are companies such as Facebook and Amazon and Google operate with few restrictions, China has blocked several US internet companies, including Google, from operating in its country.

And while Tencent lost billions as the WeChat ban hit Chinese stocks and caused the Chinese Yuan to depreciate, the fallouts could hit United States tech stocks as markets try to calculate how American tech companies and other firms in the United States are affected because some of them rely on these apps for their businesses.
The Chinese foreign ministry reacted to Donald trump’s ban by saying that America is using national security as an excuse and using state power to oppress non-American businesses.


One thing is for sure, the escalation between these two Nations can only get worse before it gets better. Traders should be looking for dips in US tech stocks and tech indices, and perhaps broad-based volatility with the United States dollar and related major currency pairs as further sanctions, bans, and potential tariffs are introduced by both sides as matters worsen.

Categories
Forex Videos

Forex Options Part 15 Delta Neutral Strategies!

Forex Options XV – Delta Neutral Strategies
The Delta

To be proficient with Delta-neutral strategies, one obviously needs to understand Delta. The option Delta can be considered the ratio of change in the option premium relative to the underlying spot price movement.
Delta’s range is 0 to100 for Calls and -100 to 0 for Puts. Thus, on a combination of options, it may range from -100 to 100. Bullish strategies will show positive Deltas, whereas bearish positions will present negative Deltas. Bullish strategies include long the underlying, long calls, and short puts. Also, short the underlying, short calls and long puts are bearish strategies.
The deeper in-the-money a strategy is, the higher its Delta (regardless of the sign). Out-of- the-money options present Delta values below 50. The farther out, the less its Delta will be. As already explained, the Delta is a proxy to the probability of an option to end in the money at expiration. An option with Delta of 10 has a 10 percent probability of being in-the-money at expiration. An option very deep in-the-money acts very similarly to its underlying. Its time value shrinks while its intrinsic value increases.
On the other hand, out-of-the-money options are almost unaffected even by a significant movement in the underlying. For example, if you were holding that option with a delta of 10, it would catch only 10 percent of the underlying movement. Therefore, a 10-Delta option is cheap, but it captures a tiny portion of market action.

Delta Features

 Are estimates of the option’s price change against the underlying changes in price
 Defines the probability of it expiring with profits
 Delimits the number of options needed to equal the movement of the asset

Relationship between Volatility and Deltas

As we have already understood, Volatility is a measure of the uncertainty of the markets and the degree to which the prices of an asset are expected to move over time. Also, Delta can be considered as the sensitivity of an option to its underlying price movement. An increase in Volatility causes all option deltas to move toward 50. For in-the-money options, Deltas will decrease, and for out-of-the-money options, Deltas will increase. Since Deltas are related to the probability of expiring in-the-money, when Volatility grows, probabilities move towards 50-50.

Volatility is a crucial element for Delta-neutral strategies, and knowing how Deltas behave due to Volatility changes and price movements in the underlying is critical.

The Delta Neutral Strategy

A Delta Neutral Strategy is a combination of securities to create a position with a total Delta of zero. It can be a combination of asset plus options or only options whose total delta summation is close to zero. The key idea is to profit from the Volatility changes while covering the position from the movement of the underlying.

Professional traders think in terms of option spreads, and they hedge their trades to stay neutral on the market direction. To them, the direction of the asset is less critical than the Implied Volatility. Implied Volatility will define when to buy or when to sell options, as it will determine if the option’s price is cheap or expensive.

The second key element is to manage the trade when needed. If the position becomes too bullish or too bearish, the trader should act without hesitation and adjust it back to neutral. The beauty of this concept is that it naturally makes you do the right thing: buy cheap and sell expensive.

Think about it. You start your options trade delta neutral. If your position goes to the bullish side after some time, it means your options betting to the bullish side gained value, whereas your bearish side lost it. What should you do under these circumstances? To move back to neutral, you should sell. Thus, you’re selling high. Imagine then that the price turns and go bearish. Then you must buy some assets to balance the position back to neutral, and you’ll do that when the price is relatively low. We can see that buying and selling come naturally from the need to balance the position, not by market timing considerations, but this happens to be the right strategy.

As with other strategies, the upside and downside break-evens must be computed to identify the profit range. The maximum profit and loss potential should be understood by a trader to see if the trade is viable, modified, or discarded. You’re not timing the market, but on mean- reverting markets such as in Forex, this strategy is quite profitable.

Usual Delta Neutral Strategies

Strategies with zero Delta include buying or selling straddles and strangles, as well as Butterflies. It can also be created by a combination of underlying and options, such as buying one lot of a forex pair and sell two at-the-money calls of the same asset.
One of the most used delta-neutral position is a Ratio Spread. A Ratio Spread involves the uneven number of options are purchased and sold. Spreads can also be combined with the underlying asset. The particular spread to use should be based on the market conditions, as we already have understood in previous videos.
Ratio spreads are attractive strategies that present a broad profit region; nevertheless, they also show an unlimited risk; therefore, the position should be observed and managed.
Our videos are an introduction to Forex options; consequently, an in-depth explanation of a particular delta-neutral strategy is left for the reader.

Categories
Forex Videos

Forex Options Part 13! Selling a Vertical Spread…


Forex Options XIII – Selling a Vertical Spread


A vertical spread is a combination of options in which the trader buys a Call or Put and sells another Call or Put of the same underlying at a different strike.
Buying a Vertical Spread
We are long ( buying the vertical spread) when we buy the at-the-money or in-the-money option and sell an out-of-the-money option. A vertical spread is a strategy similar to a naked option. The selling of the out of the money call simply lowers its cost, as the trader is aware that the price is unlikely to move above the sold option’s strike level.
Traders buy vertical spreads when they are sure about the market direction, have a target for the move, and seek to optimize the cost of the trade.

Selling a Vertical Spread

We sell a vertical spread when we sell the at-the-money or in-the-money option and buy an out-of-the-money option. This is not a market-timing strategy, but a statistically-based move. The purpose of this is to profit from the decay and volatility drop, avoiding the unlimited risk of a naked option.

It is well known that the sellers make the majority of the money on options trading. That is because options will lose all its premium at expiration. Over 60% of all options that are out of the money expire worthless. This fact gives option sellers an advantage. The downside is that naked options involve the assumption of unlimited risk. The selling of an out-of-the-money option and the simultaneous purchase of a further out-of-the-money option solves this issue. This strategy allows traders to profit from high volatility and market-timing situations such as market tops and bottoms.

Key factors to maximize the trade potential of a vertical spread

  • The implied volatility is in the upper range, historically, the higher, the better to maximize the amount of premium received.
  • Identify support and resistance levels on the underlying’s price action, and sell the option whose strike price is at or beyond that level ( so that the chance to cross it is minimized).
    Sell the call with a delta of 40 or a put with a delta of -40. That way, the chance of the option to expire in the money is below 50%, while the premium is still acceptable.
  • Choose options with less than one month to expiration to make the time decay more pronounced
  • Look for the situation where the volatility of the sold option is higher than the one you intend to buy.

Market timing

Option writing can be used in place of option buying to take advantage of a market-timing strategy when volatility is very high. Inexperienced traders usually make the mistake of buying naked options to profit from the market movements without caring for volatility, losing money, long-term, because the more expensive the cost is, the larger the movement of the underlying to compensate for the costs of the trade. Furthermore, a posterior drop in volatility will further reduce the options’ value, hurting the naked position.
The best alternative to option buying when you believe the underlying is going to move in a determined direction and volatility is high, is selling a vertical spread. When you have reasons to believe that the market is going to rally or remain flat, you may sell a vertical put spread, usually called “Bull Put Spread.” Conversely, if you consider the market is going to fall, flat, or with limited movement, you may decide to sell a vertical call spread, called “Bear Call Spread.”

Position management

To optimize the profits, you should look at your strategy’s risk-profile curve at expiration to determine your maximum potential profit.
Also, check the risk curves before expiration to determine how far against your position should move the market to create a loss equal to your maximum profit, and determine the level at which to cut losses. The main idea is we don’t want reward-to-risk trades below 1.

Stop-loss
  • Close the trade if the loss surpasses the max-profit value.
  • If you consider that some significant support or
  • resistance was broken and the scenario you considered for the trade is no longer valid.

Taking profits

Close the trade if your profit reaches 80% of the maximum profit potential.
The idea behind this is that holding the trade trying to get the last 20% of the profits is wrong from the risk-reward point of view, as the R/R is
RR =0.25.

Categories
Forex Videos

Forex Options Part 12… Buying a Straddle!


Forex Options XII – Buying a Straddle

Straddle buying involves buying a Call and a Put at the same time and strike. There is a variant called Strangle, where the strike prices differ. This strategy is exclusive of options, and, theoretically, allows the trader to profit from a large movement at a key level when the likely direction is unknown, for instance, on a Central Bank news release, where the moment of the statement is known, but there is no way to known the posterior movement of the forex pair.
Since the cost of the straddle is expensive ( two premiums), it shows the lowest probability of all options strategies of making profits (and even more so on strangles). Thus, the best moments to buy it is when volatility is at its lowest point, and a sudden jump can be forecasted in advance of the rest of the participants.

Thus, the key elements to be decided to use Straddles are:
There is some key market factor that makes you believe a large move is ready to occur.
The market is quiet, and the implied volatility is at the lowest extreme.
There is enough time to expiration for the market move.
The reward is equally good, no matter which direction will move the underlying. That means making the trade delta-neutral by being as close to the current spot price as possible.

The dangers

As Jay Kaeppel reminds in his book,
“The goal in option trading is to put the odds as far in your favor as possible each time you enter a trade. Paying a lot of time premium on both a call option and a put option is not consistent with this goal and should generally be avoided.”

Time to expiration

Traders usually make the mistake of buying short-term straddles because they are cheaper, but that is wrong. The asset must make a large enough movement to pay for the two premiums. Thus, it is essential to let it the time to do it. Traders must analyze equal moves historically and determine the proper time to expiration. Of course, if the expected move has to do with a determined news release, that date, plus the expected time for the posterior movement, will set the correct timeframe.
You also have to take into account that it is advisable to close the trade earlier than the last two weeks before expiration unless one of them is deep in the money. In this case, it is best to hold if there are reasons to think the move is not over.

Volatility high

When buying a straddle when implied volatility is relatively high, and, following the purchase, volatility collapses, you’ll be hurt twice because the time premium part of the price will collapse as well. Under this circumstance, the probability of making a profit is close to null.

The Opportunity

If you focus your straddle purchases on very low implied volatility, you’ll profit not only on the price movement of the underlying asset but also on the rise of volatility that will increase both the call and the put.

Exiting the trade

Stop-loss

The best way to cut losses is to plan the trade so that the premium is low due to the low implied volatility. But, besides this,
You can plan to close the trade if it has not made profits before the last two weeks before expiration, since after that, the time premium decay accelerates its decline.
Cut your losses to a determined amount or percentage, for example, 50% of the total price paid. Let it go until expiration if you’ve decided that the premium is your risk. The downside is your position size will be smaller than if you choose to cut your loss at 50% of the cost.

Taking profits

There are several methods for taking profits.

  • Locking-in profits after the position doubles its value, by selling 50% of the position ( it requires to being long several straddles, of course), and trailing-stop the rest of the open position.
  • Setting a profit target, based on the technical analysis of support/resistance of the underlying.
  • Just use trail stop all the way.
    There is no guarantee that these approaches to stop-loss and take-profit will improve results. Still, it is important to have planned all the trade details to avoid emotionally driven errors.
Categories
Forex Videos

Forex Options Part 11… Buying a Calendar Spread!


Forex Options XI – Buying a Calendar Spread

The Calendar Spread is a strategy only available on options. As we already know, Options on assets come with different expiration dates, and each one offers different implied volatility levels. What’s more, at times, they show strikingly different values. Traders can use this situation to take advantage of the disparity by selling the option that trades at a significantly high price and buying the cheaper one.

The main factors for using calendar spreads are:
The written option should trade at least at 15% higher implied volatility than the option bought.
If the overall volatility is high, it is wrong to use it. It works best when the bought option shows low implied volatility.
The sold option expiry is within the next 45 days.
There are reasons to think that the underlying market will remain in a range.

A calendar spread is a neutral position that is entered by buying one option of a determined strike price and expiration month, and selling at the same time another option of the same type and strike price, but with less time until expiration than the option bought. The right time to enter a calendar spread is when the short-term implied volatility is over 15% higher than the long-term one. The higher the implied volatility of the option sold relative to the option bought, the higher the likelihood of profit.

The dangers

A significant advance or decline in the underlying makes the trade very unprofitable.
A sharp decline in implied volatility degrades the odds of a profit.
Therefore, the less time to expiration for the option sold, the better, provided it allows enough premium to have profits.

Factors to profitability

According to Jay Kaeppel, to maximize profits, we must consider the following:
Only trade a calendar spread when the volatility gap between sold and bought option is higher than 15%
Rank the volatility from 0 to 10 land trade calendar spreads only when below 6, ideally in the 1-2 range. If volatility increases on a trade entered at these volatility levels, it would return extraordinary profits, because the bought long-term option will increase much more than the short-term option that was sold.
Don’t sell options with more than 45 days to expiration.
The options traded must show deltas within 30 to 65 on calls and -30 to -65 on puts. As a rule of thumb, avoid trading options with more than one strike price from the current asset price.
Ideal markets for a calendar spread are assets moving in a trading range, where supports and resistances are clearly identified.

A decline in volatility

A decrease in volatility is the worst that can happen on a calendar spread trade. To understand why we have to remember that we sell the short-term option and buy the longer-term option. The longer the time to expiration, the higher the sensitivity of the option to volatility changes. That means a rise in volatility would result in increased profits because the option bought will increase more than the option sold. Conversely, a volatility drop would drive the trade to the losing side as the price of option bought sinks relative to the option sold.

References: “The option’s trader guide to probability, volatility and timing” by Jay Kaeppel

Categories
Forex Videos

The Dollar Index & The COVID 19 Effect!

U

The Dollar Index and the COVID-19 Effect

Thank you for viewing this Forex academy educational video. In this session, we will be looking at the U.S. dollar index and how it has been affected by the global pandemic.

The Dollar Index is also known by the following acronyms, the DXY, or DX, and USDX. The United States dollar is the single largest currency traded in the forex market. The U.S. dollar index is a weighted measurement of the value of the United States dollar against six other currencies, including the euro, the Japanese yen, Australian dollar, the British pound, the Canadian dollar, the Swedish krona, and the Swiss franc. The values of the dollar index or updated every few seconds during normal market trading activity.
If you like to trade any of these pairs, it is advisable that you keep an eye on the U.S. dollar index at all times.


This is a historical 6-month view of the dollar index, and although the pandemic was already starting to escalate in February, the disease was mostly effecting Europe and Asia, and after a move lower, the index climbed to a high of 103.00 just one month later due to its safe-haven status. However, this healthy level for the United States dollar has fallen off since that high to a low of 92.54 at the beginning of August.
This dollar fall has largely been due to the fact that Europe is seen to be recovering from the coronavirus and where governments such as the European Union and the British have been seen to be implementing monetary policies that will be good for the recovery for their respective economies. Also, Australia has handled the pandemic very well and where the infection rates have been quite low in that country.
On the flip side, we have the United States, which is systemically failing in coming to grips with the Corona outbreak, which has been escalated in many of the U.S. states.

While the federal reserve has been wildly applauded for their implementation of quantitative easing and handling of interest rates in reaction to the escalating economic fallout, President Donald Trump has been criticized for not taking the disease seriously enough, and many would say he has had his head in the buried in the sand hoping that it will go away and that much of his rhetoric surrounding that disease is tilted towards the upcoming presidential elections. This had caused the markets to wonder if America will actually get a grip on this horrendous disease, and this had caused market sentiment to shift away from the United States dollar in favor of the other major currencies, which have all pulled back from their lows when Europe was very badly hit back in March.

However, on Friday the 7th of August, the non-farm payroll reports took a little bit of heat of the DXY when it posted jobs growth of 1.76M in the United States for July, which went on to erase some of the concerns about the state of the United States labor market and this gave the dollar index a lift. In fact, it was up 0.6% at 93.40, a 3-day high. But this was still only bouncing off the loads of 7 weeks and straight declines.
While the boot has been firmly put into the U.S. Dollar in the last few months, it is important to remember that one month’s good U.S. jobs figures may not be enough to raise the U.S. dollar index back to its highs in March. The next biggest test will be whether or not the U.S. government can agree on a new pandemic relief package. So far, the democrats and republicans have been at each other’s throats and not being able to come to a successful conclusion on this matter with regard to how much relief is necessary. Watch this space. The outcome will affect the Dollar index.

Categories
Forex Videos

Forex Options Part 10 Buying a Backspread!

Forex Options X – Buying a Backspread

A Backspread is a combination of option positions. A Call Backspread involves selling an at-the-money or in-the-money call and buying a higher number of out of the money calls. The ratio of options sold to options bought usually are 1:2, 2:3, 5:3, or any combination. The main idea is to buy more options than sold. The ideal situation happens when it is entered at a credit, meaning you earn more from the sold option than you pay for the purchase of options, which is ideal, as it offers total protection in the case you’re wrong with the direction of the trade.
Call Backspreads is a better alternative to buying naked calls because it offers better protection when wrong about the direction of the market.
A Put Backspread is identical to a call, but, as we may guess, it is the right choice if we think the market will move downwards.

Main Factors

We are expecting a market movement, but we would like to be covered if we are wrong.
Implied volatility is low, and we hope it will rise after our entry.
A total transaction entered at a credit is ideal.

A Falling Knife

The use of Backspreads is ideal for catching market bottoms and tops, as it limits, or, even, avoids the risk of being wrong. One situation is to capture a falling-knife market. In this scenario, the market experienced a sharp and significant drop, but we think it has to reverse. Buying naked calls in this scenario can be too risky, as the timing of an upward move is far from accurate, and we may end up with a losing position if the market keeps falling. The use of a Backspread is excellent because we can still profit if wrong in the case of a credit Backspread.

Overextensions

Another ideal situation occurs if the market makes an overextended rally, but you suspect it is a bull trap. That often happens when trading Bitcoin, for instance, with the Bart Simpson pattern. The Bart Simpson pattern shows a sharp upward movement followed by a similar downward action after several hours of sideways action.
Under this scenario, a Put Backspread position is ideal because, if wrong, we could still be protected but still having unlimited profit potential.

Uncertain timing

A third situation arises when we expect a substantial upward rally but are not sure about the timing. A properly constructed call Backspread can give unlimited profit for a minimal dollar risk.

Time to expiration

In all situations, it is better to use longer to expire options when constructing the Backspread, as this offers a broader timeframe for the play to develop. What’s more, Longer-dated options are more sensitive to changes in volatility, so that if we enter a Backspread on reduced volatility, the profits multiply when volatility increases due to the market move.

The risk

The main downside of this strategy happens when the underlying asset remains near the strike price of the sold call/put at expiration, or the implied volatility declines further, which usually occurs when the asset does not move much. This is why it is best not to hold Backspreads until expiration, as they can generate its largest loss with the lack of movement of the underlying security.

To summarize

A Backspread strategy can give the trader

  • The stamina to trade tops or bottoms on strongly trending assets
  • Time to allow the timing to work out with a limited risk
  • Profiting from an increase in volatility
Categories
Forex Videos

Forex Options Part 9 – Buying Naked Options!

Forex Options IX – Buying Naked Options

Buying naked options means the purchase of just calls or puts of the same strike and expiration date, with no ownership of the underlying asset, nor other simultaneous purchases of a different call ( or put).
Buying a naked option is a market-timing strategy. The options trader considers that, at the current price, the asset is overvalued or undervalued, and, also, there are signs of a market reversal.

The main factors to consider are:

There are technical reasons to believe in a large movement soon! Actual low implied volatility! Good Delta and time remaining to expiration so time decay will be minimal.

The main errors novice options traders do when buying naked options are:

Only consider market timing to make a trade.
Buying out of the money options because they are cheap. Buying options with no regard to the current implied volatility. And if they are expensive, switching to an even more out of the money strike. Buying options with short expiries because they are cheaper.

The threats

Poor timing is the main threat. Buying a call followed by a drop in price will swiftly devalue the option. Therefore, to buy options, it is imperative to have a fairly precise timing signal.
Also, time decay will hurt the value of the option if the underlying security fails to make the expected movement, which will cause a drop in volatility and a decrease in the premium. This effect increases if the time to expiration is short.

The following rules will maximize the odds in our favor:

Buy naked options only if your timing method has proven accurate
Buy calls with Delta over 50 or puts with Delta below -50 to improve the chances.
Buy calls near support, buy puts near resistance, especially on non-trend or mean-reverting markets. Lower volatility is a plus, although not too critical if the action is short-term
At least 30 days to expiration to minimize time decay.

The key elements to make a profit are two:
  • A reliable indicator or pattern that consistently predicts a large movement
  • Avoiding being hurt by time decay and drops in volatility.

A possible use of this strategy is to catch tops and bottoms. Options will limit the risk at the premium paid by the option. With enough time to expiration, the timing required to succeed does not need to be as accurate as with the underlying instrument. The risk is limited without the need for stop-loss orders, which on many occasions, get taken, and then the market reverses.


The risk/reward profile of a Call

The risk-reward profile of a naked call has already been shown, and it shows the characteristic stick profile with limited risk and unlimited reward. The intrinsic value line shows the values at expiration, but, since the before expiry, the option has a time value. The real market value at a set date before expiration draws a curve similar to the red line shown in the image. The shorter the time to expiry, the closer this line will be to its intrinsic value, since time value decay, as we already know.

Similarly, the risk/reward profile of a Put shows a stick-like pattern; only this time, the rewards come from prices under the strike price. As it happens in Calls, the red line in the image shows a likely value line of a Put before expiry, that would get closer and closer to the intrinsic line as the time approaches the expiry date.

Categories
Forex Videos

Forex Options Part 8 – Market Overview of Option Strategies!

Forex Options VIII – Market Overview of Option Strategies

In the previous videos, we have discovered the basics of options and the main topics that need to be mastered to trade them, such as Deltas, Volatility, Time to expiration, risk profiles, and market timing.
In this video, we will sketch the main strategies using options, with one goal in mind: to simplify the decision process.

Elements to success
There are two elements to consider when trading options: Volatility and price direction. A trader should consider if he wants to seek a directional strategy or a neutral one. After deciding that whether bullish, bearish, or neutral, the trader must look at the current and future implied volatility to decide which is best: to buy or write options.

The strategy matrix

These strategies will be covered in the following video presentations, and our critical variables of volatility and market direction will play the primary role in the decision-making process. The process will always be the same: you should decide first if you’re bullish, neutral, or bearish, and then assess the volatility.
To help in the decision making, it could be handy to have:

A chart with the price action of the underlying instrument, to help us visualize the situation of the market action

An implied volatility graph of the option in question, to assess whether it is at a low or high point


Source: cmegroup

The options chain with prices of the asset, to help us see the proximity to the spot price and also the expirations.

Source: traderji.com
A risk profile graph. That kind of graph is available in the majority of the option-trading tools. A risk profile helps not only assess the potential profits but also visualize the worst-case scenario.

Source: gfmi.com

Position Management:
To option traders, the most challenging decision is to exit. Thus, besides knowing when to use the strategy and the right moment to enter a trade, it is essential to understand when to exit for a profit and cut losses.

The strategies we will cover in the coming videos are

Buying a naked option
Buying a backspread
Buying calendar spreads
Buying Straddles

Selling a Naked put
Selling a vertical spread
Butterfly spread

Dental neutral strategies
Adjustments to increase profits

Categories
Forex Videos

Forex Options Part 7 – Market Timing!

Forex Options VII – Market Timing

As we have seen in our previous videos, many elements play essential roles in the success ( or failure) of options trading. Another important factor in deciding which options strategy to choose is the market action. Thus, market timing plays a crucial role in the success of the options trader. Timing the market when directly investing in an asset, especially in intraday trading, is essential. That is true also for option strategies that rely on the movement of the underlying security.

When trading options, the usual market situations to analyze are

  1. The underlying asset is expected to move in a particular direction within an assumed period.
  2. The asset is likely to go in a determined direction but without a specified period.
  3. The security is expected to experience a large movement but without a known path.
  4. The security is likely to move in a range.

Under the preceding scenarios, an options trader can be profitable if:

  1. He is right about the scenario
  2. He uses the precise strategy for the market and current volatility.

Usually, the first factor (being right) makes you money, whereas the second one determines the amount won, and the maximum loss when wrong.

The underlying asset is expected to move in a particular direction within an assumed period

Market timing is essential when planning to buy puts or calls because if we buy a call and the market drops, we will lose money. When developing a short-term strategy, the best test for the entry rules is to measure the profit after a certain number of days. such as in

Profit = Price [x] – Price[0],

being x the number of days after entry and testing it for different values of x. The advantage of using a time window is that it allows the trader to focus on a strategy with determined expectations.
If the trader’s time frame is one month or more, he should care about volatility. If it is exceptionally high, he will pay more time premium, which will decline over time, but if he intends to sell it in five days, he will not need to be concerned about it, as decay will be minimal. The disadvantage of trading in a reduced time frame is that the asset must move within the period, or the strategy will lose money.


The asset is likely to go in a determined direction but without a specified period

Often, traders expect an asset to rise or fall but don’t have clues about when that will happen. Options can be used under this scenario, although, in this case, volatility should be monitored and considered. When there is no specified time frame, the trader must usually keep the option near to its expiration; thus, time decay or volatility decline will eat part or all the expected profits.

The security is expected to experience a large movement but without a known path

Profiting from this scenario is unique to options trading, as options allow the possibility to profit indistinctly from rises or falls in the price of the underlying asset. The most usual strategy is buying straddles, the combination of a call and a put. Since this strategy is relatively expensive, it is best for low volatility periods ( the market is in a range) where you expect a sudden movement. If right, the combination of implied volatility increment, and price movement will pay the initial cost. Indicators that may help with this strategy are ADX, RSI, historical volatility, ATR, and Percent R.


The security is likely to move in a range

This is another scenario only profitable using options. In the case of the asset moving in ranges, which happens two-thirds of the time, the options trader may profit in several ways. Indicators such as Percent R or support/resistance assessment can determine overbought and oversold levels and use these timing techniques to options. For example, sell out of the money calls in overbought markets to profit from the premium at expiration. Other option strategies that profit from ranges are buying calendar spreads, vertical spread selling, selling puts at support levels, and advanced combinations, such as Butterfly spreads.


Recommended reading:
THE OPTION TRADER’S GUIDE TO PROBABILITY, VOLATILITY, AND TIMING , by Jay Kaeppel