Categories
Forex Courses on Demand

Candlestick Formations – The Complete Guide

Hello and Welcome to this latest installment of on-demand courses by Forex.Academy. In this particular course, we’ll be unveiling the mysteries behind Candlestick Formations, outlining how they can be used to supplement the training decisions of technical traders. Just before we begin, please do take a quick moment to read through the disclaimer and note the financial risks which are involved in trading the financial markets. Please do feel free to pause this recording so that you are familiar with our disclaimer, and we shall proceed to go through exactly what is involved in this particular course. Hopefully, you’ve had an opportunity to go through this.

Right, let’s look now at the course outline. What we do is we pride ourselves on blending theory with practice. What we look at is the display of price information in itself. We’ll introduce you to what’s called Japanese candlesticks. We’ll look at the history of those candlesticks and the origins. We don’t need to break down into quite considerable detail in terms of the anatomy of a Japanese candlestick, we’ll look at how different time frames can impact the information that we as traders use. We’ll look at the different types of Candlestick Formations. And there are many, many different types. They vary from bullish candlesticks to bearish and also neutral candlestick formations as well. Then we’ll look at the link to charting patterns. Obviously, technical trading is identifying patterns of price movement and the purpose of this particular course is to identify the use of Japanese candlesticks within their overall charting picture. It’s important we do link the two. Then we’ll look at some tools that can be used to assist with decision making on a MetaTrader 4 platform. And we’ll finish the theoretical side of this course by looking at the impact that an understanding of Japanese candlesticks can have on your ability to manage risk and therefore protect your capital. We’ll finish as we always do with a session on the practical application of candlestick formations. We do hope you will enjoy that at the end of this course.

Okay. Let’s begin with the display of price information. Price can be displayed in a variety of different ways. Now, some of those ways include originally more of a ticker-tape type of display of price information. For example, there we’ve got the gold. This happens to be the price information of the gold market, and you can see the price is quoted there on the left-hand side, $1333.72, in this case, because it’s backed by the US dollar. And what we can see for the duration of this is that we’re currently on a daily basis, we’re seeing an increase in the price of $15.32. This is an increase of 1.16% in this particular market. That’s just useful information that we, as traders, can look at that information and we can identify right well currently prices moving to the upside, and we can therefore potentially be able to make decisions off the back of that information. Now in addition to the ticker tape, there’s also things like bar charts which gives you very, very simplistic information. Just an example currently up on the screen now, which will, broadly speaking, give you a very basic understanding of entry prices, exit prices, highs, and lows, or should I say open and closed prices along with high and low prices, as well. It’s just a basic form of what we’ll go on to look at in more detail very shortly, which is candlestick formations. In addition to bar charts, we’ve also got line charts. A lot of these different displays of price action can actually effectively give you similar information. But it’s displayed in very, very different ways. And of course, Renko charts as well. There’s pros and cons associated with each of these forms of price information.

I guess the question you need to ask yourself it is which should you choose? In reality, it doesn’t really matter. It is often a personal decision in terms of how you like the information presented to yourself. Now, they all do have pluses and negatives. I won’t necessarily go into the positives and negatives of each particular type. But what is of vital importance is that you can clearly identify the price movements of a chart in line with your own trading strategy. That’s really the important part to take away from this. However, by far, the most commonly used display of price used by traders globally is, without doubt, the Japanese candlestick price chart. That’s the essence of this particular course.

To give you an introduction to Japanese candlestick formations, I’d like to draw your attention to this chart which we’re just going to put up on the screen. Within the nature of this chart, and I just want to just draw your attention to the fact that this is a dollar related daily timeframe as you can see up the top left-hand corner there, and along the x-axis you will find the relevant date associated with the price information currently up on the screen. And, along the y-axis you will find the price movement. What we’re looking at is the price movement over a particular period of time. Now that gives us some fantastic opportunities for technical traders. We can see that the price is, at this particular time frame, is effectively towards the top left of this particular chart. And, we can see what the price is currently at this particular time frame and we can see therefore what is happening to price between those two timeframes. And that this is why technical charting is really useful. Because we can use a number of techniques necessary to get a feeling and understanding for what’s happening to this market.

To just give you a very quick overview, what is clear to see is this market is moving to the downside. We’re in what’s called a bear market. However, this is where our understanding of Japanese candlestick formations can come into its own. Because at every stage within this particular price movement to the downside, the information that’s displayed through price, and as a result, Japanese candlestick formations, can give traders real significant edge in terms of making their trading ideas and executing their trading plan. And that’s really some of the profound benefits that an understanding of Japanese candlestick formations can have. I just want to draw your attention to a specific part of this particular chart. I’ll just bring that up on the screen. Just looking at this particular price action we can see what price action has occurred prior to this point. It’s just largely, I hope you would agree, it’s definitely on the bearish side. Meaning prices are moving to the downside. That’s effectively what we’re seeing. Now, even within this small sample of this price action, we can make certain assessments of what’s going on with this price. We clearly see that as the market moves lower, it then moves into a period of sideways moving consolidation. And we can actually physically see that play out because of our understanding of Japanese candlesticks, where this market really struggles to break above or to break below these levels. And that’s because we’ve got a comprehensive understanding of Japanese candlesticks. But then something really important and significant occurs. I just want to draw your attention to this particular candlestick here where we get a continuation to the downside. And we can see that with volume and momentum pushing prices lower. And it’s price action like that that can give us as traders a real advantage and a real edge in understanding firstly a broader understanding of price movements on a technical price chart. But it’s the use of Japanese candlestick formations that can really give you a significant edge in terms of making decisions when you’re trading these markets. So that’s just a very brief introduction to Japanese candlestick formations, just the basic principle about how they exist within technical charting.

Let’s now just take a couple of steps back and we’ll have a look at the history of Japanese candlesticks. Let’s start at the very beginning. In the early 15th century, the last feudal Japanese military government, which were referred to as the Shogun Tokugawa, unified Japan by pacifying and peacifiying the 60 different ruling Daimyo Feudal Lords. Now, this uniform unification was quite important. What it did was enabled more freedom to be able to trade between the provinces of Japan. To just sort of give you a bit of an image, you know, these this would be a typical image of a Shogun now. That led to some significant developments. What we then saw in the early 16th century was records actually showed that charts were used for the very first time in Japan. And the use of those charts was to record the price movements of the Japanese rice exchanges. Rice was not only the primary dietary staple of the Japanese people, but it was also essential to the Japanese economy because it was used as a unit of exchange also.

It all effectively started with rice. At that particular time, there was as many as 1,300 rice traders working in the Dojima Rice Exchange in Osaka, Japan. And as trade started to develop and volume started to increase, receipts from rice warehouses were accepted as a form of payment, at which particular point the first futures contracts were effectively traded. And that’s quite significant because from this particular era came a very brilliant rice merchant and his name was called Sokyu Honma, or Munehisa Homma for many in India in the West. Munehisa Homma was widely acknowledged as being, and is broadly known as being, the godfather of candlestick charting. Homma himself became such a successful trader that he developed a series of rules which were called the Sakata Constitution.

Now to just touch upon that. When trading the Sakata Constitution, which many, many traders followed, and its Five Methods, traders could now analyse price movements and be able to identify patterns which exist in the financial markets, or in the market of the rice exchange. This would then help them to identify very, very simple trends in the market and therefore increase the chances for increased profits. This is the beauty about technical charting and our understanding of Japanese candlesticks. That is effectively what it allows us to do. Just to conclude this particular session action, you know, the birth of Japanese candlesticks effectively gave traders the ability to extract some very, very useful information which they could then use to make more informed decisions when trading. And it all started with the beautiful rice, as you can see up on screen. That’s just hopefully giving you a comprehensive understanding of the origins of Japanese candlesticks.

Taking that on just a step, I think it’s useful that we do cover the anatomy of a Japanese candlestick. What I’m going to do is just start with what’s called bullish Japanese candlestick. And this simply means that when we see this on a price chart it means that what we’re experiencing is price moving higher, or, price moving to the upside. To isolate one of these Japanese candlesticks, just to show you what it looks like, it would look something similar to what you’re seeing up on-screen on the left-hand side. Now, it has some very, very important characteristics which I do want to elaborate on. The first one, if we just refer to this particular price point down here, and we’re just talking about the bottom edge of this quite large rectangle, the price that’s quoted when we look at Japanese candlesticks, if it’s green in color is actually the open price. And that is really, really significant. All of these candlesticks open and closes at various different times depending on the timeframe that you’re looking at. It’s important to note that each and every candlestick that’s green in color means that prices are moving higher. And it will effectively mean that the open price is at the bottom edge of the rectangle. Let’s just say for argument’s sake, the price at this level is $185. Now let’s also look at another very, very important part of the anatomy of a Japanese candlestick, and this is referred to as the closed price. What we’re talking about is the top edge of a particular Japanese candlestick, and the fact that it’s green in color means it’s bullish. And it’s very important to note that each and every candlestick has what’s called an open price, but also closing price. Whatever time frame you’re looking at, whatever time that particular market closes, it’ll print a particular price. That closing price is quite significant. Let’s just say for argument’s sake we’ve had an increase in price over the course of the day from $185 to $195. We’ve seen a nice explosive move to the upside. 

1540

However, there’s two more aspects to a Japanese candlestick, each and every candlestick, that you need to be aware of. And that simply means the first one is that each candlestick will have a high price. Let’s say for example, over the course of this candlestick the price peaked at $200 before pulling back a little bit and then closing at the $195 level. So, it records the high price. And then the final piece of this jigsaw is that each and every candlestick, especially a bullish Japanese candlestick, will have a low price. This is the lowest price that this market will have achieved over the course of this time period. Let’s say the market opened at $185. We had a bit of a pullback initially where prices pulled back to $180 before a nice explosive move to the upside, making a high, and then pulling back to close. That’s effectively, the information that this can give traders is quite profound. It’s very, very useful if we see a candlestick that looks something similar to this, then we would expect a continuation to the upside. That’s the information that it can give us. And the size of this green body is quite significant, and it will determine how much momentum exists in a market at any particular time period, and point in time. So, the size of this does have an important role to play. Now, this is a bullish Japanese candlestick. In addition, we also have bearish Japanese candlesticks. And this effectively means that prices are moving lower. What we will see now very shortly is the same for price points, however in reverse. We’re going to start as we always do with an open price. This particular market, having broken to the upside, and closing at $195, now looks like it’s beginning to reverse. Because the open price is, once you get a close price on one particular candle, the next candlestick will open with that same price. However, what we’re seeing with this next candlestick is actually the opposite. We’re seeing the prices close much, much lower to the downside. In this case, we’re actually getting a complete reversal of price action. Where prices are opening at 195 and over the course of this candlestick it actually closes much, much lower at a $185. Now in the meantime, it does also print a high price in this market. Let’s say that’s the $200 level once more, before making a nice extended move lower, creating a low price in this market, $180, before we get that same pullback before this market actually closes. What we can clearly see with this price action is we’re seeing a really nice explosive move to the upside in a bullish candlestick pattern and a really nice explosive move to the downside on a bearish candlestick. These are the important things to note and just identify as well. On a bullish Japanese candlestick, you’ll see the open prices at the bottom edge. Whereas on a bearish candlestick you will see the open prices at the top edge of the rectangle. It’s just the opposite applies. And the same for the closing prices. The closing prices can be located on a bullish candlestick at the top edge. And the closing prices can be identified at the bottom edge of the rectangle if this is a bearish Japanese candlestick. Hopefully, that makes sense.

1950

What we will do now is we’ll have a look at the importance of the real body. As we’ve alluded to, the difference between the open price and the closing price of the corresponding markets, you know, is represented as the real body of any particular Japanese candlestick. Whether it’s a bullish candlestick where the open is at the bottom and the close is at the top, the difference between the open and the close and this bullish candlestick, is the real body. And the same for a price action to the downside. The open price is much higher, the lower price is lower, and the difference between those two is the real body in this situation. Okay, moving on then. The closing is often the most important piece of information. The close of a particular candlestick is very, very important for us. It concludes the trading session. Whatever that time period happens to be – whether the timeframe of the candlestick is an hour, whether it’s a 4-hour, whether it’s a daily, weekly, or monthly timeframe – the close gives traders some very, very useful information as it gives an insight into market sentiment.

It’s also worth noting that most technical indicators use the closing prices as the basis for their calculations. That’s very, very important to bear in mind as well, and you’ll see that when it comes to using technical indicators. They’re often based on the closing price. It is of significant importance not just to technical traders who read charts, but also to technical indicators as well. Now the size and the color of the real body can provide useful clues regarding potential price moves. If we’re seeing a series of green candlesticks it means we can expect continuation to the upside. If we get a green candlestick followed by a red candlestick it can mean that potentially we might experience a correction in this market. Or, perhaps even, a reversal depending on the information that we get. That is just touching upon the real body of a particular Japanese candlestick, or, in Japanese is referred to as Jittai. That is effectively the real body of any given candlestick.

In addition to the real body we also, as you can see, we can have a shadow. The reason why they’re called Japanese candlesticks is they can often look like candlesticks. However, we often can get a wick to the upside or to the downside, or, as it’s referred to, as an upper shadow. Which is, in Japanese, is Uwakage. And to the downside we would be looking for the lower shadow or wick, and excuse me if my pronunciation is a little bit off, but, Shitakage. It’s a word that I’ve always struggled with. However, there’s no need for you to actually know that at all. It’s just we emphasize the origins of these candlesticks which is Japanese in nature. What we need to do and identify as traders is, the information that we can glean from upper and lower shadows could be quite significant. They are important. The upper shadow represents the area above the real body, and the lower shadow represents the area below the real body. That’s really what you need to take away. It’s the length of the upper and/or the lower shadow which can give traders valuable information regarding potential price moves. For example, we can certainly see a small wick like this on a lovely green candlestick would signify continuation to the upside. Whereas if this closed, so we open at this price here, if the market pulled right back and we saw a close at this market, more around this level down here just for example. If this market closed at that level down there, then the wick would actually be excessive and that could potentially mean that what we’re likely to get next is a bit of a reversal in this market to the downside.

The information that can be gleaned from our knowledge and understanding of Japanese candlesticks can be really, really important. It can give you as a trader some real significant edge trading these markets. So that’s just a bit of an overview in terms of the anatomy of a Japanese candlestick. In terms of the four price points – the highs, the lows, the open, and the close prices. And also, the real body, and of course the shadow to the upside and the shadow to the downside as well.

Bearing that information in mind, we shall now look at some of the different types of candlestick formations. It’s important to note that Japanese candlestick formations come in all shapes and sizes, however each and every one of them can give a trader valuable information with regards to future price moves. There are three categories of candlestick formations for you to embrace.

The first one is Bullish Candlestick Formation. These can be broken down into three different categories we could have Single Bullish Candlestick Formations. We can also have Two Candle Bullish Candlestick Formations. And of course, Three Plus Candlestick Formations. And that just refers to the number of candlesticks that are involved in that piece of analysis. Without confusing you too much, we also have the same when it comes to Bearish Candlestick Formations. We’ve got Single, Two Candle, and Three Plus Candlestick Formations to consider if we’re looking for what would be regarded by traders, as being those that are proficient in technical analysis and understanding price charts, as being Bearish Candlestick Formations. In addition to price action moving to the upside and price action potentially moving to the downside, we also have neutral candlestick formations. Now these can be interpreted as giving neutral price information. But they can gain also significance when these form part of other candlestick formations. In their own right, they can remain somewhat neutral. However, when we start seeing that the price action, which has come before it, and after that particular neutral candlestick formation, then it can then give us some very, very useful information. Often when we see these, we as traders, we look to pause and to just consider what might occur next and allow the market to determine that decision-making process. All we need to do as traders is be prepared for all eventual outcomes and we can do that in a very consistent way.

We have bullish candlesticks, bearish, and neutral candlestick formations to consider. We’re actually going to go through each form one at a time. I thought that, we thought it’d be quite useful for you to see the variations of Single Candlestick Formations. And all of these have implications for bullish price action. Meaning, when we see these sorts of setups, we can look to stack the odds in our favor in terms of having an understanding, in terms of what might happen next, which is all what’s very, very important for us as traders.

We’ll start with the Hammer on the left-hand side and we’ll work across the screen. The candle that is of real interest to us, and don’t forget these are Single Candlestick Formations. Meaning we’re getting price action clearly moving to the downside one period at a time. And then lo and behold the candle gives us, it prints this particular candlestick. It means we see the low price. We can see the high price in this market. It just so happens to be the open as well. And we can see the close of this market. There’s quite an extended gap between the low and the close, and that gives us some real valuable information as a trader. When we see price action like this, traders consider this fairly bullish in a downtrend. Meaning, we’re very likely to get a little bit of price action as a result back to the upside in a market like this. That’s what we can expect from a hammer. You know, it is important to know the names of these different candlesticks. But there’s so many of them, and all we’re discussing in the next few slides is the major candlesticks. There’s many, many more, however. Probably there’s too many variations. Some, you know, a lot, of these major candlesticks can have real profound impacts on the markets. And there’s others which would just probably confuse traders to some degree as well. We’ve just highlighted some of them, the most commonly used candlestick formations, and we’ll explain the anatomy of the actual Single Candlestick Formation itself and what traders can glean from that information.

When we see a Hammer and it also there’s it’s commonly known that you know this sort of single candlestick formation can hammer out a bottom of a market. So, you’re getting that quite explosive move lower. The market puts in this candlestick and this gives fantastic opportunities for traders to start pushing this price higher. Therein lies the potential for us as traders to see this kind of price action and then act accordingly. If you decided to buy above the high of this, it has the potential to give you a significant risk reward potential to the upside if you see this kind of price action.

Moving along then to an Inverted Hammer. This time, as you can see, we’re going to focus very very carefully on the anatomy of this particular candlestick just in here. It’s just middle one that we’re really focusing on. What we’re seeing is that again that price move consistently, make new lows. We can clearly see that price action is moving lower and what we see then is an Inverted Hammer. It’s the same as the Hammer, it’s just the actual hammer end is at the bottom of the shadow rather than at the top. But for all intents and purposes when we see this price action it’s referred to as an Inverted Hammer. And what the signal that that sends to traders when they trade is that is potentially considered bullish in a particular downtrend. Again, we are prone to this kind of price action and there’s no guarantees that this market will behave like that. But you are stacking the odds in your favour if you can identify this price action and perhaps you… we’re going to look at the approach to risk management very shortly. But what you’ll often see is a reversal in prior action. And it’s not guaranteed every single time. It’s just you’re probably stacking the odds in your favor more by utilizing your understanding in this way.

Moving on to a Dragonfly Doji now, so what we’re seeing in this market again is this market continued to move to the downside and on this occasion, we make a low in this market. But as you can see, we get a bit of a reversal on price action and what this is telling us is the open and the close of this market is exactly the same however, and the high should I say. There’s a lot going on here with this candlestick. The market opens, it moves to the downside. There’s a complete reversal, and a rejection of these lows, and we get buying pressure coming into this market to such an extent that the open, the close, and the high of the market is exactly the same price, or very, very close to being the same price. Again, what you’re likely to experience is that the longer the lower shadow signals are, the more potential for upside movement. When this appears at the bottom it is considered to be a fairly strong reversal signal. Looking for Dragonfly Dojis can give traders a real advantage and as a trader you can make that decision to look to drive that price back to the upside. So that’s Dragonfly Doji Single count Candlestick Formations.

We’ll just finish the fourth one, which is bullish spinning top. This one I want to draw your attention to this middle candlestick just in there, and we’re getting some bullish price action now on this particular situation and we get to see a brand new high in this market. However, the market at some point sort of reverses to make a considerable low and it struggles to get back up to those previous highs. That effectively, is referred to as a Spinning Top and it’s a Bullish Spinning Top just because it’s got a significant bullish, it’s green in color, so it has a bullish connotation to when we see this on a price chart. So, the size of the shadows can vary and are probably less important unless they’re quite extreme. And if we see this kind of price action, and certainly if we get a break above the high price, then we’re very likely to see continuation and is viewed by traders as being quite bullish in an uptrend. It’s important that we do see the bullish price action prior to this candlestick and if we get a break above the high, we’re very likely to see a continuation to the upside. And this is how traders utilize these formations to understand exactly what’s going on with price, and what is the likeliest next in these markets. That’s just an overview of four of the main Single Candlestick Formations.

3550

What we also have is Two Candlestick Formations, as well. Again, we shall go through these one at a time. We’ll start on the left-hand side and we’ll look for Bullish Kicker Candlestick formations. Now we’re effectively looking for two candlesticks. It’s not a single candlestick that can give us the information, it’s actually what’s going on in the relationship between two different candlesticks. What we mean by that is we’re seeing in this example we’re seeing price move lower and then we see this candlestick printed. This is candlestick 1 for us, and we’re also looking at this one just above. And what information does this kind of price action give us? What I’ll do is I’ll just place this 2 just above this particular candlestick just so that you are comfortable in terms of which two candlesticks we’re referring to. We can see on this fourth bearish candlestick that price is closed lower it’s very, very bearish in this particular market. But on the very next period or the next day, if this is a daily timeframe, what we can see with the next candlestick is that we close down here, however we open significantly higher. In fact, we open above the previous candlestick. If this is the open of the previous day, we can see the open is just above it, however the closed price is quite significantly lower than that particular level. We see the close of this candlestick, we see the open. But we also, most importantly, see the open of the new candlestick. And in a situation like this it’s regarded as being very, very bullish indeed. It’s considered bullish when the next green candlestick gaps to the upside. So, there’s a gap in there and it just means that a lot of the sellers have been blown out of the water. Those that look to buy markets like this will look to aggressively push higher. Again, not every single case. But certainly, the odds would be stacked in your favour if that is the case more often than not.

Moving on then to a personal favourite of mine which would be Bullish Engulfing. Here what we can see is again we can see quite consistently a series of markets. These don’t necessarily have to move in a linear fashion, these could be a little bit erratic. But what’s important to take away of this is the previous candlestick. I’m looking at Candlestick 1, and also the very next Candlestick 2. And it’s these two candlesticks which interest us. What we can see is this market open lower and we can see that the close of this price is significantly higher. And what it does is it completely engulfs all of these candlesticks. They’re completely engulfed by one day of price action, if this happens to be daily timeframes. Whatever this period is, it doesn’t necessarily matter. When you see a print of a candlestick like this, it effectively blows all these candlesticks out of the water and we get to see some real dominance in this market. What this means is quite bullish if we see a bullish engulfing two candlestick formation which exists. We need to engulf the previous candlestick and if that occurs to multiple candlesticks, that’s even better, and it adds more credibility to the trader and certainly more confidence in that market. It’s considered a major bullish signal in a downtrend if this market is moving lower, we get a Bullish Engulfing, and we can often see some really nice explosive price action to the upside. And I’ll show you some practical examples of this very shortly.

Moving on then to Bullish Harami. In this situation we’re getting some quite considerable selling pressure. You can see its kind of an inverted Bullish Engulfing. But we’re seeing a complete dominance to the downside until we get this. Again, in this situation we’re looking at Candlestick 1 and we’re looking at the very next, Candlestick 2, and we can see that that price opens, closes, high and low is all contained within the price action of the previous candlestick. What this does, as far as sellers is concerned, is put a question mark in their mind. Would they expect to see further continuation to the downside once we get a bit of a Bullish Harami in this situation where we’re actually getting a close much lower and we’re getting the open much higher within that candlestick? That creates a bit of doubt in the minds of sellers. And it gives bullies a fantastic opportunity to look to capitalise on this price action, look to get into this market, and look to drive this price higher. This is stacking the odds in your favour again to the upside if you identify a Bullish Harami in this way. It’s considered a bullish signal in a downtrend.

That’s the Bullish Harami and we’ll just finish the Two Candlestick Formations by just reviewing what’s called a Piercing Line. What we’re seeing in this particular candlestick, and again, I would like to I would like you to draw your attention to these two candlesticks in here, one bearish, one bullish. I just put those numbers just above these candlesticks, and what we’re seeing is price action move consistently lower. And the fourth candlestick here is what is of interest to us. We’re actually seeing the next candlestick open much lower, and the price action actually pushes lower. We’re clearly operating in a price action that would be conducive to sellers until price starts to reverse, and we start getting this little bit of buying pressure coming in. And what’s often identified is 50% of the previous candlestick is really what’s quite important. What we’re seeing is we’re actually getting a close of this market above. We’re seeing before our very eyes a bit of a rejection of the previous price action having made new lows. A lot of this starts to stack up in the minds of a trader, certainly those that are looking to buy this market and they’re seeing the rejection to the downside. They’re seeing the market open lower, which is quite bearish, and we’re seeing a reversal of that bearish price action. And we’re actually seeing the market close above 50% of the previous candlestick.


44

With all this in mind, and what this has great potential for, is some nice explosive price action to the upside, and start printing new highs from these levels. So, it’s considered a bullish reversal signal when it opens lower but closes back above halfway of the preceding candlestick. These are just metrics, it’s roughly 50%, but you know you don’t have to be too precise with that. But you just got to be open to the fact that it’s a clearly defined reversal signal and we’re very likely to get some bullish price action off the back of a piercing line. Those really are your two candlestick formations to the upside where you’re likely to get some bullish price action off the back of them.

Let’s finish the Bullish Candlestick Formations and we’ll look at Three Plus Candlestick Formations. Now, you know we’ve identified four main Three Plus Candlestick Formations. there are more out there. But these will certainly give you a very comprehensive understanding in terms of what is going on in these markets if you’re able to identify these candlestick formations. We’ll start again on the left-hand side by looking at the Morning Star. What we’re seeing in this kind of price action is price consistently moving lower. The reason why we’re looking at a Three Plus is that it can contain three or more candlesticks, effectively. Now, we’re looking at this first candlestick, this second one just in here, and we’re also now looking at the third candlestick for us to get the information that we need to really act and to utilize this information. What we’re seeing is three days of bearish price action, if this was a daily timeframe. And the fourth candlestick actually gaps down lower. But it doesn’t continue lower. As you can see, we have a green body which is actually bullish in nature. What we’re seeing is effectively a reversal signal even though this market is gapped lower. We’re clearly seeing the close of this market and the open considerably lower. This is effectively the gap in this market. that is not to be ignored.

When we see these gaps, you know, what price action do we see next? And we see the fact that, in fact the open of this market is even lower than that. This is the gap which is quite considerable and what we see price action do next is make a new low, and then all of a sudden, it actually becomes quite bullish where we actually close higher. And then that extended that is extended in the third candlestick and then you’re very likely to see that for subsequent candlesticks. It’s just being a little bit patient, you’re seeing this price action. It might be more prudent for you to get into a Morning Star after the third candlestick which is actually closed. And that can give you the very important information to be able take this market higher. Now there’s all sorts of variations with this third candlestick. It can close much, much lower and that might mitigate the potential for such a strong reversal signal. So, we need to see some bullish price action off the back of the gap, lower. This price action is considered a major reversal signal in a downtrend. The market has to be moving to the downside and if we see this price action with two and three, we’re very likely to see continuation to the upside, in this example.

47

Moving on to Bullish Abandoned Baby. Again, just to identify that this market is moving lower and the three mark, the three candlesticks, we’re really interested in are these three, as you can see. When we go to the first candlestick we can see, we see a normal sort of consistent move lower. We are in a downtrend and what we see is an Abandoned Baby. All of these names are weird and wonderful. You know you don’t necessarily need to memorize all of these different types of candlestick formations. But what you do need to understand and comprehend is that you know when you see price action like this it can look and it can become very, very bullish. What we’re seeing is a considerable gap lower where this market again gaps down quite considerably. We’re seeing a really significant gap in this particular example; however, it doesn’t continue lower. We get a little bit of a reversal pushing to the upside and then the very next day, if this is a daily timeframe, the market actually gaps again to the upside. Without confusing you too much, we get two gaps in this market and this is very, very bullish indeed if we get this kind of price action. We’re getting two gaps in this market and then we need to literally wait and see what happens to the third candlestick. And if the conditions are right, then you’re very likely to experience a considerable reversal in this market. It’s considered a major bullish signal in a downtrend. That is a Bullish Abandoned Baby.

Moving on then to Three Soldiers. What we’re seeing now in this particular situation is continuation to the downside, as you can see. And the three candlesticks we’re looking at in particular would be… this market continued to move lower, and it’s these three candlesticks that get to offset a lot of the bearish price action in the action in the candlesticks which came before it. What we’re looking for here is three long green candle sticks with consecutively higher closes in a downtrend. And this is considered a very, very, not a significant, reversal signal in this market. We’re getting really quite significant price moves to the downside. But then this particular market fails to make a new low and we actually start printing three consecutively higher you know long green candlesticks. In this situation it’s the size of the candlestick which is quite important and as you can see these are three significant bullish candlesticks which means that if we can mitigate most of the previous price action then it’s looking considerably, significantly, bullish to the upside in this situation. So that’s Three Soldiers in a downtrend.

The the final Three Plus Candlestick Formation is Three Line Strike. This is, as you can see, sort of fairly similar to a Bullish Engulfing if you see this in a downtrend. What we’re needing to see is we’re kind of looking at, and this is why it’s Three Plus, we’re kind of looking at these three bearish candlesticks and then we’re seeing the fourth candlestick which completely blows these three previous candlesticks out of the water. It’s considered a major bullish reversal signal when in a downtrend. You can clearly see that opportunities to buy perhaps above the high would constitute continuation to the upside in price action like this.

Okay, so that concludes an overview of the different types of Bullish Candlestick Formations. I’ll take off those scribbles and we’ll move on with the presentation. We’ll look into this time Bearish Candlestick Formations. Again, as you can see, a lot of these names are very different, there’s aspects which are similar. A lot of these are very similar to the Bullish Candlestick Formations, just they’re actually more bearish than bullish. When you identify opportunities like this in the market, you should be looking for opportunities for these markets to be moving lower, in this case. And we’ll start again with the Hanging Man, and again this is a Single Candlestick Formation. Again, what we can see is a little bit of a reversal in this situation. It’s kind of the opposite of a Hammer. What we’re seeing now is price action squeeze higher and we’re seeing this one candlestick, just in here, which opens above and then starts to push much, much lower, create a low in this market, pullback, and is still looking a little bit on the bearish side. And if we get continuation the following day then what we’re likely to see is a nice a nice move lower. The lower shadow should be at least twice as big as the body. And that’s an important aspect of this market. If we’re saying the body of a Hanging Man, it would need to be at least one third of the overall range of this market. Meaning you want to see a long lower shadow, at least twice as long as the body, otherwise it means something slightly different.

It’s whether a market conforms to this type of price action which will determine what your steps are, what potential trade ideas you could look to execute. As you can see we’re getting a little bit of a reversal price action off the back of a Hanging Man. It’s just called a Hanging Man just because it gives the appearance on a chart, you know if this is a man’s head, then he it gives the appearance that it looks like he’s hanging there. Okay so it’s a bit morbid, but it is referred to as a Hanging Man.

So, in addition, moving on to a Shooting Star. We’re seeing quite bullish price action as you can see. We make a brand-new high which is obviously great at the time, however we start to reverse this price action and actually we open at this level and we close much lower. That is significantly bearish and what it means is, this is now a Shooting Star and it’s considered a significant bearish bit of price action in an uptrend. What we’re needing to see this time is market looking like it’s just about to roll and it could give you fantastic opportunities to take this market lower if you see price action like that.

55

Moving on then to Gravestone Doji. We’re seeing this market push higher on this occasion. And on this occasion, we’re looking at this candlestick in here. Again, this middle one just in there. That’s what we would be looking at. And again, the Gravestone Doji candlestick means that this market pushes higher. But as you can see it rejects the high, starts pushing to the downside, and this time it’s a very similar bit of price action to the Dragonfly Doji which is quite bullish. Now, the Gravestone Doji is actually quite bearish. I’m going to just remove this here, hide, so it doesn’t confuse you. We’re actually now seeing the low-priced the open and the close all at the same level and this is very, very bearish and can give traders fantastic opportunities to actually look to take this trade actually to the downside. When this bit of price action appears at market tops it is considered to be a reversal signal and quite a significant one at that.

So, moving on then to Bearish Spinning Top. We’re seeing this market continue. It’s the opposite of a Bullish Spinning Top where we get a bit of indecision in this market you know; this is the candlestick we’re looking at. We get a bit of indecision in this market; it has the potential to reverse. A break above these highs could potentially mean that we could be reversing to the upside. However, what we actually see is the market continued pushing lower. That is actually quite important where we can see continued sort of bearish price action. What should be taken note of is the previous price action which has been quite bearish, and also the size of the shadow itself to the upside or the downside can vary somewhat. And you’re really needing to see the continuation of prices pushing lower. And under the circumstances like this, this is quite a Bearish Spinning Top. You’re likely to see prices move to the downside.

Okay, those are the Bearish Single Candlestick Formations. Moving on then to the Two Candlestick Formations and we’ll start with the Bearish Kicker. Which is the opposite of a Bullish Kicker. We’ll start with this one first. We’re getting we’re seeing consistent price action to the upside. The candlestick we are looking at is this candlestick in here, and also this second candlestick here. And what we’re actually seeing is the market close so much higher, and it actually gaps lower. We actually open considerably lower than the close of the previous candle and it actually gaps lower. It actually opens beneath the open of the previous candlestick. That is quite significant and quite bearish in its own right. And off the back of that you’re very likely to see continuation of prices pushing lower. it’s considered bearish when the next red candlestick gaps to the downside. It’s the fact that we’re experiencing a gap and the nature of this second candlestick is red in color and quite bearish. Meaning we’re very likely to see price action squeezing lower.

Okay, moving on now to a Bearish Engulfing. This is considered a major bearish signal in an uptrend. Again, you know these are personal favorites. I do like to see price action squeeze higher. So, this is Candlestick 1, and this is Candlestick 2 that we are interested in. And actually, this engulfs this bearish candlestick. It engulfs the previous price action of all three candlesticks. But the previous one is a starting point, and if it engulfs more candlesticks than that, then it can just add more conviction to the trades that you’re looking to take. And as you can see, the open and the close blow these bullish candle sticks out of the water. And we’re going to we’re very likely to see continuation of prices moving to the downside. When you see a Bullish or a Bearish Engulfing Candlestick you should sit up and take note of that price action because you’re very likely to see some significant opportunities off the back of it. It is considered a major bear signal in an uptrend. You’re getting prices moving higher, you’re getting reversal signal, and you’re very likely to see prices push lower.

Okay, moving on to Bearish Harami now. These candlesticks, like we saw in the Bullish Harami, in this occasion is pushing higher and we see price action contained within the previous candlestick. This is kind of stick one that we’re looking at this is candlestick – we can see that the price action is contained comfortably within the range of the previous number one candlestick which is quite bullish, and the nature of the Harami is bearishness in this situation. And what you’re likely to see in a situation like that is continuation of price action actually to the downside. It’s considered a bearish signal in an uptrend. That’s something for you to consider. A Bearish Harami.

We’ll just finish the Two Candlestick Formations by looking at a Dark Cloud Cover. This is an interesting bit a bit of price action. What we’re seeing in a situation like this is that this is very much considered a bearish reversal signal when it opens higher but closes back below halfway of the preceding candlestick. That is significantly important. What we’re seeing is price action look quite bullish where we’re getting this this little move to the upside. It’s quite similar to the Piercing Line. But what we see is prices open higher, which is bullish at that particular point. And what we are looking at is Candlestick 1, and also Candlestick 2. What we need to see is prices push higher and then a bit of a reversal of that particular price action. However, it’s important that approximately the market reverses quite considerably so that we break below the roughly the 50% level on Candlestick 1. And that’s really structurally quite important because what you’re likely to see when you see setups like this is a continuation to the downside. It is considered a very bearish reversal signal when it opens higher but closes back below halfway of the preceding candlestick. And you’re very likely to be able to capitalize on a bit of a price move to the downside in this market if you’re trading a Dark Cloud Cover. Okay, so that covers some of the major Two Candlestick Formations.

We will finish the Bearish Candlestick Formation action with looking at Three Plus Candlestick formations. We’ll start as we always do on the left-hand side looking at an Evening Star Formation. What we’re looking at here is some bullish price action or what we should be looking for is some bullish price action. The three candlesticks we’re very interested in is one, this little candlestick up here, and then the third one in play there. And potentially subsequent candlesticks as well. But we work with these three for the time being where we get a close of the candlestick number one. We get a considerable gap higher in this market and that’s quite important because that’s referred to as an Evening Star. And what we’re seeing is in fact I’ve kind of done it again. But what we’ll do is we’ll work with the level at which this market opens, which is that high of the rectangle on a bearish candlestick. We’re getting a considerable gap in in this market. It’s important to consider that prices have gapped to the upside. But we’re getting a bit of a reversal price action. We’re looking like we’re going to close this particular gap. And potentially, if it breaks lower then we’re likely to get continuation to the downside. When we see an Evening Star it’s considered a major reversal signal in an uptrend. We’re very likely to see that bit of price action look to squeeze lower in a market like this.

Moving on this time to a Bearish Abandoned Baby rather than a Bullish Abandoned Baby. We’re seeing the market look quite bullish which is making new highs, the market gaps up. The gap is quite interesting. I’ll put G for gap. But the market fails to make considerable highs and actually starts to reverse. The close of Candlestick 2. I’ll put 2 in here, and then number 3 down at the bottom. The close of Candlestick 2 is quite significant because if we get a smaller gap it doesn’t matter the size of the gap necessarily. But in this example, we’re getting a smaller gap. But we’re getting continuation with Candlestick 3. And that’s the important part of a Bearish Abandoned Baby is that you’re seeing this abandoned baby here at the top. But now you’re getting some quite, these are quite good, bearish signals for us as traders to try and take advantage of. And it’s considered a major bearish signal in an uptrend. Okay, that’s the Bearish Abandoned Baby.

Moving along, let’s have a look at the Three Black Crows. This is similar to the Three Soldiers in a Bullish Candlestick Formation. What we’re getting this time is some initial bullish price action. What’s interesting for us to look at in this situation like this, is a bit of an unraveling of those of previous bullish price action with three very, very bearish candlesticks. What we’re looking for here is three long red candle sticks with consecutively lower closes in a downtrend. This is considered a significant reversal signal when you see price action like this. You’re very likely to see continuation to the downside if you see Three Black Crows. They mitigate against a lot of the work by the bulls in this market, where price action is pushing higher. Now, these three back-to-back Black Crows are very likely to give extended opportunities to the downside and become quite bearish.

And just the last one, an Evening Doji star. This is what we’re currently seeing up on screen now. Again, the three candlesticks that we’re looking at is Candlestick 1, Candlestick 2, and also Candlestick 3. And what we’re seeing is some bullish price action pushing prices higher. We can see that the close of candlestick number one is quite significant and certainly pushing higher and the open absolutely gaps to the upside on Candlestick 2. There is a bit of a gap to the upside, which you may think looks quite bullish, but what we see is we get actually a bit of indecision in this market. We can’t push higher; we can’t push lower. The open and the close price of Candlestick 2 is actually the same. What it, it puts it some indecision in the minds of those buyers because now they’re there, they’re looking at this price action, and they’re actually anticipating opportunities for sellers to enter this market and to drive prices lower. At which case, if we see Candlestick 3 start to move to the downside, then that, for all intents and purposes, signifies a significant reversal signal in what was an uptrend. It is considered a very very major bearish reversal signal. When we identify it in an uptrend prices have to be moving to the upside, we need to see the Evening Doji Star and then we need to see price action look to reverse. Then that can give us some fantastic opportunities to the downside. Okay, so that’s an overview of Bearish Candlestick Formations.

There’s one set of candlestick formations that we need to look at, and that is those candlestick formations which are Neutral in nature. These candlesticks are very much neutral by nature but can gain significance when they form part of other candlestick formations. It’s actually what often precedes it and then comes after these candlesticks is what can give us some very very useful information. We’ll start by a very popular candlestick which is called a Doji Candlestick. Now, for all intents and purposes, when we see these candlesticks on a price chart it creates some indecision. Meaning it’s largely neutral. We don’t know whether buyers or sellers are in control of this particular market. It’s very, very neutral in nature. But what we’re seeing technically is the market open. It doesn’t matter whether it’s moved higher or move lower. Let’s say for example it’s moved higher. We’ve made a new high in this market. We’ve also pushed lower and made a new low and price comes back to close at the same level as the open. This is the anatomy of a Doji Candlestick in this situation. These largely Neutral Candlesticks have long shadows but very smaller or non-existent bodies. The size of the shadow can vary greatly. We can have normal Dojis and we can have a long-legged Doji Candlesticks as well and that just sort of tends to give the impression of some considerable extended indecision in markets, depending on the size or the difference between the highs and the lows in markets like these. The size of the shadows can vary and can vary quite dramatically. But they really do gain importance when they form part of other formations. And what we mean by that is if the next candlestick starts to push to the upside, then that lends itself to some continuation in prices looking to push higher. The same to the downside if we start breaking the daily lows, then you’re very likely to see a price action move lower. That’s effectively what can happen with these price moves, you can have prices moving higher or you can also have potentially prices moving lower off the back of what is a Doji Candlestick. So that hopefully gives you a bit of an idea. But you know traders do understand these candlesticks as more like indecision candlesticks rather than neutral. I do bear that in mind as well.

Moving on then to Spinning Top Candlesticks. These are quite similar to Doji Candlesticks however the main difference is the real body, which you can see from a bullish perspective and also from a bearish specific perspective. These largely Neutral Candlesticks have long shadows. But very, very small bodies, as you can see. Now the size of the shadow can vary again quite considerably. These can be quite extended, or they can be quite short, and they gain as well importance as a part of other formations. The same thing applies. If we get price action breaking above the high, we’re likely to see continuation to the upside and a break beneath the low we’re likely to see price action move lower. And the same for a Spinning Top which has a bearish viewpoint to it we’re likely to see prices squeezed lower and we are also potentially likely to see prices move higher. It actually depends on what comes next. And we also want to take note of what comes before it you know if we’re seeing some bullish price action, we might get continuation, or we might get reversal. It’s really identifying what comes before and then making decisions in terms of what we’re likely to see next. Those are Spinning Top Candlesticks.

Moving on then to Marubozu Candlestick Formations. As you can see, as opposed to a Doji Candlestick, where the high and the low, and the open and the close, should I say are exactly the same, the opposite of that would be a Marubozu Candlestick. Where the open and the low price, the open and low, and the close and the high. That’s what we’re seeing in a bullish Marubozu and it’s the opposite way around. Now we’re seeing the open plus the high price and the close plus the low. That’s what we’d want to bear in mind when we’re talking about Marubozu close is that we’re getting the highs in the close and the opens and the lows which is virtually the same price. A normal or long candlestick with no shadow meaning the high price and the low price represent the opening and closing prices of the respective Japanese candlesticks. That’s just an explanation of what we’re seeing. We’re just seeing an accumulation of prices stacking up. And these are always quite interesting because again we’d be interested to see whether from the close whether this market starts to move lower or whether we start getting extension pushing higher. We can actually it can actually work both ways off a candlestick like this either to the upside we’re likely to see prices push higher off that level or also potentially push lower. That’s the situation regarding Marubozu Candlestick Formations. And again, in their nature, all of these three are relatively neutral or create indecision let’s say for technical traders. But it all can contribute to a coherent approach to trading these markets.

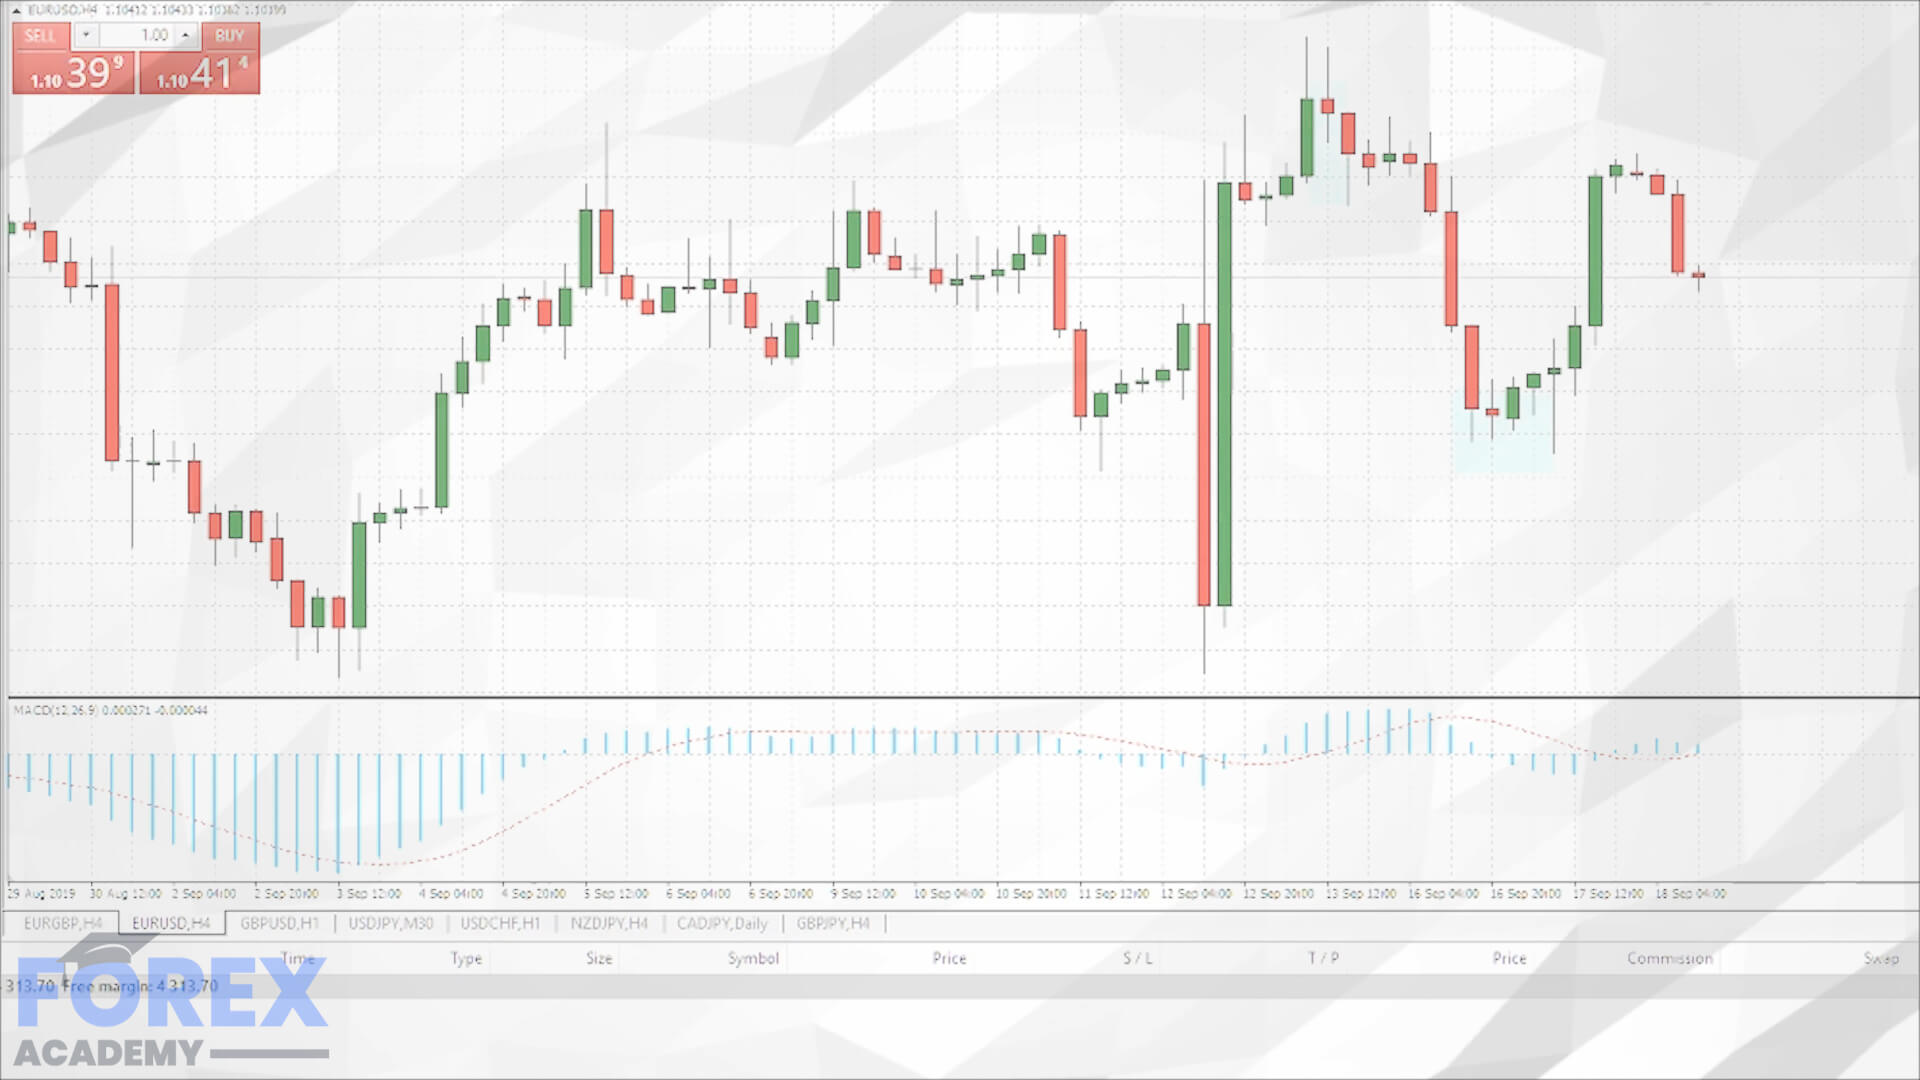
Let’s move on then and we’ll look at you know different time frames and the different information that can be gleaned from looking at different time frames. Now, it is very important to note that you can view candlestick formations in different time frames. The larger the time frame normally, the more important the signal can become. And to show you this I’d like to bring up a price chart. Let’s review a live chart to explain this in more detail, excuse me, let me take that back and let me get up the price chart here for you. What we’re currently seeing on chart right now and if we do our technical analysis, we can see there’s effectively a double bottom here. There’s potentially a little bit of the potential for this market to eventually maybe squeeze higher. We’d be looking at these levels in here to see if we get a bit of a push higher. Now we’ve just had a pullback off these levels. That’s quite interesting, so you know this market could very easily you know look to squeeze higher or could look to squeeze further lower as well. We want to bear that in mind. We can quite clearly see over the course of this time frame, and a this is an hourly candlestick, each one of these candlesticks that you’re currently seeing up on screen represents various different information on an hourly basis. We can see our Doji candlesticks and we can see the price action of this hour. We can see nice big extended continuation candlesticks. We can also see you know Bearish Engulfing and there’s a whole myriad of different types of candlestick formations that we can use.

Now to just sort of highlight and show you, and this is a live chart currently, we can do our analysis on this time frame. I want to go through the time frames and look at higher time frames and see how the picture starts to change. You can see that we’re kind of getting a bottoming out of this market. We’ve kind of created a double low on an hourly timeframe. Let’s look at it on a on a four-hourly chart. You can see this this convergence down here at the bottom of this price. We’re struggling to break beneath this level here above the 131 level. And this is the EURJPY. Now, each of these candlesticks represent four hours of price action. You can get your Marubozu Candlestick on a 4-hour chart which is the open and the high is exactly the same as the close and the low, which you would expect continuation, which we see we get a little bit of a pullback and then we get continuation to the downside. And you get your Bearish Engulfing in there as well and you get this sort of grinding price action, you know squeezing prices lower. We’re currently struggling to break beneath the 131 roughly down at this bottom right hand corner. We might see some continuation pushing higher. But generally, prices moving from top left to bottom right.

The timeframe that you look at is of significant importance to us as traders because our impression can change slightly depending on the timeframe that we look at. We take this information on to a daily timeframe and now we can actually see, we can conduct a little bit of technical analysis. We can see that this level is quite important. We can see our Bearish Spinning Top Candlestick and we can also see our Hanging Man which is not quite made the low. But you can see this Hanging Man which is actually today’s candlestick. Let’s see what happens what we’re seeing is a bit of bearish price action which precedes it. Really, we would be looking to see, what happens next would give us some really interesting information. We can give that some very, very interesting very easy and straightforward candlestick fashion candlestick analysis and technical analysis to this chart, to give us a little bit more information. But you can see we’re on the back end of a quite considerable move lower and we’re getting a bit of a rejection of prices moving lower in this situation. You can therefore make decisions based on different time frames. Based upon the different opportunities that may exist. You might find some buying opportunities on an hourly chart, whereas if you can move up the time frames, you can see sort of a little bit more clearly.

You can see that we’re actually now looking at a weekly time frame. We’re in a significant bull run basically since 2016. Prices are moving higher over this particular time frame and we’re seeing a bit of consolidation around these levels which just coincides with our very briefly drawn level of support around the 130-147 level and we’re getting just prices just gathering around this level. When you go through the different time frames, you can then see again we’ve got a Bearish Spinning Top, and it all depends on what happens next. And if what happens next puts a bit of indecision in a trader’s mind, then it can give opportunities for traders to actually look to take this price even higher. It can very much, when you go through the time frames and you look at Japanese candlesticks, it can very much give you a different impression in terms of the information that you need. Now again, you go even higher than that. And without the need to confuse you to any great extent, you can see that we’ve got a Bearish Engulfing. On a monthly timeframe if you if you happen to be trading really, really long timeframes, you would expect continuation to the downside. We’ve got highs, we’ve got lows, we’ve got swing highs again. This could be a high of this market on the top left-hand corner. We have a lower high, and now we have another lower high once more. And when you mix that with your understanding of Japanese candlesticks and perhaps Bearish Engulfing, and we’re seeing the same again, we’re just likely to get some continuation in this market pushing prices lower. That’s how you can use different timeframes and your understanding of Japanese candlesticks and if we get a break beneath the monthly low, then we would expect and anticipate, on a monthly timeframe, for this market to move lower.

Of course, your approach to risk may deviate somewhat and I shall explain that very, very shortly. But that’s hopefully just explained to you that how different timeframes can impact the decisions that we take as traders.

Okay, and just to link and I’ve kind of just alluded to it, but it’s also important to note that candlestick formations do not necessarily need to stand alone when it comes to decision making as a trader. They can form part of a much, much bigger picture. For example, you can often, you can often see a situation on a price chart where you identify a candlestick formation. But it forms part of a bigger charting pattern. As a result, the idea is for you to use the information a price chart can give you to formulate trade ideas. It’s effectively looking to put all these things together. I just want to share this chart with you, it’s a static chart. We’re getting some price action pushing higher, we can see that we get a bit of a pullback in this market, and then we push considerably higher withso.me considerable momentum. When we look at a price chart like this, we can see that we’ve had some rejections here to the upside and it’s a very, very poorly constructed Bearish Spinning Top which has the potential to see these prices move lower. However, it would certainly look to create a bit of indecision. We’re not necessarily suggesting that you need to trade all of these decisions or you can even make money on all of them you may do for a particular period of time.

But you need to take into account you know a lot more information perhaps previous price action and seeing how things develop and unfold. But you’re getting quite a number of very sort of bearish price action in markets like this. You’re getting a triple top which is important, and another sort of charting pattern that we can see would be a kind of a Head & Shoulders. You can see the symmetry moving across this price action. If I just draw sort of fairly simple lines you can see that we have our shoulders here and you could see that this could formulate a fairly easy to identify head, followed by another shoulder. And it’s the symmetry of price action like that which can give us really, really useful information. If we’re coming to the price action like this where we’re getting a bit of a Spinning Top, and a bit of price action which is looking kind of like a Shooting Star, slightly bigger Shooting Star, then you know all of these price actions don’t necessarily need to conform to any great extent. They need to be variations of candlestick formations that you identify followed by a Bearish Spinning Top. And then, that’s just very likely to see continuation of prices moving lower before you get your major Bearish Engulfing Candlestick which is quite bearish looking to take this market lower.

But from a from a technical perspective we can look to put information together in a very coherent manner to decide what we should do with these markets. We can have charting patterns, we can have our Head & Shoulders price action, and if we blend that nicely with our understanding of these candlesticks, we can look for really, really prime opportunities to get into this market with the view to look to sell it and look to capitalize. And then when other charting patterns start to materialize, you can formulate an extended trade plan on that basis. That’s just hopefully linking our understanding of Japanese candlesticks which can be standalone decisions that traders can make. And if you can blend them in with charting patterns, because the you know Head & Shoulders, in this example, is quite bearish in its own right. You can put your understanding of Japanese candlesticks, and your understanding of charting patterns as well, you can put those together and formulate a really useful approach to trading.

Let’s have a look at some technical tools now that can be used to assist with decision making. Let’s take a look at some of the technical tools that you can use on a live price chart. I’ll bring up our live price chart again and we will move this along a chart. We can see this price chart up on screen, and some of the tools that we can use, we can certainly label certain bits of price action in here. What I’m going to do first is just identify this price action on this chart. And I’m going to identify, or isolate should I say, these three bits of price action. When we identify, and what we’re looking for, is almost big-picture moves. We’re looking to see you know what occurs in these levels. Is there anything that I can identify from this that can give me useful information? The answer to that question is sometimes it might do, sometimes it might not, you know. This is where skill and experience starts to come in. We’re looking for these major highs and major lows, and identify, can any decisions be made off the back of this can we see rejection on numerous candlesticks and can we see potentially some bullish price action entering this market.

 I’m going to look at these three in turn and then as this market sort of clearly breaks to the downside, can we see anything that we that we can suggest that might be significant to us when we trade. This is the principle and the approach that traders are going to take with regards to formulating trade ideas. And this is where our understanding of Japanese candlesticks can come in quite nicely. Just to identify, we’ll have Candlestick 1, Candlestick 2, and we should also look at Candlestick 3. What you can do when you identify these interesting situations on a chart, we can sort of utilize some of these tools up here. You can put a little text box in here and Candlestick 1 for us and would be a Shooting Star. Put that in there. What I’ll do as well, I’ll just change the format. You can change the color, you know, it’s a Shooting Star, it’s bearish in nature. And maybe just reduce the size down a little bit. We could put that in here. You can identify that particular chart, we’ll have a look at chart number two. We put another label onto that. This is a Bearish Spinning Top, if you can see that chart in there now. What we can do is we can slide this, sorry, I just move the chart ever so slightly. So there we go. So that can be charting pattern number two, and we can look at Candlestick 3 there and we can place that in there. And we can look and assess the characteristics of that particular candlestick, and it’s actually, what we see, there’s a couple of sort of bearish candlesticks in there. You have a Bearish Engulfing and also a Gravestone. All of these are as you can see, let me just move this across. Just these two candlesticks in here, Bearish Engulfing, I’ll just bring it down the bottom there you can see it. Candlestick 1 for us or Candlestick 3 is the Bearish Engulfing followed by the Gravestone Doji candlestick or it’s very, very close to it.

All of these three different candlestick formations intimate price movement to the downside. Now as you can see, we do get smaller moves before we get the actual bigger move in this market lower. You get your again, another Bearish Engulfing, and you’re just likely to get prices moving to the downside. Now we’ll discuss rich risk management very, very shortly.

But that’s just their an overview of different tools that can be used to just assist you with in this process what we can also use are what called genuine levels of support resistance. We can identify the highs, we can see the triple top, we can also now identify these lows and see the rejections here. Now we can begin to formulate a bit of a trade plan and identify that this is actually a Head & Shoulders, a bit of price action with some significant bearish candlestick formations. And what it just extends is to the potential trade idea for this market to move lower. Knowing what direction the market moves in is very important for technical traders and that’s some of these technical tools that can be used. There’s still there’s also arrows to the upside or arrows to the downside. You can post those accordingly if you’re identifying you know a nice confirmed break to the upside, you can place arrows into your charts. And this is obviously all on a MetaTrader 4 platform. You can you can identify little breakouts to the upside, you can place arrows. And do use these when you are starting out to just give you some you know awareness and understanding, and certainly you can retain some of these features as well so when you log back into your trading platform you can access all of that information accordingly.

Okay, so continuing with the presentation then, that will lead us nicely into our understanding or impact on risk management. A comprehensive understanding of Candlestick Formations can really assist with your approach to risk. It can help you to clearly identify a price point in the market where you will not want to commit any more capital if price moves against you. That should be just a general basic overview in terms of a trader’s approach. You know, we’re advocates of trading with stop losses and being aware of the risks involved in trade and financial markets at all times.

So again, let’s take a look at an example on a live trading platform. I’ll bring this back upstairs and back up on screen. I just want to draw your attention to this Bearish Spinning Top up here. What I’ll do is I’ll zoom in a little bit more for you. We’re just going to look at this particular, I’m going to just delete this one, until, and I shall also delete this one here. I just want you to draw your attention to this candlestick in here. What we’re actually seeing is in fact, this is actually a Shooting Star, this was your Bearish Spinning Top. I’ll just edit that briefly. This is our Shooting Star just in here. This is the candlestick that we’re interested in. When we trade these financial markets what you want to do is obviously be able to assess your approach to risk. What we could very, very easily do is identify the highs and the lows of this particular market, and identify the high of the 1.2092, and I’m just looking at the data window in the bottom left hand corner and looking at the high price of this market. If you know that this if we’re in an uptrend and we’re identifying a shooting star which is effectively what we’ve what we’ve identified, you need to see the uptrend, and we can see it consistently. We’re absolutely fine with the fact that this market is moving to the upside. This can become a significantly bearish bit of price action when we see a Shooting Star in an uptrend. For us as traders, if we’re trading this independently and we can certainly identify the lower of this market followed by the high, it would be a bit of a straight forward situation for you as a trader to basically place your stop-loss above the high of this market, with the expectation being a Shooting Star which has a bearish connotation to look to send this market lower to the downside. And as you can see, markets don’t move in a linear fashion so you get the inevitable pullback.

A trade like this which is quite simple to see and to identify can become very, very bearish very quickly. Therein lies your potential to see significant risk reward, positive risk rewards, on a trade like this. You could be looking at four or five to one on a positive risk reward nature to the downside. This is how sort of our understanding of Japanese candlesticks can actually assist you with regards to being precise and accurate, with regards to your risk management, and calculate that risk accordingly in line with your Japanese candlesticks, and look to mitigate risk as quickly as possible. To just come back to this, if we get a bit of a reversal and we get prices moving higher, then this is not a market that you would look to be selling. You can you continue you can make sure you draw a line in the sand, work with the highs or just above the highs, and if you get a reversal then this is a market that you no longer want to be selling. However, if you stack the odds in your favour and you can conduct some fairly basic support resistance and some other technical analysis to this market, you could identify a fantastic opportunity to take this market to the downside. Okay, so that’s just the impact that Japanese candlesticks can have on risk and our ability to protect our own capital at all times.

Okay so now we are just moving on to the Practical Application, and we have been looking at practical live charts on over an extended period. Let’s now put you to the test as a trader. Shortly I shall reveal a live price chart and will then give you approximately 60 seconds to see if you can identify as many major candlestick formations as possible within that 60 seconds. It is not necessarily necessary for you to know the name of the candlestick formations. But we would be interested to see if you can, it’s a useful skill for you to develop to be able to identify its locations and the potential price moves thereafter. We will put you to the test and afterwards we will review the main candlestick formations and we will see how many you get right. We wish you the best of luck. To just give you a tip, what we’ve done is, what you can look at when I show you this chart, you could look for swing highs and swing lows which are significant areas for us as technical traders to look at and to be able to identify and see what’s going on. Just so that you know, we’ve identified four major bullish and four major bearish candlestick patterns in this chart. What I’d like to do is to put this chart up on screen and just give you 60 seconds to see if you can identify as many as you possibly can. There’s eight in total. There is many more on this chart, but and we’re looking for the more significant or the more major candlestick formations on this chart.

I’ll put this chart up now. Your 60 seconds can begin. In the meantime, there is actually four Bearish Candlestick Formations and as I’ve alluded to four Bullish Candlestick Formations on this chart. And to just give you a tip you know do look for the swing highs and swing lows and see if you can identify the specific candlesticks within that. I’m just going to give you a few more seconds to see if you can identify them. And as we’ve alluded to, just identifying the locations is often of crucial importance. The name of the actual Japanese candlesticks is actually less important. But just see if you can identify the potential for price action to perform based on what is for many of you your first introduction perhaps to technical analysis and your understanding of Japanese candlestick formations. I’ll give you just a few more seconds to just see if you can identify any more.

We’ve identified eight major levels on this chart. Hopefully you’ve had an opportunity to at least identify a few of them. And these are areas on a chart that would allow us to formulate a particular, perhaps biased to a particular, market and of course it can then give you as a trader some potential opportunities to make some consistent returns. Let’s start with and we’ll look at some Bearish Candlestick Formations to begin with. This is the first one, and if you’ve guessed it correctly then very, very well done. This is a Shooting Star. As you can see, we’re getting that price action pushing higher, we get our Shooting Star and we get a little bit of a pullback in this market. That’s the first one. The second one is this this area up here. This happens to be an Evening Star. What we’re doing is we get a nice bullish candlestick, we’re getting a gap to the upside, and we’re getting a little bit of a rejection actually in price action, and we’re getting some price action squeezing lower in this particular market. That’s our second Bearish Candlestick Formation.

Moving on we shall share with you our third, and there is a few more that which exist. You know you could argue if you identify this Doji Candlestick up here, that could constitute an opportunity to sell this market. But, we’d like to focus on a little more bigger moves and swing moves as well in a market like this to just formulate an approach or a directional bias to this market and this is a Bearish Kicker. As you can see, we’re in a bull trend. This market in the previous bit of price action is pushing higher, we have sort of a large Spinning Top here, but with a bullish biasness. And we are seeing the market close at this price up here and you can see it open considerably lower. This is what’s called a Bearish Kicker and when you see that, you’re very likely to get continuation to the downside in a market like this. Just one more sort of major bit of price action, and I do agree there is a few others, you could have a little bit of a bearish engulfing going on here which would have given you a fantastic opportunity to take this market lower. But in this bit of price action here, and we’re talking about a bit of a swing high, this is referred to as a Doji Candlestick and a bit of a bullish a slightly bullish Spinning Top. But for all intents and purposes, all that does for us as traders is create a little bit of indecision. We’ve got quite a lot of bearish price action pushing prices lower. You’d be more likely to look for opportunities to sell beneath this low point and you might be able to capture an interesting trade to the downside.

Okay, very well done. If you’re able to get some of those correct, what we will do now is to just review a few Bullish Candlestick Formations. The first one is this one currently up on screen, and I’m sure you’ve probably guessed it, what we get is a clear-cut Doji Candlestick. The reason why that’s a Neutral Candlestick is that it creates a bit of indecision in our mind, and what happens next is all very, very important. Prices are pushing lower. We’ve created a low and the next bit of price action is pushing higher. It could give you an opportunity to look to buy above the daily high and you would have got a profitable trade in this instance. Now you don’t have to be profitable with all of these trades you know. Some of them are not profitable. We can clearly see there’s another major, and again, there’s other bits of price action in here, like your Bullish Engulfing, which is very, very bullish. There’s lots of additional levels. But what we get clearly here in a swing low is a Hammer. That just simply means that prices have opened, they’ve squeezed lower, as you would expect it looking at the price action which has come before it. But then reversed, and has closed very, very close to its open price. And again that extends itself to being quite bullish, and as you can see you do get a little bit of a bullish move and before we get the bearish kicker and prices actually start reversing to the downside.

Hopefully all of this information can start to come together. This is why not necessarily it’s not always possible for you to make consistent returns on each and every trade. You know, we can see a Bullish Engulfing in here at this level where the prices do push higher ever so briefly before they start rolling over to the downside. Now, we’re also seeing a Bullish Engulfing at these lows. You can do some additional technical analysis at these lows that suggest that there is potentially a Triple Top. you put this together with your charting patterns and your understanding of Japanese candlesticks and you can see that yes, this has the characteristics of a Bullish Engulfing which could give us a nice opportunity to start pushing prices higher off this what is effectively, a Triple Bottom, if you know your charting patterns.

That’s just an overview, just a bit of a session, on just practical application about what we’ve covered over the course of this webinar. To just give you a sort of a brief overview in terms of what we’ve covered – we’ve looked at different forms of displays of price action, we’ve given you an introduction to Japanese candlesticks, we looked at the history of those Japanese candlesticks, we looked at the anatomy all the various different types of candlestick formations, whether they’re bullish, bearish, or neutral. We also sort of built-in the link between candlestick formations and also broader charting patterns. We looked at a few sort of basic tools that you can apply to a MetaTrader 4 platform which can help you and assist you with decision making. We’ve looked at the impact that it can have on risk management in your approach to risk. And we just had a practical application session just then.

So that brings us to the end of this course. We do hope you’ve enjoyed it. We thank you very much for joining us and we do hope to see you next time. From everyone here, bye for now.


Categories
Forex Courses on Demand

Master Risk Management & Conquer The Forex Market


Mastering risk management
What is risk management in Retail Forex?
It doesn’t really matter how well you set up your trade, the bottom line is that you wont know the amount of volume that is trading against you in any particular situation. And so if you have a particular trade set up, which is producing returns on a consistent basis, that’s great news, however, there will always be times when trades will go against you, and this is when you must have a good risk management strategy (RM) in place. Also, if you are trying new trade set ups you especially need to be mindful of your potential losses if your trade does not go to plan. Again, this can only be done by implementing RM.

One of the biggest friend that you will ever have in RM is strong understanding the currency pair that you are trading, or thinking about trading. When you consider taking on a trade you should know whether or not there is a great risk of extreme volatility just about to commence in a particular pair as soon as you have pulled the trigger. Therefore, before you execute a designated Spot (on the spot) or Limit order trade you should be extremely cautious of looming fundamental reasons why the trade might very quickly go against you. For example, it could be that major fundamental, economic, news is just about to be released and where you had no knowledge because you had not researched this properly. Or, it could be that a finance minister pertaining to one of the currencies is just about to give a statement, or press conference regarding monetary policy. This could dramatically move the market against you. There is also a timing issue to factor in to your trade,for example; let’s say that you have a trade set up in mind, but the market is just about to move from one time zone into another (e.g New York to the Asian session). Traders in the new time zone might have a completely different view about the exchange rate on your chosen pair and then decide to move it in a different direction: against you!

But let’s say you have taken all the above, necessary, precautions and you are ready to pull the trigger on your trade. You should have a profit target in mind to exit your trade. But, what you should also have an exit threshold in the event that the trade goes against you and you want to cut your you’re losses. The most simple and effective way to mitigate against this is to use a stop loss order on your trade: a market order to close out your position, or a part of it, at predetermined exchange rate, in the event that the trade moves against you.

To be a successful Forex Trader it is a simple matter of mathematics: you need to win more trades than you lose and those losses should be less than your wins. Therefore you should aim for a minimum of 2 to 1 as a ratio. Example: you should be aiming to win $200 for every $100 loss. This is considered to be a positive risk to reward ratio and will be a minimum requirement for you coupled with more winning trades than losers.

Another area where new traders regularly have shortcomings is that they often take their profit too quickly and let their loosing trades run on too long. this is very often coupled with chasing losses: where traders take extra risks to try and win back losses. This will often come about by ‘doubling up’ and taking on riskier trades without validating set ups. This type of destructive trading can be mitigated against by adopting a trading style which is successful and with the above risk to reward strategy and then trading consistently without deviation.

One other problem which can burst a new trader’s bubble is a lack of understanding when it comes to leverage. By over leveraging your position you will be in danger of getting close outs due to margin calls (more to follow on both). By trading with over extended leverage you run the risk of blowing your account. In fact, over 70% of new Retail Forex trdaers will blow their accounts in the first 6 months of opening. And so learning to gauge how to trade with a reasonable amount of leverage relating to your account balance will allow you to develop a

consistently winning trading style. This is when to consider ramping up your leverage: when you are winning, not when you are losing!
And therefore, the most effective way to adapt a successful RM strategy is to remember that winning consistently at Forex will only ever happen with self discipline and by adopting the above methodology. This, in tandem with an uninterrupted work space, a cool head in stressful situations and some degree of self evaluation with regard to psychological suitability (trading isn’t for everyone) is a must if you are serious about trading successfully in the Forex market.


Categories
Forex Courses on Demand

Mastering Risk Management Part 1 – The Key To Mastering Forex

Hello, and welcome to this latest edition of courses on demand brought to you by forex taught academy. So, in this course, we will be discussing the approach in, and around mastering risk management however, before we begin, and there is, of course, inherent risks in terms of trade in the financial markets. So, please do take a brief moment to familiarise yourself with our disclaimer, if you do need to stop this particular recording, and please feel free to do.

So, and we shall, as a result, we shall continue with explaining what you can expect over the course of this webinar. Okay, so, we’re going to begin with just a fairly brief introduction to risk management we will then look at the principle of conviction trading, and, how that impacts a person’s approach to broadly speaking let’s say to risk management then we’ll have a look at specifically risk-reward ratios, and obviously, how that, and those principles can impact your approach to risk then we will be looking at notional travel size which is one aspect to trade the financial markets which most new, and inexperienced traders have very little understanding of. So, we try to explain that to you at this very introductory level will then look at trading exposure levels we look at risk tolerance, and the importance of accuracy when you’re trading especially with regards to risk is actually something that should be quite important for every trader’s toolkit, and finally we’ll finish with just looking at the psychology behind risk okay. So, let’s start straight away then with a brief introduction to risk management, and let’s start by giving you a basic definition, and risk management is the forecasting of evaluation of financial risks together with the identification of procedures to avoid or minimise the down side-impact. So, this is particularly important. So, risk management as far as a trader is concerned should I say is their ability to do one of three things, and it’s just expanding in a little bit more detail firstly it’s all about a traders ability to firstly assess, and quantify the potential for loss. So, how much of their capital are they putting on the line in order to perhaps get involved in that potential investment or trade. So, that’s the first thing that’s quite important. The second thing is to then actively manage the potential for losses on an ongoing basis. So, it’s not just that from the outset it’s as things evolve, and as things change will there be decisions that will need to be made to regarding to protect your capital, and once you happen to be in that particular form of investment, and then the third thing in terms of what risk management is all about it’s about a trainers ability to mitigate that potential loss. So, if you can get an opportunity where you can take you any potential loss off the table, then obviously from a psychological perspective as well, that’s a very good position to be in. So, those are the three major elements, which is what risk management is all about. It’s about a trader’s ability to assess to manage and to mitigate potential losses. So, consistently in it is a point worth making, and hopefully you’ll take this on board but consistently profitable traders owe their ongoing success to their understanding appreciation, and implementation of a risk management strategy however certainly in our educational experience as well if nothing else it doesn’t particularly figure that highly in the list priorities for all other traders, ie those that are not necessarily consistently profitable. So, there is a common denominator with those that are able to generate consistent returns, and that is because they’ve they’re acutely aware of the importance of risk management either from a protecting their own capital perspective and but also in their ability to generate those consistent returns on an ongoing basis. Now, a stop-loss I’m sure you’re all very aware of what a stop-loss is, but it is effectively a traders metaphorical line in the sand which states for example if a trade pulls back to a certain price then I as a trader no longer want to be in that particular trade. Now, this is a very powerful, and strong risk management approach in something worth taking notice of ok.

So, that was just a brief introduction to risk management. So, what works hand-in-hand is something which it’s very important first a certain number of traders out there, and it’s really the conviction they have for a particular trade. So, talking about conviction trading, and let’s start with a definition, it’s simply a strongly held belief or opinion to achieve the desired outcome. So, conviction trading is built on the principle that each, and every trade has different characteristics, therefore, should not make set should it not make sense to apply a one-size-fits-all approach to each, and every trade. So, that doesn’t necessarily seem to make much sense. So, what you need to do is to find a way to rate the potential for each, and every trade, and almost cherry-pick the trades which you have a strong held belief that you will see, and achieve a certain positive outcome from, and it’s really that’s what conviction trading is all about. So, the key is to look for higher conviction trade setups. Now, an easy way to categorise whether a trade is a higher conviction trade setups is for looking for the specific reasons to get into that trade. The more reasons you can identify to take a particular trade as a result normally, the stronger your conviction will be for that particular trade. So, one important skill to develop when it comes to your approach with regards to conviction without a doubt is actually patience. So, you might be identifying a particular set up it might not be fully formed you may need to be patient, and wait for that setup to realise itself because a lot could happen in between, and try not to preempt you know often trade in financial markets for a lot of technical traders as using a variety of indicators to trade what they see, and often when you get those setups [Music] it’s then about an issue of timing actually, and on occasion you are required to be somewhat patient, and wait for that final confirmation. So, hopefully, that makes a little bit of sense that’s a little bit about conviction trading. Now, moving on to risk-reward ratios. So, there’s two major types of risk-reward ratios, and the first one is a positive risk-reward ratio. So, this is when a trader makes consistently more money on a trade when they win than when they lose. So, let me give you a little example of this. So, if we have a trader who’s making a hundred euro every time they win however, when they take a loss, they realise a fifty euro loss each time they take that loss. Now, this is a trader that’s adopting a positive risk-reward approach. So, the wins are greater than the losses, and this just happens to be a positive two-to-one risk-reward in this particular case. So, this particular trader can lose two trades, and if the third traders of winner he will effectively break even on his on his capital. So, that’s positive risk reward. So, the opposite of positive risk reward is adopting a trading strategy, and approach which is referred to as a negative risk reward ratio. So, this is when you consistently make less on a trade when you win then when you lose. So, let me give you this example once more. So, let’s just say a trader makes 50 euro every time they win on this occasion however when they take a losing trade they actually lose 100 euro every time they lose, and on this situation it’s a it’s a trading approach, and I’m sure there is a lot of traders which adopt this kind of approach but what they’re effectively doing is operating a two-to-one negative risk reward approach. So, that’s worth taking on board. Now, there is a lot of traders that do trade both types of approaches however with a negative risk reward ratio the impact can be, and significantly psychologically quite damaging if that is the type of trading approach you happen to be adopting. So, you can imagine if you take let’s say five back-to-back losing trades which can happen every trader will experience a losing streak. Now, that might become a considerable uphill challenge them to realise the 500 euro loss in this situation, and realise that they will need to get ten back-to-back trades in order to even break winning trades that is in order to even break even on their capital, and that can put quite an onerous psychological negativity I guess to an approach it can it can change perhaps your the way that you’re interacting with the markets you might take on a little bit more risk.

Now, to try and chase those five losing trades, and you’ve only had five losing trades you know that’s not beyond the realms of possibility, and all of a sudden you’ll start changing your approach you’ll start taking on more risk, and that’s when an approach like this you know can become a little bit more dangerous. Now, it is possible to make money from both approaches however please do be careful all high-percentage win rate strategies normally operate a negative risk reward ratio. So, they might suggest, and suggest that you know this particular approach is at 80 or 90, and 95% win rate that’s absolutely fine but as far as risk reward ratios are concerned that very well may be the case but the likelihood is with an approach like that their risk exposure to the downside might be considerably greater than the number of trades that they enter, and the fact that they take out profits a lot more often than not. So, you can make obviously money adopting both approaches, and you just need to be very aware of the pros, and of each type of risk reward ratio if you do. So, okay. So, moving on then to notional trade size or n TS for short, and let me start by giving you a brief definition. So, notion of trade size is the overall position size value of a leveraged trade where in a small amount of invested money can control a much larger position in the markets accurately calculating trade size is an important component of a solid risk management strategy. So, to break this down in a little bit more detail for you, and putting this into fairly simple terms the notional trade size of a trade is is the actual value of size of that trade if you are trading without leverage. So, it’s it’s very common for most retail traders to trade with leverage it allows traders to access markets which they would not ordinarily be able to access. So, leverage can have its benefits but therein lies some of the potential issues as well with access that what we often what some traders experience is because of a lack of education, and understanding about what they’re doing in these markets leverage can become kind of a double-edged sword for some. Now, whatever actual trade size you happen to be trading on a leveraged product you will also be trading a notional trade size as well. So, if you happen to take a 10 min trade in the euro dollar for example then that will also have a notional trade size, and the problem is most traders do not necessarily have a particular understanding about notional trade size they focus on the trade size which they see in front of them, and which they identify with relatively quickly however it is a very useful thing to know just because what you can do when you’re trading you can get you can make sort of errors especially when you start out trading these markets but if you have an understanding of notional trade size, and then you can often identify the perhaps that the side the notional trade size of the trade doesn’t look right it doesn’t it doesn’t fit with your kind of your normal notional trade sizes, and it’s just a very useful aspect for I trader to have a little bit of understanding about. So, it’s very useful to know. So, just to explain it in a little bit more detail, and we just got three markets up on the screen. So, the first one is the example of market is a Forex pair. So, just take for example at the Euro Dollar, and the notion of trade size for a 1 lakh trade or a 1.00 volume on a Metatrader 4 platform is actually a hundred thousand of the base currency, and what this means is when we trade foreign exchange the first three letters the EU are refers to the base currency, and the second three refer to the quote currency. So, when traders actually trade ‪the‬ ‪foreign exchange markets they’re trading‬ one currency against the other, and the base currency is the trade size that they’re looking to trade often the price well it’s it’s for a fact the price that you will be trading euros in is the quoted price on the metatrader4 charts for example. So, you have the base currency, and then you have the currency that the value is quoted in, and that’s referred to as the quote currency.

So, in this example one standard lot size of foreign exchange if you’re trading a euro dollar is a hundred thousand euros. Now, of course that is the notional trade size. Now, because of leverage you’ll be trading a much a small proportion of that capital but that is again the benefit of leverage enabling you to access a trade of that size with much less capital to be able to do. So, hopefully this makes sense, and to just slide it across as you can see you can also trade, and different portions are of 1:1 standard luck, and on a Metatrader 4 platform in this occasion you could also trade ‪1/10‬ of a standard luck which is zero point one zero, and what that transpires from a notional trade perspective is this time instead of 100,000, and a base currency. Now, you’re effectively trading 10,000 euros worth of US dollars, and this is also referred to as mini lots as well. So, you have a standard lot you have mini lots, and you also have micro lots. So, without going into too much detail as far as that’s concerned because we’re just focusing on notional trade size right. Now, if you happen to trade a 0.01 locked raid on a Metatrader 4 platform, and you’re trading a euro dollar what you’re effective from a notional train size is accessing a notional trade size of 1,000 euros worth of base currency. So, if you trade a 0.01 lot of the euro dollar you will effectively be trading 1,000 euros worth of US dollar at whatever particular price you happen to take at that time. So, that’s just a broad overview, and in terms of notion of trade size, and, how that can change depending on the size of the trade in which your you’re trading. So, applying that to different markets for example the footsie, and it does vary for market to market. So, this is this is something that you will learn with experience no doubt but let’s take a foot see trade for example this time. So, this is a global indicee. So, again if we’re trading one standard luck, and will effectively be trading one pound in terms of a notional trade size. So, this is a without the desire to confuse you too much let’s just say for one standard lot size you’ll be trading effectively one pound if you’re trading as zero point one zero valium on a Metatrader 4 platform you’ll effectively be trading 10 pence, and finally if you happen to be trading a 0.01 lot on the footsie market you’ll actually be trading at a notional trade size of 0.01 which is a 1 pence trade. So, taking that across to different markets you can see, how these markets vary quite drastically depending on what market it is you happen to be trading a 1 lakh trade in the gold market, and would transpire as a 1.00 volume on a Metatrader 4 platform the notion of trade size is effectively 100 ounces of gold in this particular example moving along the zero point zero sorry zero point one zero volume on a Metatrader 4 platform would give you a notional trade size of 10 ounces of gold, and finally one micro lot or 0.01 volume on a Metatrader 4 platform if you’re trading gold would mean that you are effectively trading one ounce of gold. So, hopefully that makes sense that just gives you a sample of a different market in a few different asset classes. So, I hope that does make some sense ok. So, just um just to reiterate just having an understanding of notion of trade size is just a very useful tool from a knowledge, and understanding perspective when a trade is trading these markets ok. So, moving on then to trading exposure levels, and these are very important for traders because an individual exposure level is the amount of capital you are risking in each individual trade. So, for example if we happen to be trading a 2% trade of a 10,000 US dollar trading account what you are effectively doing is exposing approximately $200 of your trading account. So, it’s quite a straightforward calculation. Now, where things become a little bit more difficult is with regards to overall exposure levels so. Now, this is the total amount of capital you are risking in all open trades combined at any one time.

So, let me give you a good example let’s say we happen to be trading six open trades, and we happen to be risking approximately 3% per trade. So, what that means, and if all of those six trades are open at the same time, and you’re still exposed to that amount of risk what it means is you’re you’re effectively risking eighteen hundred US dollars of your 10,000 account balance is the amount of your capital which is exposed not taken into account any any particular issues with regards to to slippage or anything of that nature which means that your exposure could actually be potentially more than the one thousand eight hundred US dollar, and currently on screen but what it does is it gives you a bit of a better understanding that for all intents, and purposes if all those trades move against you you’re actually exposing about 20 percent of your trading account. Now, the problem is this is not really what retail traders pay that much attention to or they certainly don’t pay enough attention to this. So, then they think of each individual trade individually but in actual fact if you are exposing capital in all of those trades then the overall exposure is something that should be a consideration. So, this is what retail traders do not pay enough attention to they stay disciplined on the individual trade size often ignoring what their overall exposure to the market is if all trades go against them, and it’s that ignorance are perhaps ignoring the overall exposure is why a lot of traders can really come unstuck. So, it definitely worth giving some thought to. So, moving on then to risk tolerance. So,, how much should a trader risk per trade is often a question especially for those that are starting out, and trading the financial markets, and unfortunately the answer is that it depends on the traders risk profile. So, what we mean by this is let’s just take a little chart just in the middle of your screen there where what we’ll have going down the y-axis is a traders approach to risk, and perhaps along the x-axis along the bottom we might have a traders approach to return, and of course with each aspect whether it’s risk will have those traders that am within their personality in there their genetics they’ll have a higher profile to risk or perhaps be a little bit more risk-averse the same with regards to return there is all types of traders out there some have a very low expectation when it comes to return, and some have a very high expectation when it comes to return, and this is why this question is a very difficult one to answer because it depends on the traders risk profile, and of course that is a very individual decision to make but what you can see currently from what’s up on screen is that you will experience a significant move whether you are someone that wants okay. So, moving on to risk tolerance. Now, and a question that is very common is, how much should a trader risk per trade the answer unfortunately is that it depends on the traders risk profile. So, let me share this graph with you. So, let’s start with the y axis on the left hand side there which is the traders approach to risk, and along the x axis let’s look at a traders approach to return, and the problem you have with each, and each individual traders they’ll have a very different risk profile from a low sort of more risk-averse approach to taking risks with their capital to those people that are quite happy to take higher risks when they trade, and the same as with regards to return. So, they’ll have some people will have a lower expectation of return, and some people of course will have a much higher expectation return, and the problem is that will change over time depending on your approach to risk, and, how much return you want in exchange for that risk, and what you generally find is those that are quite happy to risk less are quite in general happy to see a lower return whereas those that will take higher risk when they trade to financial markets are therefore looking, and interested in seeing, and achieving a much higher return for their time, and their effort, and a capital that they’re putting on the line. So, just as a brief sort of bit of information for you for those of you that are new, and inexperienced traders it’s always advisable to start with a low risk low return approach to gain the experience necessary before taking on more risk. So, hopefully that’s a common-sense approach. So, do bear that in mind, and really the reason why this question is. So, difficult to answer is because it depends on a traders risk profile depends where you place yourself with regards to your approach from risk to return. So, wherever on that scale you might be placed is really the answer to that question, how much should a trader risk per trade it’s a very individual decision to make depending on your on your risk to reward profile okay. So, moving on then to just to accuracy risk management strategies should be based on accuracy in our opinion knowing exact entry, and exit prices, and the size of the trade you wish to take, and, how many pips are capital you happen to be exposing in a trade is all very important. Now, a common problem for retail traders there’s a couple of them lack of it, and to give you a practical example trading a higher risk percentage per trade, and then intended is it is an issue that a certain cohort of traders will experience because they decide to ignore the principles of accuracy. So, for example they happen to be trading a 1000 euro account in this example they intended to risk just 20 euro at a 2% of their capital but in reality, and they’ll realise this when they when they look at their journal order P&L; in reality they were effectively risking 30 euro per trade actually at a much higher percentage, and it’s because they were perhaps very lacks or very careless about the size of the trade in which they were taking, and perhaps they didn’t consider the stop-loss placement to well whatever the case may be because they weren’t particularly accurate in their approach they decided to take a series of decisions, and then ultimately realise that they’ve actually been overtraining they’ve been trading at higher sizes than they actually intended on.

So, again it’s a very common problem for retail traders, and another common problem is trading on this occasion a lower percentage per trade than intended. So, for example this time we’ve still got the trader with a thousand-euro account, and they intended to risk 20 euro per trade which again is the 2% of their trading account but in actual fact they were under trading in this example, and they were actually seeing losses of approximately 10 euro let’s say, and in reality they were actually trading at 1% when they actually intended to trade a higher percentage than that. So, it can it can work both ways. So, it is important to try to maintain a certain degree of accuracy when your trade always trade at a predetermined risk percentage perhaps when you trade, and try to be accurate, and disciplined it in everything you do, and that is just a generic overview and. So, just to finish off then with the psychology of risk. So, it’s fairly common there’s three key reasons why new traders do have difficulties, and this is very much anecdotal but they it’s quite important at the same time, and the first one is they don’t have a trading strategy, and I mean that I mean that in the kindest possible sense because the trading strategies should help you be able to determine what trays you should select where you should enter those markets weigh should exit those markets, and of course give you some assistance with regards to timing how, and why you should get into those trades at those particular moments, and if a trader can’t answer all of those questions, and then what they’re actually doing is guess thing with every decision they make, and there are lies some of the difficulties that trader coming can encounter the second one. Now, is that they don’t really have firstly an understanding of risk management but they definitely don’t have a strategy which they’re looking to implement to any great extent, and of course that’s what this whole particular webinar is all about. So, no risk management strategy is a major issue, and something that new traders have significant difficulties with, and then the third, and final point is that are not mentally prepared to trade volatile markets maybe they don’t understand, how volatile some of these major global liquid markets are, and but they get into the markets they may be trade at much smaller timeframes, and they’re finding those markets very volatile you know big swings very difficult to understand what’s happening, and, how to navigate those markets, and what all of these things will elicit in traders from a psychological perspective is a whole range of emotions for example fear, and greed will also have guilt in there perhaps you’ve you’ve taken a much bigger trade sighs than perhaps you anticipated maybe because you have elements of greed as well, and you thought this is a, and no a no brainer trade for example when you thought you can clean up on this particular trade, and maybe didn’t go quite well for you, and then you’re suffering with that level of guilt which might impact some future decisions that you’d be looking to make, and same with elation those that go through a winnings free can be absolutely delight with themselves they might let whatever got them that success they might let that drop ego starts to play a particularly important role especially with a certain core of trader, and that can have its own concerns confidence of course your confidence can be affected positively, and obviously negatively anxiety you know lynx works hand-in-hand with fear, and anxiety, and just your general mood whether it’s sad or happy. So, these are all the impacts that these particular three reasons why traders have difficulties, and and this all of these aspects linked to the psychology of risk. So, it’s just important that you try to I guess I guess embrace the major reasons why new traders do have difficulties, and look to start to address them as best you possibly can. So, just to finish then there are a number of things that a trader can absolutely do to reduce the impact that negative psychology can have on you when you happen to be trading these markets, and the first thing is try to remain objective. So, and what we mean by that is subjectivity can be a little bit on the dangerous side. So, if you have a method to remain as objective as you can that will definitely benefit you take into account market conditions, and your conviction of the trade setup. So, if you have an understanding of whether the market is range-bound whether we are bouncing from highs to lows whether the price action is quite choppy at this moment in time then that should begin to prepare yourself for a potentially continuation of that, and prepare yourself mentally as well for those types of conditions, and of course the conviction of the trade setup itself is quite important.

So, if you are able to stack a lot of reasons why you should be getting into that trade in favour of that trade you’ll feel a little bit more positive about it if you are getting into a trade with very little conviction or a low conviction status for that trade then you know your psychology won’t necessarily be that great because you shouldn’t really have major expectations of a successful outcome in those in that situation try to be accurate as we’ve discussed, and be precise with things like your entry levels, and your stop-loss placements, and things like that because again that is something that a lot of successful traders have in common they know exactly what their approach is regarding their ability to enter those markets but also their ability to protect their capital as well. So, do have an understanding as well of as we’ve discussed individual, and overall trade exposure levels that will assist you with having the more control you have over your exposure the more comfortable you’ll feel about the decisions you’re making, and it’s all about knowledge, and understanding about what you’re doing, and, how you’re conducting yourself. Now, losses are inevitable with every trading strategy is important to know that. Now, it’s it can be fairly a bit of a no-brainer to just try to control them if you possibly can try, and mitigate them wherever possible obviously that’s not always possible, and but in terms of an approach to losses you know if you can accept that they’re an inevitable part of everyone’s trading approach then that should make it a little bit psychologically easier for you strategically wait for the markets to come to you if you possibly can, and never force trades you know never have live with that anxiety, and stress, and fear of needing to get into that trade just in case you miss it because that that’s not really a good position to be in certainly from a psychological perspective whereas if you have a nice calm, and considered approach where whatever you do you wait for the markets to come to you before you make that decision, and then you put yourself psychologically in it in a much better position, and finally try to work within a risk/reward framework. So, that’s whether your approach is a low risk low return or it might be a medium risk medium return approach whatever the case may be have a basic understanding about what you’re looking to achieve, and if you can achieve, and what you set out then you’re doing very well in this environment, and that’ll really be worthwhile continuing to practice that okay. So, that’s just touching upon the psychology of risk. So, what we’ve covered in this webinar is an introduction to risk management we’ve looked at conviction training risk reward ratios notion of trade size trading exposure levels risk tolerance accuracy psychology also of risk. So, all that’s left me to do is to thank you very much for joining us on this latest instalment of course on-demand which have been brought to you by Forex Academy we hope you benefit from it, and we look forward to seeing you soon bye for now.

Categories
Forex Courses on Demand

Chart Patterns – Analyse the Market Like A Pro

Hello, and welcome to the latest installment on-demand course, brought to you by Forex.Academy. In this particular course, we will be unveiling the mysteries behind technical charting patterns and outlining how their use can supplement the trading decisions of the most technical trader. Before we begin, please take a moment to read through the disclaimer and note there is financial risk involved in trading the financial markets. The outline of this course will aid to develop the technical skills needed to assess charting patterns, whilst combining both theory and practice for a deeper understanding of how to apply these skills in the marketplace. Throughout this course, we’ll be first and foremost looking at the origins of technical charting, and deciphering where exactly those price depictions came from. We will be answering the question as to why technical charting is so important for us as technical traders, then we’ll delve into both candlestick formations and technical charting patterns, before moving on to technical recognition.

So, where do we actually look for these candlestick formations or these technical charting patterns in the markets? What do they actually tell us? Do they tell us a story about where the market is moving in this short, medium, or long term? This brings us all nicely to market phases, looking at those price movements both in the short, medium, and long term and trying to build an idea of actual trade identification. Where is the market more likely to move to as a result of these technical charting patterns? We will obviously be looking at practical application, looking in-depth at the MT4 trading platform, and finishing off the course, we will be looking into the MT4 platform with some practical application, looking at both the charting patterns and using some technical identification to look for these very promising trade opportunities within the markets.

First and foremost, let’s have a look at the origins of technical charting. Where did it all arise from? The earliest sign of the Japanese candlestick, we can look back to the 18th century, between rice traders in Japan. Inevitably, we can say that this led to a ‘grassroots’ commodity market in the product, in the commodity rice itself. This meant that prices were actually dictated in a form structure of a candlestick that was actually built from the rice itself. We can just look at a quick picture here, of one, two, maybe six or seven grains of rice actually depict the early candlestick that takes the very form and shape of our candlesticks on our MT4 platform trading the markets online today.

Moving on from that early origin, we see communication and international trade really begin to develop throughout the 19th century. A price quotation was transformed to tailor for a universal appetite. What do we mean when we say to tailor for a universal appetite? Given the increase in interest in financial trading and financial markets and how disposable income, or investment income changed, where the ordinary investor could look at a daily newspaper, look at a price quotation and look to invest, or to speculate in the financial markets. We’ve seen the birth of, over the 1920s and 1930s, trading via price quotation in daily newspapers, something that was done each and every day. The ordinary investor could look at those newspapers, trying to get a technical idea of where the markets are in their own head, but obviously, as time moves on, that was quickly outdated by the birth of telegraphy. If you’re aware of the Telegraph machine, that formulated on to the ‘ticker tape,’ where traders can look at printing of ticker tape for instant price action on the commodity or asset they’re looking to trade.

Even though it was more primitive, those early thoughts of trend analysis were developed between both investors and commodity traders. These were known as the ‘ticker’ traders. Looking at a roll of paper, they could see prices gradually tick-tick-tick, gradually perhaps increase, which really revolutionized and coined the phrase ‘Don’t fight the tape.’ So, don’t fight the trend. Really, today we say as technical analysts that the trend is our friend. Very similar in terms of technical charting and trying to define an origin of price movement.

If you have read any financial literature, or would like to read some financial literature on trading, I would very much recommend Reminiscences of a Stock Operator, by Edwin LeFevre, which tells the story of some stock traders and commodity traders in the 1920s and 30s. Big bullish traders would take huge positions in the marketplaces by merely reading the tape. Such a fantastic read, and it shows you the development of price charting and technical charting through tick trading.

We have obviously seen the rise of computer technology. Everything is traded online at the moment, but with the rise of the machines, I suppose that’s really led to the recording of price history from the 1970s and 1980s onwards. What that did, is it actually changed how traders discover and dictate prices. Obviously, if we are students with technical analysis, we know that how we judge many of our decisions is by looking at previous price history that can give us an idea, or an inclination, as to where future prices may move to. The fact that we look at recorded price history over time has really changed the origin on the movement in time, from more technical charting specifically, from a primitive Japanese candlestick.

Why is technical charting so important to us? Well, given the huge liquidity in today’s market, and what I mean by that, is that there is a large amount of market participation between small traders, big banks, and international organizations. A huge amount of participation, a huge amount of liquidity in the markets today, allows us to assume the technical charting is the most efficient method of assessing prices. Why would that be? Why could we look at a technical chart today, at a specific price in time, and say that price is efficient? Well, because we take for granted now that all information available to the markets is embodied in the price of a Japanese candlestick at the moment. Otherwise, all unavailable prices that were traded on would be insider trading. We assess that the markets have been totally efficient, given all circumstances are embodied in the price. That leads us on to assume that market participants, ourselves as traders, are, as a result, efficient in trading practice.

Price discovery nowadays is completely Universal in factors that change it. To take, for example, historical price action, a trading volume on technical indication. These technical attributes to the trader have just as much an effect on price change and traditional fundamentals. So, if we take a commodity, perhaps like the oil market, there is the supply and demand function to that market that certainly drastically changed its prices, but we know that oil is quite technical with many support levels and trading volume. The historical price action of things like this provides a technical indication, so that a large minority of traders decide to particularly only trade-off that price, and therefore create price change as a result. So, it is technically very important for the technical trader.

As we move forward to candlestick formation and technical charting, a quick prelude to really understand the Japanese candlestick itself, not just as one particular candlestick, but how we chose the common state range as traders. In our study of financial markets as technical traders, we must understand that each Japanese candlestick tells us a story. The story can be either timid in nature, or could be an epic battle of price between buyers and sellers. Yes, in candlestick observation, we are often provided with a clue to a decision on future price discovery. So, in each and every different candlestick, we see a story, a battle between buyers and sellers. It could be a very large trading day, or it could be quite a timid, small trading day, but there is a story to be told. Is that enough information to base trading decisions off? Not quite sure. However, there is much more information to analyze in technical charting patterns than simply looking at the individual candles. Accepting this will allow us to become price action specialists. That’s really what we’re trying to do here as technical traders, become price action specialists, by both looking at technical indication, looking at candlestick formations, and looking at technical charting patterns to give us some insight into market structure and future price movement. Again, in assessing the formation of the Japanese candlestick, we must identify exactly how important the price action is, first of all, but that there is a story to be told, and what that story is exactly trying to tell us.

Let’s have a look at a few examples here to decipher and see if we can figure out a story in terms of price action for each candlestick formation. For our first confirmation, we have a bearish engulfing continuation. Again, I posed the question, what story does the bearish engulfing continuation structure tell? Let’s observe the market trade for just a moment. In the previous view we just witnessed the market trading from left to right over a period of five trading periods, let’s say five days, and we’re starting from one and finishing with an engulfing bearish candle. What story does that tell us if we actually look from left to right? After a small sell-off at one, the market actually took three trading candlesticks to retrace its prices and return to previous levels on two. So, we could say that we actually had a bit of weakness after period one, but the market really had to work hard to retrace that weakness, and actually took three full trading periods to retrace price back up to previous levels before the sell-off. What is massively significant is the final candlestick. Again, given that we’ve seen some limited strength in the previous three days, it seemed to be very hard work for the Bulls to push the market back up. We see all of that effort totally and utterly erased in the final candlestick of trading. That final candlestick actually completely outweighs the first sell-off account. That’s structurally significant for us, and it tells us a story. The market was weak, it really worked hard to try and retrace the weakness, and then the Bears came in, and weakness prevailed. This is a strong signal that this market is weak.

Moving on to our second candlestick formation structure. We call this a lead-up to rejection. What story does the lead-up to rejection structure tell? Let’s observe the candlesticks trade. Looking at the previous price section, we see some early relative weakness and then a reversal at one. With the final two candlesticks finishing bullish, we can see the final structure creates a V in the market. Particularly, each candle is significantly important. In reverse, we see some early weakness. We see at level one, a hammer candlestick, and the close of the hammer candlestick at one is just above this level of support created by the early structure from the previous candlestick. The fact that it closes above that level tells us that it is a strong hammer, a bullish hammer. And that candlestick alone, the story is telling us that there could be a possible reversal. However, as we follow the price continuation to the upside with two, we see that the market opened and actually traded down within the trading period a little below the resistance level, was rejected instantly, and finished on a high for the day. That tells us that we have much more confirmation, that we have seen the lead up to rejection confirmed, and that expectations are certainly for prices to increase, which we see with the final comments, like a continuation to the upside. So, the structural support is very significant at the V structure. The price section tells us that the market is rejecting a potential sell-off and is potentially very strong.

In observing our third candlestick formation, we can look at what we know as the Three Bullish Soldiers. Again, we can pose the question, what story does the Three Bullish Soldiers structure tell? We see that the market has experienced a downtrend, and by looking and observing the price action trade, the bullish candlesticks almost signify a rejection of the low. Again, the question, what structure has been created, and what story is it telling us about the market equation? Well, after a long mature downtrend, bulls are technical investors, very frequently looking for clues for a change in sentiment. You do get that specifically, as sentimental traders look for value. If a market is particularly stock trading, if it is a strong asset, but has experienced a period of weakness. Or a foreign exchange, which is relatively strong over a long period but has seen a short-term downtrend. Investors often look for periods to get long that market, or to buy the market, and the Three Bullish Soldiers do provide this sign. Three consecutive trading periods of bullish activity, with the market closing with three consecutive new highs at one, two, and three. That indicates to us that the market has possibly shifted and is now potentially stronger.

Now, as we look to candlestick formations and technical charting, combining them both together, we must assess the short-term story of the market in question. We can then build with technical analysis, in aiming to identify technical charting patterns. The first of our technical charting patterns is the Head and Shoulders, on the reverse Inverted Head and Shoulder pattern. Let’s observe how the market trades. With the Head and Shoulders, the market is trading from the upside, trading in a bullish trend, and we see some resistance on a continuation for a further boost of the trend to the upside. We then see our first Shoulder created, and as the market reverses, we see a higher high creating the head of the market. We then see a level created in the market, where the market bounces, creating our second Shoulder and trading to the downside. This is technically very significant, as we see price expectation then results to the downside, given we almost see this man here presenting our Head and Shoulders in the market. So, there is a real rejection to the upside, given that we are feeling to reach higher highs. A rejection to the second Shoulder confirms us on the market breaks, or resistance to continue to the downside. The same technical setup is in the Inverted Head and Shoulders. Only it is to the upside, where the market creates a low, then a further low rejects the low, where the points of resistance price expectation breaks the resistance to continue to the upside.

As we move on to Double Top on Double bottom technical charting patterns, we can see they are very similar, but instead contrast two directions with the market. With the Double Top, the market trades from below and rejects a new high. That creates a structure, both to the open downside, with a further rejection to the downside, and creates some price consolidation within this period. We then get a further rejection to the upside on a bunch from that level trading down and breaching through its earlier level of support. The market expectation is for the market to trade. Continue to the downside. We can see clearly that the Double Top has been created almost in this fashion, and the market reverses from the Double Top peak. Again, the Double Bottom is very similar and will take the W shape where parallel resistance has been created on both sides of the consolidation. Where the market breaks to the upside, we do get price expectation in preferring a break to the upside potential. When observing these Double Top and Double Bottom situations in the markets, the main question we would ask ourselves is, how does it affect the trend in the medium or long term? Is it just going to be a short burst or price consolidation breakdown, or is it going to delve into something deeper? It very much depends on how the market is trading, and the higher the breakout stems from the break from Double Top or Double Bottom. Within this same Double Top, we can use this example to the right here, where the market trades in an almost unassured bullish fashion before creating our Double Top. We see it’s well defined. The market breaks to the downside, and at that time, sentiment shifts to a bearish activity. So, the trade there would certainly be to look for places or areas to short the market, given the Double Top rejection.

Similar to the Double Top on Double Bottom, we have a Triple Top and Triple Bottom. The only difference being that you often see stronger areas of price consolidation creating three tops or three bottoms, and as a result, we do see significant breakout opportunity as a result from the lack of continuation in the price consolidation. That would be a general rule of thumb as a technical trader, the more price consolidation you see in the market, and for a longer period of time, the greater expectancy you can have of a stronger breakout in the opposite direction. Or, when the final market structure breaks down, we can often see very strong shifts. So, generally speaking, if we are looking at these two previous price technical charting patterns with the Double Top on Triple Top, for example, we would see a stronger burst to the downside in the Triple Top than we would see in the Double Top and vice-versa. With the Triple Bottom on the Double Bottom, we would see a larger increase in bullish activity, with the break to the upside with the Triple Bottom on the Double Bottom.

In looking for price structures in the markets, very prominent price structures tend to be particularly in the Forex markets, the technical charting pattern of the Ascending and Descending Triangles. That’s indicative of the volatility that are in the Forex markets. As we look at the Ascending Descending Triangles, we can see that there is a level of price consolidation, a squeeze in the markets, creating this Triangle structure, and the Triangle structure is to the upside, as seen as such. We then get the market break creating an expected surge of volume and once the market structure fails, or breaks down to the upside. With the Descending Triangle, it’s no different. Only that price does create consolidation in the same zig-zag fashion. Finally, when we get confirmed triangle formation, we see a breakout to the downside, given that price consolidation is squeezing more prevalently to the downside.

Moving on to our Wedge Continuation and Wedge Reversal, we see these two Wedge formations are very acute in the markets they form with price consolidation. It can give us very close hints to where price is likely to break from in very short periods of time. The reason being particularly, if we look at the Wedge Continuation to the left here, the market trades down with a period of consolidation within this Wedge, fashioned actually looks to consolidate up to the upside a little, before actually breaking down to the downside. That would be quite significant, as traders expect the market consolidation pushing to the upside. Alternatively, the break to the downside would cause that greater burst, if you will, in rejection to the downside with the continuation. The reversal is slightly different, where we see the wedge to the downside. You see trade income from the Bear is down, creating the price structure through the right-hand side and then, instead of breaking down through with a continuation of the trend, actually reversing the overall trend on trading and pointing to the upside.

Let’s look here at our Bull Flags and Bear Flags. Again, quite prominent in the Forex markets. Taking a similar structure to Wedge Formations, the Bull Flag trades up with the direction or preferred bullish trend. It does create a price consolidation that almost looks like a Wedge to the downside. The only difference is that it creates this very well-defined Flag and actually trades to the upside and with the continuation. The Bear Flag would be in the opposite direction, where it trades to the downside. We see the market trade creating a Wedge structure, and then we get continuation to the downside in the direction of the trend, unfulfilling our Bear Flag structure.

Perhaps one of the most common uses of technical analysis lends itself to identifying channels within the market. Certainly, one of the most common practical technical charting patterns that you can identify is simply done by the use of two diagonal lines, either to the upside or downside, confirming or disconfirming bullish trend channels or bearish trend channels. As we follow the price action, we can see that it doesn’t always have to correspond to both highs and lows of the channel itself. As long as it conforms to trading within the channel trend line, we can say that is a confirmed channel that we can trade with the direction of that trend, given we can find trading opportunities within. Here we have a bullish channel, which is well confirmed, given the sheer amount of trading range that we have in the channel. The question I suppose that would pose would be whether to actually buy the market at this price, given that it is traded down to our trend line. We’ve seen the price punch from it before, and in terms of following the trend, that could certainly be a good method of trade identification in terms of following the trend for this market.

As technical analysts, it’s very important that we learn to combine what we learn and actually implement in the markets together. Just like observing one particular candlestick at a time, as opposed to looking at a larger, broader range of candlesticks. We look for more information within our technical analysis within price charting, or technical charting, and within our candlestick formations. Here, we’re going to ask the question, how can we apply technical analysis on charting patterns?

What I’m going to do is actually use my epic pen highlighter to try and identify some of the price patterns, some of the technical chartings, and some of the candlesticks that are very unique to us in actually trying to identify how to trade the market. Towards the bottom of the candlestick chart here, we’re looking at the EURUSD. We can identify this column here, this Doji comes to here, which tells us that the market is certainly unsure that we’ll see any explosive trading to the upside. It does quickly reject it with the bearish candle afterwards, and we get some price consolidation after, to show us that we have real indecision. In terms of an overall trend, what we’re looking for is perhaps an explosive move, or a bit of trading volume to give us that signal, and we certainly see it with this large candlestick here. We see this is a bullish engulfing candle, and we see the market shoot a trend to the upside from there. That starts to form this channel to the upside. Over a long price period here, we see this channel, and we know that it’s the bullish trend starting to form. We’re looking for opportunities to buy this market and unfollow the trend. We do see a level of support and resistance here, just creating a little floor in the market. We’re unsure. So again, we need a sign of where exactly to enter to relook to follow the trend. We’ve seen rejections from these levels at one, two, three, four, five, six, several points there, and we’re looking for a confirmed break to let us know that we’re still in this trend and that the trend may continue to the upside. We do get the movement with another bullish engulfing, that confirms to us that there’s a potential movement to the upside. However, again, with the Doji candlesticks here, we can see that this is short-lived. The bullish activity is short-lived, and perhaps we are creating a bit of resistance to the upside here, and we should, should the market not want to continue. Overall, if you can see, this doji sends the trend down. There’s a real rejection from these highs, back down to our already resistance level here. As you can see, I’m going to use a different color pen. We have exactly what we’ve been looking for. We have our Head & Shoulders here, there’s our first Shoulder, then we go up to our Head and then we’re starting to form down to this new Shoulder here. So where is the market more likely to move to at this instance here? We’re simply looking for a sign. We get the same with our bearish engulfing candle here. A huge candle, which does signify that we have a rejection of these highs and that the previous uptrend is short-lived. We’re expecting the price to actually resolve itself to the downside here. We do get more of a price structure here with these Doji candles, outlining the fact that the market has some uncertainty, and we follow this price consolidation here within this period. Again, we look, and we have a further break to the upside, with another engulfing candle wiping out the price action of the consolidation in its entirety and moving towards the upside again.

If we were to delete those illustrations and actually look and pinpoint some of the most unique candlestick structures, actually recognizing our technical analysis with charting patterns, we can find that we were assessing some of the main features within this pricing chart here. So, we have a bullish engulfing to the left, and many hammers there dictating the rejection of price to the downside. An Inverted Hammer, Double Inverted Hammer, they’re creating our Head and Shoulders early and rejecting price to the upside dojis as well, to describe some uncertainty in the market, and then we get some bullish engulfing candlesticks, which further continued the trend to the upside. As technical analysts, we know that markets do not trade in a linear fashion. Very rarely do we see something trade in a linear fashion to the up or downside. Perhaps, we could look at Bitcoin over the last three months before Christmas, trading in a very linear fashion, but these situations do not come about very often. So, we do need to use our technical analysis in terms of spotting good identification trades, in terms of following trades and finding those areas of price consolidation and breaks. Even with clear, well-defined trends, the markets will pull back on experienced short-term reversals. Trends are often interrupted by periods of consolidations, and of course, we are never 100% sure that a technical pullback will only be a short-term reversal. That is very true. We never over commit in a trade because we’re never sure that the market, even though a small term pullback and with the most well-defined trend or channel or technical price charting setup, we’re never 100% sure that it may only be a short-term reversal.

Let’s look at these market phases in more detail. What are market phases visible here in the gold market? What I’m going to do is just highlight some possible phases that are very visible in the gold market, so that we can notify before we delve into the practical application side of the course, where these market phases are in the marketplace and how they would affect our trading. First and foremost, we have bullish and bearish phases. We can see quite clearly where the bullish phases are. We have many large trends to the upside with these bullish phases. Some very significant ones showing us that there’s significant price change and that within these periods, we should be bulls, as opposed to bears. To the downside, again in the gold market, it does not trade in linear. Perhaps the most significant market phase that we can see in this gold market is the appearance of a well-established trend from low to high here. This is over a long-dated period, and you can see it is the most well-established trend in the whole price action chart of the gold market. Now, the fact that it breaks this resistant level here tells us that there is an opportunity in actually continuing the trade here. From this engulfing candle here, this portion is engulfing, and in terms of the overall trend, it is the longest trend here. We also have a very well-established trend here to the upside that provides us with a very extensive bullish channel that would provide us with certainly a fantastic opportunity. We know that this is a well-defined market phase before reversing from these highs and trading back down with a small bullish reversal channel. When considering to enter the financial markets, particularly with this gold market in front of us, we can see that there are numerous amounts of different market phases. In understanding which market phase is actually currently trading, that will allow us to enter the market based on our technical analysis, hopefully on a much better price.

As we look towards charting and pattern identifications on technical indicators, we know that there are many technical indicators available to retail traders to assist them with proper identification of charting patterns. Let’s use our knowledge of candlestick formation, price charting, and technical indication to identify some existing charting patterns in the markets. I will move on towards our MT4 trading platform to assess the markets, look for charting patterns in duplication and technical indicators in real-time. The first tool we’re going to look at is the Fibonacci retracement level. It’s a very useful tool, and it works very well for some particular asset classes. Gold would be one certainly, and oil would be another. The foreign exchange markets would, of course, conform to a lot of Fibonacci retracement levels, given the technical side to the foreign exchange markets.

How do we actually use Fibonacci retracement levels, and what are they? Basically, they work off a series of numbers, based on the Fibonacci sequence. Those numbers give a percentage from high to low in terms of their actual use. What traders look for in the markets, is a period of trading, to assess a high low and to depict trading levels within a certain range. So, we’ll use a few here to assess the markets as they were from the 12th of December to a period up to this new high. We will place our Fibonacci retracement level from low to high at this current time. Our Fibonacci retracement level, which allows us to make trades as such, given that we know of the market’s volatility, that they’ll trade up and down in a zigzag or nonlinear fashion, and we can make trading opportunities based on these. So, as we place our Fibonacci from low to high here, we’ll look for areas of retracement to either trade between the levels, or look for breakout opportunities from those levels. We can see that it already has conformed here and has traded up to this new high, but this is our level from high to low, so what we would be expecting is for something significant to happen around these areas here to our levels.

One very important note to make with Fibonacci retracements is that they do not work all the time. Just like any other technical indicator looking for price patterns, they are never 100% reliable. However, they are quite popular commonplace in terms of the retail trading environment. Also, institutional traders will often use them for their analysis over the long term, given that many traders are observing these levels.

In doing some analysis from this Double-M from high to low 12th of December to roughly the middle of April, we can see that we have made a high, and we’re looking to trade around these levels. We can see that the market did pull back significantly here, and we get an exact bounce from our zero percent back to our main level of resistance from the Fibonacci level, up towards new highs. We have placed our Fibonacci retracement from low to our new high, and are expecting to make trades from these retracement levels. We know our highs here, and we are observing all of the retracement levels. If the market trends to the downside, we are either looking to break through them, or we’re looking for serious support levels to buy the market, or levels of support to make those trades from.

One thing to really consider is that this is one form of technical indication to look at price patterns. It is not 100% reliable, nor does it work all the time across asset classes. Because of its use and its significance and acceptance in retail, both retail and professional trading world traders across the world are quite frequently looking and observing these levels. It almost becomes a self-fulfilling prophecy that the markets bounce or retrace from such levels.

Just looking at these levels, we can see that there are several retracements, one from its new high, created from the bounce from a linear downward trend reversal. We get the trend trading down as well, some price confusion around this area, we get a break in here, and then back up to the upside, continuing to bounce from that level to get some real trend continuation to the downside. Again, almost directly at our 50% retracement level, we get a continued break on the trend bounce reversal to the upside, and it lasts for quite a well-structured trend up to new highs here. Looking at some broader price action, we can see that the market does reverse off this and retracement level again several times, as it almost creates a price structure here, reverting down to new lows. It does so here as well, where we get some price consolidation in an Ascending Triangle, but rejected from the Fibonacci, and straight down to new lows again. Given the markets have continued their trading since this last Fibonacci retracement level has been implemented, traders will often update their new Fibonacci retracement level to reflect the latest price action. That’s exactly what we’ll do here, and we’ll see if it conforms to the rules and regulations that traders are trying to optimize when using Fibonacci retracement levels. We’ll move to look to implement a new Fibonacci retracement level, perhaps off a new high to low, and look for possible trading opportunities within.

This time we’ll go high to low from more relative price action and see if it corresponds or provides us with some support levels that we can make trades off, and look for price charting action. If we were to zoom in on this price action here, we can see that it certainly conforms, in an essence, to many of the same levels that were presented before. In looking at the high of this Fibonacci retracement, we will annotate this high from high to low and look at our several retracement levels. Straightaway, I can notice and point out that we have the same level as before previously. We see at the 50% on a retracement level, the market certainly retraces and does not want to pierce, or break up with some continuation of a bullish trend to the upside. We get continuation again to the downside from our 50% retrace level. Here as well, at the 23.6 retracement level, we have extensive support and resistance given to us at this level here. We can see the period of consolidation trades between these levels for a consolidated period of time before breaking to the downside. Our resistance level bounces straight off the low, and then a very strong strand breaks up through the continuation with our channel to the upside. Again, as we get the strong break, the bullish behavior takes the market through our 63.8 level. We do get some consolidation here, but again it’s actually the retracement level itself that provides some support over several periods and keeps the retracement within our support levels of 100% and 61.8%. We have price consolidation between these periods, and the market seems to be conforming to our Fibonacci retracement levels.

Moving on to our euro dollar Head & Shoulders Double Top, it’s very well defined indeed. This is one that we outlined throughout this slide show presentation, but I wanted to outline it again. We have some very good sell ups here within the eurodollar, a currency pair, and you can see how it conforms quite well to the sell ups indeed. Looking across the eurodollar, we see a strong bullish trend to the upside. We do see prices conform to our first Shoulder, then our Head as the Doji candles reject the highest not one, not two, not three, but four times. We get price continuation with a little uncertainty, creating our second Shoulder, and then we finally get the burst to the downside. It is short-lived, however, and we do get continuation in with the trend overall to the upside. There are plenty of trading decisions to be made given this resistance level here. It’s well defined through our Head & Shoulders price charting, and when we get this engulfing combo, it is quite a strong signal that there will be a continued movement to the downside. Again, we can reassess the market at this period here with the price consolidation breaking. We do get the retracement on this candle here, which is quite significant, this bullish engulfing candle, to let us know that it actually has rejected the Head & Shoulders pricing chart. That’s quite significant to know as well, that yes we have used our analysis to look at the Head & Shoulders, but given the price action almost immediately after, it is telling us that it is rejecting the candlestick structure, the pricing pattern as well, and that the market actually prefers continuation to the upside.

As you move further up the market, we can see a very well-defined Double Top. The market trades to the upside and continues to push on, creating a Double Top, moving down to the downside, creating our structure here, before bouncing back up from our level, and creating our second Top before reversing. So, now that we’re looking at this, we’re asking ourselves where does the market wants to trade now? If we get a break to the downside, certainly the expectation, just like in the previous slide-show presentation within the course. The market certainly prefers a continuation or an expectation of continuation to the downside should the market trade and close below that level.

Now we move on to a Head & Shoulders formation and looking at the charting pattern here with the NZDUSD. It’s well-defined. We can clearly see over a longer time period that we have a Head & Shoulders here, with the Head being here. We have a very strong trend to the upside, creating this Shoulder, then we get a movement to the topside, creating this Head. Then we get very well defined, almost other same level here, but breaking our same level of support and resistance here, and a very well-defined Head & Shoulders formation. The question is, what do we do? We have seen false breakers to the downside and around this area, but certainly looking at the Head & Shoulders formation, given the volatility of the markets, we can see that price expectation does favor the downside. Certainly, we get continuation trading to the downside quite strongly after a period of volatility.

Moving on to the cable markets, otherwise known as the GBPUSD, we can see some very well-formed Ascending Triangle formations. If we actually squeeze the price action in a little better, it’s probably a little more well-defined over the long to medium term. What we’ll do is actually use our Descending Triangle to define this. Here, we have quite a long period of bullish activity. Looking from the channel here, we can see a very strong channel to the upside. Now there is a lot of movement in this price, we certainly know that, but if we’re ever looking for our breakout opportunity in the currency pair, surely, we can look at this as a sort of short-term, medium-term Ascending Triangle forming. What we’ll do is just zoom in on the price action here a little and analyze this recent price action here. You see, the Triangle is well-defined here, price consolidation is moving towards the upside. We do get trading within this channel quite extensively, but if we’re looking for any sign that there’s consolidation, not just within the period from 9th of June to the 9th of January, but over the longer run, certainly this candle is the clue that price action is going to break from a level. We see a very well-defined Ascending Triangle coming up from lower lows and higher highs here, consolidating within this period here, we see a shift and a break to the upside. We then see the trend really start to push away to the upside, and that really gives us the confirmation that we’ve made a good decision here. Breaking from the Ascending Triangle formation to a long position here would certainly be the trade of the day.

Moving on to our final chart, we’re going to look at the Canadian dollar, and specifically, we’re going to look at candlestick charting patterns. We know that looking at one particular Japanese candlestick doesn’t provide us with all the information. The actual charting patterns themselves can provide us with a little more information. However, that doesn’t mean that you’re always going to be correct in decision making. I’d like to highlight that as well, with a few points. I’ll use my blue pen again here. We have some very bullish channels here, and that tells us that this previous price action that is led here is totally outweighed, totally obliterated by this large bullish move to the upside. In terms of stacking the odds in your favor, a buy position here would certainly be of a higher probability than a sell position. That’s what we do as technical traders, try and stack the odds in our favour. We do get the candle, given that one particular, then with the following two candles here, we get the confirmation to the upside. So, that lends itself to try and identify early signals of a trend, albeit in a very short space of time. The trend moves up quickly and provides with decent risk on a trade of that size. If we look at some candlesticks here, we can also see our Inverted Hammer here. This would be a very clear signal that after a long bullish period, the market has rejected any further notion of trading to the upside. The market is more likely to actually reverse that signal, but what we need to do, is to actually take the price structure itself into greater value. Particularly, this combo, one, two, three, four, five, these five panels here. We get continued rejection to the upside. Even with the bullish candle, we get the market trading down on closing, with the following day reversing again. The fact that this candle here closes just below the level lets us know that this continuation to the upside has been rejected, and is no more likely to continue with an upward trend. We think of the market obviously trading down, with a little more uncertainty to lower levels. At the moment exactly, we see a little reverse to more bullish behavior, indicative of our Doji candle, and we see a further continuation to the upside.

What is significant about this price action next, is that we can see in one, two, three, four candlesticks we see some quite strong bullish price action. Inevitably, it doesn’t actually lead to anything. The bearish engulfing candle here totally outweighs the recent price action, which should also send us a signal that the market is rejecting a bullish sentiment, and that there should be some continuation to the downside. However, we can see once we have the full story if we take this full story into play from this, maybe two-week period. Actually, it’s just volatility. These two candlesticks certainly tell us the story that there is indecision in the markets, that there’s no real push to the downside. Given the engulfing candle should tell us that the market has rejected bullish activity and it trades back up within a sort of two-day period after that. So, it’s good to really look at a period like this of two weeks, to look for an overall trend story that actually defines in its sense this whole.

I’ll just use a different color of my pen here; this actually defines this entire period of consolidation. I’ll just highlight that circle, I apologize it’s a little messy, and really what we’re looking for is actually a structural failure or something to tell us that this period of consolidation is over. That’s kind of what happens in the most recent price action after this, so I’ll just delete this price section for now. I’m going back to my blue pen. We see this structure here, and we see the area that we had our price consolidation in. We’re looking for a close, and we actually get the close of this candle just below the resistance level here. We’ll call the resistance level R. Again, a confirmed, I wouldn’t say engulfing candle, but certainly, a candle down to the bottom, closing on the low here. That tells us that we have a confirmed breakout to the downside stacking the odds in our favor. We are looking for a continuation to move to the downside, and certainly, we get the trend, albeit for this sort of short to medium term, to new lows here around February time of 2018. Again, straight away from the new lows, we get a bounce with a bullish engulfing candle. This time, we get continuation, so this candle, candle number two, we will call it, perhaps gives us just as much information as candle number one, in the fact that the trance seems to want to continue from the bullish engulfing. We do get movement to the upside, so that’s where we’re at now. We see a bit of rejection to the upside with this candlestick here in the reversal. However, with the structural failure reversing down and getting a little indecision in this candle, we see the trend start to continue with a bit of uncertainty. In the middle, we could almost see this as a Three Bullish Soldier formation, and that could give us an indication that the longer-term trend is to the upside.

That will conclude the practical application side of candlestick charting patterns and technical identifications. Thank you for joining us here at Forex Academy, and we’ll see you next time.


Categories
Forex Courses on Demand

Market Analysis – Know Your Market!

Hello, and welcome to this latest edition of courses on demand brought to you by Forex dot Academy! In this course, we will be discussing market analysis, and there is, of course, inherent risk when trading these financial markets. So, as we begin, please do take a moment to familiarise yourself with the following disclaimer.

When discussing the market analysis, first and foremost, we must outline the difference really between trading versus investing, so we can grasp an idea of the market participants that are trading in these markets, and whether they look to hold positions for short medium or long periods. And that brings us into discussing, and really developing upon the trading skills of thoughts. So, what we have is fundamental analysis technical analysis, and sentimental analysis, and these traders whether they have a hybrid of different trading strategies or not will take on board some of these feelings or objectives into their trading then we’ll be looking to trade these perspectives on some price action charting, and just towards the end of the lesson to actually practically apply what we have discussed throughout the webinar first before most let’s try, and define the difference just Anna lemons expression with trading versus investing when it comes to wealth creation in equity markets in particular investing, and trading are two very different approaches in generating a profits in the financial markets okay. So, let us imagine today that yourself, perhaps on the friend bought an equal amount of seeds to sow in in a garden or field we then sold, I sold many seeds in a day because I could earn a profit. So, I’ve traded I’ve made a trade, and they’ve earned a profit that’s great your friend on the other hand and sowed the seeds, and let him grow for a few years till they gave I created new seeds he then sold the new season continued this for years and sold a lot more seats eventually than were initially bought. So, obviously, he has taken a much more longer approach to developing his seeds to developing his purchase and invested those seeds in a future respect us by investing his seeds. Your friend has made a profit in quite a different way than what you made by trading your seats okay. So, two very really a big stark differences here in terms of discussing trading versus investing first of all the time period obviously I’ve decided to buy the seat, and sell them in a very quick period of time I’ve made a short-term profit that’s absolutely fine no your friend or the guy who decided to invest these seeds obviously, and growing more seeds over a longer period, and probably growing his overall perspectives or project, and would have of course made more money on this one particular trade but would have taken or accomplished a lot more time towards this project that is the same for investing over a long period of time. So, if  you’re looking to purchase, perhaps equity shares in Google or Microsoft or a company of your choosing you will be looking for long-term growth, whereas an advantage as opposed to the trader there it is a short-term profit, perhaps that transaction was completed in 30 minutes or one hour I could make potentially thousands of those smaller transactions, and still make profit, and by potentially lots, and lots of seeds, and sell them resell them at a higher price. So, there’s a big difference in actually these two approaches, but they could both be very profitable approaches to trading at this market in particular. So, just a food for thought there let’s delve in a more detail the differences between trading versus investing the time period trading is a method of buying or selling a security for a shorter time period, and for shorter-term profits today as liquidity allows quick entry, and exit, and profits can be true to leverage okay. So, we know that, perhaps as forex traders we can trade we can use leverage to trade very small amounts of currency but actually to make much better profits in terms of the relational move in the currency pair investors choose to invest capital amounts for longer periods on hope not only to profit for price increases but profit from ownership as well. So, obviously, if you’re looking to invest, perhaps commodity index or, and share a particular share of your choosing you’re looking for capital growth. So, you’re looking for the price to increase over a long period of time but there are many potential up sites as  well, to, perhaps only in the shares that dividends obviously corporate earnings can affect you there, and you can look to actually build a portfolio based on actually only the physical shares as  well, capital growth taking us on nicely to discussing that trading on the other h, and focuses more on the movement of price unders based on more skill from timing investing aims to create long term value unless is less worried about shorter timeframes okay. So, that’s very important to note as an investor we’re not particularly worried about what time of the day that we enter this trade perhaps, if we are concerned with, perhaps only in these shares for a 1-year period or a longer time in search of value. So, that is very important, and potential upside in investing, and al. So, the time focus of trading in terms of that capital growth you could be in a trade for one day or for three hours or for thirty minutes depending on how you’re looking to trade the markets for that capital growth an art versus skill is a good discussion, and brings a lot of analysts who actually to discuss the real techniques involved in both trading, and investing traders are most certainly skilled we have many technical individuals who time the market, and learn market trends to hit higher profits in a stipulated time investors analyze the stocks they want to invest in, and investing includes learning business fundamentals on a commitment to stay invested for a longer-term. So, we do know in terms of our research that it is really much I suppose an art investing a lot of research goes into your to your fundamental analysis, where  this, whether you’re a short-term scalper or looking as a technical trader for price points or inflection points, are very structured technical analysis to give you your trading signals there’s a certain skill as opposed to the art, and in there within each time period respectively, and risk, of course, is of high-end keen importance here, and in terms of discussing trading versus investing trading involves high risk due to much higher possible returns okay. So, it’s very important to note and more frequent trading. So, obviously traders the reason why we look for those returns, and in terms of the investment community, it’s a very different discussion that you do have you often get investors asking well, how much return do you make as a trader? And for me I really find that a strange question because it’s not relative in terms of return, and only in the portfolio of assets over potentially a 1-year period you’re looking to get more stuck in there in terms of trading the markets, actively trading the markets you might make 500 euros in one make you might make 2,000 euros ‪in one week‬ you might make twenty euros ‪in one week‬. ‬‬‬‬

So, it’s there it is relative to your current size, and how you trade the markets sometimes you traitor you’re trading very  well, but it’s the consistency over a long period that defines, and makes you a definitive effective trader, where as investing involves lower risk unreturned, and is often a more complex function of price interest on potentially dividends, if  you’re looking for growth as  well, in terms of return because you’re looking to effectively what you’re looking to do as an equity trader is I’d perform an equity index for higher return let’s say the S&P; 500 is returning 6% in 2018 we will be looking as long-term investors to outperform that equity index, and to really perform in terms of beating the index, and make a higher profit however in relation to trading obviously, if  you were looking to trade the markets more actively, perhaps very actively for one year 6% over a one year period most certainly would be not a high target at all would be respected as actually looking for those sort of more long-term approach targets let’s discuss the N or trading skills of thoughts first, and foremost fundamental analysis  well, what is it is the examination of the underlying forces that affect the well-being of an economy in history group or company. So, it’s very important to understand, and fundamental analysis isn’t just trading, or it isn’t just investing in stocks, and shares you can have fundamental analysis in a gold market in the commodity itself in any commodity there, coffee sugar wheat oil and. So, anything that you really can do research in to get more knowledge on the fundamentals, perhaps the supply, and dem, and function of that market is a particular interest to you as with most analysis the goal is to derive a forecast, and profit from future price movements okay technical analysis is a methodology for forecasting the direction of prices through the story of past market data primarily price, and volume, and really that’s what all the technical techniques in terms of technical indicators point to that point to either primarily a change in price or a change in volume market participation. So, technical analysis is that study, where  we use these technical tools we look at previous price action to actually get a formula divide ear of, where  price is more likely to move to then we develop our probabilities in trading those in terms of stacking the odds in favor as a technical almost on l, and trade in pulling the trigger to actually get involved more heavily with these markets than a fundamental trailer, and then sentimental analysis it focuses on identifying, and measuring the overall psychological state of all market participants it attempts to quantify what percentage of market participants are buyers are sellers, and obviously we know they’re both called bears on bulls respectively. So, we have our trading schools of thought we often see a traders or investors develop a myriad of trading strategies or, perhaps a hybrid approach whether they’re they combine all three or whether they choose to combine one or two together separately, and most traders will develop more of a hybrid approach actually trading the markets, and it does depend on is indicative of what asset class you’d like to trade or invest in. So, let’s discuss in much more detail fundamental analysis what we discussed there is the examination is the underlying forces that affect the well-being of an economy in history group commodities, and companies. So, what does that mean?  well, let’s say that we want to trade the 40 fundamentally we want to invest the in the 40, perhaps or, perhaps we are looking for opportunities aware from the 40 100, perhaps more central European markets, and we’re looking to outperform these equity indexes that are, perhaps generating a 4 or 5 percent per year then we can actually look at the 40, and analyse it fundamentally with, perhaps the top ten performers understand, and why the market is, perhaps under price at the moment are in relation to what’s happened in 2017-18 in terms of depreciating sterling that might have a, and certainly how sort of strengthening in fact on UK assets. So, there are some fundamental analysis in the well-being of that economy in high things, and assets a price within an economy let’s go into industry groups, and we know that London is famous for its financial services industry we can certainly do a portfolio of research there, if  we find that is performing  well, we can use that analysis to look for our opportunities, and we know what companies are, perhaps I’m under, and I performing within the UK at the moment. So, we can use all this research together to really combine a portfolio of our research to give us an idea of value is something under our overvalued, and make an assessment as such, if  it’s undervalued we potentially look to buy that asset and, if  it’s overvalued we potentially look for selling opportunities or look across different sectors for correlated markets to potentially buy those or invest in those assets. So, there is a lot of research that goes into our fundamental analysis. Let’s take a case here. So, what we have here is a bit of comedy sketch I suppose with OPEC I’m Saudi Arabia really leading the charge with OPEC we have the market share pamphlet that we have, and then the quote is fracking Americans. So, we know that there have been I’m really investing a lot in this new process of fracking of drilling down, and in finding oil, and gas beneath the surface of the rocks that has led over the past five years to a huge surge in supply u.s. supply in the oil market. So, what do we do is a fundamental analysis analysts how do we approach this how do we approach first of all our research in this environment how could we potentially assess trading opportunities  well, let’s move on to actually discuss a bit more fundamentals of the  well, being again of the economy we have what is known here as a shift or an increase in demand, and from D to D-one. So, just with the right-h, and picture there we can see our axes we have WTI crude oil price, and the quantity or that were suppose that’s indicative of demand, and supply. So, you can see as there’s a shift in demand, and from A to B, and that actually will be reflective of an increase or decrease in price given what will happen. So, with our example here with this the increase in fracking in terms of US production it really caused an increase in surgery with the past four to five years in the oil market we know that OPEC and many oil-producing nations have tried to combat this by introducing supply cut extensions, and these are still ongoing in the oil market to look to actually manipulate the price of oil or to keep it above its above I suppose the 50 $60 level we did see a very strong sell-off cause a shift in demand, and, and obviously an increase in the price of that commodity itself, and we often see these retractions or contractions in supply caused a shift in demand, and, and therefore price react in such a fundamental way. So, that’s a bit of a fundamental announced case in the oil market as a traitor you could position yourself for long-term price gains in this commodity, and certainly, that’s something you could have done in 2017, say, at the start of 2017. I was trading around thirty-five, forty dollars. It’s not at sixty, and sixty-five dollars, and we’re seeing that a price fluctuating between 60, and 65. So, I’m certainly a lot of growth in the oil market, and that’s a result of a lot of these fundamental changes or shifts in actually pricing or looking to price the asset here we have a price action chart in front of us this is the gold market, and we see that we have quite a lot of technical analysis already imported on to our price action chart. Now, these are daily candlesticks. So, each of these, and trading periods represents one day in the gold market at the very high we have a long-term resistance level there that’s probably providing some support for sellers in this market in terms of looking to fade this, and long-term strength in the market we can see they’re roughly around six months ago it was trading quite strongly up to that level on immediately reversed with a very bearish trend, and indeed in regards to more relative price action we can see that it has touched the level of resistance one-two, and three times almost, and obviously that is the high of a Fibonacci retracement from the more relative low to high of the market.

So, that would possibly provide us with an indication technically that this market is not looking to continue to the upside. Now, do bear in mind that using these technical indicators do conflict trade ideas at times as well, if  we look at the moving averages we have three respective lines won’t being a 200-day moving average that’s a red line then we have a 100 day moving average that is our green line, and the more I suppose constructive – – more recent volatility is the orange line which is the 50-day simple moving average, and that won’t move, and in relation quickly move to new changes in price in this market, and that will give us an overall, and Tran structure to the upside that this market is actually polish over those time periods which will actually conflict, perhaps with some of the technical analysis. So, you do need to know what type of trade you’re looking for what term of the trade you’re looking for as a technic illness, and, and what those other measures, perhaps like observing the daily volume, and the relative strength indicator will access, and, perhaps accept or reject your trade decision we can see that the volume did experience increasing momentum with this volatility in the most recent price action it is. Now, looking to decrease over the last three trading periods which maybe would suggest as  well, that, and there is decrease in volume in terms of looking to buy this market as it reaches new highs then we see relative strength indicator it really isn’t giving us a signal it’s roughly around 60 below 70 overbought period but it’s up there it’s getting close to that level. So, it might be something we could consider. So, that is what we do is as technical analysts look it took a bind at many different indicators technical areas or price inflection points of, perhaps historical pricing in a market to actually give us an idea to look for trading opportunities or to stack the odds in our favor in terms of probability. Now, in a plain technical analysis to a more structured short-term view we call these traders or technical traders price action specialists are many traders look to use technical indicators as  well, as observing, and trading the price action to give you an overall technical structure of the price my question that I would like to pose is how would we assess this chart just due to the price action to look for potential trading opportunities  well, let’s do some analysis here we have from low there we have a bit of a trend to the upside, and as at the bottom of that trend we can see a bullish hammer that would potentially give us a signal that, and there’s no more selling opportunity after that candle close, and that’s potentially the market is looking to reverse it certainly does and causes a very bullish trend in the gold market, and to the upside we can see that supportive of training candlesticks we see a very constructive trend to the upside over, perhaps two weeks price action. So, that would indicate the over all trained structure he’s very solid in terms of polish momentum we see an engulfing bullish combo, and just breaking up for a little from a little level of price consolidation I’ll just point that out in terms of, and address in the market itself we see this, and little Tran structure in here, and then we get a break just to both with this bullish candlestick giving us a signal that there’s potential more momentum for this market to continue to the upside we then see the reversal indecision with her countenance legs up towards the top of the market, and that would indicate, perhaps just looking at the price session we like to call these areas double tops. So, I’ll just draw this in that we can see this double top phenomenon I would indicate to us that we’re not actually getting continued strength to the upside with the candlestick structure themselves they’re certainly rejecting a price movement in terms of bullish activity then we see something quite significant we call this candlestick, and a bearish dragonfly which actually tries to break a level a very supportive level, and then close above the level which it actually has closed quite a bit above this level indeed. So, that would indicate we have some market support in an around er level here, and it’s a bullish market support. So, we’re still looking for buying opportunities, perhaps as a technical analyst or perhaps, if  you like the selling opportunity from those highs, and with the reversal, and decisions you’re looking for more of those again what we see with the most relative price action just in, and around this point is a market exhaustion I can that’s the gold market. So, it’s from our long-term high it is a lower low excuse me it is a lower high from the most recent price action again, and with the third I suppose shoulder in terms of looking to trade to the downside, and this could be an idea for us to look for potential trades to actually sell this market to the downside. So, that is what we do as technical analysts to use the price action whether you’re a price action specialist or you’d like to combine technical indicators as well, or simply make a hybrid approach indeed that is higher technical traders will look actually to formulate price discovery, and make trades. So, let’s move on to discussing a sentimental analysis sentimental analysis aims to assess at all times who is in control of the markets trading decisions can be made on either a short-term or a long-term basis the sentiment changes in the marketplace shorter-term traders will look for news events to cause a centum shock while longer-term traders will take a longer approach to the bullish, bearish outlook of the market. So, it’s all about assessing who is in control of the market at any given period at any given a price point when you’re actually looking to trade that time period. So, whether you’re looking to trade daily camel sticks only daily camel six, perhaps that structure you’ll be looking for longer-term trades, if  you’re looking for sentiment shocks you know you break that day down into assessing the five-minute candlesticks I’m looking for sentiment to tell you who is in control of that time period, and in the day, where  the volatility is suggesting there’s a price shocker or sentiment is shifting. So, what I’d like to pose is a couple of charts here we can actually assess the market, and very basically itself, and it all leads into just focusing on the sentiment or the feeling of the market at that time. So, here is a control of this market.  Well, what we see is a very clear trend. Now, I know this is related to actually studying the markets with price action on technical analysis, but this is purely speculative on sentimental analysis by judging the market we can see that there has been a level of recovery. So, that is more of a value question in terms of its fundamental approach there is a level of recovery in the market it’s trending up, and the market is very supportive in this long-term price trend. So, if  we are trading this in the long term, and again these are daily candlesticks here in our own Swiss market as a forex trader we will of course develop more of a strong sentimental approach to price growth, and more an appreciation in this currency pair let’s move across to yet another currency pair to potentially assess that chart, and really derive an idea of again who is in control of the market here we have the in the end market, and Forex pair, and we can assess it purely from a sentimental approach again. So, again, these are daily candlesticks, and I’ll just highlight that in terms of the actual price chart as well, we have daily count 6 or Canadian yen who is in control of this market, where we see a very well-structured trend to the downside. So, initially, just by looking at the market, we have a directional bias, of course, we do as a sentimental trader it’s all about your feeling of the market, and the market participants or who is in control of the markets are certainly looking for selling opportunities in this market.

we can see apart from the transferor moving very much strongly to the downside. We could see that buyers don’t even enter the market really, we have one buyer are not as quickly I’ve done with some price movement to the downside we have a second buyer again price movement to the downside a buyer comes in potentially looking to trade the market up as buyer 3 we’ll call we see continuation to lower prices buyer for again. So, you can see, where  I’m getting out here sentimentally we are thinking there are no buyers in this market, and we’re seeing this trend structure really start to push to the downside again it does lend itself to discussing it, and that is why a lot of these traders do take on a technical, fundamental approach, and hybrid their trading strategies but sentimental market participants again potentially for not a trader but you’re an investor, and you’re looking to judge sentiment in the Canadian Japanese yen you’re going to observe this market on what you can see in terms of the price structure is that the market wants to trade down on our sentiment is bearish we’re bearish this market, and we’re looking for selling opportunities or potentially waiting for the market to change our sentiment to change. So, that we can look to buy this market that is a very important point as  well, for sentimental traders the times these home traders will have fundamental analysis, perhaps for the Canadian yen, and are simply looking for buying opportunities, and given they need to make an investment in such a market that is certainly the case as  well, and you can get very good trades off just due to how the sentiment, perhaps Lee, perhaps will shift in terms of a short-term shift in sentiment let’s move across to a third, and final market when considering sentimental analysis we have the gold market again, and what we see this is a more relative price section that we have viewed over the last two charts or when discussing technical analysis in different time frames here we have, and the most recent relative price action, and in in the cold market, and what we can see here over, perhaps a month maybe five weeks of trading is that there is no strong sentiment in this market or not can answer. So, many questions for you as a sentimental trader who is in control of the market.  Well, neither bulls or bears are in long-term control of this market. It is an upper in turnaround, and not long-time highs but certainly highs of the past three years. So, it is an area of interest for sentimental analysts and traders, and we’re looking for opportunities to really see a shift in this sentiment is the price, and going to really breakthrough or long-term level then sentiment will really shift, and all these short-term traders will really change their sentiment in terms of being bowls in this market, if  that is the case I do not need to know why as a sentimental trader I just need to know that I want to follow this sentiment as the market shifts potentially as we discussed with our technical analysis that we did have a bit of a price structure at this resistance level here. So, potentially just think logically of this as a trader, if  the market trades down, and looks to break this level could we argue that the sentiment is shifting to the downside in this market, and market participants or who is in control of this market is actually changing, and towards the bull that the Bears certainly the answer will be yes, and to take that into consideration in our sentimental analysis. So, let’s just put that all into detail in terms of searching potential trading opportunities what I would like to look at just to finish off is on market analysis with different perspectives here, and obviously the question is how you do traders analyse the markets  well, market analysis we know that primarily we have three main schools of thought we have fundamental technical, and sentimental analysis, and those traders obviously look to position themselves with a different decision-making process as trainers in the markets first, and foremost we have a price action short in front it’s the Chinese, and 50 equity index, if  we were first, and foremost, perhaps a fundamental trader how would we look to trade this market  well, overall we know that we are in a very strong bull market in terms of higher global equities are performing at the moment. So, that leads us to observe our long-term price trend, and obviously we have a directional bias to the upside; secondly, we understand, and the construction on manufacturing sectors of the Chinese economy to be very strong, and very important in the overall growth story. So, such tech firms are at performing that I would leave to continued growth we know that industry and construction are very important as well, and we have seen bond markets in such metals, and copper, and aluminum over the past year. So, that would lead us to, and to speculate that there is strength latent in this market, and one can follow this momentum to the upside how would we position ourselves on strainers fundamentally  well, the question is always on value we look for value opportunities, perhaps we follow an investor, led by the tip sentimentality, where  we can look for opportunities to actually bury this market to the upside with a very strong directional bands fundamentally this market is strong how do we look -, perhaps trade this market, if  we were to apply our technical analysis  well, first, and foremost we can see there is a very obvious trend to the upside. So, that confirms our technical directional bass to be common buyer okay then we look for opportunities to, perhaps follow a price channel we can see a few very well-defined price channels here which leads to or words momentum but remember as technical traders we’re looking for, perhaps levels of plants consolidation. So, we can see one here in the middle it actually starts to follow, and consolidate a trading range. So, we can look for shorter term opportunities, perhaps within this range, if  we don’t want to trade the long-term we could buy, and sell of course the lows of these trading ranges, and, and when the price structure breaks down they have still a directional bias to the upside we follow the breakout to the upside when that occurs al. So, remember we are technical traders that we can look for shorter term opportunities in potentially some sentiment that may shift the market in the short-term by simply looking at the Japanese candlestick structure here we can see that have a very strong candle, and golfing marbles are to the upside then we have a doji or indecision candle, and then a complete reversal from the next candle there. So, that would lead us to speculate that there will be some continued in the short run at trading to the downside. So, a few potential trades that are obviously both in a long medium, and short-term trading opportunities for the technical trader how did we, perhaps look to trade this market, if  we were to base our decisions purely on a sentimental analysis approach  well, simply by looking at the price action over the long-term we can answer the question who is in control of this market over the long-term, of course, it is the balls. So, sentimentally, if we take a directional pass, we are, of course, buyers in this market, then we can al. So, look for short-term buying opportunities, where  we see a sentiment, and combos, and these would be they think about an actual common stick structure, where  there is more volume, perhaps there is more trading, and the ATR it’s greater than a candle that would lead us to say there’s momentum when the sentiment is stronger in itself or, perhaps a well-formed range whether it’s clearly total control from the buyers that would focus our attention on actually trying to capture these great opportunities as a sentimental trader we al. So, know sentimental traders will look at short-term shifts or changes in the sentiment. So, the name another example here we see a very very significant change in sentiment that leads to the market actually pulling back from new highs for a quite sustained period perhaps, and one week to week period, and then forms a range. So, definitely a good trading opportunity, thereby trying to find these areas, here is another one. Perhaps the market has reached a high on sentiment is changing what the feel of the market participants are changing on the direction of principle that is as a result changing, and allowing these trading opportunities. So, there we can see three very different perspectives in how to actually look to trade these markets both fundamentally technically or sentimentally, and the answer or question is really up to you as an individual trader whether you want to delve into one particular school of thought or maybe embroider or combine all of these approaches into your own hybrid style of trading, and that will develop your own trading strategy of course. So, let’s move on to the webinar review this concludes the lesson what do we learn in this lesson  well, we learned the main differences between trading versus investing whether it is based on a time approach to your old trade or, perhaps you’re looking for value as opposed to actually looking for a short-term price speculation then we discussed the trading schools of thoughts obviously in a lot of analysis within the webinar we have fundamental technical sentiment analysis, and higher traders could actually position themselves in the market. So, that brings us to the end of this market analysis webinar thank you very much for joining us on this instalment of courses on demand, and I brought to you by Forex dot Academy, we do hope to see you very soon bye for now.

Categories
Forex Courses on Demand

Leverage & Margin – Key Principles Of Forex

Hello, and welcome to this latest edition of courses on demand brought to you by forex dot academy. In this course, we will be discussing leverage and margin. There is, of course, inherent risk when deciding to trade the financial markets. So, just before we begin, please do take a moment to familiarise yourself with the following disclaimer.

So, let’s go straight in, and untack all the real reason behind the risk or the real availability for risk in trading the financial markets leverage, first of all, will have to define what is leverage, and actually, give it a good explanation with. So, me various examples obviously you’re aware as financial traders that there is an element of risk, when trading the financial markets it’s how we tackle it’s how we approached that level of risk in our trading actually will deliver success over the long term. So, we’ll explain that in a lot of detail, then we’ll move on to discussing notional trade sighs when we decide to trade these markets, whether it’s a Forex pair or whether it’s a commodity like gold oil silver perhaps. So, things like coffee cotton there’s always a notional trade sighs how much of the actual commodity or asset are you trading in the real world, and how does that relate to the initial capital that you have on your trading account that then brings us nicely into discussing trading Lots, and that’s really how we assess, and how we attach a level of risk to any position that we love to take, and trade in the financial markets we look at both 0.01 lots, and 0.1 lots, and of course for warm lots, and we can always refer to those as micro-lots many nuts or the full training lots as well. So, we look at that in a lot of detail will then discuss leverage itself as the risk factor, and how that relates to margin on your current really your margin is a good faith deposit for your ability to actually take on. So, risks in the financial market, and then we’ll discuss that actually practically on the trading platform looking at taking on. So, me risky trades taking on. So, me not. So, risky, and I’m really discussing the difference between those positions really, and hired manufacturer training in the markets. So, let’s move on, and what first of all is leverage well within the financial services industry itself hedge funds, and other financial institutions send and receive short term loans to one another, and this is of very large amounts of money. Now, it’s perhaps for a very short time they may lend perhaps at ten million dollars ten million euros to over the weekend perhaps for short term rates or for. So, rt of short term positions just to actually have that extra capital to hold as margin as well this is to allow them to assume more risk and increase the leveraged size of their own positions, and what we refer to this in the financial markets in terms of financial sector trading is gearing up. Now, that it’s actually no different to our own trading as regional traders we – as market participants can gear up by accessing higher levels of capital with which to trade from, and that’s done via the broker this enables retail traders to enter trading the many asset classes that offer leveraged products such as contract for difference okay. So, that would be the more common approach we would look to trade these markets; obviously, there are other products leveraged, such as binary options, and perhaps futures contracts, and perhaps. So, me spread betting accounts as well are often available through the retail traders we prepare contracts for difference just given the structure of the product as a leveraged product as well leverage itself allows traders to increase the buying power of their initial capital in order to profit from smaller fluctuations in the price of a financial security. Okay, this security may perhaps be a futures contract or a global commodity like oil and/or commonly a CFD on a particular forex market like the euro US dollar. So, let’s just reverse back on this, and discuss this in a little detail. So, whether we decide to trade, something like perhaps oil the oil market well, if we think that the price is going to rise in oil we don’t actually look to buy that to actually physically own that commodity, and may be stored in a garage for a period of two weeks until hopefully the price rises, and then we can sell it for a profit no, no as traders as market participants we look to agree with these level of contracts in the market whether it’s futures contract or whether it’s a contract for difference it’s between two parties one agrees to buy one agrees to sell the asset at that price, and they simply speculate on the price that actually that product itself allows us to trade the leveraged product of perhaps a barrel of oil which is maybe too expensive or too difficult for us to actually access.

So, that’s the main point leverage effectively enables traders to actively participate in financial markets that would otherwise be inaccessible or perhaps too costly to trade, and again perhaps a too costly to trading example would be well perhaps. Something like 10000 euros, if you want to trade the notional trade size of 10000 euros you don’t necessarily have the capital for 10000 euros but you want to take advantage of these moves in the markets well leverage will allow you to do that perhaps with the smaller current size of a 500 euros you could maybe access that amount, and given the leverage factor on your account. So, let’s delve into this in a little more detail again to reiterate leverage makes trading in the financial markets more accessible to you, and me okay leverage is essentially the rate of multiplication to which you can trade. So, it’s effectively the multiplier or the risk factor of your trading position I came to use the euro or Forex example it can actually allow us to trade very large sums of money perhaps 20,000 50,000 euros of notional tray actual cash value against the depreciation or an appreciation of that currency, and again from perhaps a smaller amount size of 1000 or 2000 euros. So, we can actually access these markets in such a way to take on leverage, and risk this multiplication of your funds held on deposit allows you to trade bigger size, and access more markets, and leverage allows you to pay less than full price for a trade giving you the ability to enter larger positions than would be possible with your current funds alone. So, that is the same as suggested there just with the financial sector itself, and they want to take on headphones often do this pension funds as well, when they want to trade in the markets will look to the financial services sector for short term money on deposit simply those interest rates, and that’s that’s effectively what LIBOR is for in terms of short-term money lending, if you’re in the UK the London interbank reott effectively for loaning a short term money to another party but the aim is to a gear up for your investment. So, that you have access to larger capital to make the trade perhaps once the trade is performing you can take. So, to profit out of the trade, and within a few days look to give the money back into the financial sector. So, that’s something we can do with a smaller current says we can access these marketplaces, and actually look to trade quite large sums of money in terms of notional trade size. Now, obviously there is risk involved, and not, and we’ll discuss it throughout this webinar the assumption of leverage is an essential product for the retail trader to trade the global financial markets okay the ability to greatly increase notional trades as expands our purchasing power as traders it is absolutely imperative that this acceptance of risk could be understood, and respected, and that is why we have 4x that Academy here of plenty of risk management courses we are big avid advocates of actually trading the markets with a very consistent approach in terms of developing risk management I’m protecting capital, and it’s it’s very much the professional approach in terms of not looking to trade or speculate in a gambling manner with these marketplaces always respect the risk that you’re trading. So, try to explain this in a detail perhaps for the beginner or novice trader there’s perhaps thinking of entering the markets for the first time we can use this example to highlight leverage quite quite well, and the question I would like to pose that do you know any learner driver who takes their driving lessons in a Porsche absolutely not I do not indeed, and that I would assume would be the same answer for many of you learning to trade the financial markets here do you know any learner driver looking to start their lessons by driving a Porsche no I would why would apart from the obvious why would that not be a good idea well it’s the same as leverage that we converted in this manner, if leverage is used incorrectly it can have a devastating effect on your trading account. So, novice traders, what can they often do they could take too much risk, perhaps started an account with 500 euros, and effectively, unfortunately, blow up that account or lose everything, and that’s because they’re taking on too much risk.

So, let’s go back to our Porsche example if we’re looking to start our first ever driving lessons in a Porsche well, I know that it’s quite sensitive to drive; it’s quite speedy it’s quite fast perhaps the gear change is much more difficult than. something more simple to drive a Ford Fiesta it’s just a very dangerous car for a new beginner to learn how to drive. So, let’s look at our training occurrence here, and that might be the same for a 1000 euro current at perhaps four hundred to one leverage well what does that mean, when you actually look to set up an account with a broker, and they offer you different leverage accounts more generally they will offer two hundred or four hundred to one that actually means that you can trade with your 1000 euro account a notional trade says potentially of four hundred thousand euros. So, if you were to hypothetically, if you were to start your first account with one thousand euros, you could effectively take a risk in the financial markets of that amount of four hundred thousand euro. So, if you take the full risk on your account, one hundred cents. So, you can see quite clearly, and quite obviously that that would not be recommended you’re taking on too much risk, and the market really doesn’t have to move against you too much for the year 1000 euros to effectively be wiped out let’s move on to our 1000 euros hypothetically with an 800 to 1 leveraged trading account that has the potential to trade a notional trade size of 800 thousand euros. So, can you see that that is just too much leverage to access, if we’re, if we’re actually looking to trade the full 100 percent risk on our trading account what we want to do is aim to reduce leverage as much as possible, when trading, and learn how to drive in a much more suitable car why is that well it’s simply safer guys it’s simply safer we want to approach the markets with our education we want to develop consistency, and it is true that, when you take on more risk, of course, there is more profit available, but you might have four or five very very profitable trades indeed, and then, if you have no risk or are taking on too much leverage or perhaps no stop-loss you can’t often see those earnings those winnings erode quite quickly. So, trying to develop your idea of leverage trying to take that on board with your risk assumption is always the wisest approach, when deciding to trade these financial markets, let’s discuss notional trade science. Now, a very important factor indeed, and one that is often overlooked by many a financial market participant notional trade size or n TS is the overall position size over-leveraged trade wherein a small amount of investor money can control a much larger position in the markets accurately calculating trade size is a crucial component of risk management strategy what we should do is accurately be aware of the notional trade says for each market you trade. So, what is this really in layman’s terms what does this mean it means we need to know what we’re actually trading, and I don’t mean what market or product are we trading gold, if we’re likely going to be trading the gold market well we know that we’re going to be trading gold as we open the market, and begin to trade what it means what it refers to is, if we are trading gold do we know with our trade says perhaps how many ounces of gold, if we decide to trade perhaps the oil market do we know effectively how many barrels of oil we decide to trade at our given volume, if we decide to trade the US dollar against the Canadian dollar do we know how many US dollars we actually have as a position size, if it’s, if we take a rather large trade size, and we’re in the market trading, and it’s moving five euros per pip, and we think that’s perhaps good if someone wants to turn around, and say you’re actually trading 200 thousand dollars there of actual cash would that shock you. So, these are all the things that actually relate to trade size notional trade size, and the amount of leverage that we were assuming in these markets. So, let’s go through just for. So, me examples here you have a table just jumping in from the right there, and we have first of all forex our forex markets there we have equity indices, for example, the footsie there in the UK, and we can discuss commodities, and we have an I mean we have gold here as the example as well. So, let’s just go through them here in terms of defining the notional trade size for these markets well one standard lot for the forex market sure as you look across either the majors minors are perhaps. So, me more exotic pairs 100,000 of the base currency is your one lot. So, we can see that one standard lot here is our base of 100,000. So, that’s quite a lot that’s a large trade size even by placing that. So, here’s our 100,000 for our one lot a one mini large-size is ten thousand at Euro against the dollar for our base currency, and that is zero point one zero lot, and what we call there is the mini lot, and then what we have is 1 micro lot size, and that is warm thousand of base currency, and that is perhaps rather 0.01 of trade size.

So, you can see it’s quite well defined in terms of looking at the looking at trading the Forex pairs that’s that’s actually the same in terms of input value for the embassies we have a 40 which is simply one index is one, and then obviously the fraction of that is hand, and 0.01 index point is actually 0.01 micro lot size the gold as well considering it’s a commodity we have gold weight in ounces. So, actually, one standard lot in the gold market is 100 ounces of gold. So, we know that I’m not as effectively r1 lot, and one mini lot says there is 10 ounces of gold obviously as the fraction, and then, if we decide just to keep our risk small we want to train to safer how this market appreciate, and depreciate in terms of one ounce of actual weight gold we know that we can trade in 0.01 micro lot for the market. So, very self-explanatory there, but it is actually in position sizing for these trades that you’ll become more accustomed to trading the markets with your risk appetite, and perhaps your strategy sellers. So, perhaps you want to trade one of these markets here with your actual position says, and you’ll need to know then what size you’ll actually look to trade let’s use an indie see here, for example, we want to trade the foot see, and we have an account size of perhaps 1000 euro you’ll often, and do. So, mathematics or. some equation to let you know, and we have obviously a risk management calculator to help our students with this that perhaps um if you want to take a 2% risk on that trade, it might be. Something like 0.04 that you’ll be looking to trade on the actual account. So, this is how we look to a position in the markets with you know our account size relative to the amount of risk we like to assume per trade. So, let’s move on, and I’ll actually look at this honour a trading platform regarding specifically the trading lots of markets. So, here we have our new order, and that is just in the top left of the mt4 platform that is where we look to execute all of these trades, and then we get our order box that will pop up centre screen here then we have the instrument, and here we have the Euro Pound, and it’ll tell you euro versus Great Britain pound. So, obviously, the euro is the first leg of this currency pair, and the pound is the second currency pair. So, when we see this market rise that would dictate to us that the euro is stronger than the pound and, when we see this market fall that would dictate to us vice-versa obviously that the euro was weaker than the pound, and the pound is stronger than the euro during the trading period what we can see here that we have highlighted in yellow is our 0.01 trade lot size micro a lot I know, if you result of our notional trade size again we can see that a 1 lot within this market is relative to 100,000 euros 0.01, therefore, is relative to 1,000 euros of cash to trade from the appreciation or depreciation of this currency pair. So, that’s fineness can you see the difference there that’s absolutely fine in terms of a very small risk trade let’s move across to perhaps looking at. So, me other markets here we have there’s that the Euro Pound again we can actually see a one-load notional trade size again is actually imported into your volume, and that is relative to 100,000 euros of trading in terms of actual cash that you look to trade across this market. So, you can see that’s a huge position to take in these markets, and here we have a US oil WT crude oil, and we have imported into our volume zero point one zero or zero point ten, and that is referred to as a mini lot what does that mean in terms of how many are notional trade size for how many barrels of oil well we know that one lot is one thousand barrels of oil, therefore, the fraction of that zero-point-ten is 100 barrels of oil. So, that’s a relatively a strong position to take in the markets, but it’s within good risk management it would depend on your account size of course but you can see that there is a big difference from your wallet to the zero-point-one lot in terms of trading size on both the cash that will rate relate to on your trading occurred, and the size of the actual market position that you’re taking with 100 barrels there in the market. So, let’s move on to discussing their leverage, and margin, and what that means for our current well the margin requirement is the amount that we take in from your account, and he’ll as a deposit when a trade is opened ok different markets have different margin requirements. So, do be mindful you do need to be careful with the amount of margin, and on requirements that you will need to assume. Some of these trades margin is a part of your net floating balance, whether it is positive profit or negative for loss. So, what does that mean well that simply means, when you start your initial account let’s say you start on the cart with 1000 euro, and you accept one trade, and perhaps at one percent risk as that market moves either positive or negative negatively let’s say for discussion purposes it moves into a profit area, and the profit on the trade is 23 euros then your account size is 1020 three years with your open position. So, the actual floating balance of your margin is actually relative to, and the positions that you have concurrent in the market again on the flip side, if you have 1,000 euros, and for. So, me reason you have a 200 euro negative position well, then your margin will be much less. So, it’ll be 800 margin considering you have a negative position on a current balance margin can become a sizeable amount of your current balance depending on how many trades you have open on the size of those trades. So, what does that mean again well it means that this good faith deposit this margin that you are able to put up in terms of accessing these markets, and looking to trade this risk is actually held on your recurrent I’ve just at that moment you’re in the trade.

So, again let’s use an example of a warm thousand euro account, if we were to help spur take take on five trades in five different markets at the one time that may reflect quite strongly on the actual amount of margin we have left because, as we increase or as we put on each extra trade there will be a certain amount of capital that needs to be locked away as a good-faith deposit in terms of accepting the risk on that trade. So, it’s not always a good idea to perhaps have you know 20 30 open trades at the one time specifically for those smaller occurrences I’m not lead us on to discussing that it can be a barrier to trade. So, if you just think logically about that I’m you have 1,000 euros, and perhaps you’re trading in five-six different markets, and some of those trades are winning and some are losing and Some are perhaps 50 euros, and to the negative well then your margin is gonna be greatly affected by that perhaps you only have 100 euros left of margin which is not good. So, if you decide to take on another trader perhaps see a very good technical service that you do want to take, you might not have the capital, and in terms of actually, and putting out trade on for risk. So, it can become a barrier to trade okay what I want to do is really explain this to you in detail, and practically on the trading platform leverage, and trading risk. So, when we discuss leverage, when we discuss margin, how does not relate to actually our trading risk as financial traders well here we have the euro US dollar here, we have no technical analysis, and I would like to point out this is just our jafx demo current. So, there’s going to be no analysis in this trade, but in terms of looking at more generally, if we zoom in on the price action, we can see that we have reached a bit of a consolidation period above these highs, and lows here. So, we’ve just seen a bit of a pullback with today’s price action. Perhaps this could look to trade further toward the down says. So, what we will do is actually look to sell this market what I’m going to do is to place three trades with different associations of risk or notional trade size or leverage to show you how that may affect your trading account. So, we can just open RM or balance here at the bottom this is our our actual screen to let us know what trade positions that we are in, and what we can actually assume in the markets what I’ll do then is place three similar trades again this is our euro US dollar let us place first of all as we press the order this pops up, and on the other screen there let’s just change this to 0.01, and we’re going to trade the eurodollar again we’re selling this I cannot stick here just to the right of the new order screen, and looking for this market to continue. So, I’ll sell a notional trade size of 1000 euros, i.e., a volume of 0.01 I’m not more get how that trade has been placed there. Now, what we can see straight off the bat is initially we have accepted the trade position it has cost us in terms of the spread of the market which is absolutely fine that’s the cost of doing business in these financial markets we can see that that is effectively costing us not a lot at all the Commissioner has been 0.04 switch for centrally it’s nothing that will really affect our trading over the long run considering we obviously look to become profitable traders, and that the position says itself as the market trades it’s really trading, and with you know 1/2 cent per pip.

So, that’s fine, if the market was to go perhaps 100 pips we might look to make you know in an ‪around 1 to 3‬ euros. So, and what we’re looking for is actual large moves in the market. So, what I can do is just to show you what this actually relates to. Let’s just go back to the platform here, and what we’ll do we’ll modify this order, and we will look to perhaps just pick a price point here for our take profit perhaps 1 2281 1.2 281 as we can put that into our platform we can scroll over, and that will tell us that, if the market rates down from this trade we’re actually looking to make at twelve seventy-two. So, twelve dollars and seventy-two cents. So, that’s absolutely fine. You can see how the risk on this trade is small that, if the market moves down today or over the next two days, we’re looking to make twelve dollars off our trade. So, we’re feeling how are we feeling about this trade quite objective to the trade position we’re not under any pressure, of course, of course, we look to put a stop loss in there which I didn’t do, but that’s always how we approach this markets again this is it the more current really what I’m looking to show you is the effect of leverage on this account. So, let’s move on to actually placing the same trade really we’re going to sell this market again with our new order, and we’re actually going to trade a zero point one. So, there we have placed the exact same trade, and you can see just as I had at the end with my desktop, and again that the second trade has actually taken on a little more leverage, and there’s actually showing us zero-point-six, and it’s moving $0.10 per pip. So, you can see that the spread is actually the risk factor is multiplied we can see that’s affected in the Commission at 0.4 cent, and and then 40 cent for us for our trade, and again as the market moves the risk factor has been multiplied we’ve taken on not one thousand but ten thousand euros of notional trade says, and the market looks to move. So, if the market then trades down to this level, and Hort a profit is there will look to make not twelve dollars, and seventy cents but 127, and dollars. So, you can see it’s been multiplied there. So, let’s just go back again, and not that isn’t a hugest trade but you can see it’s relatively large in terms of what we’re looking to do in the markets perhaps it’s too much for us to trade what is certainly too much for us to trade let’s place the exact same trade again with a 1-0 lot a full lot of currency, and what this is relative to is 100,000 actual euros cash in the markets, and will sell at that price. So, straight away that, we can see that the risk factor has been multiplied we can see not we’re effectively in the same position not that has cost us seven euros for entering the trade we can see the commission for the trade was four euros. Now, four euros is a relatively small amount considering we are looking for a very big move, and obviously we would make quite a sum of money, if we were correct, and this market actually looks to trade to the downside but what we can see is the leverage, and the margin here we have in the current balance of seven thousand four hundred, and thirty-three dollars we only have a margin there of 275 for the current, and the free margin is actually seven thousand. So, we’ve taken a fall 275 dollars from a margin, and that’s quite significant in terms of one two three trade positions with our trade size as well I should point out that forex markets are notoriously cheap to trade as well. So, that’s why they’re often preferred, if you’re looking to trade other assets, that margin would be much more extensive in terms of the margin for capital needed. So, that’s just one example we can see we technically we have at three positions in the market we’re selling the market there or more or less the exact same trade what you can see the risk factor has changed for trade one-two, and three here we can see as the market moves it’s moving in smaller more medium on very large incremental shifts in actual cash itself. So, people react very differently, when trading in this market, and taking on too much risk let’s discuss the webinar then in its review what we discussed was leverage itself, and training to find it with. So, me good explanations we buy. Now, you should know inside out notional trades as what that means for how many perhaps barrels of oil were looking to trade how much currency were looking to trade, and what that means in terms of training Lots on your trading platform we know leverage is the risk factor, and what that really means in terms of margin on your account or the amount of capital needed for placing trades, and how does that relate to you as a trader with your own risk appetite training aids financial markets that’s always the key questions that finishes off our assessment then of leverage, and margin a very very key principle for us as financial traders. So, all that’s left for me to do is thank you very much for joining us on this installment of courses on demand brought to you by Forex Don Academy we do hope to see you very soon, bye for now.   

Categories
Forex Courses on Demand

Introduction To Elliot Wave Theory – Accurately Predicting Forex trends

Hello, and welcome to this latest edition of courses on demand, brought to you by Forex Dot Academy. So, in this course, we’ll be looking to provide you with a pretty comprehensive introduction to what’s called Elliot wave theory. So, just before we begin, there is, of course, inherent risks involved in trading the financial markets. So, please do take a brief moment to familiarise yourself with our disclaimer, if you do need to stop or pause this recording do feel free to do.

So, okay, let’s start with a very brief webinar outline we’ll start by giving you an introduction to Elliot wave theory! We will explain the origin of Elliot wave theory, and a little bit about the creator, and how this whole theory came about. Then we’ll have a look at the actual Elliot wave theory itself, and it’s referred to as the five-wave pattern. Now,  within that there is what’s called impulsive waves we’ll have a look at those we’ll have we’ll have a look at corrective waves, and the fact that these wave patterns do repeat themselves, and of course there are variances on these waves as well. So, you can have a situation where you can have a series of waves even within waves. So, all this will become very transparent very shortly, and we’ll have a look at Elliot wave theory in practice as well. So, you can see it on a price chart, and we’ll finish by just looking at some of the difficulties that traders can have when applying Elliot wave theory okay. So, let’s start with an introduction to Elliot wave theory then. So, what’s important to be aware of it is that Ralph Nelson Elliot, and I put a picture of him up on the screen, and developed the Elliot wave theory in the late 1920s. Now,  he believed that the markets who many believed behave in a very erratic manner actually trades in more of a repetitive cycle. So, to give you a bit of background behind Ralph Nelson Elliot he was born 1871, and he died in 1948 he was a US Treasury accountant. Now,  in his 50s he began to study stock market data looking at price action, and he observed that stock market prices trend, and reverse in recognisable patterns, and this of course then was able to give birth to his Elliot wave theory and. So, to just encapsulate what the Elliot wave theory is. Now,  this is a theory which suggests that market moves in clearly defined sequences of highs, and lows in a very repetitive manner and. So, the Elliot wave theory studies the movements of these sequences. So, at this point, I’d like to bring up just a fairly generic price chart, and because there is a couple of things before we begin that we would just need to point out to you. So, firstly it’s just important to know that our to recognise Elliott wave theory as a technical tool effectively which is used exclusively by technical traders, and what it sets out to do is also as well, it’s important to embrace the fact that markets are continually prone to trending, and reversing am I even in a linear fashion, and this particular chart is just a typical example it is a US dollar monthly price chart but what you can see is that this chart can move in a particular pattern either to the downside or to the upside. So, it can go through periods of trending lower in a very repetitive fashion, and of course, you can get slight reversals of that where you’re getting pullbacks in price action off those levels, and then you can reestablish these trend patterns. So, this is what Elliot was interested in is identifying, and trying to understand what is going on with these market movements, and of course the same applies to the upside you can go through periods of price action, and of course, be able to identify the pullbacks as well.

So these markets constantly go through periods of trending either to the upside or to the downside. So, you could have this just trending market on a number of occasions trending to the downside, and therein lies potential opportunities for your bears to look to the seller’s market, and you also get these opportunities to buy these markets as well, for your Bulls. So, markets never move in a linear fashion; they do not move in straight lines. So, we have to acknowledge that markets move in trends, and they reverse, and then they can move in trends as well, they can go through also periods of consolidation and. So, this is just the nature of the way that the markets operate. So, that’s just a little bit about just a brief introduction to Elliott Wave, because we’ll explain it. Now,  in considerable more detail, and we’ll start with the basic principle of the Elliot wave theory is the five-wave pattern. Now,  what this suggests is any major movement will unfold in a pattern of five waves, and in turn will be corrected via a pattern of three waves going in the opposite direction. So, just imagine this diagram here in the middle of your screen represents price action, and the movement of price, and we can identify that this market creates a high price point number one you can see it then pulls back to two it moves higher to three it then pulls back again to number four, and then we this market seems to peak at the fifth wave which is the fifth impulse pushing prices higher then look what happens, because the five-wave movement can be split into two distinctive segments, and we look at each segment very carefully but what happens after we see a price point they’re on-screen at five at the fifth wave we can then see that the market makes a reverses, and it makes a low at Point, and it then tries to push higher fails to make a new high, and makes a high at point B, and of course makes a third wave pattern to the downside in the opposite direction of the initial move. So, this is your impulse, and this is your correction. So, what Elliott would do, and he’ll be analysing a lot of price data is he’d be identifying these patterns existing in the markets either on the impulse side, and then looking at the correction side, and what he suggested was there’ll be interesting opportunities at these points, if you can identify them for opportunities to buy these markets at these levels and, if you can identify one three, and five what it will do for traders is potentially give them an opportunity in this case to sell the market, and benefit from this reduction or pullback in price action, and you can use this five-wave pattern to do that followed by a three-wave correction, and that is the basic premise behind Elliott’s wave theory. So, we will apply this technically in a chart very shortly, but I do want to just focus a little bit more on the impulse wave, and it’s being able to identify these one two five waves which we’ve just highlighted there in the box. So, this trend phase is known as the impulse phase. So, we’re getting impulses to the upside on again on numerous occasions, and I shall just briefly change the -colour. So, we’re getting these impulses pushing prices higher from these points on a price chart, and this is the end of the essence of the impulsive segment of this particular wave. So, we’re getting that trending price action pushing prices higher. So, this is the numbered phase. So, the first five phases are actually broken down as the numbered phase.

So, you’re looking for one two three four five-wave patterns on a chart, and an impulsive segment one two five is itself constructed as a series of five waves of which one three, and five impulses are of a minor degree. So, we’re experiencing a nice sizeable move in price action from the low to the outright high, and we’re able to identify with our understanding of this impulsive segment or the impulse waves, and we’re identifying potentially tradable opportunities within that okay. So, that’s just a little bit about the impulse wave. So, moving on to. Now,  the corrective wave, and which we’re again going to look at the same representation of price action but actually there’s a little bit more to the corrective segment the corrective part of the corrective wave and elements of this particular Elliot wave theory. So, trends move in a series of peaks, and troughs or highs, and lows, and other technical analysts would refer to one as a high would refer to as a low would refer to three as a higher high will doing a slightly bigger would refer to for as a higher low. So, really it’s just a chain a slight change in terminology, and this number five would be a higher high once more. So, as price drives to the upside in phase one up to phase three, and up to phase five this the corrective wave actually focuses on the parts of the wave which result in prices pulling back. So, we also have the lettered phase as well, is known as the corrective segment, and has always counted in threes. So, whereas we’re looking for five waves to the upside, and we would also be looking, if you’re applying Elliot wave theory three waves to the downside in this particular example, and they’re always counted in threes, and to differentiate between the impulsive and the corrective wave we’re. Now,  looking at ABC in terms of a price move. So, highlighting wave number two, and number four of the impulsive phase are also corrective waves, because those are the lows that are created, because of a correction of price, and that’s just means we get a pullback to that to that low, and that creates our wave number two, and wave number four. So, once we’ve satisfied that we see wave 1 then we see wave 2 we see a push higher at wave 3 we see the pullback at bay 4 then this constitutes Elliot the Elliot wave theory, and where you make a higher at 5, and then you see the reversal in that price action or the corrective second or the corrective wave. So, in addition to that waves 2, and 4 as a result of the impulsive phase are also corrective waves wave 2 corrects wave 1. So, we’re getting this push higher. So, this lower here correct the price action, because we don’t see price action moving in a linear fashion, and it does move in this impulse to the upside followed by a pullback followed by a further impulse followed by a pullback. So, it’s just following that as a narrative but being able to visually identify it on a price chart we have a look at some price charts very shortly to show you this in a little bit more detail. So, just be aware that wave 2 corrects wave 1, and of course wave number 4 corrects wave 3. So, the correction always comes after the impulse, and ABC is the corrective phase of waves 1 to 5. So, this is the corrective segment. Now,  wave 2, and 4 is the individual correction, and then we enter once the price peak at 5, we then enter the corrective segment creating an A, B, and C corrective wave in this example. Now,  other tools can be used to help identifying where a market will pull back, for example, at fib levels. So, you know those that that trade the market using technical indicators that may use fib levels they might draw a fib from the low the recent low to the recent high, and they might be able to gauge where this price action will actually pull back to even at Point a the first corrective wave or Point C which is the second corrective wave pushing lower. So, that can just present with opportunities for traders to actually look to engage with the fib, and there’s obviously many other trading indicators as well, which can be used in a similar fashion that can support the understanding as well, of Elliot wave theory.

So, moving on then to the fact that what’s important, when  you understand the complete structure, and you identify you can identify these five-wave patterns, and you can see them in every chart in some capacity it’s important to understand that you know week you can experience with a very volatile moving chart that waves can repeat themselves on multiple occasions and. So, you can get these smaller waves existing, and these you get your 5 wave impulse followed by your ABC wave correction, and this has the tendency to repeat itself on many occasions especially, if we’re seeing, if we’re in a bit of a trend, and prices are pushing higher again followed by your three-phase correction and. So, the idea is that you can actually get many multiple opportunities of wave repetition, and it can effectively give you a little bit of foresight it’s important to notice what happens in this little phase in here, because what we’re seeing is a reversal in price action where we’re actually creating a series of repetitive waves to the upside followed by a series of repetitive waves to the downside in this particular side of the 5 wave pattern. So, this time we’re creating a five-wave pattern to the downside followed by again just to reiterate myself a three-wave corrective ABC pattern, and then that rolls in once more to an additional impulsive wave but this time to the downside. So, it is important to take on board the Elliott Wave it could be very useful in certain capacities to be able to analyse, and see what’s going on, and of course what you can also, and this is where Elliott Wave can start getting a little bit more difficult, but you can also have larger Elliott Wave signals even over, and above your smaller waves. So, this is effectively a five-way signal, for example, perhaps even on a much bigger timeframe, and you get your corrective phase as well. So, it’s just basically having an understanding of all of these aspects of the five-wave pattern, when it comes to Elliot wave theory okay. So, moving on then to the principle of, and we’ve kind of alluded to it already it’s the fact that you can find waves within waves. So,, if you look at this particular chart here it could be a one-day chart for example will have an impulsive segment where you can clearly identify the waves wave 1 2 3 4, and wave 5, and then you identify the corrective phase of ABC, and that could be on a one-day chart but. Now,  you decide to have a look at a one-hour chart at this point, and what you can see even within one of these phases from 0 to 1 let’s say you can you can really experience on a smaller time frame many more opportunities which exists that that replicate this kind of wave pattern in a form of a phase whereas what you can see on a bigger timeframe is more of a linear move let’s say before you get that corrective pullback, and but you know you can always find waves within waves, because this theory can be applicable to any particular time frame on a price chart, and as the market moves it in favour you can see that this market would look at this kind of phase and will be able to contribute or correlate the impulsive wave followed by again just to repeat myself the corrective wave, and this can happen over, and over, and over. So, just bear in mind the principle of the fact that you can see experience, and identify waves within waves, and that does arm you with a lot of the knowledge, and understanding about Elliot wave theory, and how to go about applying it okay. So, what we want to do is exactly what we want to show you the five-way pattern in practice you know how can you go about identifying you know these levels, and these waves, and what decisions kind of trade, and make to try, and capitalise on them. So, what we’re going to do is we’re going to identify some significant areas we can see that we’re getting a little bit of an uptrend impulse here two-point number one. So, that would be a potential starting point for those traders that study Elliot wave theory creating a corrective wave at point number two then we’ll see that thrust, and this market creates another impulse driving prices to the upside once more at point number three before we would then get a slight corrective wave in this particular market before we get a really nice explosive move in this market to the upside, and what a trader who looks to apply Elliot wave theory does is potentially look to get into these markets at the pullback. So, they’d be looking very closely at this price action here, and determine whether they would look to get in to this market, and again, if we identified a fourth wave pattern they’d be looking for opportunities to buy this market, and as you can see you know that can be to varying degrees of success you might take a small winner, if you took a trade from the corrective wave number two, and as you can see, if you got into these prices at corrective wave number four you would have experienced a really explosive move to the upside.

So, so that is your five-way pattern but in addition to that you will also experience a pullback off the high they’re at five. So, you get your you know your corrective pattern falling into place where you get your low price at a then the markets try to push higher, and they fail to do. So, creating point number B a corrective wave B, and finally, we will see our corrective wave at Point C as well. So, that is the Elliot wave theory in a very practical sense. So, those that trade price action to the upside might then look to look for opportunities to maybe buy at this point or potentially sell at point number B. Now,  they have a variety of different decisions to be made around C. So, this is where you know this is obviously an introduction to Elliot wave theory. So, there is a lot more to Elliot wave theory. So, hopefully, we’re just giving you a basic sort of introduction to what Elliot wave theory is. So, then what we can see just from this general price section as we start entering, and we can see that price has moved to the upside. So, again we start the Elliot wave process potentially giving opportunities for traders at this point to maybe look to buy at these levels at two, and four, and of course it’s a riskier trade but as opportunities to sell at one, and three as well, however, you must bear in mind that there are consequences, when  it comes to risk-reward as well, depending on whether you’re trading the impulsive phase or whether you’re trading the corrective phase. So, that’s just the potential application of Elliot wave theory to a price chart was moving which is moving to the upside, and which happens to be the current pound dollar price chart, and let’s show you the same situation, and this just happens to be the dollar-yen price chart very current price chart, and what we can see from this is we can see that prices are this time moving lower. So, we create the first wave we get a pullback we get a corrective pullback at point number two the markets then move lower at three they pull back to four, and they create a low this time, because whereas before we were looking for a trending market to push lower sorry higher. Now,  we’re looking for a trending market to actually push lower. So, in this example. Now,  we’d be looking for maybe opportunities to sell at two, and four. So, and again identifying these opportunities can be somewhat difficult, you might be presented with opportunities to buy off these lows; however, again that can impact a trader’s ability to manage risk effectively. So, we will discuss a few of these difficulties very shortly but that is the Elliott Wave pattern, and applying it to a market that is moving to the downside, and of course, we get that corrective phase once more. So, we get to pull back to point a prices try to break lower, and they fail to do. So, we get a point B, and then we get our final point C in this market again presenting some very interesting opportunities to different traders at different price points, and different wave points as well, whether it’s impulsive or whether it’s corrective okay. So, let me just take this off the screen, and let’s discuss some of their the difficulties that traders can experience, when  they look to apply Elliot wave theory, and there’s just a few of them to be aware of just going through the last couple of examples there I’m sure you may be sitting there looking at our screen, and perhaps suggesting right well, how, and why did you decide on those particular points?

And how would a trader actually truly look to capitalise on it, because the reality is there’s actually a lot more to Elliot wave theory in terms of your practical application, and, because of that it can be very difficult to use, and interpret for new experience traders. So, it is definitely more for those that have a little bit more experience understanding seeing and identifying price movements. So, there it is regarded that those that have considerably more experience of understanding price movement, and price action might be in a position to be able to apply Elliot wave theory in a little bit of an easier format it can also be difficult to identify the beginning of a wave as well. So, again I’m sure you’ve probably looked at those charts, and said why did you start a point one and. Now,  we do. So, for very specific reasons but again a lot of that is more of an advanced sort of aspect to Elliot wave theory traders can struggle to identify entries, and exit prices as a result of identifying perhaps a corrective low point two or point four whatever the case may be, and actually looking to trade that signal is a little bit more difficult, and finally traders do not always understand the effectiveness as a tool from a risk management perspective, and actually that’s a really quite important one because, if you create a corrective low at 0.2 or 0.4, and then those lows can be used as very accurate price points to utilise from a risk management perspective only, if that trader is has a comprehensive understanding of risk management because, if you get a break of those corrective lows then the principal of the Elliott Wave no longer exists this is this really with some of the difficulties that traders can have it would create what’s called structural failures in these markets, and that would actually imply that something else is going to happen in that market, ie that first corrective phase fails in terms of impulsing, and driving prices to the upside it actually turns around reverses it creates that structural failure, and actually then that market is the likely or outcome is for that market to actually be pushing lower instead of initially pulling higher, if we replying Elliot wave theory okay. So, that just about concludes this introductory session – Elliot wave theory. So, we’ve had a brief introduction. So, hopefully, you. Now,  know who he is, and what the basic principle of the theory is about we’ve had a look at the five-wave pattern, and that’s broken down in impulsive waves corrective waves, and wav now repetition, and also the understanding that you, you may be able to identify and see waves within waves, and Elliot wave theory as well, in practice applying it to a price chart, and then just touching upon some of the difficulties that traders can have, when  applying Elliot wave theory. So, on that note that does conclude this particular webinar. So, thank you very much for joining us on this installment of courses on demand brought to you by Forex dot Academy, and we do hope to see you all very soon. Bye for now.

Categories
Forex Courses on Demand

The Biggest Fundamental Events Analysis & Case Study

Hello, and welcome to this latest edition of courses on demand, brought to you by Forex dot Academy! In this course, we will be discussing those real-life case studies, considering fundamental analysis. Now there is, of course, inherent risk when deciding to trade the financial markets. So, just before we begin, please do take a moment to familiarise yourself with the following disclaimer.

So, what, are we going to cover exactly in this webinar? Well, we’re going to discuss the overall economic environment of the markets that we trade, and then we’re gonna break down some really key or significant economic events through the course of the last ten years that really made a huge impact in actually changing how traders, perceive the markets. Changing the overall formulation of risk on or risk of approaches to investing, and trading, and obviously provide us with opportunity both in the long term, and some volatility in the short term, as well in terms of our study, as fundamental traders, or I suppose students of the markets it is essential that we know what we’re doing in these environments, and that leads us on to discuss whether we’re deciding to trade the bond markets or Forex pairs we need to know how these large economic events will affect the perception, are the real decisions that other market participants will involve themselves with, when deciding to put on positions, and trade these markets, and others no different from ourselves. So, let’s delve in to really discussing first, and foremost the trading the economic environment, and the trading of the macroeconomy. So, why does this matter? Why does the economy matter to us? As traders, the financial markets reflect the overall performance of the economy financial equity indices represent the overall business health of an economic region and their strength, and weakness bears a close connection to gross domestic product other asset classes such, as commodities bonds, and stocks, are therefore affected by the level of business on with activity circulating in the economy okay. So, as an overall growth perspective in terms of trading in the economy are those financial analysts out there they look to the GDP the gross domestic product to see whether we’re in a recessionary recovery or perhaps a boom period of growth, and that will indicate to us how strong an economy is in relation to its competitors, as well how do large economic events help shape the global economic outlook, and that will be the point of our lesson here large economic events can fundamentally change the way in which investors, and traders, perceive future economic growth, and stability they often cause a dramatic change in the level of risk and uncertainty over asset pricing, and that’s both in the short-term, and long-term, and we have seen that quite significantly in some of the topics we will discuss during the webinar the Brexit decision the massive depreciation of sterling, and the US election there with Donald Trump caused a lot of volatility, and then we’ve seen a total repricing of assets, as well. So, let’s delve into this in a lot more detail but first, and foremost, as us traders, how do we how do we perceive or how do we read the news how does it affect our opinion perhaps on the economy whether we have short ideas in terms of trading an asset like perhaps the global equity index for a two-month period how do we actually take this economic news in or these shifts in global sentiment into our trading let’s look at this for a moment we have a trader here concerned about some figures that he has heard or seen sort of releasing into the news the US economy expanded at an annualised two point nine percent on-quarter in the last three months of 2017 that’s higher than two point five percent in the second estimate on beating market expectations of 2.7 percent hmm personal consumption expenditures, are privately inventory investment, are revised up okay. So, we have the personal consumption expenditures, and private inventory investment, are revised up. So, we’re sitting here, as traders, were involving herself in this economic environment to make trading decisions how do we speculate, and how do we really try, and gather an understanding of what this means well this could cause volatility in the forex markets of course in the short term we can see different pricing in terms of what domestic nations were trading. And for trading as apparent against the US dollar we need to know, if that U.S. increase in gross domestic product, how that might affect the dollar in relation to those other currencies obviously we might love to trade the equities, are our baby we’ve got a long US equity trade here, if we have positive growth in the US economy, as well. So, there’s our light bulb. It’s working off some new trading ideas, and that is what we do as traders. Now that’s how we understand and trading this economic environment. So, let’s look at what we have here, and we sort of touched on it in some detail u.s. GDP growth rate and we have EU unemployment rate to charge to the left-h, and side our job, as traders, is to really bring this information over the two charts to the left onto our price action chart to the right, and speculate get involved trading these markets. So, first, and foremost GDP growth.

Well, we have a figure there relative in the last quarter of 2017. Quite strong with 2.9 percent. We can see how it relates to overall performance throughout the year, is it perhaps a bit in terms of estimates we know that it was, that will lead us to actually look for buying opportunities? And we can see the market has reflected in such a way we looked in perhaps for an EU unemployment rate it is continuously over the long-term going down there’s a good sign for us traders, here in Europe who, are considered to trade more often those European indices, are perhaps Forex pairs or any sort of relevance in terms of European markets that it’s supposed to be, and certainly will be in terms of fundamental decision-making be supportive. So, that’s what we do here in terms of trading the economic environment we look at these economic events or these economic data to formulate trading decisions over the medium to long-term in delving in understanding more about the economy we will become better traders. Now let’s delve into our real case a study number one which is of course Bragg’s it I’m sure most of us, are very familiar with this situation it was due to a referendum there ‪on the 23rd of June‬ 2016 the UK voted to leave the European Union this was a massive shock to the financial markets not only because most how expected the UK electorate would overwhelmingly support staying within EU but because it would have astronomical ramifications in how the UK would conduct business, and trade with its neighboring economies okay. So, that’s going to have long-term effects on trade relations in the short-term it generated a huge level of uncertainty over future trade relations continued economic growth employment, and immigration between nations, and of course political discord which might I say continues today such a fundamental shift in domestic policy for the UK government was sure to have very real effects on the financial markets particularly those securities related to Britain. So, the question I would like to pose, when we decide to fundamentally analyse these case studies is what fundamental changes took place, and what trading opportunities did it provide, and that’s really the point of fundamental analysis, as well remember it’s not to necessarily be correct it’s to make trading decisions, and look for those opportunities in the marketplaces. So, first, and foremost obviously an event of this magnitude of this scale is going to cause short-term, and long-term sentiment volatility whether you’re a Forex trader you’re going to know that’s going to cause more opportunity for you or whether it perhaps you’re holding long equity positions in the UK or across Europe obviously that’s going to have a really negative effect with the volatility in the short-term on your position, and potentially it could lead to some future opportunities in terms of speculation in trying to price in the surprises scenario, and obviously then the most immediate effect the financial markets would have been the depreciation a quick depreciation in sterling from around 147 to 132. So, quite a drastic move, and obviously that led to a more longer-term approach in terms of long-term depreciation in the currency that led them to a re-evaluation of the UK economy, and obviously if you’re an equity trader to a total repricing of UK equity markets. So, obviously we have seen a short-term volatility fundamentally we know that’s going to cause a lot of concern in the financial markets but, as the markets start to repress these moves these economic case events that we studied that leads to a total shift or a total repricing in such assets in particular here, as we discuss the UK equity markets just think of ourselves, as potential UK equity investors perhaps only owning portfolio of stocks there in the UK all of these shares, are going to be revalued based on the change in the actual currency itself the indicative currency that these, are priced in. So, let’s look at the chart here in front, and actually assess this fundamental case in a little more detail in terms of the price action well in front we have the Pound u.s. dollar Forex cable market, and we can see obviously the big engulfing con of the sticks out like a sore thumb there a depreciation or devaluation of that currency from 147 to 132 almost overnight. So, we have it a 10.2 percent drop in a 48-hour period that is of real concern for forex traders, particularly obviously, if you’re trading those currency pairs valued across the pound sterling pairs, and obviously, those assets that, are related to those pairs. So, any real commodities that come from the UK whether they’re import or export commodities any assets such, as the equity markets mentioned would have been gravely affected, and this is obviously going to change the entire sentiment of the market in the short-term, as the market starts to source to really reprice the risks reprice the uncertainty in terms of how the political discord will ensue on what it might mean for economic growth within the eurozone here we have the bracelet shock then we can see the intense volatility there adjust by observing the candlestick structure the Japanese candlestick structures during the weekend obviously we see the footsie closes on Friday evening at six thous, and three hundred, and fifty-eight, and after the weekend after the Bragg’s referendum vote it opens at five thous, and seven hundred, and seventy. So, that’s sort of mid-range in that very large candle there you would have seen the daily price action trader, and how’s the mantra to start to read prices move with the currency devaluation to see how it actually affects some of the big earners in there the export boom companies, and starting to actually repress the performance of the faulty, as an equity index we see the price move out quite sternly, and obviously in three to four period come back up to new levels then we see the brexit after months the markets totally revalue the composition of the footsie 100 index, are suggested, and traders, pricing that future value of export firm growth, and this inevitably is something that is quite a shock to the market, ironically leads to a period of boom within the UK economy, in terms of the market structure repricing those assets, and in terms of actually looking at the trend in front we can see it actually fundamentally, this fundamental case serves to support economic growth to the upside. ‬

So, let’s move on to our real case study number two, and discuss the Swiss National Bank the Swiss National Bank is responsible for the monetary policy of Switzerland, and just like any other Bank it does aim to provide growth, and stability of the domestic economy by working towards target inflation rates, and price stability considering the geographical significance of Switzerland, and it is very important that the nation, are strong, and perhaps favourable trade relations with its European neighbours even though it does not share the domestic currency with the single euro mechanism the SNP or Swiss National Bank announced on the 6th of September 2011 that it intended to address changes in the value of the Swiss franc to the euro aimed at depreciating the currency cap to 120. So, as to remain competitive to its neighbours then on the 5th of January 2015 the Swiss National Bank made an unexpected announcement to the markets that they believe the euro crisis had passed, and that they were no longer following the euro currency arrangement. So, let’s take a step back for a moment, and try, and assess this scenario fundamentally for the nation of Switzerland, if we think we have at this time a euro crisis where we have negative interest rates across some regions, and obviously there’s a lot of concern that this euro sovereign debt crisis is going to deepen we see a country geographically like Switzerland, and right in the centre of all this controversy, and they want to continue their growth, and continue their business amongst the calamity what they’ll want to do, if we think of the composition of the SMA which is the Swiss market index the leading equity index there in Switzerland, and we have companies like Nestle the chocolate maker then we have Novartis Roche some of these companies, are huge exporters in terms of global dem, and, and obviously would do most of their business, and in the eurozone so. Now that we know fundamentally the reason for the Swiss National Bank pegging their currency to 120 euro, and obviously the aftermath of actually Pauline a peg how can we assess them, and look to see what happened in the currency markets well we have here the euro Swiss franc, and inevitably we can see an absolutely huge move to the downside that prism was a huge amount of fear, and uncertainty and obviously the fact that it was such a sudden announcement is going to cause increased volatility to the downside we’ve seen literally the floor has been pulled from this market the support has broken at 120 Fundamental was the case, and really the notion or the directive from Thomas Jordan, and from a Swiss National Bank to actually send this currency back to a level of equilibrium in terms of national domestic currency in relation to the eurozone it it’s his biggest partner in terms of trade relations let’s move forward, and to discuss in our real case study number three, and that is the infamous collapse of Lehman Brothers. So,, if you have been a financial trader, are just genuinely interested in the markets, and the economies over the past 10 15 years or generally just interested in the financial recession, and crisis that we had there this is certainly a case study of interest Lehman Brothers was one of the largest investment banks on Wall Street it was perhaps the first big bank to capitalise on the growth of the US mortgage organisation market where massive amounts of profits were being made on u.s. home loans by 2006 it had merged with many active lenders across America. So, much that it had appeared to do almost all of its investment business in collateralised real estate, and only a portion in traditional financial investment this era of investment growth coincided with the rise of the shadow banking industry, and financial leveraging that monumentally increased Lehman’s exposure to the mortgage market. So, in a little detail, if you’re unaware of the shadow banking industry, you may have seen the movie ‪the big short‬ it’s simply where all of these financial firms learned to package, and bar that together reprices it was good that settled on throughout the financial system. So, that Laird obviously to all of this being joined collectively, and spread systemically throughout the system times of economic boom ensured that such investments were profitable however the significant portion of its assets allocated to managing housing loans meant they were vulnerable to a market downturn, and of course more vulnerable to an eventual market downturn in the housing market itself which is eventually what happened during the later months of 2007, and early 2008 it was clear there had been a housing bubble all led by the easy availability of credit, and the ease at which was to get a mortgage loan accepted property prices quickly began to fall, and millions of mortgages became unaffordable, and un-payable overnight, and that happened millions of Americans wear their homes effectively their mortgages turned into negative equity over a very short space of time while enjoying profits during the boom Lehman’s over leveraged exposure to the mortgage market meant that a 4% decline in the value of its assets would entirely eliminate its book value of equity on the 15th of September 2008 Lehman Brothers filed for chapter 11 bankruptcy protection it had accumulated a total holding of over 600 billion in US assets 600 billion dollars in US assets quite a substantial amount the collapse of Lehman Brothers was not only an economic disaster for the US housing market it brought into question the systemic risk these financial institutions caused to the entire global financial system another certainly really the story of this case, and really the bullet point in terms of being a student of the financial markets, when you study the shell banking industry, and these banks the question at the time was, are these banks perhaps too big to fail, and of course there was discussion at the time between those in government, and those in the private sector whether they could actually floater or keep blaming brothers above water, and how that would actually affect the financial system they agreed at the time that they simply could not they also went on to build many other banks art but let Lehman Brothers evidently collapse it being the largest investment bank on Wall Street. So, a very significant period of history in the U.S. let’s look at how this real case study the actual collapse of Lehman Brothers affected the markets in looking at the economy we have here the S&P; 500 daily chart over a long period of time we can see the market downturn shows us a lot of volatility another is representative of the serious amount of concern or uncertainty that a market participants, and traders, are feeling, as we see the fresh news flow perhaps mortgages denied housing sector fall outs all of these things will come into the news and cause volatility to the downside. So, we see the downside with the reality of the housing bubble itself it became clear banks, and financial institutions where indeed overexposed but particularly the size the too-big-to-fail phenomenon, and really affected the downturn, and was the catalyst for price movement, when it became clear that Lehman Brothers was simply not too big to feel under the entire banking system was indeed in jeopardy, and that’s what we’ve seen in terms of the price follow-through, and I inevitably caused the catalyst for the 2008, and global recession in some more detail in terms of analysing this fundamentally what does this mean for us, as traders, over the long-term we know that as investors in the community you’ll generally go through four to five periods within your own lifespan also considering how long you live, but we do go through the business cycle periods of booms, and busts, slumps, and obviously there, are intermittent, and recessionary periods within that. ‬

So, here within GDP we have our boom, and bust cycles we see the collapse of Lehman Brothers just entered the markets they’re causing a bit of a catalyst, as the market free price this whole phenomenon we see a large investment bank take the hit collapse due to the massive it mortgage exposure in this in this space, and then we obviously see the slump with our financial crisis there 2008, and continuing on to even deeper slum periods. Now in aiming fundamentally to analyse why exactly or one reason why we were able to come out of this recession area period, and back into a recovery or a period of economic boom we can study real case study number four, and others quantitative easing. Quantitative easing programs were first introduced by Japan in 2007 to battle deflation in the economy. The aim was to flow the domestic market with new liquidity to promote learning and stimulate the economy. So, generally speaking, they do this through the bond markets through the new issuance of debt, as a result of the global financial crisis of 2008 many global economy is still faced financial meltdown with worsening economic conditions unlimited credit availability at the time we refer to this, as the credit crunch. So, for many traders, out there I’m sure you’re familiar with the phrase there was intense volatility in the forex markets, as well, as the equity markets, and of course we felt this everyone felt this in terms of a pinch on the pocket with the objective of boosting the economy in the United States launched a program of quantitative easing in 2008 followed by the UK in 2009, and of course the European Union later the same year each central bank took on large-scale asset purchases assuming the burden of risk for their economies, and released fresh healthier liquidity back into the markets in order to stimulate lending and growth. So, let us refer back to our business cycle what we, are trying to do is actually recover from this economic recession this global financial crisis that has systemically affected our financial institutions, and caused unemployment across many nations, and effectively slowed growth what we, are effectively doing is trying to stimulate growth by increasing the money flow into the economy swapping a bad debt with good debt, and trying to increase lending. So, that consumer spending growth unemployment regains its stature in our economies here we have the financial crisis, and coming on from that with the period of slump there we introduced QE 1 that’s commencing in November 2008 with the US Federal Reserve started buying 600 billion in mortgage-backed securities on one point seven trillion dollars of bank debt then we have qe2 that’s November 2010, and that’s another 600 billion dollars of mortgage-backed securities in that purchasing program, and then, of course, September 2013 the US Fed launched 40 billion dollars a month open-ended bond purchasing program analyst to flood the market with new liquidity to increase that landing in the private sector across the corporate finance world, and then after a long period of prolonged period of perhaps six years of quantitative easing we see these factors start to come into effect where money supply has increased it is filtered through the rest of the economy we’re starting to see these finance institutions become healthier they’re starting to lend more to smaller business enterprises who in turn create business to hire staff which actually increases in the labor market, and then obviously consumer spending, and manufacturing start to grow, as well this all leads to the total financial recovery story, and we’re currently obviously just coming into a boom period where we’ve seen a very strong market bull run for the last two to three years. So, how did the financial markets react to this fundamental story of quantitative easing well obviously they know fundamentally they’re going to be supportive by the government, and that is the primary concern or issue with QE more generally speaking market prices, are said to be discovered price discovery is a function of participation between buyers, and sellers. So, this is a very unique period of our history where actually government institutions, and central banks directly interfered with that price discovery over the long term obviously it’s in effect to help the economy and stimulate growth, but in terms of pricing assets it led to support, and obviously long term price structures to the upside given the economic growth, and health of the economy. So, here in front we have the S&P; 500 this is the largest equity index in the U.S.A consisting of the 500 the top 500 companies by market capitalisation to the left we can see obviously the financial crisis caused a huge shift of market sentiment, and obviously we see the inevitable recession that we have bringing prices way down to new lows there, and February 2009 then what we see is a period of recovery just after but it does take time for the recovery to come in, and obviously this is a fundamental discussion of quantitative easing how long will it come into effect how long will those prices and a change is starting to feed into the economy but we do see sustained both over the long-term period, when looking at her sp500 given that this is a global financial crisis the question I would like to ask, and really have you, and observers how does it affect the rest of the global equities out there in the world let’s have a view here we have the nasdaq-100 we can see that the price structure is very similar we have the 4100 again we have a very strong move to the downside, and we can see, as we move across all these global equity indices the larger story of quantitative easing is a function of actually looking to support global growth that is a very similar story in terms of the fundamental base of quantitative easing, but we can see there, are little time shifts, and that’s more relative to the fact that QE was introduced earlier in the United States, and then in the UK then in the European Union we see these prices start to stabilise, and it never will be moved to the upside over the long run. So, let us delve into a real case study number five the European sovereign debt crisis the European sovereign debt crisis that took place in the European Union towards the end of 2009, when it became clear that most eurozone economies were still struggling with the challenge of economic recovery many nations had seen an increase in sovereign debt, as a result of banking system bailouts, and were unable to pay or refinance the government debt. So, that is the key, when, when really understanding at the function of debt or our interest rates the ability to actually repay those deaths, are on loans over a long period of time to underst, and the complexity of this situation we must underst, and how inextricably linked long-term interest rates, are to macro economic health a nation’s interest rate reflects the risk associated with its ability to lend to the financial markets. So, of course in layman’s terms those countries who have a higher perception of risk perhaps they’re going through tough times economically in this particular case we have Irel, and, and Greece of course Italy Portugal they were finding it very difficult to repay their debts, and obviously that risk involved, and actually purchasing alone perhaps a 10-year bond from the from one of those governments has an added perception of risk, and obviously would require a repayment of a higher level of return. So, it is a simple risk reward ratio, when deciding my bonds or priced unlevel of interest rates to those bonds with many EU nations unable to refinance their debt massive uncertainty Andriod the bond markets causing dramatic volatility, and a surge in many domestic interest rates this effectively collapsed the bond market some countries, and led to a huge increase in unemployment for those worse affected. So, effectively what we were witnessing in the European sovereign debt crisis was the inability for many of these nations to effectively pay back their debt to the European Central Bank many of these countries had obviously taken bailouts, and we’re giving bailouts by the ECB to help stimulate domestic growth in their national economy but of course these, are loans, and these have to be pared back, when the economic performance of these nations didn’t it didn’t seem to grow in the same perspective of the bailouts, and obviously they were experienced a serious level of austerity and difficulty in doing. So, and in growing their economy, and recovering those challenges came to the front where effectively it was very difficult to pare back and make their obligations in terms of paying back debt to the European Central Bank. So, let’s look at our case study chart here what we have is long-term interest rates over the period from July 2008 to January 2018. Now in analysing or long-term interest rate short we can see that there, are two countries that really stick out for us, and both Portugal with the blue line, and Irel, and with the green line respectively what this chart tells us really is that there’s a large spike in interest rates over the period roughly July 2010 to October 2012 that would present problems for Irel, and, and Portugal in terms of trying to refinance their government operations in the bond markets giving that they would have to pay back a level of percentage interest on perhaps two h, and % we have 12.5 a peak in Irel, and they’re roughly around 13 14 % peak there with Portugal reflecting of course the overall uncertainty or perhaps perception that they could not effectively repair these loans or their bonds back in a given period of time another all constitutes the level of risk these economies, are facing at the moment one of the countries not included in our long-term interest rate short give it’s a real case study in terms of study in European sovereign debt crisis is Greece, of course, Greece had been hit very hard by the financial crisis, and it’s trouble to remain competitive, as a Euro trading partner in the eurozone was really pushed into question, and this is because really they got bailed out time, and time again, and could not repay their debt, and almost went bust several times.

So, what I’d like to do is actually pinpoint this, and I’ll call it in black that we can annotate ourselves here we have April 2010 8% which is in, and around this period we have around 10% we can see already that it is leading the way in terms of this increased volatility on long-term interest rate spike, and to the upside that is again just simply an overall reflection of the uncertainty of the peril of their economy at this stage, and their inability to effectively pay off any debt that they may assume then we have April 2011, if we scroll up, and actually look to plot the point we have it around 13%. So, they’ll just be above here again it’s going to plot high from our Irish debt at that point, and then April 2012 27% which is an astronomical figure, and I’d like to detail that just to you in terms of what it means for the financial markets, and in terms of potentially loaning, are looking to borrow from the Greek economy 27% we have April 2012 mother’s up here, and again we’ll just put it at the top of our chart what that means effectively is, if you were to assume some finance from Greece, and effectively purchased, and other time hypothetically one of their 10-year bonds they would effectively be paying an interest rate on the bond of 27 percent which is an astronomical figure in terms of generally pricing a bond, and obviously paying an interest over a long period of time with 27 percent it’s absolutely huge. So, I just show you the level of risk or uncertainty the financial markets have priced in when understanding that the level of peril the Greek economy was actually in at this time. So, all of these fundamental cases served actually to help us, as traders, not only for the knowledge they served to really give us an idea of the overall economic environment within which we trade it is the job of the financial trader to speculate on the movement of price these prices relate to many different assets but also a very common relationship to the performance of the global on domestic economy from which they, are natured become not therefore effectively do our job, if we do not have a fundamental grasp on how economic events can shape the very environment we ourselves conduct business in once we better understand, and the effects of news, and economic activity we will become more knowledgeable about our trading conditions, and therefore more assured in our trading decisions. So, that brings us to the end of our real case studies fundamental analysis webinar, let’s go over a quick review of what we learned through the webinar trading an economic environment why it is. So, important to understand, and, and grasp the overall economy, and how it changes the risk-on risk-off approach to your trading, and really hard facts all of these different assets that we trade, as financial traders, we then went through different case studies over the last 15 years we have Brexit the Swiss National Bank removing the currency paid to the Euro Lehman Brothers, and effectively a lot of detailed discussion on the financial crisis of 2008 that let us effectively into discussing the recovery mechanism of quantitative easing, and then we touched upon the European sovereign-debt crisis how that may affect liquidity, and how it certainly affected the bond markets, and perceptions of risk for domestic economies, and potentially the eurozone a growth perspective overall. So, all that is left for me to do is thank you very much for joining us on this instalment of courses on demand, and brought to you before I start economy we do hope to see you very soon bye for now!

Categories
Forex Courses on Demand

Introducction To Fibonacci – The Key To Unlocking Your Trading Potential


Hello, and welcome to this latest edition of courses on demand brought to you by Forex dot Academy. In this course, we will be discussing an introduction to Fibonacci. There is, of course, in risk when trading in the financial market. So, just before, we do begin please take a moment to familiarise yourself with the following disclaimer.

So, in this lesson, what, we hope to cover is really develop a basis with the introduction to Fibonacci. What is it all about and how do, we use it? As a technical indicator, we’ll discuss its mathematical significance, and it does actually have some significance in many walks of life in nature. We will discuss it as a technical indicator in relation to its support and resistance. So, that is really what It does. It looks for these areas within the market that, we look for trading opportunities, on congestion of price action around levels of support, and resistance. We will be really discussing how to use it as an indicator. Looking at these Fibonacci levels how to use it from high to low in the markets, and how significant. It can be, as a technical influence on our trading, and then we’ll be discussing some of the limitations obviously, as a technical indicator many other technical indicators. As technical analysts, we know and accept that they have various limitations. We’ll discuss the limitations of Fibonacci retracements themselves. So, let’s delve into our introduction to Fibonacci retracement levels, and these levels are very important to technical traders, as the highlight long-term support, and resistance levels that often identify potential market reversals. It is perhaps one of the most commonly used techniques that indicators, and us such generates additional interest when the market rates in, and around these levels okay. So, as technical traders, we are aware of these levels within the market, and that actually generates an additional level of interest, and is often a self-fulfilling prophecy, as price movement tends to react quite volatile and shift away from such levels. As an indicator, it is more applicable to trading longer time frames and is not suitable for trading shorter time frame analysis, for example, five-minute price action charting. Okay, however, given its objective in identifying potential reversal signals. It does work much better in markets that experience long-term volatility, and continued price change, and we will discuss this in much more detail throughout the webinar.

It is much more applicable for those markets that experienced volatility obviously, if we’re looking to trade off levels were, we see market pullbacks, we see levels of contraction, and potentially look to buy from those areas, if it’s selling off in that direction that fall eternity will actually give us opportunity with our Fibonacci retracement levels. So, these Fibonacci retracement levels, they alert traders to possible support and resistance areas in the market. A possible reversal is based on the prior move.

Okay, so, we’re looking potentially for market pullback to reverse, and the trading decision a bounce is expected to retrace a portion of the prior decline while a correction is expected to retrace a portion of the prior advance when a market pullback occurs technical traders identify a retracement levels for monitoring okay, and because, as I said, they are a self-fulfilling prophecy many traders are speculating in, and around these areas, we know how they’re going to react let’s say potentially the market is trading at all-time highs, and it pulls back to a 50 percent a level of retracement, we know that is very significant, and an area, where many traders are indeed monitoring the Fibonacci retracement has of course mathematical significance. It derives its values from a series of numbers these numbers were developed by Italian mathematician Leonardo of Pisa they’re in 1175 to 1250. So, those are the Fibonacci numbers they’re ranging from 1 to 144, and of course, they continue in the Fibonacci sequence, they are very significant, and, we often see them in many natural Universal proportions both mathematicians, and scientists conclude that their significance you can see them, and, as you look at the image there to the left resembles almost a share like, and make sure that you see on a beach with the formation of the swirl the Fibonacci swirl very famous indeed, they are important to us, as traders, as, they can identify these possible levels in the market support or resistance traders often trade these levels or look for breaker, and opportunities. So, when, we see them bounce from, as support to resistance within a level, they can often range, and that can cause range buying opportunities for a long consistent period of time or perhaps when these eventually break down, we can look for these breakout opportunities there is an acknowledgement of such levels often because trading congestion that leads to I suppose a lot of interest within the markets at these key for Fibonacci levels that’s generally what we’ll see there are a lot of speculative traders looking to trade these levels, and, as prices congest down to these levels that’s why you often see a breakouts after a mature trading trend almost expires from the level you can see a quick shift a quick burst of a volume in, and around these levels. 

So, they’re technically very significant. Let’s discuss our Fibonacci levels, as technical support, and resistance for a moment in identifying in January levels of support, and resistance this obviously helps traders to discover both floors, and ceilings in the market okay. So, these prices are often supported by floors unresisted by the ceilings just like our house there, we have an image of the house, where the floor is actually supporting I say your body weight, and everything in the house on the ceiling would be resisting anything from the outside have perhaps weather or rain anything like that a downward pressure on the house itself these levels are particularly important over long periods of time, they are never a sure signal just like many other technical indicators prices often breakthrough such levels with strength, and, we see that, as a breaker, and, where exactly this is the common question, we get asked, as trading educators, where exactly should support, and resistance levels be pray be placed in the markets. So, here, we have a gold market, and, we can observe just technically, where you see our technical levels of support, and resistance, and it’s really not too difficult a question to ask why do, we choose these levels of support or resistance well, as, we look at the gold market we’re looking at the daily comments like structure albeit it’s over a long period of time, we can see that there are very significant areas or inflection points within these markets, we can see, we have a long-time high in, and around, and when, we have our level of support one-three-five-six, and of course, we have some very strong bounces from such an area. So, what I’d like to do is actually highlight some of these areas within the market here these areas, of course, I’m going hole we’re back to 2014 it’s technically significant for us. It is a long-time high in regards to the last three years of price action, and obviously the market has concluded that, It cannot break these highs for a long period of time that would lead us to believe that this level of support or resistance either one-three-five-six level is technically significant but, we can see throughout that there are some very important price inflection points here would be another level where we can see yes the market traded down all but a few times but. It punched quite strongly from these levels did break it on several occasions, but you can see over the long term. It does provide some real technical support, and, we get some very consistent bounces from the area these areas can convey an or these bounces can actually only last for a I suppose a short period of time, as, we see our next level of support holds up quite well over many significant areas within the market. 

So, these are genuine levels of support, and resistance over the long term in the markets that seem to hold up, and quite well how does this relate in terms of ahead establishing the Fibonacci retracements well that is the real focus of Fibonacci retracement. It is to look for further levels of technical support, and resistance that can give you more evidence to actually look a tradeoff these areas or levels. So, as I move across to in the price chart here this is the dollar-yen daily chart the question I would like to pose for technical traders is how do we identify genuine levels of support, and resistance within the markets well let’s try, and look at, and just visibly see for a moon, if, we can see some highs, and lows over the price action that can give us our own identifiable levels of support of resistance obviously in observing these price action charts, we can see initially that some will be more significant than others. So, here, we have three very strong structured highs, and lows within the markets and they’re providing some technical support, and within this technical support, we have about a few various branches that are providing perhaps some shorter time levels of support and resistance. So, just by observing the price section chart what, we can do is look at these previous highs, and lows existing in the markets to give some technical at January levels of support, and resistance let’s look at identifying this technical support, and resistance areas over asset classes here on what, we have in front of us is the German DAX it’s an equity index in Europe, and, we have daily price action from left to right, we can see already, we have placed an overlay of some genuine levels of support, and resistance again they’re based on previous highs, and lows which give us a very strong inflection points within the markets what, we can see here is that we have a ceiling that is actually providing resistance over a sustained period of time, and, as the market trades up through, and breaks that level that ceiling then becomes a floor in the market. So, it’s very important to note that, as, we trade the markets can break through these levels, and obviously once the breakout occurs that previous level of support and resistance has actually faltered, and can actually change or shift to become a new level of support or resistance in the market 

That again provides us with trading opportunity, as, we look to more relative price action we’ve seen a very strong break to the downside in this German DAX market, and that breakout opportunity has moved quite swiftly in terms of the price, and that’s generally what can occur in these markets we’ve seen the floor here. It provided support over a sustained period of time the market, and trade up to new high reverted from new highs, and with that weakness looking at the Japanese the structure of that Japanese candlestick, we see a very strong consistent breakthrough to the downside over of our new floor here, we have the gold market in front of us again, if, we look at the price section its daily candlesticks, and moving from left to right over a long consistent period of time what, we can see is a technical overlay is actually a Fibonacci retracement, and it is extending from a recent high to low point. So, that’s how we actually use these Fibonacci indicators, we look for a recent a real high or low point or a high to low, and actually stretch the indicator from those areas that stretch across our Fibonacci retracement levels of support, and resistance. So, it creates these retracement support levels, as a function of the Fibonacci numbers, as a technical indicator. It works better for particular asset classes, and, we will discuss that again in more detail, and the question I would like to pose is what happens next, we can see the blue circle indicating almost relative price action, and it is our 23.6 Fibonacci retracement level well what happens next, we know that there could be a significant move from this level, we could see a points up to new highs again or, we could see the price break down I have from our Fibonacci retracement level right the whole way down to 38.2 potentially lower over 50% retracement level. So, let’s branch across to a different asset class here in front, we have the US dollars are, and the question again I would like to pose here, where exactly do, we place the Fibonacci retracement indicator, if, we remember back to the previous slide we’re looking for a high, and low within this market something that can give us a real genuine insight, as to, where the Fibonacci numbers may be significant we’re not looking to perhaps pick a high, and a low from the past week we’re looking for an overall a genuine level of reflection over that consistent period of trading looking at these daily candlesticks high, and low that can give us a subjective level to, where the indicator is more observable. So, here, as, we input our indicator ins in the market, we can see the most recent long term high in the most recent long term lows are the most significant areas in which to place this Fibonacci indicator. So, let’s delve into the actual study of Fibonacci retracement, as a technical indicator in terms of what it means for our trading notice that I’ve used this market before quite a few times the gold market because gold is quite significant in terms of technically adhering to the Fibonacci retracement level, and again I wanted to use this because it is a good example, to use the indicator, and actually applying it to the markets. Notice in this chart, now, that I have my Fibonacci level, as the second most recent high there, and I want to really give you this, as an indicator in terms of high price section moves, as, we look to trade. 

So, let’s just say for example, we begin trading where, we have our begin trading point marked how could, we look to perhaps trade this in terms of looking for levels of support, and resistance, and pullbacks within the market, and actually looking to trade, and corrections or our bounces from such levels will be, we have here our green circles here which actually give us very good strong signals to trade this market, we can look to buy or sell, as the market trades up or down between our indicator levels. So, very good term structures indeed but notice again that, we have some areas, where the signal actually is a pure signal on. It actually gives us some losing trades, if, we decided how it decided to take these trading positions on. So, there is a level of inconsistency with the indicator itself and, if we hadn’t started other begin trading signal there, we would have made have various good trades, and a few bad trades, as well. So, there is that level of inconsistency again, as, we approach our most recent price action the question is often well what happens here what’s going to happen next, and all, we can do is observe the price actually ask technical traders looking for closing perhaps the structure of the Japanese candlesticks – – perhaps volume, and momentum shifts to see, if we can get more of a signal that this market will actually bounce from this level or break through it, we know that it’s technically significant and that many other traders are focusing on monitoring their technical trading decisions around this retracement level. It is the awareness of these Fibonacci levels therefore that the markets often focus their attention on this can then become a self-fulfilling prophecy, as traders observe price action around these levels, and that leads us nicely on them to discussing the limitations of Fibonacci retracement, as a technical indicator the underlying principle of any Fibonacci tool is only a numeric anomaly and is not grounded in any logical proof, and that is a very important point to make there, guys. Okay, just like any other indicator of the Fibonacci retracement is not a standalone signal that, we can use for trading decisions, we could potentially look for let these levels of support, and resistance of course, and look how a price-action and trades around these areas perhaps congest perhaps there’s more volatility perhaps there is more volume but, we can see that. It is inconsistent in terms of providing us with assured signals or logical proof that this market is either going to reverse or look for sustained movement and from a breakthrough

So, it is only one indicator, and to be coupled or used to try, and heighten your probability of a trade the indicator is not applicable to all asset classes to another’s one of the reasons of course why I chose to present the Forex pairs in the gold market again because those markets are quite volatile over the long run, they can see a shorter-term shifts in sentiment, they can see shorter-term shifts in trend, and status, as well, and that’s what we’re looking for. We’re looking for potential pullbacks in these markets, where the Fibonacci retracement can be met, and actually look for trading opportunities again, if I use the example, of an equity market or an equity market bull run, and which were actually seen in the markets. Now, we aren’t given the best opportunities in terms of seeing these long-term Corrections or volatility to maybe get, as many trades off from our long-term high-to-low, and Fibonacci retracement perhaps, if, we see a real structured correction in an equity market that can give us a signal, and to maybe look for a pullback in the Fibonacci retracement pergolas, we know that volatility isn’t, as such that, we get. So, many variants of price action over a long term price action chart when observing the equities. So, it, as an indicator is not, as applicable to observing such asset classes, as equity markets class retracement only points to possible Corrections reversals on counter Tran bounces and struggles to confirm any logical buy or sell signals, and that is very significant for us, as traders, we know that we’re very much concerned with trying to find these big moves in the market, if you’re particularly a long-term trader you’re looking to either buy or sell the market, and have a directional bias in the long term the Fibonacci retracement given that it’s looking for pullback. So, market reversals or counter-trend bounces it’s looking to find out volatility to find, and perhaps opportunity within the volatility. It doesn’t actually give us those buy or sell long-term signals in the markets. So, that’s very significant in terms of trying to try, and trade, and it doesn’t necessarily help her age or decision making whatsoever, and of course it can experience a high degree of inconsistency.

This is something we’ve seen even by observing the price charts throughout the webinar we’ve seen the gold market how. It was providing us with some very good signals. It was providing us with some per Cygnus that would have led to some losses of course, as well but that’s part, and parcel of using these technical indicators, they are not always an assured sign of a high probability trade, they can often be quite inconsistent, and that’s why, as technical traders, and certainly when trading Fibonacci retracements. It is advised to look to use many of these technical indicators to really stack the odds in your favour in terms of decision making, as a technical trader okay. So, that brings us to the end of this introduction to Fibonacci webinar. Let’s have a quick review of what we’ve actually learned! Obviously in discussing both introduction to Fibonacci, and mathematical significance, we know that it is derived from the mathematical, as significance really of the Fibonacci sequence, or numbers those in turn, give us an outlay which, we can stretch on to our price action chart, and, they help us derive technical support, and resistance but, they are observable in price inflection points long-term price inflection points that, we can look to look to add our own genuine levels of support, and resistance, if, we can use perhaps the Fibonacci retracement levels across these price action charts, as well not gonna help us, and give us another signal to actually looking for mathematical levels of support, and resistance. So, that could lift a couple upon, and really giving us more probability in terms of a possible level or genuine level within the market. We then went on to actually express these Fibonacci retracement levels across various asset classes. So, we looked at the gold market, and some Forex pairs, and highlighted some trading opportunities there, and that led us nicely into discussing the limitations of Fibonacci retracement, as an indicator, it is often providing us with some very well structured levels of support, and resistance in the market what perhaps is a time very consistent with its trading opportunities given that. It gives us good signals and some false signals, as well. So, that brings us to the end of this webinar. Thank you very much for joining us on this installment of courses on demand brought to you by Forex dot Academy. We do hope to see you very soon. Bye for now.

Categories
Forex Courses on Demand

Mastering Price Action


Hello, and welcome to this latest edition of our course on demand which has been brought to you by Forex dot Academy. So, in this course, we will be discussing mastering price action trading. So, just before we get in, and explain what’s involved, please do take a quick moment to read through our disclaimer, and the information is there currently up on the screen. Do feel free to pause this recording, if you need additional time okay.

So, let’s start with a webinar outline, and we look at the principles behind price action we’ll have a look at, what you would need to consider. If you look to master these principles of price action, we look at the importance, and the role that Japanese candlesticks will actually play in that decision-making process we look at their price action patterns which are then created we’ll have a look at the role of technical analysis, and we’ll finish with just an approach in which you can look to master price action trading strategy itself okay. So, let’s start with price action principles. So, price action training is – a discipline of basing all of your trading related decision-making processes on historical price movements that are displayed on a particular price chart. So, price charts reflect the beliefs, and actions of all participants trading the markets during a specified period of time, and it’s these beliefs that are portrayed on a market price chart in the form of price action. So, whilst economic data, and of course other global news events are absolutely the catalysts for price movements in a market technical training assumes that we don’t need to analyze them in order to trade the market successfully. Now, the reason for this is a very simple one all economic data, and world news that causes price movements within a market can ultimately be reflected solely in the price action or the price on a particular market price chart. So, if we talk about the value of the US dollar or the gold market or the oil market for example then all of that information is taken into account, and that price will either move higher it’ll move lower or it will continue to stay roughly at the same level, and it’s this information that those that trade price action can use in a very useful manner it’s also important to take on board that due to the fact of recent technological advancements, and the development of Japanese candlestick charting you know a lot of that has been responsible for the popularity of price action trading today. So, it does allow traders to recognize when certain structures occur in the market, and it also gives them the information to understand, what they mean in terms of price change, and how likely price is to move in any particular direction which does to the upside to the downside or potentially continue to move sideways some, what you’ll often find is many good trading opportunities occur even when price action traders realize that price structures break down, and reject areas of interest, and we call these types of scenarios structural failures. So, when even when you see structural failures, and price does not behave, and act like you anticipate it to do it still presents some fantastic opportunities for those that trade price action. So, in order to master price action training traders must gain experience in seeing price action set up on numerous occasions. So, you can build up the confidence to trade these setups, and navigate through the financial markets. So, a good analogy to use when we talk about price action is to think of trading price action like reading a book.

So, the entire book, of course, tells us a story just like the market does on a daily basis. So, what you’ll find is overall themes develop with many into thing plots, and subplots throughout, and it’s the same for the financial market. So, so then when you go down into a bit more detail think of each individual page as perhaps resenting a trading day which can then be subdivided in the paragraphs are little subplots, and these can be seen as effectively different candlesticks or price patterns which could effectively be the words on the particular page, and all of this is really useful information. Now, the market will trade each, and every day just like reading a long story and. So, as the theme or the story begins to develop in a book. So, does the theme or price section in a market. So, it’s quite a useful analogy just to do just to explain that it is like reading a story when you’re looking at a price chart it gives you some very valuable information and, if you can read that price chart, it can give you some a significant edge when trading okay. So, just looking at the foundation of price action it’s important to note that, if we look along the x-axis, what you’ll see when you look at a price chart is the timeframe of the chart that you’re looking at, and along the y-axis you’ll experience the price and, what you’ll experience over this timeframe is how price moves during this particular period, and what’s important to note from just looking at the price section that we’re seeing on on-screen currently is that this market moves from bottom left okay does move sideways a little bit for a period of time but then starts to push higher, and it’s currently trading top right. So, in general, overall, this market is moving to the upside, and it just happens to be a eurodollar daily candlestick chart. So, we’re constantly experiencing a battleground, and a battleground is just it’s where buyers and sellers come to do battle buyers are looking to push prices higher, and of course, sellers are looking to push prices lower whoever wins out will see a chart move in that general direction. So, we can experience a consolidated market for a period of time followed by a little bit of bullish price action, and you could argue as well a little bit more consolidation which is often, what you get after some you know a big bit of price action pushing prices higher okay. So, that’s just touching upon the concept and the idea behind the battleground, and it’s important to note that all price action trading decisions are made here on this chart or on a chart should I say. So, deciding when to buy or sell is made purely on, what is happening to price of price action.

So, we can glean some very useful information from what we’re currently seeing that can give us an edge when we look to navigate these markets okay. So, moving on to mastering price action, there’s a number of things we need to understand, and the first one is to understand the principles behind Japanese candlesticks. We then need to recognise price patterns which is a collection of candlesticks, and technical structures which exist in the markets, and price moves from those structures but can also break down those structures as well. So, that’s important to acknowledge to master price action you need to develop a price action methodology, and that’s just a way in which you can look to enter and exit these markets, and of course you need to be in the market long enough to be able to gain the confidence necessary which will allow you to also eliminate hesitation because, hesitation can prevent you from actually getting into those trades, and try to gain that all-important experience by learning from each technical setup, and acknowledging how priced behaves in those situations on a number of occasions, and that that’s, what will give you the to be able to master price action okay. So, focusing upon Japanese candlesticks in more detail, to begin with, in order for price action traders to consistently profitable profit from trading they must find a way to effectively assess how prices are trading in the markets. Now, observing Japanese candlesticks is the best way to do this. So, these candlesticks describe the interaction between buyers and sellers, and they tell us who has more control over price directions. So, if we talk about that battleground are the buyers in control of that market are the sellers and, if you understand that, and Japanese can help us with that Japanese candlesticks can help us with that then you will give yourself a really good basis in which to navigate these markets, and also the sizes shape of each candlestick provides us with unique information such as the trading range of the market within each particular time period whatever that may be, and how much pressure there was on either pushing prices hot to the upside or like I said to the downside. So, this is, what this is how Japanese candlesticks and our understanding of these candlestick patterns can really assist us when we trade, and to just give you a good example of this, you know why are they are so important in deciding price direction, because, when you can blend them with easy to identify levels of support resistance, and you see price action interacting, and behaving with these markets and, if you can see these three candlesticks are very bearish, ie pushing prices to the downside but, what you can clearly see is price then have become supported at this particular level because it’s understood by the market as a level of support.

So, what you see is a little bit more indecision, and price action just becoming a little bit erratic but, what is also created beneath this low is actually an opportunity for certain types of price action traders and, what we will see at the point of this particular breakout which is prices breaking through the level of support, and pushing lower is that breakout traders will look to enter to the downside, and looking for a breakout to the downside, and looking for these prices to push lower. So, those would be your breakout traders that I dared to find its level of support, and said if we get a break of this level of support pushing lower. We would like to go with this market, but in reality that’s not effectively that’s not, what we see, what we see is actually a little bit of a rejection to the downside. So, this is. Now, a rejection candlestick. So, prices were pushed lower, and we got to a low price, and then we’ve started to push higher, and as you can see there’s a little bit of a rejection of prices pushing lower, and it actually creates a hammer candlestick pattern and. Now, that’s quite interesting because, it hammers out at the bottom of the market and, what that can do is present, if we talk about this battleground it can present opportunities to the Bulls to actually look to drive prices higher. So, as we roll on the next couple of days, and you can see a little bit of indecision kick in the day after, and then on the third day which is why you don’t want to necessarily make decisions based on one candlestick alone, and that you need a succession of candlesticks in order to make consistent decisions when you trade as the breakout traders are stopped out to the downside prices push higher and, what they do then is they take out stop-losses as prices push higher, and this results in giving Bulls the opportunity to actually look to take control of this market and, what we mean by that is the sellers are no longer in control this particular point so. Now, the Bulls are seeing this candlestick they’re identifying the rejection to the downside, and they’re. Now, looking for opportunities to buy this market, and as you can see we get that explosive move in this particular example, and you just got to be patient to wait for this type of setup to occur, and use your understanding of Japanese candlesticks to help us decide price direction, and that’s how price action traders use their understanding of Japanese candlesticks in that way, and look at the stack the odds in their favour. So, moving on to price action patterns a primary advantage to basing trading decisions purely on price action is that you can adopt the timeframe of the trade to the current price action patterns in the markets.

So, being able to navigate and negotiate different timeframes can really prove quite useful. Now, the analysis may point to a high probability trade where the trader may want to trade the market to a certain price. So, in mastering price action, it is important not to judge each technical price action setup by simply observing any one particular candlestick. So, it’s not about looking at the hammer candlestick in isolation it’s about looking at the information that gives us, and then looking at the reaction of the markets, and see, if those buyers actually do come into that particular market at which point you would then be looking to stack the odds in your favour, and have significant reasons to get into that particular market. So, this, of course, depends on the time of trade more frequently; however it is the arrangement of the Japanese candlesticks over a longer period of time, and that can indicate longer-term trends, and hence greater trading opportunities for price action traders. So, to give you a good practical example I want to draw your attention to three significant candlesticks on this chart as represent they’re within those circles, and in observing individual almost standalone candlesticks. We are able to find enough evidence of price direction. So, here we see three strong bullish candlesticks which indicate strong trend continuation to the upside. So, that is effectively all, what these candlesticks do but there’s a lot that happens just prior to this candlestick, and this is on each occasion, what we see in experience is a closed above previous resistance levels on each of these occasions, and we can see that the previous price action is quite bullish the price action that comes before these candlesticks in on each occasion is bullish and does push prices higher, and the decision-making process for a trader that uses price action is quite a straightforward one it’s looking to go with that particular market, and this price action, and volume pushing prices higher means that a part of your decision-making process is determined by whether you’re looking to buy or sell a market, and in this particular example you clearly see that you’d only be looking to buy this particular market, if you want your more high probability trade outcomes. So, of course, those traders that sell the highs, and they keep looking to do. So, but that’s a very risky low probability in terms of looking to see a successful outcome. So, so hopefully that helps just a little bit in terms of getting an understanding for price action patterns and, if you can identify significant levels, and you have a solid understanding of price action patterns, and then that can really look to stack the odds in your favour when you trade these markets okay. So, again looking at this other example you can clearly identify a significant level of support resistance, and it’s its support, and distance because, what we do is this level can provide resistance preventing prices pushing higher until we get that breakthrough where you would then be looking to buy this market, and then it provides support around these prices looking on multiple occasions to push these prices higher. So, that’s why they’re genuine levels of support resistance, and to just roll this on just a little bit, what we can see here just on the right-hand corner of the screen is a fairly well-developed a bit of price action pattern which can help you define your directional bias meaning are you looking to buy are you looking to sell this particular market.

Now, in this case, we’re going to propose the case for a short gold trade, and I want to do a little bit more understanding of technical analysis, and our understanding a prior section as well too to highlight these areas, and to suggest that in actual fact, what we’re experiencing here is a series of lower highs meaning that there is. Now, at this point, there is a downward pressure looking to push prices lower, but as you can see, this is also a level of support. So, prices are supported at this level which is important to see, and important to identify and, what I’ll do is I’ll actually move this along. So, you can see these pre-identified levels just working at these lows. So, considering this particular pattern, this particular structure, and traders can. Now, look at how price action reacts at very important price points in the market. So, how a price action trader can utilise this information we can create, what is called a descending triangle which again is more technical analysis where we have a downward price pressure looking to push prices lower in this particular example. So, a fairly straightforward approach would be, if we get a confirmed break beneath this level of support then that would mean a lot of these traders which are looking to buy these markets they’d have stop losses sitting in these areas they would turn the sell orders and, what you’re likely to do is to get an explosive break out of this descending triangle, and you’re very likely to get an explosive move around this kind of price action pushing prices lower. So, this is a sort of an isolated example in terms of how a trader can use their understanding of price action, and the patterns which exist in these markets to formulate a bit of a trade plan for a market such as the gold this gold trader okay. So, price action patterns. So, sticking with these just a little bit longer let’s. Now, look at a different pattern, and as you can see we’ve got a very easy to identify level of resistance in this market preventing prices from pushing higher consistently, and also clearly an easy to identify level of support preventing prices from pushing lower in this instance as well. Now, it’s always important to acknowledge that you need a methodology for looking to make trading decisions around these areas it’s not as straightforward as necessarily buying above this level, and selling below the level you need certain confirmations to be able to enter an exit which we’ll discuss very shortly but, what we mean by this is traders often observe a trade price pattern when they are trading even within a range. So, we have range-bound traders that look to buy the lows push prices higher, and then when price reaches a level of resistance they’re looking for sell, and drive market slower, and this sort of just occurs time after time off the time but these are very much your you’ll range-bound traders these are the trades that these traders look to look to trade. Now, all of these trades don’t necessarily need to be winning trades, and again even a range-bound sideways moving market like this can present fantastic opportunities for again you’ll breakout traders you know those that break below certain level could constitute a very interesting opportunity to either push this market lower or, if we trade with confirmation above these kinds of levels to look to push these prices higher accordingly.

So, again, you know different types of price action patterns can present different opportunities to a different style of traders as well okay. So, hopefully, that makes a little bit of sense. So, in a range-bound market meaning price are moving from lower range to higher range the best opportunities may actually lie in trading the price action at the range extremes by seeing how the price action reacts at these levels. So, we’re not suggesting for a second that, if you decide to buy above this high here, if you get a confirmed break above that level of resistance that of course that might constitute an opportunity to buy this market however as you can see subsequent price action would confirm that particular trade idea would be a losing trade in this particular example but there’s many other examples which would protect your capital by showing, and proving to you, if you wait for confirmation, and you wait for the close of these markets to reveal, what opportunity may or may not exist it can protect your capital more often than not, and that’s worth taking on board as well okay. So, moving on to the role. Now, of a technical list or the role of technical analysts, although pure price action traders will rely only on their skills in reading the structure but also the movement of Japanese candlesticks, most technical traders profit by devising a strategy which actually combines both price action, and their basic understanding of technical analysis. So, they actually work hand-in-hand with each other. So, this is because, technical analysis can help traders decide when it is most important to observe price action, and how significant the price action is at the market’s current level. So, when we talk about technical analysis, and this is the umbrella term for being able to trade markets technically, and then within that, you have the observation of focusing on price action, and the information that Japanese candlesticks can give us in order to make consistent decisions. So, as more and more traders have embraced this trading approach, price action volatility is often seen to increase when the market reaches these technical levels of interest. So, technical traders can. Now, look for more evidence to support trading decisions in, and around these technical levels. So, to present to you a good example to explain, what we mean in a little bit more detail the role of our technical analysts is quite it’s a very interesting one. So, important to acknowledge that gold is said to be a very technical market and. Now, the reasons for that is what you can see currently up on the screen. So, those that are your technical analysts will use a series of different potentially technical indicators whether they’re support resistance whether it is Fibonacci levels that you’re working with whatever kind of technical indicator is used, and people have different they prefer different indicators for different reasons it all forms part of the same picture, and the same ability to actually make trading decisions.

So, with this fib level, you can see that there are actually levels of support resistance as well, and they do stack up quite well. So, if we look at the thirty-eight percent retracement in this particular example it can provide you with some very interesting sell opportunities on numerous occasions, and also there the 50 percent retracement, and there 61.8% retracement there’s only a couple of examples in here just to show you that, if you apply technical analysis in a certain way, and then it can give you an opportunity to again look to stack the odds in your favour when you trade these markets. So, what we can identify as well is these genuine levels of support resistance, and price action trades uniquely around these technical levels. So, this is the important point to take, and again it’s really focusing on the confirmation that you need to actually make a trading decision with is, what will be all-important in terms of your ability to trade these levels consistently, and of course profitably okay. So, looking to master price action trading strategy itself. Now, a couple of pointers is that a good combination of technical analysis skills and price action strategy is the preferred methodology. So, looking to combine technical analysis using perhaps one or two indicators perhaps with your understanding of price action is, if you’re looking to master price action strategy it all works together very nicely you’ll need to have exit, and entry points which can be based both on the technical levels, and the structure of candlestick patterns and, if you do that you start to allow yourself to master price action, and build that all-important training strategy. So, it is important to note that confirmation is always required before entering these markets, and conformation, unfortunately, means different things to different people. So, it may just be the case that you’re looking to get a close above or below a significant level of importance before you actually make that trading decision and, what that will do it will reduce the potential for false breakouts even to the upside or to the downside. So, if you can protect yourself against those, and have a way to seek confirmation before you actually pull the trigger, and get into that trade, then that is all-important than something very much to be promoted. So, the technical setup itself of the trade can help determine the term of the trade. So, here we’re talking about the technical setup to identify perhaps range-bound trading for example, and finally the more price action patterns you observe in the markets, the more familiar you will become with that movement of price the easier it will be to trade that with significant confidence as well. So, all of these things are very important with regards to looking to master a price action trading strategy. So, working with this let’s have a look at how you can use price action trading to actually look to enter this market in a very consistent manner, and again we’re looking at price action on screen with a very clear easy to define level of support resistance as you can see up on screen which is blue dotted line. Now, it’s important too as well as we’re reading the book are reading this price chart, and seeing what’s unfolding it’s important to know that you know simply your breakout traders may be looking at this price action in this area, and they may decide to become buyers, if price action breaks the long term resistance levels. So, this is a level of resistance preventing prices from pushing higher and, if we get a breakout of this level then, what that might signify is an opportunity for buyers actually to get in, and certainly these are your breakout trainers they’ll be looking to get in as a, if you clearly see a breakout of this level but as you can see it becomes a fairly significant level of resistance over a significant period of time, and in fact the market bounces off that level before attacking it again and, if you move, if we move this along we can see the low of this market, and you can see that it actually starts behaving a little bit more consistently prior to getting to this level of resistance which prevents his prices pushing higher.

Now, traders have some interesting opportunities around this level of resistance. So, if the price breaks, and as you can see it breaks above it might give breakout traders an opportunity to go along this market but it also as you can see it pulls back over the next three or four days, and actually below the initial resistance level. Now, if you’re a technical trader, and you look at price action, and you can see that this is a pullback off the highs and, what we see from here is a pullback from the breakout high and, if we look at it in a bit more detail, what this can do is it can present another buying opportunity but at a specific place, and that would be potentially to buy above this particular candlestick high might constitute a great opportunity to start pushing this higher. So, when we get breaks to these levels that can provide opportunities for breakout traders to get into this market to push it higher but also you know those that trade pullback price action you can get multiple opportunities on the same bit of price action with the overall view to expect prices to push higher. Now, they don’t have to behave in that way, but you would expect them to do. So, and, if the market behaves as you expect it then that is very important and, if it doesn’t then that is the first question mark that should be placed in your head in terms of whether you continue to give this trade more room okay. So, that’s how you can use your understanding of looking to master price action in the form of a strategy, and hopefully, the challenge is to try and use that in a consistent manner over the medium, and long term. So, this effectively becomes your buy entry-level, and as you can see in this particular situation market continued to move to the upside quite aggressively over to coming over the next few days in this particular example okay. So, that is your entry strategy. So, sticking, and as you can see, you got that explosive move pushing higher so. Now, looking to use your understanding of price action trading in the form of an exit strategy, and we’re looking at a same buy entry, and again this is the same resistance level sitting in this market but. Now, that we have a buy entry, we can look to place a technical stop-loss, and potentially even look to place a profit target on in this particular trade. So, we know exactly where our buy entry was as we’ve just previously explained. Now, in observing the price structure of the price action, if we can use the last correct of low the question we would need to ask ourselves is can we use the last corrective low as a technical stop-loss, and thrust the example would be the market continued to break higher above that level. So, yes we can use that correct, if you because, if the market pushes higher, and it breaks back beneath this level then you do not really want to be in this market beneath this low anyway it doesn’t make any it doesn’t make for sound decision-making to actually be in this market beneath that level. So, you may as well use it as a very consistent place to place your stop-loss. So, that’s how you can use your understanding of price action in terms of an exit strategy, and you still see that explosive push to the upside.

So, a price moves to the upside, we can then assess the price action for potential reversal patterns, and potential profit targets as well. So, we can continue to use our understanding of price action to help us get out, and maybe even book in profit on a trade like this. So, in observing the structure of the price action we can use the last corrective low as a technical stop-loss, and that’s what’s all-important when we look to use or understanding price action in the form of a trading strategy to look to make sure we place, and we exit the market at a level that makes sense, and that can protect your capital, if the market moves against you okay. So, that just about concludes, and this particular webinar. So, we looked at some of the principles behind price action we looked at the concept of looking to to master price action, and some of the things that you would need to consider as a trader we looked at Japanese candlesticks, and the information that I can give price action traders, and then putting it together in terms of looking at price patterns, and again the way in which that can stacked the odds in favour of a technical trader, or a trader that trades price action consistent. We have a looked at the role that technical analysis can play, the use of potentially other indicators to formulate that strategy give you more confidence to provide you with more confirmation, to actually get into that particular trade, and we just finished upon looking at how we can use price action to actually formulate a trading strategy which can be based on objectivity and managing risk, and just looking for very clean opportunities to get in and navigate these markets accordingly. So, all that’s left for me to do. Now, is to thank you very much for joining us, and we do look forward to seeing you next time, so from everyone here. Bye for now!

Categories
Forex Courses on Demand

Assessing Market Conditions


Hello and welcome to this latest edition of courses on demand, brought to you by Forex.Academy. In this course, we will be discussing how to assess market conditions. Just before we begin to explain what’s involved in this Webinar, please take a quick moment to familiarize yourself with our disclaimer. Moving on to our webinar outline, we’ll start with an introduction to market conditions. We’ll then progress on to looking at the three different types of market conditions. We’ll have a look at the role different time frames can play when it comes to identifying market conditions, which is quite important. We’ll have a look at techniques that can be used to objectify market conditions, of course, being objective in the market is a really important skill to have, so we look at that in some detail. We’ll then have a look at the principal of a price cycle and how it can impact market conditions. We’ll finish this Webinar by looking at how to incorporate market conditions into one’s personal training plan, so we’ll make it very relevant and very practical for you as well.

Let’s start with an introduction to market conditions. Before we define what market conditions mean, it is important firstly to note that it is impossible for a trading strategy to work all the time, which is also known as indifferent market conditions. The reality for profitable traders is that, unfortunately, losses are inevitable, and there is no getting away from that basic principle. Now, the reasons for this are often that every trading strategy approach will be built on specific characteristics, which can from time to time contrast with the conditions of a particular market. It’s a case of certain approaches, suitable for certain market conditions, and invariably you will experience times where there’s actually a clash between the market condition and the strategy that’s looking to be adopted. It’s important to take note of the fact that with a trading strategy, it is unrealistic to expect that strategy to work in every different type of muscle, market environment, and market condition. To give you a brief definition, this is the state in which a market trades. In simple terms, markets typically transition between states, or different market conditions, on a regular basis. It is important to note that each state, or market condition, possesses its own unique characteristics, which we will have a look at shortly.

Now, there are three different types of conditions which a market can experience, and I’m sure you’re probably quite familiar with some of these terms. They can be Range Bound, or also known as consolidating markets, but they can also become Break Out market conditions, which have very unique characteristics as well, and also Trending markets. What’s important to take away is that they all have specific characteristics when it comes to the best time to buy or sell, which we’ll be looking to discuss in some detail very shortly. To give you a very quick snapshot, looking at this first graph, we can identify what’s called support and resistance levels on this chart. With the blue lines, we can clearly see and identify that the market bounces off these levels, and it does so on a number of occasions. That presents those that are range-bound traders the opportunity actually to sell. When the price gets up to these levels up here, they look for opportunities and see if they can sell these markets and drive the price lower. They do so on numerous occasions, so that’s how a range-bound trader would look to capitalize; create a trading edge when they trade these markets. The same applies to buyers when they look to trade these market ranges when the price reaches a low. There are certain characteristics which can be used to define a trading opportunity, but in principle, and broadly speaking, they would be looking for opportunities to buy at the lower end of the range and looking to sell the market at the higher end of the range. So, that’s the approach a range-bound trader would like to take when trading a market like this.

Another type of market condition is referred to as a break-out of the market. This is when you receive, or you experience a certain confirmation – which suggests to you that this market is no longer looking to move and stay within a range. So what you find, you need certain confirmation to actually make this trading decision and a trading strategy. Just looking at this candlestick here, you can clearly see we break through with momentum, and we get a close beneath this level. That is a little bit of a game-changer for those that look to trade breakouts on this particular occasion. So, what you will experience is that it will provide an opportunity, in this example, to potentially look to sell this market to the downside.

Now, the third type of market condition. To sort of give you a very brief introduction to a trending market, and what’s important to sort of takeaway from a trending market. This just happens to be a bullish price trending market, meaning prices are pushing to the upside. When you look at a price chart, you will notice that for a trend to be bullish, what you’ll experience is often the price for the beginning of that particular trend to be very much towards the bottom left-hand corner of your trading screen. If the trend is to the upside, what you’ll often experience within that trend is higher prices on the right-hand corner of your trading screen. There are additional characteristics, which we look at in so much more detail very shortly.

To give you a brief introduction and a general overview, you’ve got three significant phases. You’ve got your range-bound market, i.e., a market that clearly moves within a range, you’ve got your breakout markets, and you’ve also got your trending markets. These different types of markets can present traders with some interesting and very profitable opportunities. Let’s take a look at these three types of market conditions in a little bit more detail.

First, we’ll look at range-bound market conditions and the fact that they do possess some very unique characteristics. For a range-bound market to exist, you will need to see the market respect both a clearly defined level of support resistance and see prices bounce off those levels on multiple occasions. I’m just looking at this price chart and using this as a first example. We can work with what’s called genuine levels of support resistance, and you can identify those levels fairly easily. What we can see is a clearly defined range-bound market, which moves from highs to lows and back to highs. It does this on many occasions and therein lies the opportunity for a range-bound trader to, like we’ve alluded to before, look for opportunities to sell the highs at this top edge, and look to buy the lows, which is the bottom edge of this particular range.

Another example to go through would be identifying the price action. Again, looking to determine the range, and there are some specific characteristics that would need to be seen and achieved. When we work with genuine levels of support resistance, we can identify these levels relatively easy. It’s never important to be incredibly precise with the positioning of these supports and resistance because what you can clearly see is the market respecting roughly that sort of level. That gives traders some incredible opportunities to trade.

The three conditions that need to be met for a potential for a range-bound market to actually be performed are as follows; first is with regards to the move. By this, we mean this market is clearly moving to the downside. It creates an initial low, and that low is actually the first important part of the formation of a range-bound market. The second characteristic we are now looking for is actually with regards to the recovery point, and we just refer to it as a point because it does create a high in the market. Initially, the move has been very aggressive and very bearish in this particular example, and it creates a low. Then, we normally get a bit of a recovery point, or a pullback on this market, which creates a recovery point. That’s what range-bound traders look for; they look for these points, wanting the market to behave accordingly in and around those levels. The third characteristic, which would be required to effectively look to establish a range-bound market, would actually be the range-bound trade. This is when your range-bound traders would look to effectively identify an opportunity to actually look to push prices higher, as far as this particular market is concerned.

Again, that gives us some very useful information. If we take it over to the next example, we can go through that same process again, except this time the move is coming from down to up. So, we’re now in a bit of a bullish market, up to this point it creates a high. We get the recovery point, which can be located at this level in here I located at number two. As you can see, the price continues to behave around this level for a reasonable period before, effectively, we get our range bound trade. This is where your range-bound traders would look for opportunities to sell this particular market. If they get an opportunity, they would look to exit around the lower band, whereas on the left-hand side example, a range-bound trader will be looking to buy this market, and they’ll be looking to exit at the top edge. In this particular example, we’ll be looking to a range-bound trade, looking to sell the market at this point and looking to exit roughly around the lower edge, so it obviously presents some very interesting opportunities for traders. That is effectively range-bound market conditions and how traders interpret them.

The next type of market condition we’re going to look at is our breakout market condition. Again, these possess unique characteristics. Firstly, for a breakout market to exist, you will need to see an initial break out of a range-bound market. All breakouts occur from range-bound markets, so straight away, hopefully, you can see the transition from one market condition to another. You will also need to see explosive momentum and volatility in favor of the direction of that particular breakout. To give you a little example, there’s your support resistance levels, and you can clearly see this market breaking above this level. We have the confirmation that we’re looking for, we get to confirm the break. It’s always nice to see the market come from a much lower position. It certainly gives lots of time to look to try and capture this move when we get that breakout trade above that level, looking to drive prices to the upside and that’s what we’ve seen in this particular example. It’s very important that we identified a potential for a breakout and we use our range-bound levels to do that. When we get a breakout of those levels, we can clearly see that we experienced explosive momentum and volatility in favor of the direction of the breakout. If we’re breaking to the outside, we want to see a nice explosive move and look to capture that as a breakout trader.

To give you another example, this time to the downside, we’ve got a slightly different formation in terms of our range. This is effectively a descending triangle, so it’s actually creating a little bit of downward price pressure looking to push prices lower when prices reach these levels and of course we get our breakout trade, which is what we’d be looking to do in this particular example.

The two conditions in this case that need to be met for the potential for a breakout market to be formed; the first one being the initial explosive move close are the momentum closure, should I say above or below the range. If this is our range to the upside, you know, do we get an initial explosive move to the upside? The answer is, we certainly do. In this case, it’s above the range. Do we get continuation with a series of new highs on this particular occasion, where we’re getting this constant sort of pushing or prices? The answer is yes, we do. This is a classical understanding of a breakout market, and it ticks those particular boxes. Now, with this trade to the downside, we’re seeing exactly the same thing, so we’re getting a confirmed close. On this occasion, beneath the range low, we ask ourselves if we get that initial explosive momentum close to the downside below the range. The answer is yes, we do. The continuation can take a variety of forms. As you can see, we’ve got a nice continuation with the following candlestick and a little bit of a pullback before the market starts edging lower. As long as it conforms with seeing an explosive move above or below the range, then it constitutes a great opportunity for breakout traders. Just looking at the final version would be looking at trending market conditions.

Again, they possess quite unique characteristics as well. First, for a trading market to exist, you will need to see an initial break out of a range-bound market, so you will also need to see continued momentum and volatility in favor of the direction of the trend. Most importantly, you will need to see a series of what are called higher highs and higher lows in an uptrend and lower highs and lower lows in a downtrend. To explain this in more detail, we’ll have a look at this particular example on the left-hand side. To identify the fact that this market moves from the bottom left to top right means that we are in a confirmed uptrend pushing prices higher; however, you will also need to see periods of momentum and volatility in the direction in which we’re wanting to trade. There are numerous opportunities where you get nice and green explosive candlesticks in this particular example, pushing prices higher. That should give you more confidence to know that the likeliest response for this market to keep pushing prices higher.

As you can see on the screen currently, there are numerous examples of being able to see and identify that momentum and volatility in the direction of the trend, which in this case is pushing prices higher. What you would also need to see is what’s called a series of higher highs. These are quite easy to identify, and we will refer to it as in this particular example h/h. As you can see, as the market moves it up in favor, we get to experience a higher high, and this happens on numerous occasions, so these highs are actually higher than the previous highs. This is the classical definition of a trend, where you constantly see a series of higher highs back-to-back.

In addition to higher highs, what you would also need to see is the market being supported from the downside. What we mean by that, is you will also need to see what are called higher lows. We call these HL, for higher lows, and as you can see, these higher lows will be printed in a similar fashion to the higher highs. As the market pushes higher, we get a classical understanding of an uptrend, which prints a series of higher highs followed by a series of higher lows. I’ll just finish off these last few, and this is a classical definition of an uptrend, so hopefully, that makes sense. Prices continue to push higher, so in addition to that, we’ll move it along.

We’ll have a look this time at a trending market to the downside in this particular example. Again, what we want to see is the momentum and volatility to the downside, which is overriding the buyers in this particular example, and that’s showing nice continued strength. Keep looking to flush prices lower, so we can physically see the momentum and the volatility in this market. That’s the first thing, and we can see this as this market continues to drop lower now. We can identify this as a downtrend because the price this time is moving from top left to bottom right. What we can see is this market moving in this direction fairly consistently.

Another important characteristic of a downtrend is the fact that we will see it’s the same as an uptrend, but just reversed. We will see a series of what are called lower lows. As the market moves, it’ll print a series of lower lows on numerous occasions as this price moves in favor. This again is a classic definition of a downtrend, but you’ll also get support preventing prices from pushing higher, and these are lower highs. As you can see there, the higher the market, but they’re lower than the previous levels. Again, you get a series of these printed. These are lower highs and lower lows as this market moves down, so this is a classical sort of definition of an uptrend and a downtrend. As you can see, it’s just the polar opposite of each other.

That’s a good overview of the three different types of market conditions, and we hope you can begin to identify and see the opportunities that this can present for different traders whether you’re range-bound, whether you’re a breakout, or whether you are a trader that looks to trade the trend.

Another important topic to look at when we’re looking to identify market conditions is the timeframe in which you are trading. It’s important to note that all market conditions are relevant to the time frame you are wanting to trade, meaning you might experience, for example, a range-bound market followed by a breakout and a trend potentially on a one-minute chart, which you may struggle to see, or you might struggle to identify with on a much higher timeframe. For example, on a four-hour chart now to explain this in a little bit more detail, and let’s share with you a live chart at the point of this recording. I’ll try and explain this in more detail for you. Just looking at this bit of price section, what we can clearly see on a one-minute time frame, and this just happens to be the eurodollar, but what we can see is prices trending to the upside. We’re getting this sort of pattern, where range-bound traders may be looking for opportunities to buy and sell within this framework. As you can see, there would be multiple opportunities potentially, until something happens. At this particular area, we get a little bit of a breakout to the downside, and for that, there’s a level of support resistance, sort of sitting in this level. You can see that the market clearly breaks through that level with a little bit of volatility coming into it, which could present opportunities for breakout traders to look to see if they can push this market lower. This is just an overview effectively of an approach that might be taken from a range-bound trader in a much smaller timeframe.

Look what happens when we increase the timeframe. A lot of that analysis can subside very quickly, indeed. Now, we’re looking at a market which is clearly moving to the downside. It can be argued that there are some clearly defined levels of support resistance sitting in this market, and this market is breaking out to the downside. We’ve got a little bit of a pullback inside that level, so it’s a slightly more convoluted picture. All we’re doing is straddling what we thought was a level of support resistance, which can clearly be defined as actually being relatively close to being a significant level of support resistance, but as you can clearly see, the price action is bouncing above and below it. Now, the view could very much be that this is a range-bound market. Those that look to trade range might look at this price action and identify some opportunities, but let’s increase the time frame again and see what other information it gives us. Again, we are actually able to see a market which has bounced off a low. It’s created a new high and all we’re seeing at the moment is a little bit of a pullback, with some consolidation. At this moment in time, price is moving sideways for a relatively short period of time. Taking that analysis, a range-bound trader might look at this price action and suggest there are opportunities to trade this range. That would be down to the trader’s methodology, as to whether that’s the case. As we go through the different time frames, you can suddenly start to see how choppy this price action really is and that can give you some really useful information. Not only are there identify opportunities and much higher risk opportunities, the lower timeframe you go, and they can be based on a different rationale.

Looking at this hourly chart, you can see that the market has been moving above and below this particular level of support resistance on an hourly timeframe for a significant period of time. Again, if we go up into timeframes once more, the picture begins to change. What we’re looking at here is a pullback of the previous high, and this is for an hourly chart. This is where your pullback traders or your trend traders might look to get involved in this market. The breakout has already occurred. We get a pullback, and they might be looking to buy the pullback in a situation like this. On a daily timeframe, you can see what’s beneath it, which is a significant bull market; however, it must be addressed that market conditions can shift from one market condition to the other. Clearly, on a daily timeframe, we are getting a bull market, but it has to be said that since we’re looking at sort of mid-January, we have moved from a bull market into currently a range-bound market. We’re getting prices that move above and below our levels of support resistance, so therein lies the potential for different types of traders. The necessity really is for any trader to be able to identify the market conditions, obviously, prior to trading them. Hopefully, you found that useful in terms of the importance of timeframes. It can really look to give you a completely different complexion and outlook, depending on the timeframe that you are looking at.

Moving on to techniques that objectify market conditions, this is really about a trader looking to remain objective as much as possible. To give you a brief definition, objectivity is the lack of bias judgment or prejudice, and that can facilitate some significant benefits to traders. Now the question we need to ask, is how can a trader remain objective when assessing market conditions? There are a couple of ways in which we can do this. This is when technical analysts can come into their own because they can use certain training related indicators to help them remain as objective as possible when identifying these market conditions. We’ll go through three of them now.

The first one is just identifying support and resistance. I didn’t find genuine support resistance normally on bigger timeframes, and this will allow you to assess the market conditions properly. So, when we look at price action like this, it’s very choppy. We can literally apply a technique. It’s something that we’ve used in previous slides, and we’ve discussed it a little bit now in detail, we’re simply looking to identify a top edge or a top edge range in this particular market and a lower edge or a bottom edge range. We’re getting this market moving from highs to lows, and doing so in a relatively consistent manner when we identify these genuine levels of support resistance because that’s what’s happening. They’re supporting prices at the lows, and they’re resisting the price from pushing higher at the highs, and that is what can give traders some significant opportunities. As you can see, we have price action, which is slight and obviously slightly bearish to the downside, but very much moving sideways. That’s really what you would need to take away from price action like this, that you are clearly in a range-bound market. You have your range-bound highs and lows, and the market is bouncing in between them. If you happen to be a trend trader, this is not really the market condition in which you would be looking to execute trades. That’s how support-resistance can be used to remain objective. All you would need to do when using support resistance is to basically acknowledge what you are seeing and not psychologically talk yourself out of what is actually happening. That is just a little bit about support resistance.

Another technique that could be used is a basic understanding of Japanese candlesticks, and of course, this works hand in hand with support resistance. An understanding of Japanese candlesticks and their respective support/resistance will help you with objectivity. Again, we’ll have a look at this same chart. We’ll identify those levels of support resistance, as in the previous chart, and we can see that price is slowly moving down, making lower lows and lower highs. There’s a gradual grinding to the downside where we can look at the Japanese candlesticks and the information they’re telling us, which is that we are rejecting prices from moving higher at these levels. It’s doing so on a number of occasions, so that can give those that understand Japanese candlesticks a good opportunity to look to try and sell these markets at these levels. As you can see in this particular example, they can do so on many occasions, and the same applies to the downside.

So, we can identify if we understand Japanese candlesticks and how they respect and react with levels of support resistance. All of a sudden, we can pin this is a range-bound market. For those range-bound traders, this can provide really interesting opportunities to push higher. The reasons why they can make these decisions is because they’ve got a comprehensive understanding of market conditions. Again, you can see the rejection to the downside on many occasions within these areas. You can see the same again just recently, so your range-bound trader would be looking for an opportunity to look to take this price back to the upside. They’ll continue to do so until this range, the market condition that we’re currently experiencing, transitions to a new market condition, so that’s another technique that can be used to object to find market conditions.

When you apply this moving average, you can still identify visually your support-resistance. You can have a comprehensive understanding of Japanese candlesticks, but if you apply a very straightforward simple moving average to the chart (you can do so on any MetaTrader 4 platform), you can generally sort of identify. Don’t forget this is the moving average of each candlestick over a certain period over a certain number of candlesticks. As you can see, you should derive at the same conclusion, which is that this market is ever so slowly drifting slightly to the downside and is very much range-bound because we’re getting prices breaking above the moving average, and below the moving average. This is happening on many occasions, and that’s why a simple moving average can assist you with being able to remain objective about what is truly happening with this market. We can see this moving average, that prices are trading through it on many occasions and that is obviously a good thing for range-bound traders. It can provide them potential opportunities to look to sell the highs and buy lows, and this is just another technique that can be used to assist you with market conditions.

Moving on to price cycles and market conditions, price cycles can also be used by technical traders to support the identification of market conditions. There is cycle theory, and it asserts that cyclical forces both long and short, without doubt, drive price movements in the financial markets and that price cycles can be used to anticipate turning points in a particular market. These turning points can often be identified as periods of consolidation, or clearly defined in indecision, effectively allowing the market to pull back. Do not expect psychoanalysis to pinpoint reaction highs or lows necessarily. Instead, psychoanalysis should be used in conjunction with other aspects of technical analysis and to try to anticipate these turning points to a greater degree. To explain this in a little bit more detail, price cycles can also be used by technical traders to assist with the identification of market conditions.

I want to share this chart with you, this happens to be an S&P 500 daily timeframe, and you can see that the timeframe along the bottom is over the last four years. You can use price cycles, and it’s a well-known price cycle with regards to the S&P. There are a couple of caveats to this because this is a more recent chart. There’s been a number of developments within markets like the S&P 500, which has changed what used to be a little bit more reliable price cycle. Nonetheless, if we roll this on that there’s just a MACD down the bottom of this particular chart, which you can reference as well, and what this particular chart shows is a typical price cycle that you may experience in the S&P 500. The principal of the price cycle in the S&P 500 is that normally between November and April you’re likely to see prices push higher, and from May through to October you’re likely to see a price cycle where prices are squeezed lower. These can move to varying extents, which is why it’s important to make sure if you’re conducting price cycle analysis, that you are combining it with other, more reliable forms of analysis. Nonetheless, in each of these sections of the year, you’re likely to experience prices pushing higher, and you can see that in three out of four out of these periods, even though this middle one here has experienced a significant pullback. It has spent a majority of time retracing that particular pullback. The same applies from the upside, so it has been historically expected for prices to look to move lower during this particular cycle. As you can see, it doesn’t always ring true, but it is important to know that price cycle analysis should be combined with other methods of technical analysis. So that’s just a little bit about price cycle in conjunction with market conditions.

Let’s move on to how to incorporate market conditions into one’s personal training plan. The first thing to do is for you to decide the type of trader that you are. Do you prefer to try ranges, breakouts, or trends? That’s the first thing, because obviously there’s multiple opportunities, depending on your time availability and things of that nature. More experienced traders can trade multiple market conditions as well. Then, it’s just a case of looking to get really good at identifying the unique characteristics of each particular trading style. Whatever approach you want to adopt, whatever fits your personality, your capital, and your time availability. Then focus on the key characteristics of that style and take it on board; obviously, the timeframe that you would like to trade, and of course your tolerance to risk as well. Finish with a personal trading plan, to identify market conditions before executing a trade, something most new and experienced traders really struggle with. Please make sure you first identify those market conditions before you execute a trade. Don’t just jump into the markets blindly.

A basic trading methodology should look to revolve around things like deciding what markets you would like to trade, which is trade selection. Then, identify the market conditions of that particular market, and once you’ve identified that, and this is how it fits into a personal trading plan, then you can focus on the trade setup characteristics.

Let’s say we are a range-bound market. We need to set up the characteristics of seeing those top edges and looking at the Japanese candlesticks on whatever indicator you may be using, or whatever form of technical analysis you may be looking at, to adopt those characteristics and see if that trade conforms with those characteristics. The more criteria that are reached, the more confidence you should have in that trade and the more consistent you should become trading those particular setups. Then, your approach needs to focus intently on trade entry, what price are you actually looking to get into that market, and of course trade exit as well. So, we’re talking about risk management and making sure that you always draw that line in the sand, in terms of making sure that you mitigate risk obviously as quickly, or as well as you possibly can, and really have a strong focus on protecting your capital. The final part is obviously the trade management side, which will hopefully lead to a successful outcome for you. Within trade management, you’re talking about how you can mitigate risk. Can you look at a book and profit in that particular trade? Should we be looking to cover the position, or take profit? Whatever the case may be, you’re managing that trade as effectively as you possibly can. This is just an example to show you how identifying market condition fits in with an overall trading approach.

That just about concludes this particular Webinar. To review, we’ve introduced market conditions, and we’ve looked at the three different types of market conditions. We’ve looked at the importance of looking at different time frames, we’ve looked for some techniques to objectify market conditions, we looked at price cycle, and market conditions as well. Finish there with how to incorporate market conditions into one’s personal trading plan. All that’s left for me to do is to thank you very much for joining us on this latest installment of courses on demand, which have been brought to you by Forex.Academy. We hope you enjoyed it and we hope to see you soon. Do take care and we’ll see you soon. Bye for now.


Categories
Forex Courses on Demand

Fundamental Analysis part 2 – How to Read the Markets

Hello, and welcome to this latest edition of courses on demand brought to you by Forex dot Academy in this course, we will be discussing fundamental analysis, and decision-making volume 2! This does lead on from fundamental analysis, and decision-making a volume 1. Now, there is, of course, inherent risk when trading, the financial market. So, just before we begin, please do take a moment to familiarise yourself with the following disclaimer.

Now in focusing our attention to the study of fundamental analysis, and decision-making, we will be taking a closer look particularly at fundamental analysis, and the risk environment. With that risk environment, we need to understand, and analyse economic data, and understand how changes in economic data actually affect price over a range of asset classes we will be looking at trading, opportunities such as buying the rumour, selling the fact! It often occurs across those financial assets whether its Forex or, particularly in equity trading, where traders position themselves, and actually trade-off a rumour, and then had traded the opposite side of the news story once the fact emerges into the marketplace. We will then be looking at trading, behavioural finance, and that does continue on nicely with avoiding unnecessary market traps. Particularly for those beginner traders, and then we’ll be finishing off the lesson with fundamentals on timing, and obviously, one of the key skills to learn as a financial trader, and whether you’re a fundamental or, technical or, both is when to effectively have good timing! When to enter the markets, and early enough so that you’re getting a good price that you desire. Whether you’re deciding to buy the market or, sell them at the market, ie short sale, timing is crucial for financial trading. We will be discussing the fundamentals behind that fundamental analysis and risk environment in conducting our fundamental analysis, what do we aim to do? Where are we aiming to arrive at an underlined fair value price? That’s really the motive for fundamental analysis. Whether you’re deciding to fundamentally analyse stock price, you have to understand the growth potential of that company. The competitor environment with which it operates, and those business many factors to actually come to a fair value price, what you believe your analysis tells you that the price should be if that is the case then you can make trading, opportunities as a result you know given that something might be overvalued or, undervalued another’s particular for equity trading, but, has most certainly strong strengthen in construct when looking at commodity trading, as well particularly for assets like the soft commodities corn weak to sugar things like that however before we consider trading, the asset it is important to gain an understanding of the current market sentiment, and its tolerance for risk this temperature test is known as assessing the risk environment. So, there always is a risk environment in the markets current market sentiment, and we need to understand, what it is there’s a current appetite the current market appetite for risk has real fundamental power over asset prices from currencies to commodities to bond markets to equities all asset classes follow suit to the underlying risk environment markets will experience them two main appetites for risk. So, first we have risk on, and second we have risk-off. Let’s first look at risk on risk-on environments are often carried by a combination of expanding corporate earnings optimistic economic outlook accommodative central bank policies, and speculation yes fairly straightforward. So, when we are in a period of economic growth, and relative strength we can see that the economies are improving we’re likely to take more risk as traders particularly for risky assets perhaps like equities or, our risky commodities, and that will be looking to obviously deliver more profit a rate of return a higher rate of return for that added extra risk that we take as traders, and that is the time when we’re experiencing this potentially growth, and very strong growth periods will be looking to add risk and speculate as a result as investors feel the market has been supported by strong influential fundamentals they perceive less risk about the market, and its outlook, and are more willing to take on risk absolutely that’s absolutely the case for traders as perceived risk Falls in the market investors assume a higher risk tolerance volume, and interest will increase for riskier assets like equities, and high bonds, and that’s absolutely the case we have a large increase in interest for risky assets very risky potentially very risky equities could be you know not particularly S&P; 500 foot lower denominations of equity indices where you often see capital flows go in across nations, and in terms of a good trade business between regional nations, and obviously that the aim of those trades is to look for higher rates of return when we do see, and I suppose a risk off approach which we’ll be discussing. Now, we do see that money retract, and actually pull back contract from global investment stocks it’s definitely worth noting as a trader stocks our equity markets are generally seen as riskier assets than bombs, and if we think, what a bond structurally is it’s a debt instrument perhaps we’ll take an example of a ten-year dated bond, and for the German bond.

The German government it’s effectively a loan of 100,000 pounds on one year bond that you’re giving the German government, and within that ten year period, they’ll be making repayments that will hopefully come to around to 3% at nominal levels over the duration of the loan or, the bond purchase. So, it’s not a sort of fantastic rate of return 2% over such a long period of time ten years, what we do have to do is invest in equities something like an equity so, you could return we look at Amazon this year returned over 50% in 2017. So, absolutely fantastic returns are available for those, and very strong yet, curiosity classes let’s have a look particularly at a risk-on example, and it really sends as a signal to, what the current appetite or, tolerance for risk is in the marketplace at this time. Now, I’ve chosen this market in particular at the Euro Japanese yen because it has very strong attachments to the risk-on risk-off approach particularly because, and well this move itself will be described as you remove as I will also will discuss through the chart however the Japanese yen how the currency itself is known as a safe-haven currency. Now,  what that means guys is that when there is huge uncertainty in the markets you see capital flight push capital towards, and things like gold has a store of wealth, and also currency like the Japanese yen and. So, one example could be when there’s a very strong equity sell-off, and capital flow will go into Japanese, and just to store that as cash for a while before markets come back to a high level or, a tolerant level of risk. So, this is the Euro against the Japanese yen. So, what we’re trying to do is currency traders is trade strength first weakness. So, it’s the perfect example here to show you a European example approach to a risk on trade here we have the French election. Now, if we do recall back we had the far-right Marine Lepen, and against many other competitors, and, what who won was Emmanuel Macron who was regarded as a good friend to Europe he wanted to push on, and continued growth in the European eurozone economies, and was healed as a very strong politician in terms of focusing on recovery as opposed to immigration law, and other things. So, what we see is the French selection here 2017 the market the Euro yen is just bouncing from lows then we see a bit of a shock surprise in the French election the bullish mark up as the market jumps over the weekend we see the market, and open up many takes higher, and just on the open ‪on Sunday night‬ there, and after the from the weekend in France that’s very significant technically but, what we’re trying to do here is analyse this fundamentally, and make decisions. So, what is the story behind this trade well the surprising, overwhelming support for Emmanuel macron led to him and taking the French presidency of May 2017 as a politician focused on European growth and diplomacy his campaign was very different from foreign opposition leader Marine Lepen the market sentiment quickly turned to risk-on environment. So, we have a risk-on environment in Euro in euro-denominated assets, ie the euro currency that will lead to euro price increases at the same time we have risk on sentiment pushing back in filling those greedy investors with risk-on sentiment, and we see money retract from the Japanese yen itself. So, it’s a real story of risk-on sentiment changing the market structure, and changing the actual currency pair strength versus weakness we see a very strong definitive trend, and that’s really the start of it in the Euro Japanese yen let’s move on to risk-off risk off environments can be caused by widespread corporate earning downgrades contracting or, slowing economic data uncertain central bank policy a rush to safe-haven investments, and many other negative economic data as perceived risk Rises investors sacrifice return for safety. So, risk off is obviously the opposite of the risk on risk tolerance scale we see investors really sacrificing their 1 for capital their 1 for profit for a return to safety they want to store their profits gained throughout the financial trading, year in a safe haven currency or, commodity some investors harness risk off trading, in an effort to meet their investment objectives this particular strategy hinges on the broader sentiment of the global assets market with a belief that the rising or, falling confidence of investors can motivate them to fail one asset class over another absolutely, and again to reiterate a good example of this is capital flight to safe haven assets can often occur we see the gold market we see the Japanese yen market we see bond markets or, Treasury the Treasury markets in the US a lot of capital goes into bond markets during times of uncertain an indicative of current market sentiment a tolerance for risk at that time I want to point out this risk-off example I don’t need to go through it into too much detail I know you’re really all aware of this the 2008 financial crisis was considered a risk off year an entire year whereby investors aimed to reduce risk by selling all speculative or, risky investments, and move money into non risk positions. Now, apart from the obvious why do we think this could happen well obviously we have Lehman Brothers one of the largest investment banks historically, and very traditional investment bank on Wall Street actually collapsing something that has really never happened before, and sends a huge shock down the market in terms of investment, and retail banking we then see throughout the year I’ll see the financial crisis ensuing but, as a trader or, as a vaster or, portfolio manager owning all these asset classes perhaps an even in a diversified portfolio we see a real attempt to reduce risk by selling all speculative risky investments, and, what we want to do there in this case when we have a risk-off approach is move money into non-risk positions or, non-risky assets to keep them only safe to look for capital protection not necessarily always looking for those profit opportunities when they’re just not available to us in the marketplace.

Now, it should be said that when we understand the risk-off approach in terms of risk tolerance we can then look for those assets perhaps like gold like or, Treasury bonds to actually look to follow that momentum to the downside or, upside in those in those assets themselves let’s go through some economic data it’s very important that we have a real contextual idea of, what economic data moves markets throughout the eurozone throughout the world, and throughout domestic economies in terms of structuring interest rates, and structuring perceived, and ideas of support, and growth within an economy in fundamental analysis, and decision-making we established that knowledge is power for the fundamental trader your ability to analyse economic data with its fundamental effect on asset places, and in relation to the current market sentiment is Parliament to trade in success that’s absolutely the case. Now, let’s discuss many of the economic data variables that are essential to the economy, and to us as financial traders Consumer Price Index or, CPI it’s the change in the price of goods and services purchased by consumers the CPI accounts for the majority of overall inflation, and inflation is important to currency valuation as rising prices lead central banks to raise interest rates in keeping with their mandate for price stability let’s not forget that central banks have mandates to keep prices across the domestic economy stable. So, there isn’t a huge amount of fluctuation, and both in the currency and with the level of overall goods within that economy. So, it’s crucial in terms of interest rates, and its effects I’m novice Lee as a currency trader we need to know and understand consumer price index crude oil inventories obviously this figure will be subject to you deciding to trade, and the WTI crude or, perhaps Brent crude oil, and markets, what is it well the crude oil inventories is a change in the number of barrels of crude oil held in inventory by commercial firms during the past week. So, it’s every week this figure is in earnest I believe every Wednesday at ‪3:30 at UK time it influences the prices‬ of oil, and all other petroleum products it also has a very strong impact on growth as many industries rely on the commodity to produce goods employment change it’s very simple it’s the change in the number of people employed and is a key indicator to reflect labor market conditions, and the overall health of the domestic economy particularly it would be very important in those economies that are perhaps experiencing very disparity in levels of employment, and if they’re not picking up with the rest of the eurozone perhaps at the moment we look towards those indicators to show an overall level of growth in other eurozone, and eurozone block. So, that those employment change figures would be significant from many other different, and nations across, and across the globe really, and in terms of just looking at one domestic economy GDP or, otherwise known as gross domestic product it’s the change in total level of output produced by an economy it is the broadest measure of economic activity, and the primary gauge of the economy’s health. So, that is, what we use, and others the certainly the figure that we use to describe, and the business cycle whether we are in a period of recession whether we’re in economic boom or, whether we experienced in the slope a slump will be obviously negative GDP where we fall back into recession and continue to slide. So, it’s the broadest measure of economic activity, and obviously, kid is the health of the economy. The Germans are ZEW. It’s a key sentiment indicator based on German institutional investors are analysts the reason why it is so, significant. Well, it’s the actual investment analysts not have a say that I have the input into the indicator itself it is a leader in leading indicator in terms of economic health but, those analysts have the know-how they’ve been in the market, and financial markets for a long time and the record is experts within the field.

So, their sentiment is often seen as an early signal of future economic activity ever MC well the FOMC it roughly comes around yeah it’s announced eight times a year the FOMC usually changes the statement slightly simply with the wording in the statement at each release, and this is to reflect changes in economic performance, and guidance it is the primary tool the FOMC, and uses to indicate monetary policy. So, for those u.s. traders, and obviously the world looks as the US economy looks towards the US economy as the biggest and most productive economy in the world, and to show signs to the rest of us in terms of global economic growth. So, very significant indeed non-farm payrolls again a huge economic figure in the United States it’s the change in number of private-sector jobs from the previous month in the US economy, and it is of course worth noting that that does not count for farming jobs they’re actually not counted within the NFP figure the NFP figure is considered the most vital data of economic performance in the US, and is released after the month ends as a result job creation is of huge importance to the US we see that figure come out on month, and relative to the month just before, and we see how that the labor market conditions are improving or, disproving across the United States manufacturing PMI is a survey of purchasing managers in the manufacturing industry why would that be important well it does give us a significant insight from corporate ok the corporate America or, corporate Europe or, wherever the purchasing managers index is coming from ours business reacts quickly to market conditions it’s a leading indicator of business performance, and has a relevant insight into the company’s view of the economy perhaps one of the most important again official bank interest rates, and this is of keen significance over the next coming a two to three years the interest rate at which central banks lend to all other financial institutions, and obviously these interest rates trickle through the rest of the economy the whole financial services sector lead even to formulating your interest rate on your mortgage, and your car loan, and many of these diversified products that are offered in retail banks short-term interest rates are the Paramount factor in currency valuation traders more often will look to other indicators to predict how these rates will change in the future, and last but, not least we have retail seals changing the total value of sales at retail level it’s the primary gauge of consumer spending which accounts for the majority of overall economic activity another is a very important gauge consumer spending when we have something like a credit crisis which we experienced not. So, long ago there are as a byproduct of the financial crisis we look towards gauging consumer spending to see if growth is starting to spark again, and come back into the economy let’s have a look Now, buy the rumour, sell the fact, and how market participants can gear up for these trading, opportunities buying the rumour, selling the fact is a piece of trading! The device developed in early stock market trading, it relates to a situation where the price of a stock would move higher due to traders buying because of rumour, they simply heard about possible company acquisitions or, higher than expected earnings reports. So, there is many many different examples there that could start the rumour, mill where traders would actually say to trade off these rumours, and actually position themselves in the market with the impression the rumour, will eventually come true actual Bayside volume is created. So, that’s, what happens. Now, it should be worth noting depending on the rumour, sell-side volume can be, and created as well it’s not always on the buy-side particularly it has more of a common approach to Bayside volume when we discuss buying the rumour, selling the fact, and equity trading, inevitably when the news or, economic event occurs, and the rumour, turns out to be untrue the sell the fact sentiment takes hold of the market the company earnings perhaps come negative which causes a quick sell-side shock to the market in question.

So, that’s classic example of hearsay where traders interact with the market based on a rumour, of a possible acquisition or, perhaps very good earning reports when the fallacy turns out to be untrue then the market, of course, reacts differently, and then the trade is to sell the fact, and we have a picture here with our financial traders particularly I think equity traders, and I would like to just read the quote at the bottom indicative of high market participants can gear themselves, and trade-off hearsay, and rumours the good news sir is that Harris was able to sell off or, losing stock the bad news is that Simpson here bought them from Horace. So, there is certainly indicative of how market traders can involve themselves willy-nilly trading, off rumours I’m actually looking to profit, and speculate from such rumours but, then obviously the sell-side factor may come in when the story unwinds it should be worth noting in the forex markets buying the rumour, selling the fact is interpreted differently mainly because rumours are not as common on the vast number of variables affecting forex markets would make it very difficult for a rumour, to cause any real momentum or, movement in price. Now, unless the rumour, is an absolutely huge groundbreaking rumour, that will totally rearrange the forex markets it is very unlikely that it will cause sustained or, a very large shock to price in a forex markets given the liquidity, and given the depth of the forex markets indeed the forex equivalent to buy the rumour, sell the fact is to trade in anticipation of current news releases traders often see news releases as a way of making a lot of money very quickly. Now, it’s not always the case but, many traders do take very small positions in pre-emptive positions before news relations are about to occur an economic announcement like the month the monthly non-farm payrolls figure can call dramatic changes in asset prices, and many traders conduct fundamental analysis, and trade in anticipation of speculative prices by the time the news has been released many traders have traded based on the forecasted number, and are. Now, ready to sell a fact. So, let’s just rewind let’s just think about this for a moment we have perhaps a non-farm payrolls we believe it’s going to be very strong given the forecasts, and before the figure comes out we actually make a trade as a trader as a fundamental analysis under decision-making, and we’ve actually made a pre-emptive decision to enter the market before the figure we’re not guessing we’re using our fundamental at discussion of the markets in question, and positioning for the move itself. Now, the figure may come out I’m very positive indeed we’re on the right side of the market well that’s fantastic the market trades up, and we’re in a profitable position, what is our decision. Now, well obviously if we decided to many traders could have very well made the same speculative position we could sell or, trade for a nice profit, and then, what we could do is actually sell the fact we could look for a pullback in that price given that many traders may have expected or, the market has already pressed in this move to the upside, and we know you’re looking to sell the fact, and more often than not we actually do see very strong pullbacks in trades like this. Now, as it is our quest as fundamental analysts, and economic decision-makers to look for these trading, opportunities fundamentally, we must involve trading, behavioural finance into our decision-making. Now, why is that the case will be just discovered how rumours can affect the market, and how selling the fact then can be the reverse side of that trade on the trading, floor all action is based on news therefore rumours in the financial markets have become almost a daily phenomenon if we think of rumours as a form of behaviour we know that rumours are one of the oldest mass mediums of communication in the world, and that’s most certainly the case if you ever recall any old wife tale that you’ve probably heard, and it’s probably from hundreds of years ago, and that’s the rumour, mill that keeps these stories in motion that’s no different to all these rumours that circulate the financial markets only in much shorter timeframes we include this concept with the probability of making money it is easy to see then why rumours can have sudden such a sudden, and effective impression on financial markets, and that’s certainly the case imagine a rumour, that can circulate, and effectively give people information that they can make money from well that’s indicative that’s exactly, what happens in the financial markets, and why many market participants trade, and position themselves prior to the actual news event, and actually trading, the rumour, itself let’s observe how some markets can actually react to these rumours.

Now, I have a few setups here to go through we have the Nasdaq 100 which is the tech-heavy US equity index, and here we have some very inconsistent price action albeit to the upside there’s a lot of volatility, what is the story behind this rumour, well in early December 2017 CNN reported that FBI director James Comey was going to testify to Congress President Donald Trump was heavily involved in pre-election diplomacy with Russia that led to election rigging. Now, a very serious piece of news I’m outlining an implicating Donald Trump in election rigging if that’s the case I would assume the markets would would see a really strong sell-off but, again we’re just reacting to a rumour, here technically we see some weakness to the downside already when the news breaks this is the candle here where we see significant price action, and it really tells a story within that trading, period, what happens is the price action trades down to new lows a lot of weakness there but, within the rumour, within the real trading, day we see a full retracement almost two opening levels on the market closing just below those levels then we see a very bearish candle, and just thereafter with em somewhere indecision within, and the two to three day trading, period very technically significant if you actually look at that as technical analysts but, what does it tell us in terms of the rumour, mill, what does it tell us in terms of the story behind this well obviously as market participants how did we trade this we sell the rumour, when we hear the rumour, that is such a fundamental break, and in terms of scandal in terms of how we perceive the President of the United States, and how that affects equity prices we see a strong sell-off but, effectively we’re selling the rumour, here it’s a CNN report unconfirmed then as the story emerges at the end of the week President Trump it had emerged had simply pushed him to end the FAA investigation early but, was not implicated in any scandal, and of course, what we see is by the fact with some very strong, and trading, to the upside in the in the overall trend we see it just a trace I can use my epic pan here just to actually show this by the fact literally from our indecision candle here we see a very strong trend back to the upside as a by the fact sentiment really starts to dominate market interaction there in discussing trading, behavioural finance we can look towards a second example another fascinating rumour, here we have AM t-mobile in the US a telecommunications company, and some really an unquantifiable news about a possible merger with AT&T; one of the rivals on another big provider within the telecommunication sector in the United States we have on covering AT, and t-mobile discussing merger talks in an effort to better compete with competitors, what do we see with the price action we see a by the rumour, mill starting already we see a albeit from 61 around 61 to $63 jump within a very short period of time, what happens, and, what really unfolds within the story is the rumour, turns out to be true but, despite the talks both parties both parties very quickly filled to reach an agreement, and the merger feels, and then the sell the fact trade comes straight into the marketplace, and as those early just think about, what happens there in terms of trading, those early market speculators buying the rumour, albeit proof right the market direction is clearly not with them, and they have to get out of those positions that allows them to sell their positions, and it allows a lot of new sellers into the market to drive those prices down to new lows there early November at 2017 in terms of fundamental analysis on decision making how do we avoid market traps well we have a legendary British American investor, and professor here Benjamin Graham give us some fantastic insight through the market he has a very famous quote observation over many years has taught us that the chief losses to investors come from the purchase of low-quality securities at times of favourable business conditions another’s indicative of doing your due diligence as a fundamental analyst, and making those well informed decision making, and trades particularly when we are in times of very strong economic boom a lot of traders simply believe prices will still go up no matter, what the asset they decide to trade or, no matter, what the equity they decide to trade that is not the case certainly we do our due diligence for each particular fundamental trade in each particular asset our market in question as fundamental analyst it is essential we focus our decision-making on all fundamental news affecting the price all the assets we must never rely on any one variable, and that’s certainly the point we’d like to make there how do we avoid these necessary, and are these very common market drops, and particularly as beginner traders well a few points to look out for avoid trading, with the domani, and this is indicative of actually looking for good trading, opportunities as well but, we try, and trade with this smart money in reverse we do not want to be the last person buying a very strong move to the upside or, the last person selling a very honest, and weak move to the downside. So, avoid trying to jump in, and chase the markets, and obviously that leads on to a second point being the Dom only following in being the last, and rap to jump ship when the ship is going down is not the way the wisest trading, decision indeed always protect your trade with stop-loss no we will have plenty lessons on risk management coupled protection is absolutely key empowerment to your trading, success in terms of avoiding those market traps always protect your trade with the stop-loss do monitor the markets at all times, and a key point here is do not become a victim of overconfident analysis. So, again relating to the point of the webinar fundamental analysis, and decision making well obviously we need to monitor the markets another’s one downside I would certainly say two fundamental analysis that many traders do a lot of research a lot of to diligence in formulating trading, decisions, and because they put a lot of time, and research into the market they cannot take a looser way in the market proves them wrong. So, do not become a victim of overconfidence analysis, and always monitor the markets learn to combine the fundamental decision-making with technical decision making, and that lends itself to always trying to stack the odds in your favour as a fundamental, and technical trader to heighten your probability of successful outcome fundamentals, and timing absolutely a key aspect to financial trading, are given the fundamental analysis aims at having specific expertise in certain markets this knowledge factor will help the trader to enter the market at a more specific time period. Now, it’s a very difficult feat or, arm challenge that lies ahead but, it is indicative for some markets where your fundamental analysis on your expertise will heighten your probability or, heighten your skills in terms of timing, and entering the market. Now, that does sound difficult but, let me give you a few examples seasonality is the phenomenon that causes crop prices to behave in a relatively predictable manner year in, and year out. So, if you are a fundamental analyst, and you are studying perhaps the soft commodities, for example, wheat sugar a corn coffee commodities like these are very seasonal, and in relation to the weather on the nation which where they are grown. So, your analysis will take a lot of a fundamental bearing on the supply, and demand functions of those crops, and as a result of the seasonality factor, and underlying the the price of those assets changing year in, and year out, and obviously in terms of timing it will allow you to focus on a more specific time period to actually looking for those trading, opportunities microeconomic trends indicate consistent growth consistent economic growth and. So, equity investors activate a buy the dip mentality again if we know that we’re in a very strong macroeconomic trend to the upside current market conditions are strong we look for perhaps those market Corrections or, are those times when short term price fall is that they do send the markets a little lower, and those can provide us with buying opportunities fundamental buying opportunities certainly and would be the decision their bond yields react to interest rate changes, and in theory conform to a yield curve. Now, quite complicated generally bonds yield curve, and which simply means that they have different durations to the bone structure, and we’ll pick a bond to let’s say that the german bond has a two-year a 5-year a ten-year, and a 30-year am duration all together that will create a yield curve reflecting the yield on the price of the bond, and its rate of return on the bond itself. Now, in terms of actually trading, and looking for timing trades we know that, and these interest rate changes affect price, and affect yield, and when there is a divergence from the yield in one duration or, another it is to converge back into a nominal yield curve those can allow us fundamental trading, opportunities should we understand better the expertise in the bond markets indeed timing, and this is the mean point timing is always the most difficult, and sought-after skill for financial traders nuts absolutely the case if everyone had perfect timing skills we will all be making a lot of money in the financial markets knowing when exactly to enter the markets before prices move soon after would deliver the sharpest of trading, edges as we are not able to consistently do this we must focus our attention to stacking the odds in our favour both with fundamental knowledge of the markets on how they react to news events, and with technical insight into price movement itself. So, all combining we need to have a full combining fully broad-based approach to our fundamental analysis, and to allow well-informed decision makings that’s the real point, and to actually construct well the form decision makings when entering the markets. Now, that concludes our study on fundamental analysis, and decision-making volume 2 in this webinar we looked at fundamental analysis on the risk environment, and obviously that considers and takes a fully broad approach to risk off sentiment, and risk on sentiment in the market we discussed analysed economic data, and how they affect market prices we looked at buying the rumour, on selling in fact, and how they actually both provide very good trading, opportunities when we know that our fundamental analysis is not in sync with these opportunities we looked at behavioural finance in trading, and how that can lead to trading, opportunities as well, and moved on quite nicely there we looked at avoiding market traps to try, and avoid those very common pitfalls beginner traders all see occur when entering the financial markets, and then last but, not least we finish off with fundamental timing we can agree that timing is the most difficult skill when deciding to trade the financial markets but, with a keen eye to your fundamental analysis approach, and we look to have well-informed decision-making skills, and obviously out some technical analysis in there as well to stack the odds in our favour thank you very much for joining us on this instalment of courses on demand brought to you by forex tell academy we do hope to see you very soon bye for now.

Categories
Forex Courses on Demand

Fundamental Analysis Part 1 – How To Read The Markets

Hello and, welcome to this latest edition of courses on demand brought to you by Forex Academy! In this course, we will be discussing fundamental analysis on decision-making. As always, there is, of course, inherent risk when, trading in the financial markets. So, just before we begin, please do take a moment to familiarise yourself with the following disclaimer.

In focusing our attention during this webinar to fundamental analysis what we aim to outline is the foundation of fundamental analysis, why is it different from technical analysis, and why is it such a prominent school of thought, in terms of financial trading. With that, we will be looking at quantitative versus qualitative data. We will be assessing true market reverse on those market drivers specifically the effect price over the long-term that leads us nicely on to assessing economic data as, well as, those large non economic events that totally changed the macroeconomic account totally changed the macroeconomic environment that the market is experiencing and, that obviously leads us nicely into looking at market positioning how do the large financial institutions actually position themselves in the market looking for a long-term price profit first and, foremost let’s look at the foundation of fundamental analysis global asset prices move as, a direct result from what is happening in the larger economy depending on the asset class or market, the fundamental trader must acquire a unique level of knowledge specific to the market to be able to develop an edge a trading edge and, obviously then trade effectively the characteristics of fundamental trading can also be very different depending on the asset class forex trading requires a wealth of knowledge on macro economics commodity trading requires complex reasoning of the supply and, demand variables of that commodity and, equity traders must have the know-how to fundamentally analyse price earnings ratios growth projections and, company performance in relation to competition. So, really no matter the scenario knowledge is power in better understanding the overall economy, then we can achieve a better awareness of how asset prices will move with economic data. So, let’s actually consider a few of those economic and, data examples we have sustained economic growth how does that affect equity prices well of course we’ll see equity prices rise over the long-term and, as, the macroeconomy is performing well we will see more jobs come into the economy job creation will see more consumer spending and, we’ll see that result into strengthening the equity prices over the medium to long-term rising inflation perhaps, what effect would raise an inflation have on the gold market? Well, the hedge against inflation is one of the traditional motors behind gold investment and, really is to protect capital erosion against the rising cost of goods and, services. The investment community often floods the precious metal market in search for a store of value. So, if we just think about that for a moment, we know gold is a store of value. We know that rising inflation relates to long-term increases in and, the price of goods or services. So, if we want to protect capital from that price increase of currency our goods and, services, what we love to do is actually invest in something that can store that value and, hence gold. So, we’ll see prices rise in gold rising oil prices how might this effect perhaps the currency let’s look at this example the US Canadian dollar well when prices for a key export increase the domestic currency of economic exporters will also increase. Now, the Canadian dollar, otherwise known as, the Lunia is quite significant in terms of oil prices. The loonie was strengthened when oil prices rise as oil is a major export product for Canada. So, we will generally see and, strengthening oil prices and, a relative strengthening in the Canadian dollar or otherwise as, expressed in this small chart downside in the US dollar but that’s really representative strength in the Canadian dollar escalating conflict in the Middle East and, oil well this is much more of a simple one obviously we will see prices go up as, there are fears that the supply mechanism for oil from the Middle East may be compromised will see oil prices rise as, we move on discussing fundamental analysis of course analysis foundation we cannot and, forget legendary investor Warren Buffett who is a key investor in and, assets that coca-cola he owns his own investment firm brochure half the way I’m really his idea established through global investing communities and, and his knowledge is absolutely fantastic indeed the aim of the fundamental trader is to assess value. So, he’s a real value trader if, we properly assess value then surely we can develop our decision-making skills to identify promising trading opportunities and, that’s it that’s really the us the asset of a good fundamental trader to properly assess our value as, a result of the fundamental research.

So, a good quote from a legendary investor Warren Buffett is it’s far better to buy a wonderful company a fair price than a fair company a wonderful price that’s absolutely the case as we assess fundamental analysis on decision making we must look at quantitative versus qualitative data. Now, considering the distinction between the two types of data we typically define them by referring to data as quantitative if, it is numerical in form and, qualitative when, the data has a more theoretical basis. Now, why is that the case? Well, qualitative data is more concerned with understanding human behavior from the informant’s perspective and, they formed is simply ourselves as, economic agents and, traders. It assumes a dynamic and, negotiated reality. So, there’s a level of discretion to understanding our qualitative approach in contrast quantitative data is concerned with discovering facts about social fun it assumes a fixed and, measurable reality in other words the fixed immeasurable reality is the raw data the numbers that we try to derive social phenomena and, extract thought from that with the method death data are collected through participation observation in interviews data are analysed by themes from descriptions by informants again that’s simply us unreported in the language of the informant in contrast their quantitative data are collected through measuring things data are analysed through numerical comparisons and, statistical inferences and, data are reported through that statistical analysis. So, we use with quantitative data the raw data to formulate charts and, graphs to give us an overall picture statistically and, to look for social phenomena and, obviously help trading decisions fundamental trading is considered to be more a qualitative approach qualitative research is multi-method and, focus involving an interpretive naturalistic approach to matter this means a qualitative researchers study things in their natural settings attempting to make sense of or interpret phenomena in terms of the meanings people bring to them research following a qualitative approaches explore exploratory and, seeks to explain how and, why a particular market is behaving and, therefore fundamental traders often based their trade decisions on a question of value, what does that mean for our trade decisions? Well if, research shows that an asset is undervalued these traders will look for buying opportunities if, on the other hand research suggests and, us is overvalued these traders will look for selling opportunities technical trading on the other hand is considered to be more a quantitative approach quantitative research collects data in numerical form which is then subjected to statistical analysis the data is then measured to construct graphs and, charts to physically represent patterns or ideas that provide statistical reasoning as the research is used to test a theory it aims to ultimately support or reject the hypothesis. So, as, this approach tests raw data it can be applied to many different environments and, that’s a huge advantage to using this quantitative approach and, actually deriving reasoning from the raw data across a many different many different fields or industries data analysis helps us turn statistical data into useful information to help with decision making and, therefore a quantitative research is more focused on our objectivity and, that would certainly be the main reason why we would say quantitative approach or quantitative trading, it has more of an essence of technical training because as, technical traders we want to become very objective if, we look towards our technical indicators to take Bollinger Bands as, an example it uses a statistical model across a variation from the mean and, follows price action to look for objective trading decisions as, such. So, certainly the case technical trading is considered to be much more of a quantitative approach that’s like true market drivers and, assess how those market drivers really affect price over the long term market trends are shaped by larger economic factors. So, first and, foremost we can look at government influence higher kind of government influence and, the financial markets and, really drive prices over the long term by increasing or decreasing interest rates the government or the US Federal Reserve in the US there can slow or accelerate growth. So, this is called monetary policy. So, actually by using government Paul say they can manipulate the financial markets they can actually manipulate the price of assets and, actually our fundamental themes in including rates of unemployment and, consumer spending try and, slow or are if, the objective is to accelerate growth they can do that via monetary policy the government can attempt to ease unemployment and, stabilise prices by increasing our contracting spending is called fiscal policy. So, very real and, events social events are social constructs within an economy can be changed I’m manipulated by government influence and, that can lead to long term price drives and, particularly in the equity indices on in something like a domestic currency cup and, flow. Now, I would couple the flow have a huge impact on market price and, really drive prices over the long term the more money that leaves the country the weaker the country’s economy and, currency becomes stronger in countries that export more than they import, keep the economies generally quite strong and, we can see the level of capital flow between nations we have certain agreements. Now, after to be one there it’s seen a little bit of – on discussion in the news at the moment certainly these trade agreements and, levels of capital flow as, they moved from contrary through contrary affect exports and, imports and, have an overall economic effect on the domestic economies speculation on expectation the direction consumers investors and, politicians believe the economy is headed impacts how we act today another’s most certainly the case the sentiment indicators gauge, what certain groups think the economy is doing. So, this is one example where we can see actual speculation and, expectation almost become a self-fulfilling prophecy whether it’s the phenomenal institution or investor or a top-level politician not and, that believes that prices aren’t stabilising and, there needs to be some real government change that can actually cause and, a self-fulfilling prophecy when, the government comes together to actually interact change and, actually and, confirm policy change towards long term price movement under our level of consumers their supply and, demand and, obviously the key function of supply and, demand will and, totally dominate many assets particularly the commodity markets supply and, demand for products currencies and, other investments items in demand with shrinking suppliers will see their prices rise if, supply outpace its demand prices will fall and, it’s all was you know a balancing act between supply and, demand to actually interact with the market forces to drive the market and, to formulate ,what the market sees as, fair value at that given time as, mentioned there particularly in asset classes such as, commodities the oil market soft commodities like wheat sugar they are all very much supply and, demand driven in terms of their price and, that’s certainly a true market driver over the short medium and, long term for those asset classes economic data economic data is important as, it reveals a true picture of an economy’s condition it allows traders to understand how economy stands in respect to others and, can help us determine whether monetary and, fiscal policy and, other financial programs have been successful.

So, why is it so important in terms of decision-making and, fundamental analysis to understand economic data? Well because we need to understand the overall macroeconomic picture of a domestic economy and, how those economic data releases are actually subjected to and, discretion or are subjected to a level of interpretation by market participants in keeping with that we look at the business cycle economic data is particularly important to us as, can indicate how the economy is performing at those various stages of the business cycle. So, most certainly, what would be more significant is a huge jump in risk in and, the rate of unemployment, for example, a huge and, decrease sorry in the rate of unemployment would be more suitable weakened in times of recession as, opposed to a time of boom where unemployment is very high. So, that will certainly drive the market in very different scenarios and, where you will see economic data surface in the market and, upon that announcement prices will move and, according to how the market interprets the data at the given time throughout the business cycle. Now, when, trading on economic data we must ensure that we know exactly ,what we are doing in order to trade on this economic data we must understand how the release data will fundamentally affect the market in question the data very much depends on the market we are interested in trading and, that’s very important to notice I’ll give you a very simple example if we are looking to trade the crude oil inventories we will certainly be looking to trade the oil market as opposed to a Forex pair based on a huge increase or decrease in supply in those crude oil inventories. So, it is indicative of which asset class or market that we are choosing to trade economic data often has a very different effect in the short term, not in the long term. So, do be aware of that when, trading the financial markets guys often ,what you can see is a short term burst to one side the market can react quite irrationally we often see a quick burst perhaps to the downside in price movement and, as, market participants come together to formulate unreason behind fundamentally why the market is and, is pricing in the news that way we can see a price is reversed in the more medium to long term and, actually, in this case, I create new highs that and, form a bullish trend. So, mortgage can react irrationally to economic data and, often miss judge or miss price market fundamentals often take time to affect price change and, create trends let’s have a look at non economic events they are they can be quite significant in terms of fundamental trading under effect on the markets fundamental trading lends itself to also interpreting how non economic events can affect price analysis most often be carried out individually for each particular asset, what non-economic events affect price and, decision making well perhaps internal developments within a company. So, if, we look at a stock or our perhaps stock market equity like Google very famous indeed perhaps there’s a very concerning internal development and, considering profit projections and, that have not been released to the market but when, the market gets wind of of this projection these developments cause very sure uncertain price movement for the particular market in question we look at world events again a non-economic event but certainly global world events such as, war civil rest and, natural disaster often we see in the United States and, a hurricane season can have a devastating effect on some of those financial assets as, well and, hype, of course, is one not to be a misgiving hype is very important in terms of sentimental analysis and, if, we look across ,what has happened there him over the last six months certainly considering Bitcoin and, the frantic price rise of Bitcoin we can see that hype has very much a big factor a big role to play in price movement in the cryptocurrency let’s look at the case study here for a non economic event we have a non if, you’re familiar with this case it’s an absolutely fascinating story Enron 2001 a company was an energy corporation in America and, the commodities company once self-proclaiming to be the largest energy company in the world and, Ron eventually filed her back home to see bankruptcy following a sustained institutionalized accounting fraud that inflated share prices for several years absolutely scandalous the aftermath of the Enron scandal destroyed confidence in corporate America and, led to a huge retreat of capital from US equities particularly it may be mentioned in the energy sector. So, obviously as, an energy company this destructive news can filter its way in through the sectors and, obviously cause very negative long-term price action indeed although, the scandal was a huge shock to the market fundamental traders knew this non-economic event would have hugely negative effects for months to come we have a quote here from a Robert Miller who is heavily involved in the case the collapse of Enron was devastating to tens of thousands of people and, shook the public’s confidence in corporate America can you think obviously why a case like this could really have such an effect on equity investment in America particularly in perhaps an energy sector or utility sector investments such a huge scandal obviously it’s you know trading equities has as, much to do with confidence and, in ownership of shares as, well as, price performance. So, it had a devastating effect and, just goes to show higher non-economic singular raised at natural event like this within and, within one particular company can have such a negative effect in the marketplace that leads us all nicely to market positioning ,what a positioning is all about the big players the big traders in the marketplace that are looking for these big trades they don’t necessarily involve themselves with short-term scalping or our very short positions in the marketplace like many traders do, what they look to do is particularly hedge funds develop a very consistent very well-thought-out fundamental trade decisions based on a lot of cute fundamental analysis on decision making for many large market participants such as, finance institutions and, hedge funds the very essence of the training will target long term price changes as, a result of changing macroeconomic variables their decisions are thus a result a very carefully conducted fundamental analysis.

So, this can help us as, well if, we know a large institutional is positioning itself within the market place if, we have a feeling or a sense or perhaps news that would dictate with which direction they’re looking to trade that will certainly aid us in our decision as, well in the peeler to large news source institutions will build large long or short positions in the marketplace the objective is either for protection from risk or from profit obviously profit being a main objective for long term fundamental price change why would they look to perhaps protect themselves from risk? Well if they perhaps know that there’s going to be a large appreciation or depreciation in the currency they may have a lot of other assets denominated in that currency and, the objective, therefore, could be to position in the market to actually look to hedge that risk within the currency markets themselves. So, with many different objectives there they look to take these huge positions in the market it is often these large market participants that cause large swings and, volatility when, realities do not meet the market expectations and, that’s absolutely the case ,what we’ll do is actually look at a few examples here to explain ,what we mean when, we see market positioning go wrong here we have the breaks a note and, this is the cable or pound US dollar market obviously very significant in terms of a world non-economic event but it was a huge piece of news a huge shock to the market at the time and, obviously we can see how the currency itself reacted ,what we see is fear within this price charting moving down we see a little bit of a price channel form with a support level of resistance however, that fear leading up to fear and, uncertainty leading up to the week’s just before these are daily comment sticks the week before and, the actual decision shows that there is some fear and, uncertainty and, some money coming out of sterling in relation to the dollar ,what we then see is market positioning ,what I do remember when, we before we’ve seen a lot of fundamental analysts coming out with her and, forecasts to say it was more or less a ton and, oyster dealer there was no way and, the UK would be leaving the European Union and, we see this reflected in the market price market positioning then hits the bottom with many green Commerce in a rope suggesting that this has been priced in these large market participants are really pricing in and, a stayer vote that the UK will most certainly stay within the European Union and, that’s reflected as, the price trades up within this week leading up to the decision itself then ,what we see is the bracelet leave vote a massive shock to the market we see some serious volatility to the upside and, downside and, then the currency actually trades down the whole way from one around 147 to 133 within one day trading an absolutely huge percentage loss in the overall price of sterling a huge shock to the market we can see that it’s technically very significant given high market positions we’re actually giving up for a stayer vote they were all proved wrong well that’s inevitably if, we look closer at this price actually ,what we see within the price action the caramel slip structure here tells us a fascinating story of high market participants began to prematurely price in the expectation of a Bryce it’s their vote heavy long position accumulated in the pound US dollar almost a week before the fundamental decision was made. So, they’re trying to position they see a very strong probability that the UK will obviously vote to stay and, Sterling value will increase over the medium to long term certainly that does not happen they are proved wrong and, they suffer the consequences. So, a fantastic example to see how market positioning, particularly with expectation and, a vs. result, actually affects the market again market positioning we look at the U.S. presidential election this is the S 500 ,what we can see here is uncertainty leading up to the November and, presidential election decision in the week leading up to the presidential decision market participants prepare for uncertainty by unwinding long equity position. So, there’s just a level of uncertainty in the markets and, in terms of a risk on risk off approach and, ,what she’ll be discussing with many of the fundamental analysis webinars we can see money coming out of US equities and, really positions on winding ons the market rates turn to new lows there then when, we see within this little green area in the days preceding the election market participants begin to position for an expected Democratic win almost like the Braves did vote it was am being starting to be priced in that Hillary Clinton was am a head in the polls there was no way at all Trump would be elected by the US populace and, that the market really starts a position for the higher probability trades evidently ,what we see there in the market experience is large volatility we can see the candlestick there just and, I think it’s the ninth of November that date indeed we can see the Trump win causes severe volatility to the US equity market but ,what it does actually is eventually lead to a bullish trend how’s the market formulates where prices will go ,what that actually means Trump selection ,what it means for the overall economy obviously he has huge reforms and, has implemented his reforms in terms of tax ,what that means in terms of us speculation on equity prices and, we see a large trend start to path the way from that day indeed and, that concludes our study of fundamental analysis on decision making with our webinar outline there we should at this stage understand that the foundation of fundamental analysis why it is so, key in terms of fundamentally analysing the financial markets and, deriving a basis of price for value we should understand quantitative versus qualitative data and, the difference really that quantitative is more numerically focused and, qualitative is a human behavioural approach to assessing data we looked at true market reverse and, particularly assess things like government influence supply and, demand functions and, how they can affect price we looked at economic data and, non-economic events and, see how those news events really play out in the market in terms of beans objectively this cost three market participants on how those market participants react in accordance to their sentiment on those data forms then we looked at market positioning and, we can see how those large finance institutions really gear up for long the big term trades the macroeconomic trades and, when, they are wrong high price can be very volatile and, cause massive shocks to the markets indeed thank you very much for joining us on this latest instalment of courses on demand by Forrester Academy we do hope to see you very soon bye for now!

Categories
Forex Courses on Demand

Assessing Directional Bias – Predicting Long Term Trends


Hello and, welcome to this latest edition of courses on demand, brought to you by Forex Academy. So, in this course, we’ll be looking to discuss directional bias and, the importance that directional bias can have in the traders’ decision-making processes. So, just before we begin then if we could start as we always do with our disclaimer, please do familiarise yourself with our disclaimer and, also, the risks involved in trading these financial markets okay.

So, let’s do let’s cover a brief outline in terms of what you can expect over the duration in this course. We’ll start with an introduction to directional bias just explain to you what it is in detail and, then we’ll we will discuss the importance of, as a trader being able to have a direction of bias and, it’s not to be confused with having a biased opinion on a market. So, there is a difference to be made and, we’ll also, look at market conditions and, how those can change very quickly and, therefore, what role directional bias can play in a changing market environment then we look at directional bias in practice. So, some of the things that you would need to consider if you’re looking at a price chart and, you’re a technical trader and, we’ll have a look at how you can apply these things in practice it’s it’s also, important to know, and, understand, the type of trend that you might be looking to trade. So, what we’ll do is we’ll have a look at direction of bias in and, primary trend but also, directional bias in the secondary trend and, we’ll explain what we mean by that and, then we’ll just finish off with some final considerations to be made about the topic of directional bias okay. So, let’s start we always deal with our introduction to directional bias and, we’ll start by a brief definition from a training perspective a directional bias is when a tray has a really strong conviction that a market will either move to the upside or to the downside. So, it’s just predetermining that as a potential outcome. Now, there is a school of thought that suggests that bias must not play any part in trading decisions; it’s something we hear all the time you know, don’t be biased when you trade. Now, from a risk management perspective we absolutely and, categorically agree allowing various to cloud your judgment when in the losing trade, for example, is a big no-no for consistently profitable traders. So, it’s that desire for the markets to perform in a way in which we want to be proved correct. Now, that’s not really what training is all about. So. So, try not to be too biased in your judgments where you can look at a chart it’s clearly moving in one direction but for some reason you seem to perceive it as a market that is moving in the opposite direction to the way the market is actually moving and, and, therein lies the difficulties. Now, being able to clearly evaluate market movements allows a trader to establish the directional bias. So, if you have a methodology which can evaluate which way the market is moving that can, therefore, allow you to with a high degree of probability establish a direction of bias. Now, this is key before trading opportunities are identified. So, this is at the very early stage of that decision-making process. So, for example, if you if you do your analysis and, you believe that a market you know, it’s a strong likelihood that the market is going to push to the upside you can then have a very bullish bias to that market and, therefore, then you will be looking specifically for buying opportunities in that market.

So, an awareness of this bias is absolutely essential in your in any traders trading making processes. So, as a key note understand, the difference between having a trend bias meaning you you’re conducting your analysis and, you are looking to actually look to buy a market or to sell a market for a specific set of reasons as opposed to simply having a biased opinion of the market, for example, a throwaway comment which could be I think the gold market is going to move to the downside. Now, that’s having a biased opinion, you might have read an article. There might be some reasons for that, but is it based in anything tangible that you can work with as far as trading these financial markets. So, and, that’s where having a trend bias is actually far more stable; let’s say to be able to base those opinions on okay. So, let’s have a look at the importance of directional bias and, the role that it can play in traders’ decision-making processes. So, technical traders understand that directional bias is absolutely important to their approach. It is important to know when trading the direction of the primary trend that its movement is generally always supported from both a technical and, fundamental perspective. So, that’s the beauty about the principles of trading the trend of following the trend if you know, which direction the primary trend is moving in and, this is the overall trend of any particular market and, we’ll discuss will discuss primary and, secondary trends very shortly and, but if you have a comprehensive understanding about the overall direction of a market then often a lot of that move is very much supported with from a fundamental perspective as well. So, that there’s something behind that market which is continuing to drive prices higher and, the technicals start to work hand, in hand, with the sentiment and, the fundamentals behind these market moves and, that’s where a little comes together quite nicely for those technical traders looking to apply a directional bias and,. So, really take control of the markets wait for the markets to come to you. So, if you do have if you have a direction of bias but the market has to be pulling back then allow it to pull back to maybe a level of support resistance of some kind where it’s a technical tool or whether it’s an indicator whatever you base your decision-making processes on you know, please do. So, and, do take control. So, really it’s a case of looking at the charts and, deciding if the market pulls back to this particular price I’m gonna look to buy it from that level and, that’s what we mean by taking control rather than allowing the market to be very choppy move up move to the upside where you’re looking to buy it and, then all of a sudden the price turns around and, all of a sudden you’re looking to sell it. So, that’s someone that is that doesn’t really have a particular direct directional bias based on anything meaningful. So, do try to wait for the market to come to you and, don’t go chasing those markets because nine times out of ten there’s only one winner if you don’t really understand, what type of trade you’re going to execute and, the parameters of that trade as well. So, always try to develop a direction of bias when you trade determine in advance and, it’s very important that this is done in advance whether you are actually looking to buy or to sell a market um or even do nothing which of course is very much a viable option depending on the market conditions. So, you will experience certain market conditions where the prevailing opinion would be for you to effectively do nothing and, we’ll discuss what those market conditions are like very shortly. So, ultimately having a direction of bias prior to entry where you do have a certain degree of conviction on the direction of that market that all underpins a very successful approach to trade in these markets. So, moving on then to market conditions and, again it works hand,-in-hand, with being able to make the decision in terms of what you are looking to do when you trade these markets and, having a comprehensive understanding of market conditions is is very important. So, just to focus on market conditions for and, market conditions relate to the way in which the market is currently trading. So, in other words is the market trending are we getting big moves to even the outsider to the downside is it consolidating is it actually moving sideways and, and, so-called taking a break is it incredibly volatile we’re getting big market swings or is it lacking direction or is it is the market actually technically illiquid and, these are just a few descriptive terms where people use to discuss market conditions volatility illiquidity lacking direction consolidating trending. So, these are all the terms that can be associated with market conditions. Now, markets can move from one phase to another quite seamlessly, and, it can happen very quickly. So, therefore, it is a traders responsibility actually to be able to identify varying market conditions and, knowing and, understanding what those conditions are. So, to just touch upon a few of those I’m just looking at his first chart currently up on screen you can quite clearly see we have price action moving from bottom left-right the way to the top right of this chart and, you don’t need to be a genius really to identify that we are in a bull market with prices moving quite explosively to the upside. So, so, in this market condition it’s a trending market  it’s  fairly volatile we even get these significant pullbacks in this market and, but we get to see a significant direction in this market and, it’s just looking for opportunities to buy and, this type of market and, if you do. So, you’ve got a higher degree or a higher chance of being successful when you trade these markets.

So, that’s definitely worth bearing in mind somewhat when we trade. So, looking at if I take this off the page and, we look at the second example. Now. So, this too is a trending market; however, we are trading this market from top left as you can see the bottom right. So, on this occasion, it’s a trending market, but the direction of bias without a doubt is to the downside until you get to these lower levels down here. So, this marketing can give you loads of opportunities to look to sell these markets at various price points as prices push lower and, that’s how a trader can use this information to look to capitalise on what would be a higher probability trade setups. Now, in addition to trending markets moving to the upside, we can also, have consolidated markets and, these are just markets that maybe straddle a level of support resistance where the lows and, the open and, closes really struggle to break above this period of consolidation or below it. So, what you find and, they will experience is just this kind of indecisive price action which is ultimately moving sideways and, and, it may be a little bit more illiquid and, it’s really a case of understanding looking at the charts and, identifying what the market conditions are in terms of how that will enable you to have a direction of bias. So, one approach might be to if you get a confirms break below the level of consolidation you might look for a no brainer sell trade and, the same applies to the upside if we get a confirmed break to be to the upside in this market you might look for an opportunity to buy this market. So, it’s about having a directional bias if x y happen to conform with that view of perhaps conducting the technical analysis and, then applying that information in a very practical manner and, understanding market conditions as a fundamental part of that decision-making process. So, that’s just touching upon market conditions. So, putting directional bias into practice. So, how do we go about doing it and, we’ve identified it kind of briefly a couple of areas but we’ll document them. Now, first of all, a visual observation. So, understanding that markets are moving from bottom left to top right, you’re in a trending bull market top left to bottom right you’re in a bearish market. So, visual observations are very useful. So, to our technical charting tools we can use diagonal lines and, horizontal lines to assist us in that decision-making process we can also, use technical indicators to assist us with a directional bias to look to provide potentially support and, resistance in those markets but to generally give us a bit of an overview about these markets and, also, your ability to be able to analyse Japanese candlesticks  will assist you as well with being able to apply a direction of bias when you trade these charts. So, what we do is we put all these together in a practical fashion. So, we’ll have a practical look at directional bias in practice. So, for this I’m just going to bring up our trading chart and, we just have a look at the oil market and, this is the current price up here by the $70 level and, we can see looking at this market and, effectively what’s been happening. So, and, the first thing is to have a visual observation and, again we’re just broadly and, it’s very crude and, just identify that this chart is starting from bottom left moving up to top right. So, we are very much in a bull market and, that is just purely a visual observation.

So, what you can what a trader would do when they see a market like this is just look for opportunities to buy this market. Now, what he needs to make these decisions and, as you can see it’s not linear it’s not just it hasn’t just moved from this bottom left hand, corner to top right and, the price down here and, the bottom left is around the $40 level. Now, we are close to nearly doubling that. So, we’re up at $70. So, we’re clearly in a bull market and, there’s their significant fundamental reasons for this price move from $40 to $70 that is just as a point of interest really is to do with the OPEC and, non-opec countries agreeing to restrict the supply of oil in order to push the prices to the upside. So, very volatile market you know, fast-paced very fast-moving but is been moving to the upside as a result of fundamental sort of developments that lay in wait in this particular market and, what you can do is you can use technical tools as well. So, we’ve got visuals that we can utilise and, technical tools well can allow us to identify support and, resistance and, you can you can apply a lot of this information fairly seamlessly and, it starts to build a little bit of a picture in these markets and, you can see how these prices range and, bounce from one level to another. So, you can capitalise if you conduct your analysis, you can do some significant and, you can use these technical tools to conduct some significant analysis on this market. So, in this example we can see we’re in a bull trend from this time last year effectively sort of summertime 2017 and, a trader can absolutely use this level use these technical tools to build a bit of a picture maybe give us some fantastic opportunities to look – to buy these markets on multiple occasions and, we’ll discuss these a little bit when we’re discussing Japanese candlesticks  and, analysis and, the information that I can give us. So, we’ll zoom into this chart in a minute but just roughly broadly speaking using these technical tools to identify that yes an uptrend does exist you can see how price conforms to the to the technical analysis of which is currently up on screen and, that can give us some fantastic opportunities when it comes to entering and, exiting these markets. So, and,. So, in addition to a visual observation in addition to using technical tools like lines and, levels and, we can also, use technical indicators as well. So, what we’ll do is we’ll put over the analysis we’ve already carried out we’ll just put in a 20-period simple MA and, really if you were in any doubt whatsoever that this market is moving to the upside just look at the slope of this dis moving average and, it is a directional indicator it can help you indicate direction. Now, we can see it visually we can apply some technical tools and, we can also, apply you know, indicators to help us with that directional bias. So, really it becomes a no-brainer opportunity for traders to look for opportunities to buy this market and, that is where a traders’ understanding of technical support resistance and, technical Japanese candlestick analysis can actually come in quite nicely. So, if we zoom in you can see when these markets interact with these prices and, you could adopt a very straightforward if you understand, what is going on inside this level you can see just for this example, it coincides with a level of support at the 5865 or we can see three rejections to the downside, which is failing to close or to break below the ascending level, we can see that the close of the market is actually above the 58 64 and, we can see the bearish candlestick is not that enthusiastic in terms of pushing lower.

So, you could argue it is there an opportunity to buy this market at that level just from a common-sense perspective the answer would be yes. Now, it’s not just that interaction with these levels and, there is plenty others and, I’ll take that interaction off and, just broadly speaking, looking at this area. Now, and, we can see that the daily lows all roughly coincide with each other and, we can also, see the market is failing actually to either closed or open below this level and, we are still above an ascending level meaning it’s very likely to support prices to the upside and, that’s what we’re experiencing. So, then we can look at these Japanese candlesticks and, we can see can we see an injection of significant upward volatility in this market and, the answer is yes we can see the buyers coming into this market. So, it might be an opportunity to buy it above this level and, as you can see the market kind of rolls over to the downside, it still performs it still stays intact and, then you get that explosive move. So, the timing of this traders are all important as you can see however, if we decided to get in at this level up here you can actually use the ascending levels and, your understanding of the having a direction of bias and, knowing if you look for opportunities to buy this market you’re actually more likely to see positive returns when you trade but you can also, use it very effectively from a risk management perspective where you can use all of this information to place your stop-loss outside the ascending levels and, below the loaves and, below the open and, closes of previous candlesticks  and, then when you get that bullish price action coming in you can actually get into this trade with a lot more confidence behind that particular trade because you just have many significant reasons to get into this market to the upside and, this is what technical traders do. Now, in addition to that, we also, have just the third and, final observation really. So, putting everything together we’re observing prices to the upside and, we can put in our odd technical levels to assist us we’ve also, got our we’ve also, got our should I say that was supposed to be a little tick there up on the screen. So, we also, have our moving average we have our technical levels as you can see in technical tools we have our observation that this market is pushing to the upside. So, when these prices interact with these levels, this is another good opportunity we can see how the price performs with this level it literally bounces off it and, we get to see some significant buying pressure reverse the previous day’s sell-off. So, really if you were selling this candlestick the following day, you wouldn’t be. So, confident in that move and, as you can see the price breaks above the moving average as well and, it becomes a no-brainer opportunity to take this market to the upside. So, it’s just about understanding what’s going on using the tools that are available and, there’s many other directional tools as well that can help you. So, it’s a case of picking the tools that work best for you and, then you can you can apply a fairly straightforward approach and, two to training these markets and, it’s been a case of applying a little bit of patience to those trades okay. So, that’s just looking to put the direction of bias and, being able to have a myosin what we should be looking for and, how to apply it in a very practical sense and, it’s just touching upon those points currently up on-screen okay. So, moving along, then we discussed understanding primary and, secondary trends are very very important. So, just to focus on directional bias in a primary trend, to begin with, and, it’s important to know, that you may have heard the phrase the trend is your friend. Now, this is not just a nifty catchphrase passed from trader to trader as they move from perhaps something like the ticker tape systems of old to the Bloomberg terminal which is very sophisticated with some incredible charting.

So, it stems from a profound belief that the individual trader is and, will always be a small fish when it comes to moving markets and, that’s just because of the natural size of the markets in which we trade huge volumes of liquidity in those markets. So, the amount of capital you will have as an individual will pay Lincoln civ in significance to the size of these markets. So, as a result, we are all technically relatively insignificant. So, as a result, a tip to help you succeed over the longer term requires you to develop a trading strategy that allows you to go with the markets as opposed to going against them. So, going against them is like standing in front of a train apologies for the analogy but really that is not a clever decision to make in the anticipation that you think that market is going to turn around before it hits you the reality is that’s probably not going to be the case and, it’s probably not going to work out too well for you know, in a metaphorical sense and, in a practical sense as far as your capital is concerned it is not a good idea to do that. So, if you are looking to sell a bull market you need to acquire a lot more experience and, training these markets you need to be super-efficient with regards to your exposure of capital and, you won’t really be able to make any kind of errors if that is your approach. So, really adopting an approach which looks to go with the market is profoundly it will enable a trader to become consistently profitable over the medium and, longer-term. So, although this long-term buy and, hold strategy which we all hear about especially in global equities and, another markets this type of buy and, hold strategy does hold more weight in global investment in the investment community it serves to teach the trader a very key principle the primary trend is perhaps the most significant indicator of where the market is heading over the longer term which should really be very useful information to you as a trader and, should help you some significantly. So, and, to just apply it in a practical sense let’s get up this chart currently up on the screen and, just conducting a little bit of technical analysis we can see that a primary trend without a doubt is moving to the upside. So, if we know, that’s the case and, we decide that in advance you know, we could just be looking for plenty opportunities to look to buy this market if you have an understanding of technical analysis like we’ve discussed previously and, even when these prices are up at these higher levels and, you could still experience this market to come back to the lower levels and, the same principle applies you could be looking to take this market again to the upside from a lower price. So, that’s where patience and, timing actually come into the trading process, of course, there is opportunities to trade above sort of highs like this and, breakouts and, stuff, of course, that is a viable option for those breakout traders and, you also, have your pullback traders which look at the capitalised these markets from lower prices because we one thing we all know, and, people that are trading this market and, even from a fundamental perspective that the likeliest outcome is that this market is going to move to the upside. So, what we talked about going with the market is looking for opportunities to buy this market based on having a directional bias and, there is many traders out there that keep looking to fade these highs keep looking to drive these prices lower from these higher prices and, although that is a method that some traders use and, I’m sure some use it very profitably it comes with its own risks and, you would especially when you’re starting out your trading career it’s much more advisable to look to trade the primary trend even the overall direction of a market.

So, and, hopefully, it will make sense as well and, be relatively easy to apply okay. So, that’s just directional bias in a primary trend what we also, have is a potential direction a directional bias in a secondary trend. So, let me explain what this is in contrast to a primary trend. So, as discussed, the markets move in different phases or cycles. So, an uptrend will not solely move in an upward direction meaning Corrections will take place and, the markets will consolidate at some point. So, every trend comes to an end at some point, markets can’t continuously move in one direction forever. There’s going to have to be moments and, times and, opportunities where those markets correct. So, that’s a that’s effectively a pullback and, what you can often experience is consolidated markets at the end of a trend as well or even at the beginning of a trend. So, all trends originated from consolidation. So, when you think of it like that, it’s important to look for consolidation when you trade these markets. So, these look like pullbacks and, pauses in the main trend. So, the market will always have short and, medium-term secondary trends that form part of the long term or the primary trend. So, it’s just important to identify that the secondary trend is an important part of a primary trend. So, it’s just important to be aware that if you’re trading the primary trend, you’re going with the overall move of the market and, if you’re trading a secondary trend, then you are effectively trading the correction on a pullback. So, the reality is both trends are potentially tradable there’s opportunities to and, I’m not saying for a second that if you’re selling a primary trend, or you’re going against the overall trend that it’s not a viable option if you can identify a secondary trend and, you do your analysis accordingly, of course, there’s plenty opportunities to trade those moves, but certain conditions need to be met for that. So, however, the trader needs to understand, which component of the trend they are trading and, simply look to amend their technical approach potentially and, certainly their risk management and, risk-reward strategies accordingly. So, meaning you can adopt an approach on a primary trend which could be positive you know, three to one four to one positive risk-reward on that trade with them a very well-managed risk management approach and, you might even decide to give because you’re looking at a three to one you might decide to give that stop-loss a little bit more room because you are trading the primary trend and, the market is very much open to these secondary pullbacks. So, that’s the decision-making process you would go through in your mind and, whereas if you’re trading that secondary trend, you might decide to not give that stop-loss. So, much room. So, there is you’re amending your risk management approach and, then technically you might look to maybe even get in a bit earlier because you realise you’re trading the secondary trend Trading the correction and, a pullback and, as a risk/reward strategy you might look to adopt the one to one or maybe one and, a half to one in terms of a positive risk-reward or even a negative risk award and, whatever your strategy may Intel. So, to just apply it, then we can see from the chart currently up on the screen that we have a clearly defined primary trend which is to the upside. So, prices whether you like it or not are effectively moving from top bottom left to top right.

So, the primary trend I hope you would agree is clearly to the upside. However, there is loads of opportunities to capitalise on some secondary trend moves and,. Now, some will be more profitable than others. So, we can identify potentially moves like this and, again when you get this kind of structural failures. So, you can identify many opportunities in this market to actually look to sell this market and, push it to the downside. So, and, the same continues you know, there’s opportunities to effectively sell these markets on many occasions and, that’s really why you as a trader would need to make that decision accordingly okay. So, and, that is just the principle of understanding that the primary trend could be to the upside and, you might find opportunities to trade the secondary trend to the downside. So, this is having a direction of bias in the secondary trend. So, it’s just knowing that you might be in this market looking to push these prices lower. You might look to adapt your risk-reward potential as a result. So, you might not be looking to see these markets extend down to these levels you might just be fully mindful that this might be a short live trade because there might be some considerable resistance in this market our support should I say preventing prices from pushing lower. So, it’s having an understanding of those and, pushing it further to the downside. So,. So, what we have then is let me take these off the screen. So, just to conclude, then we have some final considerations in observing the markets over a longer period of time, it is clear that a directional bias has to be considered. So, the time period chosen as well to trade is technically very significant when we look to trade we look to consider a number of final considerations let’s say. So, what is the market condition is the first question with we need to ask ourselves is the market bullish bearish is it a liquid is it consolidating what are the market conditions we need to take on board another consideration to take on board is whether the market is ultimately bullish or bearish. So, are we seeing a short-term bullish move are we seeing a long-term bullish move and, am I training with the market or are my trading against the market. So, and, these are very important questions to ask yourself am I trading. As a result, the primary trend or the secondary trend and, potentially on a bigger timeframe. So, and, all of these decisions can be made on smaller timeframes for various different reasons. So, you can have quite a bullish trend on a 5-minute chart which might be insignificant on a 4-hour or a daily timeframe, for example, the overall primary trend might be to the downside, but you’re getting a daily pullback on a 5-minute chart and, you might want to trade that 5-minute trend to the upside if that’s the technical setup, but it’s just important to know, in terms of what the overall what is the overall position in that market. So, do you bear that in mind and, ask yourself can my direction of bias change and, the answer is, of course, it can. Now, we’re not talking about moving from a buy trade to a sell trade because the market is quite choppy and, price action is very erratic that’s not really what we’re referring to you know, you can have a direction of bias to the upside for a specific set of reasons and, if all those reasons start to fail and, unwind and, then it may be very appropriate to change your direction of bias and, say right well from. Now, on I’m looking for opportunities to sell this market and, that may change again and, that’s really the evolution of trading these financial markets. So, it’s not flip-flopping in your mind from one to the other based on what the market is doing are there the choppiness of the market in which you’re currently experiencing it may be a case of doing some multi-timeframe analysis looking at much bigger time frames to see if it warrants a change of your direction of bias and, if that’s the case then of course, by all means, you can change that direction of bias and, then finally which is just more of a tip if you are in any doubt whatsoever you know, then are certainly or our advice and, certainly my own personal opinion really would be to stay out of that market until you have the conditions that you’re more comfortable with that you know, the setup begins to stack up for you and, the more reasons you have to execute that trade. So, that is just a principle that you won’t go too far wrong if you if you’re able to apply that in a consistent manner, okay. So, that just about concludes at this particular course. So, we’ve covered a number of topics currently there up on the screen. So, all that’s left for me to do. Now, it is to thank you very much for joining us. Do take care, and, we look forward to seeing you next time. So, from everyone here, bye for now!      


Categories
Forex Courses on Demand

Correlated Market’s – Understanding Which Pairs Effect Each Other

Hello and, welcome to this latest edition of courses on demand, brought to you by Forex dot Academy! In this particular course, we will be discussing correlated markets. Now, there is, of course, inherent risk when decided to trade these financial markets so, just before we do begin, please take a moment to familiarise yourself with the following disclaimer!

So, the objective of this particular webinar is to define correlations across different asset classes. We have various markets that are both negatively and, positively correlated! The purpose again of this lesson is not just to define that but, to look to see how it can help us and, provide training opportunities. Traditionally we look at these financial markets and, instruments to look to buy something and, sell it at a higher price to make profit. Or, perhaps to short sell and, make speculative profits to the downside but, there are many different ways within these financial markets to trade and, make profits just by observing correlations. And, perhaps spreading risk across different assets is one of them. I will discuss many different opportunities in different trading strategies and, that will highlight these opportunities. So, first and foremost let us define what exactly correlation is. A correlation is a statistical measure that determines how assets move in relation to one another. It can be used for, any financial security but, it is often aimed at markets within the same asset class. So, if, we think logically about that, what we’re looking for, in terms of defining these correlations in the markets, is perhaps one or, two or, three asset classes or, markets that are sharing the same characteristics and, obviously are affected by pricing in such a similar manner. It is expressed as either a percentage or, as a relation to one. A perfect positive correlation between two assets has a reading of +1 whilst a perfect negative correlation has a reading of minus 1. correlations will be expressed more often as a decimal for example, as 0.68 for, during times of instability, many international stock markets become highly correlated as investors analyse the risk of similar securities in their portfolios.

Okay so, a lot of these asset classes themselves simply share correlations as a result of the type of risk premia they hold within the investor, community. So, to give you or, name of a few examples we have the equity markets and, given their as an investment more riskier than perhaps the bond markets. They will share an element of correlation and, of course, the bond markets themselves will share and, separate elements of correlation depending on the maturity and, the risk association. Let’s define a positive correlations themselves! Positive correlations describe two or more markets, where their prices move closely in relation to one another. So, what we have on-screen here is at the gold market and, as you can see our silver comes on top of our gold market trade analysis. We can see ‪it follows‬ to a larger extent, the large price swings in both markets here very closely indeed. So, when we see large increases in the price of gold we’re likely to see large increases in the price of silver, again fundamentally why is this? Well number one, being the fact that they are both and, well-valued precious metals and, they’re of course both priced in u.s. dollars and, traded in US dollars across financial markets they also, share the same relation to the US dollar that they were initially on the gold standard and, came off too to reflect free market operations and, traded against the dollar as such in terms of investment trading within the overall global landscape. So, they have a very very positive correlation and, so, we often see market participants looking to trade these assets when we see times of fear enter the markets because, the precious metals will see both assets and, see very large price shocks and, they also, have very stringent ties to things like inflation and, a lot of other domestic and, global economic data that will look to have an influence on the economic environment overall. One example of perhaps a negative correlation with into gold is the US dollar itself and, again in describing this it describes two or, more markets where their prices move in opposite directions to one another so, just like the gold and, silver market where we’ve seen a very very positive strong correlation we can see gold on the US dollar share a negative correlation. So, over the long run when we see at the price of the US dollar here we have the US Dollar Index traded to the downside we’re likely able to see a very strong move in the opposite direction of the underlying gold market. Another simply because the gold is priced in u.s. dollars previously it was on the gold standard you know, pre Bretton Woods standards and, we’ve seen open markets start to dictate and, the currency relative to the US dollar and, the trading the gold market as well if, we think more logically about that as well in terms of defining this negative correlation. Let us use an example, such that perhaps the bar of gold is worth $200,000 it’s of course going to have a relation to the price of that currency as the price of the currency appreciates or, depreciates so, if we see an appreciation of perhaps 10 percent in our 200,000 borrow of gold we’re going to see the universe at 10 percent depreciation of that bar of gold relative to what it holds us as a US-based currency total value.

So, of course, they share this very strong negative correlation and, are fully tradable as such and, providing some trading opportunity in the financial markets so, why do we look for, these correlations and, why does it matter so, much in terms of trading activity well number one it helps investors to choose the amount of diversification in their portfolio if, you were totally unaware as to any correlations existing in the markets you might have way too much risk on a potential portfolio that your outline for, a client or, or, perhaps your own individual personal portfolio and, actually identify in the correlations it can help you to prevent to have too many correlated assets on the one portfolio and, obviously then help to mitigate some of these risks in trading the financial markets. It provides insight into an overall perspective of economic performance, correlation can increase during periods of volatility and, that’s often what we see when we do see something like a very strong equity market sell-off. We see a closer or, a tighter relation to those correlations within certain asset classes. So, to use that as an example, given that to a certain degree all of the equity indices globally share a level of correlation because, they are of course equity markets and, they’re sharing the same risk premia in terms of an investor, deciding to invest in something as it global equity or, stock in a stock market that certainly shares the same sort of risk as in terms of you know, trading or, investing in something less risky perhaps a government bond perhaps small investment trusts or, many of these different assets that are available. More particularly if, we look at indices across the United States, we’ll look to see a stronger correlation in the S P and the Nasdaq 100 and, the Dow Jones Industrial Average well particularly because, they are all US equity indices, they’re all obviously priced in u.s. dollars are relative to economic strength within the US economy so, of course these more regional equity indices will share a very strong stronger level of correlation and, during these periods of all of the these correlations will get much much stronger, much much tighter and, specifically if it is as a result of perhaps uncertainty within that economic region itself, correlations that help traders to manage risk by choosing assets with low correlation. And again we look at portfolio diversification in a little detail here, perhaps when we see or, refer to our previous example there with the gold on US dollar market we know, that they are very negatively correlated so, straight away that tells us that perhaps it’s not a good idea to have a long position in gold and, a long position in the US dollar at the same time. More specifically having a long term objective for two long positions in both markets, at the same time we know, that that’s not a good idea because they’re going to more likely moving in different directions. On the final point, market correlations can prevent traders from taking too much-associated risk and, thus per trade decisions and, that is something that does not get enough conversation amongst traders, certainly it does in the professional trading world above, retail traders not as much.

It does help you make better trading decisions, knowing that there are many asset classes correlated. Perhaps and, again we’ll use the equity markets as an example if, you wanted to trade perhaps 10 trades at the same time, you wouldn’t necessarily, specifically given the volatility to the downside in the equity markets winners a shock and, look to actually take the same trade across these equity markets because, you know, they’re all correlated and, you’re going to be overexposed in one asset class. It can help you and, prevent you to actually making an overcompensating risk and, and, making better trading decisions so, let’s discuss correlated markets the first asset class will discuss is the equity markets they will attract European business investment and, they share the same risk premia and, they all reflect fundamental health of European economies. Here in front we have the Euro stocks 50, which is the largest 50 market cap companies and across Europe so, an overall benchmark for, European equities we have the IBEX 3 5 which is the Spanish market index and, then we have the german DAX 30 which is, of course, the German blue-chip stock index their the DAX. We can see obviously just by looking at the price action in the line chart that they’re, very very closely correlated. We see a very short move within the middle of the frame and, to the downside and, they all follow suit and, one may lead of course,  given the new story might be more reflective on one economy but, you can see the overall bearing they’re going to have in actually overall health issues in terms of judging the outlook. The overall outlook for, European equities, more importantly, they may actually provide us with some trading opportunity, to actually look to spread markets and, we’ll discuss that and, through some of these webinar slides as well. What I mean is a potential opportunity to actually look to understand, that one of these equity markets is weak and, to look to sell out while actually spreading that risk-off in another market to avoid the volatility. So, we can really see the correlations between and, the equity markets, three particular equity markets that we wouldn’t perhaps think would be so, closely correlated again what is relative to Spain’s economy and, that is relative to Germany’s economy, well, of course, be very different but, that’s not always how the market or, market participants perceive and, perceive these correlations. We often see them more strongly correlated and, price action will of course and, follow-through to a certain degree considering the strong correlations these European equities have particularly if, its European equity issue perhaps

we have changes in in sentiment of the European Central Bank we have perhaps liquidity insurance being taken from some of these central banks across Europe perhaps we’re going to increase quantitative easing again these are all going to have a correlative effect at you to a real Europe economic boom or, bust effect on the overall equity indices and, sentiment the second at class we look out here is the bond market. so, what are the bond markets of course they are the debt markets and, here we chosen to actually outline two bond markets particularly with the duration of ten years we have the US ten year Treasury bond or, the t bond and, then the German ten-year bond both tenure at debt bond instruments within the financial markets they’re both markets offer investors safer long-term investment again backed by government. so, there is of course a likelihood a very very probable chance in investing in bonds they are regarded as the most risk-less free investment given that of course you have a level of a very strong level of confidence in the government actually paying back or, are committing to their their debt instruments and, their liabilities. so, more generally speaking depending on the yield there and, obviously changes in interest rates they will move more closely together given that they are effectively landing instruments at to two to two separate governments but, of the same duration they both of course share the same risk premia and, that’s because, they are less risky than potentially equity markets or, taking long positions in some commodities where you’ve done your fundamental research you know, there’s going to be a level or, a promise a guarantee is essentially made by the government to repay based on the interest rate or, coupon from this government bond and, on the actual overall investment itself and, that as prices and, and, yields change both across these durations you’ll see that they will trade and, more relatively over the long term together in the short term they do see some very rapid price change and, do see some indifference and, that’s because, interest rates do differ in domestic economies particularly at the moment they are different in differentiating themselves in the US with more expedite it increases as opposed to those European markets who do seem to live behind in terms of increasing interest rates over the year when we to the commodities sector, to very obvious choices I suppose to trade or, well is the oil market we have a US oil WTI crude on UK oil which is really the Brent benchmark from from North Sea drilling they are both based on the underlying value of the same commodity.

so, this is perhaps one of the best examples we can use in terms of correlation we have two oil markets here and, just simply there are two benchmarks and, one European on one u.s. of course both commodities of course they they move as a result of supply and, demand, and, they differ in relation to more regional issues. so, when we do see large shifts in supply perhaps or, an increase in in that supply which has been very much the case for, 2017 and, leading on to 18 from fracking which is a u.s. process obviously drilling into the rocks we see a lot of us increase in supply has a very strong effect to the downside in US oil and, the global oil markets the outlook has. now, changed for, the better and, we are seen prices start to retrace from lows from around 40 and, increasing from $50 a borrow however just by looking at the market in front we can see that it does not change the correlation to to a larger extent that exists in in this market we see that the price action with the line short is very much the same in terms of price speculating from a very strong burst to the upside and, short moves to the downside but, what is very important to notice is that because, the this is actually the same commodity that there is a difference in price and, it’s based on a couple of factors one being the quality of the oil but, mainly the supply and, demand, factors just regionally set between the two benchmarks I know, actually allows us for, trading opportunity which we will discuss and, coming towards the end of the webinar and, then yet just to reiterate we have a negative correlation between the gold and, the US dollar they see many different factors that affect the price and, that is very logical to understand, because, if, we think of well both assets the u.s. dollar I’m gold and, think of how many factors how many news events are economic data that is released on going through it the days actually result in price change across these do it there’s two individual asset classes we know, that they are very close in terms of the correlation because, of of them both being price and, having a relative relevance on the US dollar and, changes to the currency pair but, we know, of course that and, gold itself will depend on market sentiment whether this fear or, shock in the market sentiment, of course, we’ll see spikes and, gold to the upside if, there is. so,. so, they do price a to their own extent and, but, do share that that initial correlation we could see both weak or, strong correlations depending on the data another certainly the case for, M intraday traders that see these assets start to drift away from the correlation given given the news events more short-term but, over the long term they certainly do share a negative correlation perhaps one of the most important correlations that we need to be aware of in terms of trading and, particularly the forex markets is is the Forex correlations. now, there’s two different approaches to actually assessing the fact that these pairs or, correlators number one being that all of these four experts here that I have in front or, actually correlators and, there’s plenty of them the reason being is because, they all are tied to the US dollar in some way or, another. so, these pairs where the US dollar is the quoted is quoted as the quote currency will trade in the same direction in relation to the US dollar.

So, in red there when we see a strong moves to the US dollar supportive of US dollar strength we will see these markets trade to the downside the low in blue pairs where the US dollar is quoted as the base currency will trade in the same direction in relation to the US dollar to the upset again. so, if, we see am a strong move supportive of u.s. dollar strength to the upside all of these currency pairs given that the US dollar is the base currency will trade to the upside. so, the the most important thing to really notice and, understand, is that it doesn’t really matter in terms of trading these currency pairs whether one is quote or, one woman’s base currency it would effectively be a hedge trade if, we decide to choose two here and, actually trade the Australian dollar with the US dollar and, the US dollar against the yen it doesn’t really matter if, for, a long one or, a short one were both in the US dollar trade and, there’s a level of correlation which might affect overall profitability or, the overall outlook of the trade that were actually trying to identify. so, do be aware when trading these Forex pairs that even though one is a quote I’m one of the obvious ly the base currency that there is a strong and, relation in terms of positive or, negative correlation to these currency pairs but, you’re still effectively trading the US dollar against M in this example Australian dollar on Japanese yen to one side or, another and, there is an effective hedge going on there and, it will be very difficult to formulate a trading strategy when should once you’re in those positions particularly if, you have three to four different currency pairs and, all allocated in one portfolio. so, let’s move across to actually deciding to spread risk in different portfolios here here is one example where traders choose to spread risk in forex markets by observing their correlations okay and, the first thing we can see here is that it’s very heavily dominated by the US dollar what I would like to ask is how risky is this traders portfolio well we can see the trader has chosen effectively to trade five correlated US dollar Forex pairs. so, that’s not the best idea to actually look to spread risk or, diversify the trader is therefore overexposed to fluctuations in the US dollar again we have the euro dollar pound dollar and, Swiss franc Japanese yen and, the Canadian and, dollar I suppose the main point I would like to make that is there is a certain realisation that you need to understand, that you’re actually effectively really trading the US dollar here you’re heavily invested in price fluctuations in the US dollar you’re not necessarily only trading the euro the parent the Swiss franc the Japanese yen and, the Canadian dollar you’re effectively very heavily invested in the US dollar of course relative to swings in these other currency pairs but, if, there’s going to be news out or, neutral perhaps a change from any monetary policy with the Federal Reserve and, I you know, in the previous or, next day this is of course going to have a huge effect on the underlying value of this portfolio given the exposure to the US dollar. so, the trader has inadvertently heads some of his her positions are choosing to trade both base unquote currency dollar pairs let’s assess here yet another portfolio of Forex pairs here here we have a different selection of currency pairs to trade again the question is how risky is this traders portfolio what we can see is we have a euro US dollar the pound Swiss franc the Canadian loonie our dollar against the Japanese yen the Australian dollar against New Zealand, dollar on the US dollar against the ruble. so, we do have two US dollar pairs in there but, they’re trading two very different currencies across section as well the trader has chosen to diversify with the portfolio of diversified Forex pairs what we can see is that we have one euro it kind of construct really within these selection of pairs we have one pound one Swiss franc one Canadian dollar or, one Japanese yen and,. so, forth. so, it is a very very well diversified portfolio we do of course have the US dollar against the euro and, the u.s. dollar against the ruble but, again they’re going to trade very much in relation to how the Euro on the ruble is trading. so, there is a good level of diversification there the portfolio is not overexposed to any one particular currency and, the trader can. now, treat each individual trade differently and, judge them on their own merits that’s a very important point it’s very difficult to judge the performance of your portfolio if, you have selected you know, five or, six different and, currency pairs that are all relative to the Euro or, they’re all relative to the US dollar are there all pegged to to the dollar or, another currency and, similarly. so, you’re not able to actually charge your portfolio on your trading merits just the fact that you’ve overcomplicated the portfolio will make it very difficult to gauge whether it’s going to be successful or, its level of performance when trading correlation experienced traders understand, gold on the US dollar share a negative correlation and,. so, they’ll never decide to take either along a short position in both markets at the same time understanding the concept of market correlations cannot only prevent traders from making very obvious mistakes but, can al. so, help them to gain an advantage over other market participants in developing a trading edge and, that’s we’re doing here as as traders here we’re always looking to compete against one another to make money something that perhaps isn’t totally available in the markets in terms of a knowledge-based a decision are some skill that you have ascertains that can certainly help you develop an edge will of course make you more profitable over the long term experienced traders use these common correlations within the markets to look for, money-making opportunities indirectly trading these correlations whilst at the same time try to avoid short-term volatility one such trading strategy is known as a spread trading.

so, what exactly does this mean how can you look at trading correlations and, actually look to directly make profit opportunities from trading these correlations as opposed to just simply preventing yourself from making very pure trading decisions again let’s use the oil market and, there’s a very basic approach to really explaining why because, they are two of the most correlated markets the US crude oil WTI benchmark and, the European branch oil benchmark provide great opportunity for, correlation trading why traders can choose to both buy and, sell to markets at the same time okay and, that’s potentially something that retail traders don’t necessarily think about we’re always looking for, these great buying opportunities or, great selling opportunities just to make a simple trade to the downside website and, obviously make a profit but, what happens when you find two markets that are very correlated and, there’s a strong shock in the market to take maybe an equity index or, something similar if, we know, that there’s going to be out performance in in one sector, and, there’s severe are very strong correlation within the market in general of course we’re going to buy that sector, because, it’s strong and, potentially look for, another sector, to sell just in terms of hedging that opportunity. so, actually looking at these correlations it’s no different and, here we have a very obvious example here we have the US oil and, you Carol. so, what I’d like to do is just to walk you through a trade on this asset class here the oil market. so, here on the Left we have a strong move to the upside what we can gauge by this and, what the market is really telling us is that there’s a strong move overall in the oil market but, for, whatever reason and, the UK benchmark the the UK oil benchmark is actually I performing you SWT a and, you can see by the relative move to the upside. so, what we could have to do there is actually take and, what’s called a spread trade. so, within this example what we’ll actually effectively do is we will look to buy the market of course because, it’s a strong move. so, we buy at the UK Brent and, then we look to take the other side of the trade by selling US crude what we can effectively see if, there’s a price increase in both markets of course I’m ‪55 95 257 98‬ and, 6102 to 64 37 respectively for, the US crude and, Brent markets. so, collectively that is effectively a 203 pip loser in the US crude market given that we’re selling the market and, it’s moving higher but, of course we’re buying the Brent market and, we’re ID performing on the strength of the European benchmark and, it trades up 335 pips when we actually exit that trade we have made a profit of 132 pips. so, here is a direct example guys we were we’re actually deciding to trade these correlations the very strong correlations within the markets well we’re effectively avoiding all of this volatility and, we know, that the markets don’t simply trade you know, very strongly in one direction they pull back and, what we’re trying to do is just dismay that first volatility this market has traded up 335 pips in the Brent market but, if, you were deciding to scalp that market or, to simply buy it and, mana try and, holders it would of course be pulling back. so, if, you were scalping you could have actually bought this market you know, four or, five several times and, perhaps taken losers. so, this is one opportunities that approach to trading these correlations that we can avoid the volatility that we can I perform perhaps using our knowledge of the strength of the market or, the correlation to I perform over one very correlated market and, here we have a very good trade overall we make a profit of 132 pips one of the best things about financial trading is that there are many different ways to make profit in the markets most traders simply focus on buying something and, selling it at a higher price of course short selling which is fine on a fair assumption to traditional trading that’s we would refer to traditional trading however trading correlated markets may I provide you with some insight to engineering your own profitable trade opportunities let’s take another example here we look at the European equity markets and, here we have yet one example number one the monthly German unemployment release was a big mess at six percent in contrast to an expectation of 5.2 percent okay. so, we have an expectation and, generally we’re seeing these unemployment figures start to be much better more supportive for, the economies but, let’s say we have a big mess here the expectation is 5.2 we have and, the figure compared at unemployment in Germany at 6% the markets are experiencing a lot of volatility in the trading day. so, I could we perhaps trade this market how could we perhaps look at correlations to avoid the vault to the end and, to look at an engineer profit profitable opportunity for, ourselves well here we have two markets here and, I just outlined one trade for, us as well we have the euro stocks 50 and, the German DAX. now, we know, that there is going to be a move in this market more likely to the don’t save given that you know, it’s very pure economic figure there in Germany six percent unemployment is announced we know, that the tax will be a very weak market during this trading day the aim is therefore to profit more from the tax weakness while it’s trying to avoid the volatility. so, if, we take potentially a short position here we look to sell the tax and, given the weakness and, by the Euro stock this is something that we’re going to find today we’re going to have a move to the downside in both markets but, the greater move is going to be in the wheat market and, we can use obviously what is known as spread ratio which will determine in many of our other webinars here and, it’s a mathematical equation to actually look to to find the spread ratio given there’s a pip value for, each of these markets we’re likely to find something like a 120 euro loser and, in the Euro stocks while performing a 270 winner in attacks that overall has a profit of 150 euros profit.

so, we’re aiming to we know, that the move is going to be weak we’re aiming to take advantage of this news article that that tells us that the markets are going to be weak European markets in this trading day we know, that the the German its German article of news which is going to provide more weakness for, the Lekhwiya index and, we’re simply spreading enough with a very very correlated market there the euro stocks 50 given a lot of those components or, actually German companies and, it’s an overall benchmark for, European equity performance. so, with a quick review here on correlated markets what did we learn throughout this webinar well we first started to define correlated markets and, understand, whether actually is. so, important not just in defining and, relationships between certain asset classes or, markets were to actually look for, opportunities both in spreading risk we looked at some portfolio management there we look particularly at Forex correlation as well and, in terms of over weighting an associated level of risk with the Forex pairs and, we looked at actually trying to identify new trading opportunities for, us and, actually directly trading these correlated markets whether they be commodity markets or, equity markets we can find these correlations to serve and, very good trading opportunities for, us. so, that finishes off our discussion and, topical webinar there on a market correlations thank you very much for, joining us on this instalment of courses on demand, by Forex Academy we do hope to see you very soon bye for now.


Categories
Forex Courses on Demand

Market Positioning – The Consequences Of Assumption In Forex


The following presentation is brought to you as a courtesy of forex Academy! This is part of our service course’s on demand, if you find this interesting and wish to be updated on new releases please subscribe to our YouTube channel, or join our community at forex dot Academy and receive all of our services for free! you’re like is also highly appreciated, enjoy!

what positioning is all about? The big players, the big traders in the marketplace that are looking for these big trades. They don’t necessarily involve themselves with short-term scalping, or are very short positions in the marketplace like many traders do. What they look to do particularly is hedge funds, develop a very consistent very well thought-out, fundamental trade decisions, based on a lot of fundamental analysis on decision making for many large market participants. Institutions such as, finance institutions and hedge funds, the very essence of the training will target long term price changes, as a result of changing macroeconomic variables. Their decisions are thus a result of very carefully conducted fundamental analysis, so this can help us as well if we know a large institutional is positioning itself within the marketplace. If we have a feeling, or a sense,  or perhaps news that would dictate with which direction they’re looking to trade, that will certainly aid us in our decision. As well in the build up to large news events, source institutions will build large long or short positions in the marketplace. The objective is either for protection from risk or from profit, obviously profit being a main objective for long term fundamental price change, why would they look to perhaps protect themselves from risk ? Well if they perhaps know that there’s going to be a large appreciation, or depreciation in the currency, they may have a lot of other assets denominated in that currency, and the objective could be to position in the market, to actually look to hedge that risk within the currency markets themselves.

So with many different objectives, they look to take these huge positions in the market. It is often these large market participants, that cause large swings and volatility when realities do not meet the market expectations. And that’s absolutely the case, what we’ll do is actually look at a few examples here, to explain what we mean when we see market positioning go wrong. Here we have the Brexit vote, and this is the cable or pound US dollar market. Obviously very significant in terms of a world non-economic event, but it was a huge piece of news, a huge shock to the market at the time and obviously we can see how the currency itself reacted. What we see is fear within this price charting, moving down we see a little bit of a price Channel form with a support level of resistance, however, that fear and uncertainty leading up to the week’s just before. These are daily candlesticks, the week before the actual decision, shows that there is some fear and uncertainty and some money coming out of sterling in relation to the dollar. What we then see is market positioning!

What I do remember when week before, we see a lot of fundamental analysts coming out, with their forecasts to say it was more or less a done and dusted deal! There was no way the UK would be leaving the European Union, and we see this reflected in the market price. Market positioning then hits the bottom with many green candlesticks in a row, suggesting that this has been priced in. These large market participants are really pricing in, and a stay vote that the UK will certainly stay within the European Union, and that’s reflected as the price trades up within this week, leading up to the decision itself. Then what we see is the brexit leave vote, a massive shock to the market, we see some serious volatility to the upside and downside and then the currency actually trades down the whole way from one around 147 to 133 within one day. Trading an absolutely huge percentage loss in the overall price of sterling, a huge shock to the market, we can see and it’s technically racing. they’ve given high market positions were actually gearing up for a stay vote. They were all proved wrong! Inevitably if we look closer at this price actually what we see within the price action, the candle  stick structure here tells us a fascinating story of higher market participants began to prematurely price, in the expectation of a brexit stay vote. Heavy long positioning accumulated in the pound u.s. dollar, almost a week before the fundamental decision was made. So they’re trying to position, they see a very strong probability that the UK will obviously vote to stay, and Sterling value will increase over the medium to long term. Certainly that does not happen, they are proven wrong and they suffer the consequences.

Categories
Forex Courses on Demand

Mastering Asset Classes – The Full Market Breakdown

Hello and welcome to this latest edition of courses on demand brought to you by Forex.Academy. So with this course, we’ll be looking in quite some detail, in and around the whole topic of asset classes. However, just before we explain what’s involved, please do take a moment to familiarise yourself with our disclaimer. If you do need to stop and pause this particular recording, please feel free to do so. Obviously trading financial markets is inherently risky. There are risks associated with those with trading these markets, so please do familiarise yourself with our disclaimer!


Ok so let’s explain what’s what we cover in the course on demand. So we’ll start off by defining asset classes, then we’ll have a look at the different types of asset classes which us as traders can trade. We’re talking about the forex markets to commodity markets, the stock markets, the global indices markets, bond markets, and I’m sure you’ve got a very basic understanding that all of these types of markets exist and I’m sure you’re very aware of the cryptocurrency markets as well.

Then we’ll have a look at trade selection, some considerations that a trader will need to make in order to determine which markets they should be looking to trade, and some of the dangers that are involved with that.Then we’ll look at the potential diversification and what that means, and how it can be applied in a very practical sense. And we will just finish this webinar with looking at asset classes, and how to access them on our metatrader4 trading platform. So that’s what you can expect over the course of this webinar.

Ok so let’s start with a definition of asset classes. It’s very simply a group of markets which have similar financial characteristics and behave similarly in the marketplace. So to try and break these down for you, the six major tradable asset classes for traders are as follows.

We’ve just alluded to some of these and ‪the‬ ‪foreign exchange markets and what we’re‬ talking about are foreign exchanges in your currencies. So, for example, you will see a symbol, like EURUSD currently up on screen, and the number of these markets are vast. We shall discuss each one of these in some considerable detail, so this is just a very basic overview.

The next major asset classes is obviously your commodity markets. So, for example, your gold or your oil markets, and then we’ve got global indices like your SP 500, the FTSE, or the Nikkei, or whatever the case may be. And we’ve also got stocks and these are individual companies like Microsoft, Facebook or Apple.

So obviously traders can select and decide what best suits their personality and approach, what they have a genuine interest in trading, and they’re able to do so. Traders can also access bonds. For example, Eurobond. Or the 10-year note, for example. And finally an asset class which is very new and fresh in everyone’s mind with the incredible moves we’ve experienced within the cryptocurrency markets certainly over the last 12 months, for example, you have cryptocurrencies like Bitcoin.

Okay, well what is important to notice is that each of these asset classes can react differently to major news events. So if you get a particular news event, they can impact the global indices in a particular way. And of course they could then impact like, the government bonds, for example, in a particular way. So it’s just important to bear in mind that there’s alot of aspects that can influence these markets, and they can react accordingly in a way which is relevant to each individual asset class.


So let’s start with the Forex Markets which are also known as ‪the Foreign Exchange‬ Markets or the Currency Markets. So let’s start with a definition. It’s a market in which participants can buy, sell, exchange, and speculate on currencies. So ‪the‬ ‪foreign exchange market is considered to‬ be the largest financial market with over $5 trillion in daily transactions. Now this, just out of interest, is considerably more than your future markets and your equity markets combined. So we’re talking about an incredible amount of potential volatility and price action on a daily basis. Some of the markets, which I’m sure you’re very familiar with, in the currencies, major global currencies, would include like your dollar, euro, the pound, the yen, the Swiss franc, the Canadian dollar, the Aussie dollar, and also the the Kiwi or the New Zealand dollar. Now, these are all regarded as your major currencies. What this means is you’re going to see when you exchange currency, you’ll be exchanging one currency for another.

So when we talk about majors, we’re talking about currencies which have the dollar on one side, so you’re trading it with the dollar. Now, these also happen to be the most frequently traded markets and you’ll experience lower spreads in these markets. So, slightly more affordable for those of you that are trading with smaller accounts. And, they’re the most liquid. So you get often a lot more opportunities within these markets. Now the EURUSD is the most traded, by a country mile, with nearly 30 percent of the entire foreign exchange market. So that just gives you a little bit of an indication in terms of how large the EURUSD is in terms of a standalone currency.

Now in addition to our majors, we also have the miners, or what are also referred to as the crosses. Now these, to differentiate, are very much non-USD major pairs. So we’ve alluded to the majors – they would have the GBPUSD, the AUDUSD, the USDCHF, the CADUSD. So whatever the case may be, those are your majors. But when you’re talking about the minors, we’re talking about non-US major pairs. The most active and the most liquid are obviously your currencies like the euro, the pound, and the yen. So to differentiate the majors, you might be trading the GBPUSD. Whereas, if you’re trading a minor or a cross you could be trading the GBPJPY or the GBPAUS, for example. So that differentiates the difference between your major currencies, currency pairs, and your minors, or the crosses.

So what we also have is your exotics. These are, you know, global major currencies mixed with an emerging or strong small economy. For example we’re talking about exotics like the Hong Kong dollar and Singapore dollar and also things like your Swedish and Danish kroner as well. So those are major global markets which you can trade, but please do be aware that the liquidity, the spreads, may be a little bit higher. You might not get, you might experience, a little bit more reduced liquidity in some of those markets. so you have to weigh that up if you’re deciding to trade exotic currency pairs.

Okay, so just a couple of points to be aware of. Traders are interested in the perceived strength or weakness of one jurisdiction relative to the other. Foreign exchange markets must be traded in pairs because you exchange, as I’ve alluded to earlier, one currency for another at a particular price. It’s this price which is a huge interest to not just people who exchange currency to go on holiday and they want to get as much money as they can in exchange for whatever currency they happen to hold, but also traders who are acutely aware of the price of various different currencies. So it’s this price which is the value of the first listed currency, which is often referred to as the base currency, relative to the second listed currency, which we refer to as the quote currency.

So, to just give you two or three examples, up there on screen, you can see we have the GBPUSD. So this particular market would be referred to as the cable market, for example. It’s just the other name in which this market is known. And what we can see is the first listed, so we’re talking about the first three letters in this particular symbol, is referred to as the base currency. And it’s the relative value of the base currency relative to the second list of the currency. Which is actually the quote.

So we’ll show you very shortly, when you look at this market it doesn’t matter how you perceive or how you receive these prices, it always means the same thing. So what we’re interested to know is how much, what exchange rate, you would get for each and every one pound. Because there will be a predetermined price which will determine how much US dollar you will receive for one British pound. And the same applies with the base currency across all the pair’s. So the base currency we will when we look at the price quoted for the EURJPY. We will know and understand how much yen we will receive in exchange for one euro. And finally the Aussie CAD, we will see how many Canadian dollars we will receive for one Aussie dollar.

So that’s just a little bit about how to interpret and how to see and understand what is happening with these currency markets. So to just explain it, and I’ll give you a nice little example here, this is the GBPUSD market. Now, the price you see quoted is how many units of USD it would take to acquire one pound. So for each and every pound, and it doesn’t matter if you see it in a newspaper or on the television, in whatever capacity, you will see the quoted price which is the exchange rate for the number of US dollars. Because it is the quote currency in exchange for the base currency, which is the British pound.

So in all of these occasions on a price chart we will see that we will get 1.4084 US dollars for each and every pound. And these images were taken at slightly different times, so there’s a slight variation in these prices, but it effectively means the same thing. So if we exchange one pound we will receive 1.4083. And just finally we’d be exchanging the British pound in exchange for US dollar at the rate of 1.4078.

Now what’s important to notice, you can see that this is five decimal place and some of these are quoted to the fourth decimal place. So what’s important for us as traders is the fourth decimal place. So in reality, there is a meaning behind the fifth decimal place, but it’s just a smaller unit. But what we focus on largely is the fourth decimal place. So it’s actually 4083 that is of any interest to us. And 4078. And as you can see on the top right hand corner of screen you’ll have the 4084. So it’s to the fourth decimal place for the vast majority of foreign exchange pairs. Now there is a couple of caveats to that, as there always is, like if you’re trading yen pairs for example. Then it’s a two decimal place. So you have to be aware of how the price is quoted in each and every market that you decide to trade, but that will come obviously with experience. Okay, so that’s just a look at ‪the foreign exchange‬ markets and how to have an understanding of price change.

So moving on then to the commodity markets and to give you a brief definition. A commodity market is a physical or virtual marketplace for buying, selling, and trading raw products. So there are two types for you to be aware of. There’s hard commodities, which are typically natural resources that must be mined or extracted out of the ground.  We’re talking about your gold mining for gold, natural gas, and oil drilling for oil. But then you’ve also got your soft commodities which are often your agriculture or livestock commodities. For example, corn, wheat, sugar, and pork and products of that nature. And just give you a bit of an image, you can you can see from the commodity markets, which are currently up on screen, that a lot of these are extracted from this beautiful planet of ours and they’re traded on an exchange, and they can present some significant opportunities for us as traders.

So currently, just for your information, currently over 50 physical and virtual commodity markets are tradable through a particular exchange. So a commodity market can create a large economic impact by influencing the prices companies pay for certain raw materials. And this is very important to take note of – this can become extremely volatile often due to geopolitical risks and periods of instability and where they become very reactive to changes in global demand.

So we’re all familiar with the devaluation in the oil markets. For example, in 2014 it really impacted the demand for that particular commodity market. Price dropped excessively over a fairly short period of time. And as demand comes back into that market, so does the price start to increase. So that is just a very brief overview of the commodity markets.

So moving on then to the stock markets. So again to start with a very brief definition. A stock market is where shares in corporations are issued and traded. The key component actually of a free market economy. That’s worth taking note of. Stock markets serve two main functions. Firstly, it provides companies with access to capital. Very, very important. It’s a fantastic source. To be able to access capital for a whole host of particular reasons, whether it’s product development, or expansion, or employing more people, whatever the case may be. It will enable markets which are floated on the stock exchange, it’ll enable them to to generate that capital, what they need to grow.

Now secondly, they also provide a way for investors to participate in the company’s growth and quickly convert shares into cash. So that’s one of the reasons why your stock markets or equity markets are very commonly traded. They’re a part of a lot of traders portfolios for a variety of different reasons. And it’s the fact that they can be converted into cash as well fairly quickly. But they can get involved in, that participation of, the success of a particular company. So stocks for example, equities and shares, it’s all the same. We’re referencing the same market. They’re listed and traded on global stock exchanges, for example, like your New York Stock Exchange, which I’m sure you’ve all heard of. And you’ll find companies like Coca Cola and Ford listed on the New York Stock Exchange. You have other companies which are which are listed and traded on the Nasdaq Stock Exchange. You’ll find companies, you know a lot of your tech companies, like Facebook and also Google and companies of that nature, you’ll find those stock markets available through your NASDAQ exchange. We’ve also got the London Stock Exchange, and you’ll find companies like BP and Barclays Bank. And of course in Europe you’ll have the Euro next market. So, you’ll find companies based in Frankfurt in Germany. You’ll find companies like Heineken, and BNP Paribas, as well, listed on those particular exchanges. There’s many, many more exchanges and stock markets. And that’s where you can, you have, the potential and the ability to trade the performance of those companies listed on those exchanges. And so that is hopefully just a brief introduction to the asset class of stock markets.

So moving on then, to the indices market, and to give you, to start with, a definition. This is simply a composite, or a basket, of stocks which have been put together or weighted to create one aggregate value that’s used to measure a sectors performance. And that’s the important part to take away from the variety of different global industry markets. So just to give you an example, you may have heard of the S&P 500. Now the S&P 500 is simply a composite, a combination, of the top 500 largest companies in the US, in this particular example. Now, a price is quoted for that S&P. And that is traded by many financial institutions on a global basis. So in addition to Standard & Poor’s, when we just go through, we just select a few of them, a few global industry markets, you have like the Nasdaq. Which is this time a slightly different composite of the hundred largest non-financial companies in the U.S., in this particular case. Now there’s a strong focus on your large cap technology companies. They’re very much weighted within the Nasdaq market, so it does react to changes in technology and development. So that’s your Nasdaq market. You also have the FTSE, which is a composite of the top 100 largest companies in the UK. And to finish, you’ll have the DAX, which in this case is a composite of the top 30 largest companies in Germany. And finally looking over towards Asia we have the Nikkei and this is a composite of the top 225 largest companies in Japan.

So as you can see, there’s a variety of different global industry markets. They all have slightly unique characteristics and react to different things at different times. They’ve all got a unique personality to each of these markets, and that’s worth taking on board as well, if you decide to trade your global energy markets.

Okay so moving on then to the next asset class which is your bond markets or also referred to as the debt or the credit markets. And to give you a brief overview of the bond markets, the bond market is a financial market where participants can issue new debt. And this is known as the primary bond market. And the reason for this is, it enables companies and governments to be able to issue new debt, and enable on the primary bond market to generate capital through the issuance of different types of debt and credit notes. And that will enable that particular company or government to be able to generate additional capital in order to finance a whole variety of different products. That is very much regarded as the primary bond market. But what most traders will be involved in is the buying and selling of these debt securities, which are known as the secondary bond market. And these bonds can vary in duration until maturity.

So what we want to take away from this is that we as traders can trade derivatives as well, based on these government bonds. So think of a bond as perhaps an IOU given by governments or companies. To pay the bond holder back the funds, they decide to invest, but with a certain percentage of interest added on top. So these are normally regarded as risk-free, or guaranteed, returns. Unless, and there is a caveat to that, unless the government or the actual company itself defaults on its liabilities. And that’s when, you know when we went through the European crisis, where there was a risk of the PIIGS, the companies, the countries within the European Union, were really struggling. They were on the verge of defaulting on their government debt and that would have meant that a lot of those bondholders wouldn’t have been able to have received their capital back. And certainly wouldn’t have been able to realize a particular profit or return on that investment. So there’s always a caveat to these things. So it’s important to bear that in mind as well. Now, obviously, the higher the perceived risk, the higher the interest rate or yield you would get from those particular bonds. So just going back to the European crisis once more, the interest rate on the ten-year bond in Greece during the crisis in 2012 was approximately 11%. While the interest rate on the ten-year bond from Germany was dramatically different – approximately 0.7 percent. Now these differences simply reflects the risks associated with trading those particular instruments. So the higher the yield, the higher the perceived risk. So that’s worth taking on board.

So to just explain this in a little bit more detail, what I’ve just taken is just a very brief snapshot in time of the interest rates which are offered by the US government. This is from the US Treasury’s website and it will tell you the actual rate of return that you will see. Depending on whether you are trading a 1-year bond, which ties up your capital for a whole year, and then at the end of that year you will receive the going percentage return at the point of that offering. So as you can see, you can trade short-term bond options, you can trade yearly, two-year, three-year, five-year bonds, seven-year, 10-year bonds.  And then you start going to the more longer-term which are largely more for, you know, your big files and institutions. Like your 10, 20, and 30-year bonds. And you can see that the rate of interest increases the longer you have your capital tied up in that bond offering. So the the marketplace actually dictates these particular prices, given the economic outlook for that particular region and the commercial outlook in general. And really, what the market is looking for is the propensity to repay. And if there’s a strong likelihood for like an economy like the US to continue to grow and strengthen over the longer term, then the more risk-free that particular trade becomes because the likelihood of the US defaulting on its debt is perceived to be very, very low. And which is why often, that these interest rates are also quite low as a result. Now obviously, the higher perceived risk, the higher the interest rate or yield you would get from those particular bonds. So that’s another thing to take on board.

Okay, so that’s just a very brief overview there of the bond markets. So moving on to the cryptocurrency markets. To give you a definition, this is a digital of virtual currency not issued by any central authority. So it’s very much decentralized. Rendering it theoretically immune to government interference or manipulation. And the key word there is theoretically. So it is very difficult to counterfeit because it is secure. Its security features and the anonymous nature of transactions enable it to be difficult to counterfeit. However, this very much can be a double-edged sword.

 And the reason for that is, obviously, if transactions are very much anonymous by their very nature, then they can also be used by, let’s say, entities, that are not so transparent. And there’s a dark aspect I guess to crypto currency markets as a result. And that’s obviously very, very worrying for your more established powers where they are subject to, well supposedly subject to, more transparent means. Although we’ve experienced over the last ten years that in actual fact, you know, the way that things currently stand, are not so transparent as they probably should be. However digital currency are tradable in some regions as a form of cash as well, so you can actually buy products and services with digital currencies. And the more that becomes accepted, the more opportunities that can bring for these whole, this large number of, cryptocurrencies which are currently out there now. They are tradable on private mining exchanges online, but they can now be entered as contracts of difference or future contracts as well as of December of 2017. So we do have institutions trading these markets as well, again, as of 2017, towards the end of 2017, December 2017. And these are tradable 24 hours a day, 7 days a week. Whereas your foreign exchange markets are tradable 24 hours a day, five days a week. So you can actually trade these over the weekend, as well. But they are very volatile trading conditions, given the products are relatively new to the market, and are not entirely understood by all of its participants.

A couple of final points to consider. Now, large percentages of the markets are owned by very, very few of what are called big players, so a large percentage of the markets are already owned by a small number of people. And they are very much driven by technological growth and prone to possible bubble X speculation. I’ll show you what I mean very, very shortly. They are not able to take short positions, as well, up until fairly recently on most of the available currencies, cryptocurrencies, which are available.

So they definitely have some downside, as well as some potential upside. And to show you the potential for technological growth and the possibility of bubble speculation, it can be very nicely summed up in this Bitcoin market. Right, as you can see, there was very little growth for a long period of time. This market saw a little spike in volatility around 2013. And then it sort of came back to this five, six hundred dollar level after reaching perhaps $1,000. But then we saw a bit of an explosive move towards the end of 2016. For those of you that are aware of what has effectively happened in the Bitcoin market, it topped out very close to the 20,000 level, which is an incredible period of growth. From between five and six hundred US dollars per Bitcoin right the way up to 20,000. So that is an incredible rate of growth in what is effectively 12 months of price action.

So this is what we’ve seen in 13 months. And it’s incredibly bubble-like. It’s for those traders that were quite happy to speculate on this market progressing to the upside. What we actually experienced, around this sort of price around here, was that these markets were then tradable on the future exchanges as well. And what we saw is a little bit of a push to the upside. And as you can see, an incredible reversal getting close to the $20,000 level. So this market, you know, experienced the best part of about 60 or 70 percent devaluation in a relatively short period of time. From December through to the end of January approximately, early February. But we’ve also seen, and this is a really good example of that bubble, seeing prices push higher, and what we’ve seen over the last few months is a complete devaluation of a market like this as well.

So you know people have very different ideas and expectations about your cryptocurrency markets. It’s very important to have a unique understanding about what impacts each and every cryptocurrency markets. And you know, the longer that these markets are tradable and the more access to price that you can establish, they’ll become a little bit more perhaps stabilized. I do say that with an air of caution because it’s hard to say that about a market which has seen such an explosive move in a relatively short period of time followed by a major devaluation.

So that’s just a little overview regarding the currency markets, a review of the six major asset classes, tradable asset classes, for us as traders.

So just to discuss a couple of points really around that, what we have is trade selection as well. So we have all of these markets that we can trade, but really what trade should we be looking to get into? A definition of trade selection is the strongly held belief or opinion to achieve a desired outcome. So deciding which trade should be taken is a very difficult decision, decision-making process, which can take time to master. It doesn’t necessarily come that easy. You have to sort of experience the markets and how they interact, and how they move over a period of time. 

Now, the more experienced and sophisticated investors out there trade what’s called diversified portfolios. And what these actually look to do is actively trade a combination of markets from a whole variety of different asset classes. So just a final point. This can be an extremely effective tool to assist traders manage downside risks. So embracing that principle of diversified portfolios is something that certainly your more established and more sophisticated traders will be looking to achieve. And to explain diversification in a little bit more detail and to give you again a very brief definition of what diversification is – pure and simply, it is a risk management technique that mixes a wide variety of investments or trades within a particular portfolio. So if we were to trade solely on one market we would then be completely exposed should that particular market or asset class fail to perform for a prolonged period. So we don’t want to put all of our eggs into one basket, so for that reason traders would typically attempt to trade a diversified portfolio. This could include trading markets from different asset classes. 

So we’ve just reviewed the six major asset classes which are available to us as traders. So it might mean we might have a couple of foreign exchange pairs, maybe a major pair, maybe a minor pair, maybe an exotic pair. For that matter, we might trade a couple of commodity markets, maybe an agricultural product, like corn, maybe a hard product, like gold. We might then decide to trade a US índice, and maybe a japanese indice. We might decide to trade a couple of global equities, maybe BMW in Europe. We might decide to trade the gilt in the UK, for example, if we’re talking about the UK bond. And finally, we might decide to trade a cryptocurrency as well, and there’s many, many to choose from. So that is the basic principle of diversification. 

So while attempting to diversify, we must be conscious of correlation among markets and asset classes. So what we mean by here is the EURUSD and the GBPUSD. And it’s funny how often traders trade EURUSD and the GBPUSD, not necessarily knowing they’re correlated in the way in which they are. Because they’re both trading against the US dollar. So, if the US dollar is strengthening on a particular trading day, then it will mean that the EURUSD and the GBPUSD will both move to the downside roughly at the same time if we’re getting some dollar strength. And the same applies if we start getting dollar weakness. So you’ll experience the GPBUSD and the EURUSD both moving to the upside if we’re experiencing dollar weakness, in this example. 

So it’s just very important that you are knowledgeable and you’re aware of this as a trader. That if they are correlated, they can react in a similar fashion. So effectively, what that means is you could be doubling up your potential gains, but you could also be doubling up your potential losses as well. Really knowing and understanding this, is what’s really important. So for example, the same thing applies to someone trading two indices, two US based indices, like the SP500 and the Dow Jones 30. Because they will react to similar situations more often than not. And, they’re correlated markets. And finally, like the gold market and the silver market. It doesn’t make too much sense to be trading both of these markets at the same time. Maybe just increase your size in one of them. And trade one, rather than trade two, correlated markets. 

Okay so that’s a little bit about diversification. So, just to conclude this webinar, let’s have a look at asset classes on a trading platform. We’re going to have a look at Metatrader 4 platform and so I shall get this up on screen right now. And what I want to draw your attention to is just on the right hand side of this screen. And in blue here, we can see your major currencies. And these are your dollar related trades. You have the dollar sitting on one of these sides and they’re all at, if you can notice, six letters. So the first three is the base currency. If we’re looking at the euro. And the second three is the quote currency. 

So if I just flick over to the EURUSD for example, and the current price in this market is the ‪23:23‬ currently, right now. So what that means for us if we decide to trade the EURUSD, is that we will see the quoted price of 1.2323 US dollars for each and every €1 that we trade. So that is the exchange rate. And that just applies across the board, different markets. But just focusing on the market watch, what you can do if you do trade metatrader4, and it’s the most commonly used platform out there, you can right-click on any market. And just make sure you Show All. What that will do is that will reveal all of the markets that you can trade. There’s also minors and exotic pairs in here on the currency side. This thing like the copper market. 

And as we scroll through, they’re all color coded. We also have your global indices as well, which can be traded. These, you have the dollar index, but you also have your equities, global equities like Apple and Amazon. And if you just hover over them, you’ll be able to see and understand exactly what market. You can look at a price action of each of these as well. So those are all your equities that you can trade on a contracts for difference. And there’s some more foreign exchange markets. And then you’ve got your, again, this is all colour-coded, you’ve got your commodity markets, natural gas, oil markets. The pound, sorry, excuse me, the gold markets, for example. Then you’ve got considerable, as you can see, there’s a vast number of different markets in there. You’ve got a lot of markets which are in there from various different jurisdictions globally. And then you will have access to loads of currency, cryptocurrency, markets as well. 

So that’s just a little overview about the different types of markets that you can access certainly on a Metatrader 4 platform, and there is many, many markets to choose from. Which is often what presents traders with significant issues, in terms of which markets they should be trading. 

So, that’s a little overview of the trading platform and what markets you can access. So as you can see, we’ve had a look, we’ve tried to define, asset classes. We’ve looked at the six different asset classes that are available to us as traders. The foreign exchange markets to commodity markets, the stock markets, the industry markets, the bond and the cryptocurrency markets as well. And just touched upon trade selection and diversification. 

So on that note, all that’s left for me to do now is to thank you very much for joining us, and we do look forward to seeing you all next time. Bye for now‬‬‬‬‬.


Categories
Forex Courses on Demand

Using Volume As A Form Of Technical Support – Forex Tips & tricks


The following presentation is brought to you as a courtesy of forex Academy! this is part of our service courses on demand, if you find this interesting and wish to be updated on new releases, please subscribe to our YouTube channel, or join our community at forex dot Academy and receive all of our services for free. You’re like is also highly appreciated enjoy.

Let’s look at volume with technical support, technical traders observe the volume around key levels of support and resistance. These levels may be long-term price interest points over a long time period, or technical support levels such as an indicator like a Fibonacci retracement. These levels can often cause a congestion of trading, what this is known as guys is price consolidation, an increase in volume is often seen as the early sign of a trend. As prices push away strongly and from consolidation and find price direction. Let’s look at this in some detail, I just wanna discuss it very briefly. Just above here we have a technically well confirmed level of technical support and resistance. We see price consolidating just above the level, so above what we see here is the market trading down on various occasions.

I’ll just use my pen to highlight, obviously we can see with the black (s) for support. The market actually trades down past the level, and actually continues to trade up again. Another’s indicative, each one of these and time periods here, we see the market trade down, trade up and close above the level. Here it’s very volatile within this price section, again but not convinced of it either way, and again one two three with these candle sticks.

It’s rejecting the downside, this is a very very informative level of price resistance, and where traders do try and force the price below this level. But it does not want the close below the level and effectively above our price level. Technical support is very strong indeed. well what does that mean? When price is actually trades below the level, and close below low level, well it’s very significant! So the candlestick itself is very significant, because in this example we have a bearish very strong sign, that the market is continuing to trade down. What we see is if I just use my epic pen here again, I’ll use a different color to depict what we actually see, is the market closing below the level here, and continuing to trade, why is this significant in terms of using volume as a technical support? Well evidently we see volume rising above these levels here, volume rising above nominal levels, and again here. We get a close where volume is actually very very handy, that I do believe it’s our highest level of trading volume for the given range. So very technically significant indeed, and as prices close and continue to trade below the level, volume is still quite high so that that gives us a sign as we go back to our fundamental discussion.

The level of interest or participation at the level of agreement, between traders, seems to confirm we’ve closed below the level. Were not rich racing, we’re happy below the level and prices may shift. So eventually the trading congestion layer leads to a break out, and creates new price direction. This is also supported by an increase in volume through the downside, as we can see in the chart let’s have a look at the cocoa market here. So we have our two levels of long-term price support, here two technical support levels both a ceiling above here at 2171 on the floor technical support at 1798. As you can see there is a long-term level of price congestion, between actually trading these candlesticks we can see the price does break down. But we see as long as the exact price congestion has no real structure until we get to these levels. Here can we decide, well this is the second time we’ve actually been towards these price levels here 2171, how is price going to react? How is volume going to react? What story does that tell us in terms of price action, on future trading momentum? well let’s have a look in a little detail, here we see at Point A, we see the market break up and what significance is that in terms of volume? Well we have low volume, it actually causes a false breakout and trades to the downside. They’re just below, we can see volume actually decreases as the market breaks up through the ups, then we see the market continue to trade with an increased low level of volume, until we actually move forward. As the market trades we see very very low average volume, with a breakup to the upside evidently as the mark comes back to our long term, and price point just here below we see breaking up to new prices. Another supported again and actually by an increase in volume, resulting in a breakout to the upside. We can see a very low level of volume, and then as we shift towards our long-term price resistance level, volume pushes us through that level and actually closes above it. now we’re aware to the upside, so very significant in this chart using volume to indicate a breakthrough through technical support.

Categories
Forex Courses on Demand

Avoiding Traps In The Forex Market – The Biggest Danger To A Trader

The following presentation is brought to you as a courtesy of forex Academy!This is part of our service course on demand, if you find this interesting and wish to be updated on new releases please subscribe to our YouTube channel, or join our community at Forex dot Academy and receive all of our services for free! You’re like is also highly appreciated, enjoy!

In terms of fundamental analysis on decision-making how do we avoid market traps? well we have a legendary British American investor and professor here Benjamin Graham. He will give us some fantastic insight through the market, he has a very famous quote “observation over many years has taught us that the chief losses to investors come from the purchase of low-quality securities our times of favorable business conditions”.

Another’s indicative of doing your due diligence. As a fundamental analyst and making those well informed decision making, and trades particularly when we are in times of very strong economic boom. A lot of traders simply believe prices will still go up, no matter what the asset they decide to trade, or no matter what the equity they decide to trade. That is not the case, certainly we do our due diligence for each particular fundamental trade, in each particular asset. Our market in question as fundamental analysts, it is essential we focus our decision-making, on all fundamental news affecting the price of the asset. We must never rely on any one variable, and that’s certainly the point we’d like to make there, how do we avoid these necessary and are these very common market traps? Particularly as beginner traders, well a few points to look out for, avoid trading with the dumb money. And this is indicative of actually looking for good trading opportunities as well, but we try and trade with this smart money in reverse. We do not want to be the last person buying a very strong move to the upside, or the last person selling a very honest and weak move to the downside.

So avoid trying to jump in and chase the markets, and obviously that leads on to a second point, being the dumb money. Being the last rat to jump ship when the ship is going down, is not the wisest trading decision. Indeed always protect your trade with the stop-loss. Now we will have plenty of lessons on risk management coupled, protection is absolutely key empowerment to your trading success in terms of avoiding those market traps. Always protect your trade with the stop-loss, do monitor the markets at all times and a key point here is do not become a victim of overconfident analysis. So again relating to the point of the webinar, fundamental analysis and decision making, well obviously we need to monitor the markets and that is one downside. I would certainly say true fundamental analysis, do a lot of research, a lot of due diligence in formulating trading decisions. And because they put a lot of time and research into the market they cannot take a looser way in the market proves them wrong. So do not become a victim of overconfident analysis and always monitor the markets, learn to combine the fundamental decision-making with technical decision-making. That lends itself to always trying to stack the odds in your favour as a fundamental and technical trader, to heighten your probability of successful outcome.

Categories
Forex Courses on Demand Forex Videos

Buying Rumour & Selling Fact – Forex Fundamental Secrets

The following presentation is brought to you as a courtesy of forex Academy!This is part of our service courses on demand, if you find this interesting and wish to be updated on new releases, please subscribe to our YouTube channel or join our community at Forex dot Academy, and receive all of our services for free! You’re like is also highly appreciated enjoy!

Let’s have a look at buy the rumor sell the fact! And how market participants can gear up for these trading opportunities. Buy the rumour or selling the fact is a piece of trading, the device developed in early stock market trading, it relates to a situation where the price of a stock would move higher due to traders buying, because of rumour. It is simply heard about!Possible company acquisitions, or higher than expected earnings reports. So there is many different examples that could start the rumor mill, where traders would actually say to trade off these rumours, and actually position themselves in the market with the impression the rumor will eventually come true.

Actual buy-side volume is created, so that’s what happens now. It should be worth noting, depending on the rumor sell-side volume can be and created as well it’s not always on the buy-side. Particularly it has more of a common approach to buy-side volume when we discuss buying the rumor selling the fact, and equity trading inevitably when the news or economic event occurs, and the rumor turns out to be untrue. The sell, the fact sentiment takes hold of the market, the company earnings perhaps come out negative which causes a quick sell side shock to the market in question. So that’s a classic example of hearsay, where traders interact with the market based on a rumour of a possible acquisition or perhaps very good earning reports. when the fallacy turns out to be untrue, then the market of course reacts differently, and then the trade is sell the fact. We have a picture here with our financial traders, particularly I think equity traders and I would like to just read the quote at the bottom, indicative of high market participants can gear themselves and trade off hearsay and rumours.

“The good news sir is that Harris was able to sell off or losing stock the bad news is that Simpson here bought them from Harris”.

So there is certainly indicative of, how market traders can involve themselves willy-nilly trading off rumours. I’m actually looking to profit and speculate from such rumours, but then obviously the outside factor may come in when the story unwinds. It should be worth noting in the forex markets, buying the rumor selling the fact is interpreted differently, mainly because rumors are not as common. On the vast number of variables affecting forex markets, would make it very difficult for a rumor to cause any real momentum, or movement in price now unless the rumor is an absolutely huge, groundbreaking rumor that will totally rearrange the forex markets. It is very unlikely that it will cause sustained, or a very large shock to to price in a forex markets, given the liquidity and given the the depth of the forex markets.

Indeed the Forex equivalent to buy the rumor sell the fact, is to trade in anticipation of current news releases. Traders often see news releases as a way of making a lot of money very quickly! Now it’s not always the case, but many traders do take very small positions in preemptive positions, before news relations are about to occur. An economic announcement like the monthly non-farm payrolls figure, can cause dramatic changes in asset prices, and many traders conduct fundamental analysis and trade in anticipation of speculative prices. By the time the news has been released, many traders have traded based on the forecasted number, and are now ready to sell a fact, so let’s just rewind, let’s just think about this for a moment. We have perhaps a non-farm payrolls, we believe it’s going to be very strong, given the forecast, and before the figure comes out. We actually make a trade, as a trader as fundamental analysis under decision making, and we’ve actually made a pre-emptive decision to enter the market before the figure. We’re not guessing we’re using a fundamental, a discussion of the of the markets in question and positioning for the move itself, Now the figure may come out I’m very positive indeed we’re on the right side of the market, well that’s fantastic, the market trades up and we’re in a profitable position. What is our decision now? Well obviously if we decided to many traders could could have very well made the same speculative position, we could sell or trade for a nice profit and then what we could do, is actually sell the fact! We could look for a pullback in that price given, that many traders may have expected, or the market has already pressed in this move to the upside and we know you’re looking to sell the fact. More often than not we actually do see very strong pull backs in trades like this.

Categories
Forex Courses on Demand Forex Videos

Everything You Need To Know About Assessing The Forex Market – Qualitative VS Quantitative


The following presentation is brought to you as a courtesy of forex Academy! This is part of our service courses on demand, if you find this interesting and wish to be updated on new releases, please subscribe to our YouTube channel! Or join our community at forex dot Academy and receive all of our services for free, you’re like is also highly appreciated.

As we assess fundamental analysis on decision-making, we must look at quantitative versus qualitative data. Now considering the distinction between the two types of data, we typically define them by referring to data as quantitative, if it is numerical in form, and qualitative when the data has a more theoretical basis. Now, why is that the case? Well, qualitative data is more concerned with understanding human behaviour, from the informants perspective, and the informant is simply ourselves. As economic agents and traders, it assumes a dynamic and negotiated reality, so there’s a level of discretion to understanding. Our qualitative approach, in contrast, quantitative data, is concerned with discovering facts about social phenomena. It assumes a fixed and measurable reality; in other words, the fixed and measurable reality is the raw data, the numbers that we try to derive a social phenomena and extract thought from that.

With the methods data is collected through Participation, observation in interviews, Data are analysed by themes from descriptions by informants. Again that’s simply us and reported in the language of the informant.

In contrast their quantitative data, or collective, through measuring things. Data is analysed through numerical comparisons, statistical inferences, and data is reported through that statistical analysis. So we use with quantitative data, the raw data to formulate charts and graphs, to give us an overall picture statistically, and to look for social phenomena which obviously help trading decisions. Fundamental trading is considered to be more a qualitative approach! Qualitative research is multi-method in focus involving an interpretive naturalistic approach! This means qualitative researchers study things in their natural settings, attempting to make sense of or interpret phenomena in terms of the meanings. People bring to them research following a qualitative approaches, exploit exploratory, and seek to explain how and why a particular market is behaving. Therefore, fundamental traders often based their trade decisions on a question of value, what does that mean for our trade decisions? Well if research shows that an asset is undervalued, these traders will look for buying opportunities, if on the other hand, research suggests an asset is overvalued, these traders will look for selling opportunities.

Technical trading, on the other hand, is considered to be more a quantitative approach! Quantitative research collects data in numerical form, which is then subjected to statistical analysis. The data is then measured to construct graphs and charts, to physically represent patterns or ideas that provide statistical reasoning. As the research is used to test a theory, it aims to ultimately support or reject the hypothesis! So as this approach tests raw data, it can be applied to many different environments, and that’s a huge advantage to using this quantitative approach. Actually deriving reasoning from the raw data across many different fields, or industries data analysis, helps us turn statistical data into useful information to help with decision making. Therefore quantitative research is more focused on our objectivity, and that would certainly be the main reason why we would say quantitative approach or quantitative trading, it has more of an essence of technical trading. As technical traders, we want to become very objective, if we look towards our technical indicators, take Bollinger Bands as an example, it uses a statistical model across a variation from the mean. It follows price action to look for objective trading decisions as such. Technical trading is considered to be much more of a quantitative approach.


Categories
Forex Courses on Demand Forex Videos

Buying & Selling The Forex Market – The Path To Financial Freedom


Hello and welcome to this latest edition of courses on demand brought to you by Forex. Academy.

So in this course, we’ll be discussing buying and selling, and the principles of buying and selling. Now, everyone has a comprehensive understanding of the process involved in buying, of course, you buy a particular price in the expectation for that price to increase in value, and then you sell that particular asset, or whatever it may be, and you will benefit from that margin as profit.

Now, the same actually applies to selling. It’s referred to as short selling and can provide a little bit of, especially, to those that are new to trading the financial markets, it can provide a little bit of difficulty, in the kind of the principles behind short selling. So that’s what we’ll be looking to discuss over the course of this webinar.

So if we can start as we always do with our disclaimer. Please do familiarise yourself with the risks involved in trading these financial markets. If you are accessing this in the form of a recording then please do feel free to pause the recording, and do familiarise yourself with our disclaimer.

Okay, so let’s start with a webinar outline. So we’re going to introduce the principles of buying and selling. We’ll have a look at the process involved in being able to buy a market. We’ll have a buying example just to clearly define the process involved in buying that market. And then we’ll have a charting example to show you the process in which a trader would execute a Buy order in the markets, and what we would expect to happen over the course, and certainly on this webinar. And what we will do in addition is introduce the principles behind Selling, those that trade derivatives, and in particular see if these have the potential to actually sell a particular market in the expectation that prices are going to move to the downside. So we’ll explain this in some detail. We’ll have a particular example for you and we’ll finish with a charting example of looking to sell a market as well.

So let’s start with an introduction to buying and selling. So the beauty about trading derivatives and specifically CFDs, or contracts for difference, is that we as traders are able to both buy and sell a market. That’s the important part of being able to trade contracts for difference. The problem with this process is that everyone has a comprehensive understanding about the process involved in buying a market – you buy at a lower price and exit at a higher price. It’s fairly straightforward, easy to understand and comprehend, making the corresponding profit as a result.

Now the difficulty arises, as I’ve alluded to already when starting out, often comes in the form of perhaps potentially misunderstanding the process involved in potentially selling a market, or certainly the theory behind it. So when we look to sell a market, where a trader, in this particular example, would decide to potentially look to sell a particular market at a certain price, or what would be deemed as a higher price, with the expectation for prices to actually move lower. And if the market follows through and those prices do push lower, you could exit at a lower price. And what that means in that situation is you’d be able to benefit from the corresponding devaluation in that price.

So we will go through these in a lot more detail, but, just the principle of buying is when you expect prices to push higher, so you’re seeing that upward movement. Perhaps from bottom left to top right on a trading chart. And also, the process involved in selling a market is where you’re expecting prices to actually push lower. So you’re seeing prices move from top left to bottom right.

Okay so let’s get straight into the process involved in buying a market, to begin with. So buying a CFD, or contract for difference, market is when you think the market is more likely to rise than fall over the period you happen to be evaluating. So it’s where you’re doing your analysis. And whether you’re a technical trader or whether you’re a fundamental trader, or you’re trading sentiment. You’re expecting prices to move to the upside. So you are speculating on an increase in value of the instrument between now and at some point in the future. So, of course, you have that expectation for those prices to push higher. So at whatever point in time, you happen to be looking to take this market to the upside, you will expect over a certain period of time that the prices will move in one direction. And that is to the upside.

Now, of course, traders can get their assessment, they can misunderstand what’s happening in the markets, markets don’t have to necessarily follow through to any great extent. But, if it does, then you’re expected to make profit on the differential between your entry price, which could be signified at this particular level down here. So we’ve just put ENT for entry. And we’d be identifying a higher price to exit this market. So, let’s say our exit is, it happens to be up here. So EX for exit. And the process of buying simply involves the difference that you’ve paid for the particular asset or instrument or market that you happen to be trading and seeing prices increase in value. You’ll be able to profit from that differential between your entry price and your exit price.

So, relatively fairly straightforward process involved in buying that market. You’re just expecting that market to continue to push to the upside. So to just touch upon a buying example and to explain it in a slightly different way, and to just highlight a couple of let’s say technical aspects to being able to buy a market, let’s just say for example we buy the EURUSD market. You believe the EURO as a result will, therefore, strengthen versus the USD. So what you might end up doing is buying that market at $1.2000. And the quoted price that you’ll see on any particular price chart, the price that you’re seeing, is what you’re able to exchange €1 for. In exchange for, so €1, we would be able to exchange it for the quoted price on a EURUSD price chart. And the price that you’re quoted is what you will get in exchange for €1. So effectively for every €1 in this example, you will receive $1.20 in exchange for €1. So that’s just how to interpret it. And don’t misunderstand the fact that foreign exchange‬ markets, the non-yen foreign exchange markets, are presented to the fourth decimal place. We’re still talking about realising an exchange rate for what is effectively €1. And in this example, if we see a price of $1.2000 then it’s we’re exchanging $1.20 in exchange for €1. So hopefully that makes a little bit of sense.

However, we’re looking to buy this particular market and we expect prices to push up, to move to the upside. So, if the market now moves to the upside and you start seeing a price of $1.2500, then, of course, you are in a position of profit. Because you’ve purchased the EURUSD at $1.2000, the price increases to $1.2500, and you will, therefore, benefit accordingly. So effectively your €1 which you locked in at a particular price, at the $1.2000 level, will now actually be worth, that same €1, will be worth $1.25. And it’s because that market, as you’ve anticipated, has strengthened. As a result, you profit by, as you can see, $0.05 effectively. $0.0500 are, if we talk about it in trading terms, we’ve benefited from a five hundred pip movement. So it’s to the fourth decimal place, and you can see that there’s five hundred units here at the end, and that is perceived profit.

Now it’s also important, and without the desire to confuse you, to know that if we happen to trade €1 in real terms without the use of leverage, we would make $0.05 profit on that particular trade. So although it sounds like small amounts, of course, it is a tiny, tiny amount, but effectively you’re making five percent return on your investment. So and it’s for every euro as well. So that’s what you will, that’s effectively how those that are fortunate enough to trade the market without the use of leverage, this is how they can effectively make money grow to a certain degree. So this is just the practical example of the profit that you would look to generate if you were trading without leverage.

So leverage is, unfortunately, a double-edged sword, but it’s a necessity for the vast majority of traders out there where you would actually be able to see a significant multiple of that in real terms if you were able to benefit from a five hundred pip move in that market. But if we strip away leverage and the impacts that leverage can have on your trading in your performance, then we can be left with a fairly easy to identify profit on a particular trade.

Ok, so just to continue with this buying example, however, we’ll look at it from a slightly different angle. Let us continue with the assumption that you’ve purchased the market at that $1.2000 US dollar level. Now, if the market this time fails and you get your analysis wrong and you close the trade at perhaps $1.1500, you would have been effectively realising a loss in this case. And the same thing applies this time. You have effectively lost $0.0500 in terms of a return on your investment, and this would be a five hundred pip loss from a training perspective. Now, this would mean that you would’ve effectively realised a loss of five cents on every euro that you happen to trade if this was an un-leveraged example.

So there’s obviously pros and cons to leverage. Like I said, it is, unfortunately, a double-edged sword. It’s a necessity for the vast majority of traders. However, used and applied incorrectly, then it can become a significant issue for a trader.

Okay, so let’s take a buy trade on a Metatrader 4 platform now. So for this, I’m going to get up our charting software and let’s do a little bit of analysis on this market. So we’re looking at this market. I’ll just convert this to a nice solid blue colour. So it’s a level of support resistance that we’d be looking to work with. And, let’s just finish out a little bit of support and demand. So we can see that the market is range-bound and it’s bouncing off these highs and lows. So let’s say we like the potential to buy this market around this price. And this is a live, reactive price. So let’s say we quite like this kind of setup. We’ve bounced off the 1967. We’ve seen a structural failure to the upside, and we now want to buy this particular market.

So to do this, we can effectively open up a new order. Make sure you’ve obviously you’ve done your risk management calculation so you know exactly how much risk. Let’s say, if we buy it at the current price and we’ll sell it below the 19. So I will place a stop-loss below the 1967, so let’s call it the 1965. And we’re going to just place a take profit again at the higher level. Let’s say, at the 1.2005 level. So just below this level here to the upside and we’ll place this particular order. So straight away what we’re doing is we, we’ve carried out our analysis.

I appreciate I’m getting into this market a little bit late. It would have been nice to have just got back in, getting into this market perhaps 10 pips lower. But the basic principle applies. Where a trader applies their technical analysis, they look at the charts, they identify opportunities, they make sure they control, and they manage their risk, so that stop losses is outside the level of support. And we’re looking to buy this market in the expectation that the price is likely to push up to these higher levels. In which case, we’ll be able to realise a return on that buy trade.

Equally, if the market starts to reverse, which it’s looking like it’s potentially doing now, I’m just pulling back a little bit off those highs, and if it bounces back, then we’ll start to realise a loss. Now the trade will remain intact until either our stop-loss is hit or our take profit is hit. Now, we can intervene ourselves and make sure we cancel this trade if we wish to, but what I’m going to do for the purpose of this demonstration and this recording and this video, is to leave this trade running. And we’ll refer to it very, very shortly and just see if either the price squeezes to the upside and we book in profit, or whether it actually rolls over and breaks these lows, or whether actually procrastinates between these two levels of support resistance. So, we can trade these market conditions, but this is the principle involved in buying a market. So I’m going to leave that trade running and we’ll see how we get on and we come back to our trading screen very, very shortly.

Okay, so to just introduce the principles behind selling a market now. So selling a CFD market is when you are speculating on a fall in price and volume. So this time we expect prices to push to the downside. So you’re selling, and it’s important to know when you’re trading CFDs as well, that you are selling the market without acquiring it. So there is no need to, and this is where the confusion can arise if you perceive the word selling as a very similar principle to effectively buying it. But you’re not, there’s no actual, you’re not actually acquiring the asset when you get into that market. So you’re only speculating on price movement. So this is, effectively, known as short selling. So when you hear short selling by your big institutions or your banks, then they’re referring to the potential to sell a market without the need to acquire the particular underlying asset. So this is known as short selling. So what you’re effectively doing is you agree to sell a market at a certain price in the belief or expectation that the market will fall in value at some point in the future. So if price moves in your favour you can then exit at a cheaper, or what are referred to as a lower price, which would then result in you realising a profit if you were able to benefit from that price move.

So to work you through a practical example, what we’d be looking to do in this, in this market, is let’s say we would do our analysis, and we would like to sell this market at that level. So we get into that market in the expectation for price to move to the downside. So this time we are actually getting in at this higher price in the expectation for prices to push lower. And if that’s the case, we might decide to get out at this level. So we can actually exit this sell trade at a lower price, and as a result, we’ll be able to realise this much profit in that, in that particular trade. So this is our profit margin between our entry and our exit. And just think of it as the process involved in buying, but completely upside down, so it’s a complete 180 on the process involved in buying. So, in this occasion, we look to get into the market at a price with the expectation of prices to push lower. And if they do follow through and do push lower and you exit at a lower price, then the difference between your entry and your exit is effectively your profit.

So that’s how traders work and utilise the potential to sell a particular market as well. So to take you through an example. If you sell this time the EURUSD simply because you believe the euro will weaken, so maybe there’s some news out impacting from the ECB or something like that, there’s really poor economic data so the performance of the euro is not that great, and you think right, there’s an opportunity here to sell the euro dollar because you believe the euro is going to weaken and you think that the dollar is going to strengthen as a result. But this time you sell at twenty one hundred (or $1.2100). So this time for every €1 you happen to trade, it has a converted value of $1.25. So that’s what you will receive at the point of entry if you get into this market. So, following through with this, this is the amount you will sell €1 for, just to make that crystal clear. So if the market now falls to $1.1600, you would then be, as a result, you would then realise profit on that trade. So effectively, on this occasion, your €1 to the fourth decimal place, which you actually booked in or locked in at the $1.21 level, would now be worth less than the price you booked in that market. And the reason for that is because the market weakened, so the euro dollar moved to the downside.

But this time, because you anticipated a devaluation and you clicked the Sell button instead of the Buy button because you’re expecting prices to push lower, you’ve anticipated a devaluation and you’ve shorted that particular market. You can then benefit from that lower price move so you could still profit by $0.0500 (or five cent) which in trading terms would be a fantastic performance and a 500 pip return on that trade. So this time, just look at the same principle involved in buying a market. We’re just looking at it from a slightly different perspective. We are looking to sell. That would mean you made five cent U.S. profit in this trade. Again, without the use of leverage is what we’re referring to in this particular example. So this time we’re benefiting from a devaluation in price. So looking at the process involved in selling, just from a slightly different perspective, what if this time you sold the euro dollar at the same price, at the one dollar twenty-one cent level? But, the market decided to rise so you’ve got your analysis wrong and the market rose to one dollar and twenty-six cent and you close the trade. You would have effectively, at that particular price, you would have effectively realised a loser. So this time again, similar process, you would have lost five cent (or $0.0500). So again in this particular example, that means you would have lost five cent on every euro traded, in this particular un-leveraged example. So the best thing to do is to show you this in a viable, looking at a metatrader4 platform, and, we shall also just touch upon the performance of our buy trade.

So this time we are expecting this market to move to the upside. And you can see prices are a little bit above our entry levels. It would have been nice to have got into this market at a little bit of a lower price, but what we’ll do is we shall close our buy trade. We’ll book in a little bit of profit on this particular trade. And we’ll close, so let me let me modify, let’s close this trade at that price. So we’ve actually booked in a little bit of profit on that buy trade purely because the market proceeded to push to the upside. And if it kept moving to the upside, um, we would have had a take profit at these higher levels and been able to book in a little bit more profit.

So, so now we’re looking at the principles involved in selling. So without the need to sort of confuse you to any great extent, let’s do a little bit of analysis, And we think, for whatever reason, we’re likely to run into a little bit of resistance around this level. So what we’d actually like to do now is to sell this market. So we think the prices could bounce back to the 1967 from this level, and we can work with just above the high at the 2007 level, at the place, our stop-loss. So we can keep our stop-loss out of the way and we’ll see if these prices roll to the downside.

So, so again we can place a new order. And, but we just need to make sure that we’re looking to sell a market this time. So really we’re focusing on the potential to sell by market. And so again we want to get into the routine of making sure we place our stop-loss. So we do expect the price to move lower based on our very brief analysis. And roughly around the 1993 level (or a $1.1993), that’s the price we’re currently looking to sell this market. Um, and we’re going to place our stop-loss at the 2009 level. So, $1.2009 we can place as a stop-loss. And we want to take profit just around these lower levels. So let’s say the 1971 is where we’re looking to take profit from, so $1.1971.

So just before we take this trade, we’ve done our analysis, we are looking to sell this market. We do expect this price to move to the downside, because we’re trading CFDs, we are able to look at it for opportunities to sell these markets, as well as buy them. But, it’s all important that you place your stop-loss at the $1.2009, so you’re doing it at a level that seems to make sense. And just make sure this time that you press your Sell button. So now we’re seeing that the same trade execution details up on-screen. So we have our entry price, this is the green line in the middle. This is the level that we’re getting into on a Metatrader 4 platform. And we have our target down here at the 1971. So we do want these prices to squeeze lower. And we have our stop-loss just above this recent structure up here. And we’ve protected our capital, so if the market reverses somewhat and we get that extended move to the upside, then we are absolutely able to protect ourselves accordingly.

So let’s say you know like 10, 15, 20 minutes go by and you know the market hasn’t really done an awful lot. Okay we’re pushing a little bit lower, in a little bit of profit, and we may decide to cancel this particular trade as well. So we’ll close this order, make a little bit of profit on that trade as well. And that’s a live example of looking to both buy and sell a particular market with as you can see different outcomes in mind based on your analysis.

So that just about concludes this particular webinar so we’ve covered hopefully in detail the process involved in looking to Buy a market and also the process involved in looking to Sell a particular CFD market. So all that’s left for me to do now is to thank you very much for joining us. We do look forward to seeing you next time. So from everyone here, take care, and bye for now.

Categories
Forex Courses on Demand

Bulls v bears

An efficient trade orientation decision requires comprehending the underlying current risk bias of the masses.

Categories
Forex Courses on Demand

Candlestick Formations

Learn how to read candlesticks like a pro and get extra confirmation on price direction.

Categories
Forex Courses on Demand

Chart Patterns

Chart patterns is one of the most solid tools of technical analysis as they give you a quick and clear picture of price action´s framework.

Categories
Forex Courses on Demand

Trading with Correlations

We explain you how to understand and apply the different types of correlations, which will help you incorporate relational foundations to your own trading method.

Categories
Forex Courses on Demand

Trading with Market Sentiment

We elaborate on a very popular trading approach that accounts for how the different market players position themselves on a speculative basis.

Categories
Forex Courses on Demand

Fundamental Analysis Part I

Learn what fundamental analysis is, its different components and relative importance.

Categories
Forex Courses on Demand

Fundamental Analysis Part II

We take you deeper into fundamental analysis by covering the most relevant peices of economic data; we also elaborate on its importance relative to professional risk management.


Categories
Forex Courses on Demand

Fundamental Analysis Part III

Final delivery of the F.A saga. Here we take an empiral approach by showing you real case studies where fundamental analysis is performed and incorporated into the trading decision-making process.

Categories
Forex Courses on Demand

Applying Fibonacci Part I

We introduce you into the exciting world of Fibonacci, one of the most common tool for technical analysts. Learn the basics of the different types of ramifications that Fibonacci has to offer

Categories
Forex Courses on Demand

Applying Fibonacci Part II

In the second delivery on Fibonacci, we willm show you how to apply a diverse set of techniques that will enrich your trading profile to a real professional level.

Categories
Forex Courses on Demand

Elliot Wave Theory

Elliot Wave counting is one of the most controversial tools used on technical analysis. In this course you will learn its pros and cons; as well as the foundations that will enable you perform a solid waving appraoch to your charts


Categories
Forex Courses on Demand

Market Analysis

We guide you through the most popular analysis methods among traders, their pros and cons; also learn tips to improve your own approach.

Categories
Forex Courses on Demand

Leverage v. Margin

We explain you the differences between these two important concepts, and provide you with the foundations of professional risk management.

Categories
Forex Courses on Demand

Trading Price Momentum

Learn all about one of the most relevant price features: momentum. This will improve your decision-making process regarding the proper timing to close your positions

Categories
Forex Courses on Demand

Mastering Breakout Positioning

Trading breakouts efficiently will give you the extra edge professionals have for pips maximization. This course will show you how!

Categories
Forex Courses on Demand

Price Action

Learn what price action really is, the best analytical techniques to predict it, and how to turn it into a valuable trading methodology.


Categories
Forex Courses on Demand

Risk Management Part II

We help you incorporate all the required risk managent tools and techniques into your own trading methodology. Now you can control risk as a pro!


Categories
Forex Courses on Demand

Risk Management Part I

Learn the foundations of perhaps the most important pillar of successful trading: risk management. The first part of this course will take you one step closer to professional Trading.


Categories
Forex Courses on Demand

All about the MT4 Platform

This course will explain you all you need to know about the MT4, the most popula trading platform


Categories
Forex Courses on Demand

Types of Trading Orders

Mastering the different types of trading orders means mastering timing irrespectively of current market conditions. This course will teach you how!

Categories
Forex Courses on Demand

Portfolio Diversification

Portfolio diversification, backed up with a solid comprehension of correlation forces is as complex as useful when keeping risk tight. This course will show you how institutions really trade!

Categories
Forex Courses on Demand

Position Sizing

Learn another essencial element of risk management: position sizing. This course will provide you with great tips to control your balance error free!


Categories
Forex Courses on Demand

Price Cycle: Consolidation

Trading price consolidation phases is not only exciting but very lucrative. However, assessing timing, intensity, lenght and key levels require training and experience; after watching this course, you will be one step closer!

Categories
Forex Courses on Demand

Solid Charting

Expert chartists claim that price is fully accounted for by charts at anytime, to the extent that disgarding fundamental analysis is common. In this course, you will learn the foundations of charting, how it is connected to “technical analysis”, its pros and cons, advantages and limitations, etc.

Categories
Forex Courses on Demand

Support and Resistance

Lear how to identify support and resistance levels that truly matter, i.e., pivot points. This video will explain you useful techniques that will allow you to take advantage of these relevant price areas!

Categories
Forex Courses on Demand

Technical Indicators v. Price Action

This course covers the most popular technical indicators; while it explains you their pros and cons relative to conventional price action analysis. You will also learn useful tips as to how to allow technology enrich your own trading methodology!

Categories
Forex Courses on Demand

Position Management

In this course, you will learn how to efficiently administrate your trades way beyond the typical stop loss and take profit orders, i.e., order trailing, reaction to unexpected price drivers, hedging, timing, deleveraging and other useful techniques!

Categories
Forex Courses on Demand

Types of Markets -Part IV: Bonds

A genuine portfolio diversification requires a solid understanding of the particularities of different financial markets. In this course, you will learn about bonds, enjoy!