Beginners: analysis feature of MT4 to help find a trading strategy
Thank you for joining this forex academy educational video.
In this session, we will be looking at an analysis feature of the MT4 platform, which helps traders to find a winning trading strategy.
The Metatrader mt4 platform is one of the widest the most available trading platforms on earth. It is fully customisable….
And there are a host of technical analysis tools available in the Navigator section, which are freely available from most brokers, and which can be added to, either freely found ones on the internet or paid tools, which can be mostly found on the mql5 website.
On this one-hour chart of the US dollar CAD pair, we have selected three widely used and popular technical analysis tools from the navigator section, which are Bollinger bands, moving average convergence divergence commonly known as the MACD, and the stochastic oscillator indicator.
Although as a new trader, we must consider many factors when trading, such as fundamental analysis, the time of day while trading, whether or not economic data is due to be released, whether or not political or policymaker decisions, which might affect the particular currency pair we are interested in, are about to make an announcement, which could affect our trade, without doubt, the most critical aspect to trading, and which has the most influence on the movement of a currency exchange rate, is technical analysis. Technical analysis often overrides fundamental analysis and even economic data releases.
While we cannot be in control, as traders, of fundamental reasons for why a particular currency pair is moving in any particular direction, and nor can we control political events, we can become masters of technical analysis, and where we can study our charts and seek out regular and consistent screen trading patterns which can stack the odds in our favour with regard to consistent winning trades, and with regard to knowing where to place tight stop losses to maintain the health of our account balance.
Now chart patterns have a habit of reoccurring, and technical analysis traders know this. Therefore, as new traders, we must find regular and consistent winning setups, and this takes a lot of time as a new trader, and this requires a lot of patience and a whole lot of studying.
Only when we have found regular setups, which consistently work, can we then build a successful trading methodology, which should be adhered to.
Because these chart patterns are always changing, we can take advantage of the drawing tools such as the ‘’draw text label’’ as highlighted, and where we can make notes on the chart, and because of the flexibility of the MetaTrader platform…..
If we right-click on the chart, we have the option to save the chart as a picture for further analysis at a later time.
As we see here, to save the chart as a picture, we can set the desired parameters, including the size, and then click ok….
You will then be asked where to save it on your computer, select your destination folder, and save it.
This saves an awful lot of time and alleviates the need to scroll back through hours and hours of charts just to find the setup which you may have been interested in.
Beginners: How to save a profile in Metatrader MT4
Thank you for joining this forex academy educational video.
In this session, we will show you how to save a profile in the Metatrader MT4 platform.
The MetaTrader mt4 platform is one of the most widely used technical analysis platforms in the world. Some traders use it for technical analysis only, and will trade on a different type of platform. And some prefer to use it for both analysis and direct trading.
It is used the world over and is extremely reliable and robust. The platform comes with the widest range of technical analysis tools than any other platform available, and most brokers will offer the platform free of charge. The reason it is so widely used is because of its ease of customization and the huge range of technical analysis tools available both free of charge and to purchase on the MQL5 market place.
This is a 1-hour chart of the US dollar to the Canadian dollar, and the technical chart setup is
……called the Williams, and it is a custom setup, which is free with the platform download by most brokers.
Let’s say we have an interest in the Canadian dollar, and we want to see what the general directional bias is for the currency, and where here we can see that the Canadian dollar is currently losing ground against the US dollar…..
And here where we have added a couple of other Canadian dollar cross currencies pairs, including the CAD / Swiss and CAD / JPY on 1-hour charts, and we can tell that the general bias is for a weaker Canadian dollar across all three currency pairs.
The cool thing about the MetaTrader platform is that we can save this as a profile and come back to it later if we want to trade another currency pair.
First, we click on the profiles tab at the top of the platform.
Then highlight the save profile tab and click on it.
And then enter a new profile name. Here we have called it the Canadian dollar analysis.
And finally, click on the ok tab, and the profile will be saved.
Finally, to find all of your profiles, simply highlight the profiles tab at the top of the MetaTrader platform, and then scroll down to find the one you want. Here at the bottom, as highlighted, is the Canadian dollar analysis profile, which we have just saved.
You can see a whole host of similar profiles that we have already saved, including all of the major currency pairs, and where it is very simple and quick to move in and out various saved profiles to maximize opportunities of finding trading opportunities quickly, rather than building profiles each time you have an interest in a particular currency pair.
Thank you for joining this forex academy educational video.
Today we will be looking at the US dollar index, also known as the DXY, which is a weighted instrument against other major currencies, including the British pound, the euro, the Swiss Franc, the Canadian dollar, and Australian and New Zealand dollars, and which has been on a major downward trajectory since march 2020, when the pandemic began to take a hold in the United States.
In this daily bear channel, which has been widening due to volatility, a recent floor was established at 89.00, however, the price action was not able to reach resistance line, which may be seen as weakness and uncertainty, and is hovering with a potential pullback to retest the 89.00 level, which, if breached, could cause a push down to 85.00.
Much of this will depend on the slew of economic data coming out of the United States during the forthcoming week, from durable goods and the all-important federal reserve announcement regarding their interest rate policy decision on Wednesday, and the fourth quarter results of the USA gross domestic product, due to be released on Thursday, which will show whether or not there was a continual expansion in the recovery for the ailing American economy during the last quarter of 2020.
Not least forgetting that banks and institutions will be readjusting their investment portfolios for the end of 2020 and the beginning of 2021, and also trying to factor how the newly elected president Joe Biden and the change in government, with the democrats back in control, will influence the financial markets.
Certainly, the markets will be cautiously awaiting the US economic calendar which as shown is loaded with high-risk events and we may see some subdued price action until fed meeting on Wednesday where many analysts are predicting no change in policy decision.
The largest components of the DXY EUR/USD finishing the week up at 1.2170 which added +0.79% last week,
And the GBP/USD pair which climbed steadily to 1.368 or +0.71%
Therefore, a cautious approach to trading the currency markets this week is a must, as we can expect high volatility and rapid and unexpected changes in in trend direction.
Beginners – How to save a screen template in Metatrader 4
Thank you for joining this Forex Academy educational video.
The Metatrader MT4 platform is one of the most widely used platforms in the world and is fully customisable.
A great feature that is incredibly time-saving is the ability to save screen templates, which can quickly be added to different asset pairs. This extremely versatile platform comes with its own templates, but most people prefer to adjust them to their own preferences, and this quick tutorial will show you how to do that on a step-by-step basis.
Here is a standard MT4 1 hour screen chart for the GBPUSD pair.
Firstly, you will need to open your Navigator section to find a wealth of indicators. This can be accessed by pressing Ctrl+ N on your keyboard.
Then simply drag the indicators you prefer onto your chart, and adjust the parameters and click OK,
Such as here for the Stochastic, which will then populate your chart.
By right-clicking on the chart,
The chart properties will open, and can be able to tweak the parameters to suit.
Such as the colour of the background or the colours of the bars or candlesticks.
When you have finished building your chart, you can save the changes as a template, in which you will need to right-click on your chart, hover over the Template tab, select save the template, when the second box pops up,
Then give your template a name, and save it.
The next time you want to use the template for another pair, just open a new chart, such as the EURUSD pair as shown here, and right-click, highlight Template, then click on load template from the pop-up box,
Then simply highlight your saved template and press Open.
And the new chart will automatically be updated with your saved template, thus saving you time.
The templates file is located on your computer by clicking on the File tab on the top left of the platform, then Open data folder.
And you will find it in the templates file folder, as highlighted here.
The Relative Strength Index (RSI) was created by Welles Wilder as a momentum oscillator that measures price movements’ speed. The RSI is bounded between zero and 100. According to its author, an overbought condition occurs when the RSI is above 70, whereas an oversold condition is the RSI below 30. RSI is one of the most popular indicators because of its simplicity and is included in all charting packages.
How to compute the N-period RSI
1.- go back N bars and compare the Close of that bar with the prior bar’s Close. If positive, add this value to a UP summation variable. If negative, add it to a Dwn summation variable. Do this for every bar in the period.
2.- After all summations have been performed, divide the results by N, the period. This will create an average of up and down changes: avgUp and avgDwn.
3.- The RS is the ratio of avgUP to avgDwn.
RS = avgUP/avgDwn
4.- Finally, the RSI can be calculated by a normalization operation to bounded it between zero and 100:
RSI = 100 – 100/(1-RS)
Spotting market tops and bottoms
Welles Wilder designed the RSI with a standard 14-bar period, so it was meant for short-term asset analysis. This indicator works at its best on mean-reverting market states. According to Mr. Wilder’s research, the RSI usually tops/bottoms ahead of the actual market top/bottom.
The basic form of RSI trading is shown in the RSI flowchart below.
RSI Flowchart
The basic rules of the System are:
if RSI(14-period) is below 30:Buy on Close
If RSI (14-period) is above 70:Sell-short on Close
If position = long:If Close > Entry_Price + 3xATR:Sell the open position on Closeif Close < Entry_Price -1 ATR:Sell the position on Close
If Position= Short:If Close < entry-Price - 3xATR:Buy-to-cover the position on Close.if Close > Entry_Price - 1 ATR:Buy-to-cover the position on Close
And below the code in EasyLanguage, for Tradestation and Multicharts platforms, with input parameters to allow for optimization of the length, overbought/oversold levels, as well as take-profit and stop-loss levels in the form of ATR multiples.
This algorithm works fine as long as it is applied to a non-trending, mean-reverting asset but fails when a trend has been established. Please, bear in mind that the strategy as-is will not work.
An optimized version, tested in the EURUSD pair from 2014 till 2020, showed the following equity curve and values:
Equity Curve
The results are a bit disappointing, as we see. After the optimization, the strategy shows only 52.55% profitable trades with a meager 1.02 reward/risk ratio. The RSI is very close to a coin-toss in performance, meaning the results are mostly due to chance. Furthermore, the average trade of $6.82 before commissions means a trader working using the classic RSI entries is really profiting his broker.
In our next video, we will cover a new way of using the RSI on trending securities.
APPENDIX: The RSI code for Easylanguage
inputs:Price(Close),Length(14),OverSold(30), Overbought(70),takeprofit(3),Stoploss(1);variables:var0(0),over_sold(False),over_bought(False);var0=RSI(Price,Length);{***** ATR buy and sell signals *****} over_sold=Currentbar>1andvar0crossesunderOverSold;ifover_soldthenBuy("RsiLE")nextbaratmarket;over_bought=Currentbar>1andvar0crossesoverOverBought;ifover_boughtthenSellShort("RsiSE")nextbaratmarket;{***** ATR Stop Loss and Take-profit *****} ifmarketposition>0thenbeginsellNextBaratL[1]-Stoploss*averagetruerange(10)Stop;sellNextBaratL[1]+takeprofit*averagetruerange(10)Stop;end;ifmarketposition<0thenbeginbuytocoverNextBaratH[1]+Stoploss*averagetruerange(10)Stop;buytocoverNextBaratH[1]-takeprofit*averagetruerange(10)Stop;end;
Thank you for joining this forex academy educational video.
In this session, we will be looking at the fear of missing out or f o m o. What is it, and how does it affect trading?
The fear of missing out is a psychological aspect of trading any financial asset. In fact, it is so deeply rooted in our psyche that it affects the way humans think about many aspects of our lives, and sometimes it’s so powerful that it blinds us to all reasonable thinking and can end up causing us to make rash decisions, which are ill-thought out, and untimely.
The fear of missing out has been with us for centuries, but it was only in 1996 that a research paper written by a marketing strategist, Dr. Dan Herman, entitled the piece ‘the fear of missing out.’
Although people can deal with the fear of missing out on social events, such as parties, or perhaps a sale where they missed a good bargain, when it encroaches into one’s financial trading ability and adversely affects decision-making, it can then become extremely expensive if not recognised and handled correctly.
A good example of FOMO is the recent bull run on bitcoin, especially bitcoin to the USD, and other crypto assets, with one broker, EToro, reporting 380,000 new accounts opened since the beginning of January 2021, and where much of the exponential growth in bitcoin / US dollar trading can be attributed to retail traders jumping on the bandwagon during the timeframe of this incredible rise in bitcoin value and where this is down to the fear of missing out.
While bitcoin was trading at 42,000 dollars and whereby institutional and professional traders were focusing on technical analysis, where analysis suggested that price was peaking, the fear of missing out traders were still piling in and buying bitcoin on CFD’s and physical exchanges at levels shown here at position A, and where the subsequent tanking to $30K wiped out accounts and where billions were lost to retail FOMO investors who bought close to or at the top of the market.
Traders should always ask themselves if they are making their trading decisions based on sound technical and fundamental analysis, including market sentiment, or are they looking blindly, trading under FOMO pressure, looking to ride a trend wave which may be peaking or bottoming out and about to reverse?
Here is an example of a bull run from September 2020 to January 2021 for cable, which has risen 10,000 pips and where many traders will have been buying at the top of the market because they thought there would be a continuation perhaps to 1.400 or higher, now that the United Kingdom has left the European Union with a free trade deal in place
…and many traders who thought that the EU and UK would never reach an agreement would have sold at the bottom of the bear run, which topped out at 1.3475 and gone short at 1.2700 for fear of missing out on the bear run.
Trends do not have to be in their hundreds or thousands of pips or points before a trader is worried they are missing out and jump onto one. It could be just a dozen or so pips or points. The important thing is to remember that one’s decision-making must be based on strong technical analysis while factoring in market sentiment and fundamental analysis, which may be lagging behind the market move. They should factor in the possibility of price action stalling at any point or consolidating and use relevant stops in order not to blow their accounts on a single trade. And where traders must realise that f o m o has no place in their trading armoury, which must also consist of a trading style which has consistently been providing winning trades.
Dow Jones 30 Industrial index pulls from historic highs. Where next?
Thank you for joining this forex academy educational video.
In this session, we will be looking at the potential directional bias for the United States Dow Jones 30 industrial index, which has recently hit a historic high.
On the 6th of January 2021, the United States capitol riot shocked the world. The United States Congress insurrection was carried out by a mob of Donald Trump’s supporters in an attempt to overturn his defeat of the 2020 presidential election.
While the world’s media focused on the attack of the most advanced political system in the world, which was viewed by billions of people across the globe in utter shock and disbelief, and where 5 souls, including a police officer, lost their lives in the riot, the Dow Jones 30 industrial index, in a somewhat unexpected move, aggressively turned bid, and subsequently went on to reach an all-time record high around the 31,200 level.
The bull run has largely been a continuation of the 18,000 low reversal in March when the pandemic began to bite the US economy and caused the shock collapse from its recent 29,500 record-breaking pre-pandemic high.
Much of the pre-pandemic record-breaking high on us stock indices, including the Dow Jones 30, can be attributed to the Trump administration’s policies of low taxation for corporations and less red tape for them. Indeed, had it not been for the pandemic, President Trump may well have gone down as one of the best presidents ever in terms of revitalising the United States economy, where it also so reached a record number of US citizens in employment.
However, with Trump and the republican party on the way out, and with Biden and democratic about to take office on the 20th of January, 2021, the incredible amounts of money which have been thrown at the US economy to prop it up during the pandemic from the coffers of the United States treasury department, must be repaid, and where president-elect, Joe Biden has made it quite clear, during his campaigning, that he intends to raise corporate taxation in order to find some of the money, and where he will also reverse policies of the previous government, such as low red tape requirements for businesses.
In which case, there is an obvious conflict, whereby one government’s policies caused Dow Jones to be at a record high and where the incoming party is about to reverse the policies which caused the record run, which will likely cause pressure on those businesses, which will have less profit due to higher taxation, in which case the stock market should reverse its winning streak? So why the continued bull run on stocks?
This can largely be put down to positioning. Where hedge funds, banks, investors, and other financial institutions are preparing themselves for a potential future shock by driving stock indices higher before any such new legislation will cause a likely negative impact on stocks.
Quite often, investors will position themselves for future shocks by driving an asset higher, in anticipation of a future correction lower, – or the other way – which on a fundamental economic basis, in this scenario, should be the way forward if such policies of higher taxation were introduced. More tax equals less profit, equals lower dividends for investors, and lower corporate valuation.
We still have a few days to go and until the inauguration, and then there is the Donald Trump impeachment, which may cause a delay in the democratic party’s policy implementation, and, as shown here on the daily chart for the Dow Jones 30 index, it is still in a confirmed bull trend, in which case traders will be looking for breaches of the support and resistance lines as shown here, while eagerly waiting for any new policy changes by the incoming Democratic administration.
One thing is certain, there will be continued volatility in the financial markets as the fallout from the pandemic continues to cause turbulence and where recent data confirms higher unemployment and less consumer spending in the USA, which are more possible reasons for the fall in the index from its recent high, and worries about the change in government and policies.
Biden shows his cards, markets are rattled! – where next for the US Dollar?
Thank you for joining this forex academy educational video.
On Thursday the 14th of January, president-elect Joe Biden addressed the US nation and said that ‘’the $600 already appropriated is simply not enough’’.
He carried on by saying that the new democrat government would issue another round of $1,400, on top of.the $600 payments, thus showing his hand with regard to the 15 million adult dependants relying on these stimulus checks. This segment of the Covid relief package runs to 1.9 trillion dollars.
With yet many more millions of Americans, including migrants, who have slipped the net with regard to relief packages, the wranglers about entitlement will go on as long as the pandemic continues to run rife throughout the United States. With some young adults purchasing new cars with the extra cash, and others boasting of savings of $13,000 from the relief payments, it is hardly surprising that there will be continued frictions between the two parties, let alone the public and pressure groups, which will only go to show that this is not a one-size-fits-all policy.
Markets saw volatility following the comments with the dollar index shown here on the daily time frame, recovering from its low of 89.15, in the dollar-weighted average against the pound, the Euro, the yen, Swiss franc Canadian dollar, and Australian and New Zealand dollars.
Although the rot stopped on the 6th of January, dollar strength has been conforming to this support line, on the 1-hour chart, which was bolstered by Joe Biden’s comments on the 14th , to the point where we have a high of 90.80 at the time of writing.
While the bull run on the US dollar may be partially down to Joe Biden’s covid relief policy, there are other factors to consider, including the buy the rumour sell the fact trading phenomenon, where market participants were largely expecting the incoming President to instigate a larger relief package and especially now that the democrats are in control in Congress, thus making it more easily to be able to get through new policies.
Other things to consider, as shown here on the daily cable chart, where the pound to US Dollar pair remains in a bull run, although it has topped out at the 1.37 exchange rate, having achieved the high due to the success of the UK and EU signing a post Brexit free trade deal, which has been giving the pair a lift, but where the United Kingdom is currently in a tier 4 lockdown due to the increasing covid transmission rate.
Here we can see a daily chart of the euro US dollar pair, which is by volume the largest traded component on a weighted basis of the dollar index, and where we can see CIA Here.
This is a daily chart of the euro US dollar pair, which by weighted volume is the largest component of the US dollar index. Therefore, it is more likely to be a larger contributing factor to the directional bias of the dollar index.
Here we have a classic bull run, followed by a period of consolidation, with a continuation bull run, to a high of 1.23, during the beginning of 2021, and where price action has breached the bull run’s resistance line as highlighted and is falling back to just below 1.21 at the time of writing. This is lending itself to the general strength of the US dollar when simultaneously combined with the actions of cable.
And so, although Joe Biden’s covid relief stimulus package would appear to be a pivotal point in the acceleration in the US dollar strength, there are other things to consider, such as multi-month highs, as shown with cable and the Eurodollar pair.
We also have to factor in the fact that the dollar index failed to breach the 89.00 key level, where the previous high going back to the beginning of the pandemic was 103.00, a hefty grabbing for the dollar, and where traders will always be eying the tops and bottoms of huge moves while looking for turning points.
Traders always expect volatility when there is a change of president, and even more so when there is a change in party, such as in this case where are the outgoing republicans will be replaced by the Democratic party’s polities. The next stage will be waiting to see if the outgoing party’s policies are replaced and, if so, what this might mean for the financial markets.
Thank you for joining this forex academy educational video.
In this session, we will be looking at how to stack the odds in the favour of consistent winning trades with a cool tip for newbie traders.
The number of retail traders who lose all of their deposited trading funds within the first 6 months is scary.
In the United Kingdom, retail brokers are required to have a financial health warning on the front page of their website. This is one that we picked at random from a well-known UK retail broker.
CFD’s are complex instruments and come with a high risk of losing money rapidly due to leverage. 75% of retail investors’ accounts lose money when trading CFDs with this provider. You should consider how CFDs work and whether you can afford to take the high risk of losing your money.
Some brokers put the figure at over 80% but let’s not split hairs. This is still a worrying trend. It must be worrying because governments have forced brokers to put the warning on these sites.
One of the biggest areas that new traders full down is because of a lack of knowledge about how the money markets, and where they lack consistency regarding the setting up and implementation of trades, and most of all; a total disregard for stop losses and their correct implementation and the setup of leverage which falls under risk management, perhaps the most important aspects of trading.
One of the best ways to mitigate the risk of losing trades is to use a trading criteria checklist.
Here are some ideas about what you might put on that checklist. The idea is that it is an assistant to help you in the early days on a trade by trade basis to make sure that you have everything in place to help to stack the odds of winning trades in your favor.
Before you do anything, you want to have adopted a trading style or plan and where you have consistently made money on a demo account before trying it with real money.
Is the market trending?
Does it have support and resistance?
Are all of your indicators confirming your trade entry?
Consider using a scrolling vertical line, which might help you cast your eyes down to all of the indicators rather than just focusing on price action and potentially missing something.
Set a tight stop loss for each trade, and don’t risk blowing your account balance on one single. Trade spread the risk over several trades to give yourself a chance of making more money than you lose.
You should aim for a minimum of a 2 to 1 risk to reward ratio. That is to say, you want to win twice the amount that you are prepared to lose on each trade. This will help to keep your account balance in a healthy state.
Decide your preferred time of day to trade. Try not to trade at the end of a 1-hour time frame if you are an intraday trader. These can often be the impetus or a change in the direction of trends, and you need to ascertain if this is the case on a trade by trade basis. Try not to trade at the end of a one-time zone and the beginning of a new one because, often, you will find the different time zone traders have different sentiment with regard to a particular currency pair, and this may be the impetus for a change in direction.
Don’t tread over economic data releases, especially if these are marked as hi-impact, which can often cause extreme market volatility. Wait until a trend has been identified after the release.
These are just a few ideas which you could put onto your trading criteria checklist. Print one-off and keep it beside you and meticulously go through it every time before you pull the trigger on a trade. Eventually, these things will become like second nature, but until they do treat the checklist like a friendly assistant.
One of the biggest barriers to successful trading in the currency markets is a lack of consistency in one’s approach. Something like this will go a long way to helping new traders to consistently make the right decisions on a trade by trade basis, and this will stack the odds in their favor.
Market volatility continues into 2021, where next for Cable?
Thank you for joining this forex academy educational video.
In this session, we will be taking a look at how the pound is faring against the United States dollar as the UK leaves the European Union to go on its own way as an independent trading nation once again.
In this daily chart for cable, we can see a general trend higher from the 12th of May 2020, which culminated in a peak of 1.3700 at position A, which coincides with a future free trade agreement being announced between the United Kingdom and the European Union, which was generally seen by the market as going to happen, and which fuelled the bull rally as played out on the chart.
The pullback to the current level at 1.3558, at the time of writing, was to be expected, on the basis many traders work on the principle of buy the rumor and sell the fact, in which case we might naturally expect to see some traders exiting their long trades due to profit-taking, and a fear of a collapse due to this common market practice of buying the rumor and selling the fact. But the sell-off has been fairly muted, only flattening out to the current exchange rate.
The real test here will be whether there is a move higher from position B to a retest of the 1.3700 line, which would then likely cause a push above it on towards 1.3800 and beyond, or a move lower towards the support line when longer-term institutional traders will be looking for the support line to breach, or price action to bounce higher and perhaps a retest of the 1.3700 figure from there.
Things to factor in are the extremely high rate of covid infections spreading through the United Kingdom and causing further lockdowns and loss of productivity within the UK, where long-term effects of this on the economy are not good. The markets have been buoyed by the measures put in place by the government to protect businesses and inject money into the system.
We also have to consider a new United States president will be inaugurated in a couple of week’s time, and what effect this has on the United States dollar as he begins to introduce new legislation to raise income tax and increase red tape for businesses as he has pledged to do.
The recent pullback in the pound against the dollar has largely been a result of all of these factors and a slight improvement in US dollar sentiment.
Expect extreme volatility as we move in towards the middle part of January, especially around the time of the inauguration on the 20th of January.
What to expect in the Forex space when Trump leaves office
Thank you for joining this Forex Academy educational video.
In this session, we will be looking at the potential key moves in the forex space with Donald Trump leaves office in a few days’ time.
History will look back at Donald Trump’s presidency, and it looks like historians will likely give him a good kicking.
But, if we hark back 12 months, pre-pandemic, unemployment in the United States was at a record low, the gross domestic product was high, US stock markets were at all-time record highs: The United States economy had never been fitter, thanks to having him at the helm.
Donald Trump’s style of presidency will be seen as abrasive and belligerent. But we have to remember he was not a politician to start with. He was a tough businessman with a no-nonsense attitude, and that’s why people voted for him to become president in the first place. It was a poke in the eye for the political elite in an attempt to bring back wealth for ordinary people. It was his lowering of corporate taxation and red tape and policies to bring back manufacturing to the United States that lifted the US economy to retain its rank as the most powerful nation on the planet.
But, when push came to shove, Donald Trump fell on his own sword because of his mishandling of the coronavirus pandemic. The bottom of his presidential world fell out because he buried his head in the sand and ignored all the warnings about the horrendous covid disease. His lacklustre attitude, and slowness to respond to the crisis, created friction at every point between the democrats and republican parties instead of trying to pull both sides together for the sake of the nation, which did nothing to help while the economy as it faltered with mass unemployment and the sharpest decrease in GDP in US history.
Financial traders won’t miss him; his use of Twitter affected the financial markets without warning, creating huge swings in stock indices, bond yields, and the forex space, only for him to reverse many of his Twitter comments later, creating more mayhem while commenting on highly sensitive foreign and economic policy decisions he planned to implement, while he fed such information into the market with no warning or embargo. Many would say good riddance and be happy to get back to the old style of governance under a lifelong politician, Joe Biden.
Some analysts predict that President Trump will try and upset the apple cart before he leaves office, while the Democrats are threatening to impeach him and have him removed, the timing would suggest this is impossible with just 10 days until he leaves office, at the time of writing. But it is said that fellow republicans are side-lining him with regard to policy decisions and are trying to keep him at arms-length until he has gone.
Throw into the mix US stock markets at record highs, due to what they currently see as the new president having more clout due to the democratic party holding more power in Congress after the recent runoffs in Georgia, to be able to bring in more covid stimulus aid packages and roll out vaccines across the United States.
Certainly, the dollar index – seen here – seems to be trying to fight back to the 91.00 level at the time of writing, having almost hit 88.00 in the last few days at position B, having fallen from its high in march at position A of 103.00. does this mean that the rot has stopped? Possibly not, but with a president on the way out and a new one on the way in, we can certainly expect the unexpected.
This might mean that the Eurodollar pair, which has been riding high, will take a breather, having found resistance at 1.2330, shown here on this daily chart at position A
And with cable failing to reach the key 1.3700 on this daily chart at position A, this might also be a reason why the markets are taking a breather from shorting the US dollar.
In conclusion, expect the unexpected, expect volatility, and expect the fundamentals to take a side-line while the US transition between presidents is over and new policies are implemented by the incoming democratic party.
Trading Algorithms VII – Liberal sequences and exact sequences
Translating ideas into a trading algorithm is not always easy. When examining a particular trade idea, we could find two cases:
the signal can be described precisely in a consecutive sequence of trading facts, or
Several conditions with variable steps among each condition need to be spotted.
The first class is easier to program. To this class belong any kind of crossovers:
price to MA:
MA to MA :
Similar conditions can be created with indicator crossovers and level breakouts.
Trading Signals Using Pivots
But what if the idea is more complex?. Let’s consider we want to catch pivot points in the direction of the trend. Let’s say we want to open a buy trade in the second pivot reversal. Let’s follow Pruitt’s example:
Buy on the second pivot pullback if
1.- The second pivot high is higher than the first pivot
2.- The pullback is larger than 2%
3.- The sequence takes less than 30 bars
The Flag Model
Since these conditions happen with variable price-action sequences programming, this kind of entry is much more difficult if we employ just If-then-else statements. The employment of flags to signal that a specific condition was met helps in the logic but is not the best solution.
As we see, the flag model is awkward and not too flexible. Also, this method is prone to errors.
The Finite State Machine
The second method to this kind of problem is the Finite State Machine (FSM). Basically, we want to detect certain states following others, defining a state when the needed condition is met. An FSM is a machine with finite states. The machine moves from state zero or START through several states until a final one, which defines the ACCEPT state.
We can imagine a state machine as a combination lock. We need to supply the lock with a combination of numbers until its final digit, which triggers its opening.
The first step is to create the states needed. Next, we create the conditions for the change from one state to other states. Once satisfied with the diagram, we can easily write the pseudo-code, or, even, the actual code directly.
As we can see here, the code is precisely subdivided into states, each state with the precise instructions to move to the next state or back to the start state. We can see also that this algorithm is executed from top to bottom on each new bar. We hope that this example will help you better understand how an entry algorithm can be created.
Stay tuned for more interesting videos on trading algos!
Trading Algorithms VI – The Stages of a trading algorithm
In this video, we will discover the different parts needed for a complete trading system.
One of the most common systems involves the crossover of two moving averages, a short- and a long-term SMA. Let’s do a system based on this idea.
Creating a trading algorithm involves at least two stages: the entry logic and the trade management logic, and the position sizing logic.
The Entry Logic
The entry logic sets the rules for entries. The logic can be subdivided into two sections: the entry signal and the Filter or Trade setup.
The entry signal
An entry signal is a moment in time when something happens in the asset. Entries can be MA crossovers, level breakouts, bullish or bearish candlestick formations, and so forth.
The Filter
A filter is a condition imposed for the entry signal to be valid. For instance, you can allow a MA crossover to the long side only if the main trend is up. Then, you can programmatically define the primary trend, and this is the filter. For instance, we could describe an upward direction when the price is higher than the +1 SD line of a Bollinger Band ( in which we set the bands to 1 SD instead of the standard 2SD). We could also say that the upward trend is the price above its 200-period MA, or when there are higher highs and higher lows. A down-trend can be defined using the opposite logic.
On mean-reverting assets, an interesting filter might be overbought/oversold indicators such as RSI, Percent R, or Stochastics curving against the current move, allowing then use of candlestick reversal signals.
We can also add a filter that excludes trades whose projected reward/risk ratio is below one.
As a caveat, the higher the number of conditions, the higher the probability of over-optimizing it. The best designs are those with a few parameters. Also, the higher the number of filters, the less the system will trade. Thus, not always a filter improves a raw signal.
When building your trading system, a sound methodology starts with raw entry signals and a time stop at a determined number of bars. If the entry has an edge, it will be proved by higher than 50% profitable signals after 5-10 bars.
The trade management Logic
Trade management logic takes care of open trades. It is constituted of at least a stop-loss logic and a take-profit logic. It may include other decision steps, such as break-even logic and trail stops.
The Stop-loss
We have already published several articles on stop-losses. There are several ways to set a stop-loss level. We can do it using a multiple of the Average True Range of the asset, using the last swing low (or high in the case of a short-trade), or by statistically optimizing the distance using John Sweeney’s Maximum Adverse Excursion (MAE) concept.
Trail stops are also a recurrent idea in trading, although the developer should test them and assess if they really improve the results. The same is valid for the break-even logic. Both concepts seem logical and mind relieving, but I have yet to find their utility to improve a trading system.
In some trading systems, a time stop can be handy. A time stop closes if the trade is not profitable after a certain period or a specific number of bars.
The Take-profit.
Take profit logic can also be varied, from dollar-based stops to stops based on key levels, supports, and resistances or pivots. A take-profit condition may be set, too, when a signal opposite to the current trade happens, such as an MA crossover against the trade, the price below the -1SD Bollinger line on longs or over +1SD line on short positions.
Take profit code can be added for scaling out the trade, letting a percent of the original position open to ride the wave and improve profits when your trade is right.
Position Sizing logic
The position size logic is a final step that involves setting up the right trade size for the trader’s objectives. This step should be used only in real-time trading, not during the definition, optimization, and evaluation of a new trading system.
During the definition step, a trading system must be used with one trade unit, and its results normalized to its risk, so instead of dollar profits, it should produce a stream of multiples of R, a standard one-dollar risk.
Position sizing logic is key to maximizing the returns of a system and limiting the max drawdown to the levels desired by the trader.
We will further develop these concepts in the coming videos, with specific algorithms demonstrating how to create them properly.
Thank you for joining this forex academy educational video. in this section, we will be looking at the aftermath of the Brexit future trade deal agreement negotiations, which have finally concluded. And what this might mean for the GBPUSD pair.
After 4 years of wrangling over a future trading arrangement between the European Union and the United Kingdom, which left EU membership back in June 2016, by way of a national referendum, a free trade deal has been agreed between the UK and EU on Christmas Eve 2020.
The markets will be grateful for a breather in the now finalised divorce, which has finally been settled after years of; will they, or won’t they get a future treading deal completed in time before the UK was forced to end the transition period on wt20 trading regulations, which was seen as potentially very bad for the British economy. As many had predicted, the negotiations went down to the wire, and an agreement was set in place with hardly any time to spare.
The referendum, which took place on the 23rd of June 2016, and where the British people voted to leave the EU, caused the pound against the dollar to crash from 1.47 to a low of 1.21 during the following year, as the markets tried to decipher how this may play out for the British economy.
The pear rallied up to 1.42 in April 2018 as hopes were raised of a negotiated trade free trade deal, which was dashed.
And we had the crash to 1.16 in march 2020 as the pandemic gripped the United Kingdom.
The pair has been rallying up to its current position at 1.36 – at the time of writing – based on the market anticipation that a free trade agreement would be reached. This extremely bumpy road has been smoothed by the free trade agreement, but what now for the British economy and the pound, as it finally goes its own way as an independent nation?
There is no doubt that the bulls are in control of the pair at the moment, and some institutional traders will be looking for the previous highs, as shown here on the chart of 1.42 and 1.47.
However, things to consider are that the free trade agreement only takes up 20% of the British economy, with the remaining 80% of the gross domestic product being attributed to financial services, which does not form part of the agreement, and which still has to be negotiated between the EU and UK. It is unlikely that issues in this sector will cause a major upset; however, there is potential for a spanner in the works should the two sides diverge from current alignments in trading standards.
The other critical component, which will affect the pound, is the United States dollar currency index, or DXY, which measures the dollar against the most commonly traded currencies known as the majors and which includes the British pound and Euro.
The dollar index has fallen from a high of 103.00 in march 2020 to its current level at just under 90.00 at the time of writing, as the federal reserve and United States’ government implement stimulus measures by pumping more and more dollars into the system to shore up the failing US economy, which is still in the grips of the pandemic.
While traders wonder if Cable has run out of steam at 1.36, traders will also be wondering if there is further room for a continued slide in the dollar index, perhaps down to 88.00 in the short term, as the market opens to a new year and a first new quarter, with institutions and investors adjusting their portfolios for the new financial year ahead.
On a market sentiment basis, a fundamental basis, and on a technical analysis basis, it would appear that there is scope for a push higher in Cable to reach some of the previous levels mentioned at 1.42 and 1.47, especially while the US dollar index is generally under pressure.
Thank you for joining this oryx academy educational video.
In this session, we will be looking at where next for the euro US dollar pair as the new year unfolds.
The pair’s bull run in February and March 2020 lifted it to 1.1400 and was driven by the pandemic beginning to take hold in the United States and weakening the dollar. However, as conditions worsened in Europe, the pair swung back in the other direction, to a low of 1.0700 in the market mayhem and volatility, which ensued as traders tried to decipher which economy was faring better than the other.
But as the US dollar index, a weighted indicator of the strength of the dollar against the so-called major currency pairs, including the euro, began to sink……
The Euro, which by volume is the largest traded major currency, moved higher to its current level of 1.22 at the time of writing.
The reasons are largely twofold; firstly, the European Central Bank took measures to shore up the economies within the eurozone, which were seen to be sensible under the circumstances, and where are the pandemic seemed to be taking a breather in the eurozone area while still growing exponentially within the United States, causing harm to the American economy, and where it was perceived that perhaps the United States government were not being as cautious and sensible as the Europeans with regard to instigating lockdown measures including the wearing of masks and social distancing, and where their policies of stimulus, needed to shore up the US economy against the pandemic caused more dollars to be pumped into the system and thus affecting its value negatively.
Traders will be eyeing the 2018 high at 1.2469, as their next target, with the New year opening and traders looking to adopt longer view trading positions for the first quarter of 2021.
Potential for the continued upside momentum will be buoyed by the fact that the European Union will be rolling out vaccines to the population and where a free trade deal between the EU and UK was agreed on the 24th of December 2020, which will help give a lift to the euro because the worry of a negative economic impact of the UK leaving on WTO trading rules will have now abated.
Traders will also factor in that the relentless slide of the US dollar index below the key 90.00 level could cause further downside potential to 88.00 and even lower, again causing markets to buy Euros against the dollar.
Upcoming US political event could spell trouble for the Dow Jones Industrial Average Index
Thank you for joining this forex academy educational video.
On January the 5th, the Georgia runoff elections for the United States Senate could prove to be a turbulent affair for US stocks and, in particular, the Dow Jones industrial 30 average.
The Dow Jones industrial average index has had quite an incredible year from it’s high, shown here, of 29,500 in February to its crash of 18,500 during the initial wave of the pandemic to hit the USA in March, and on to a record-breaking high of 30,600 at the time of writing. Most of the move higher can be attributed to the amount of stimulus which has been put into the US economy and where those dollars are finding their way into the stock market, and where investors are looking beyond the pandemic, where vaccines will help get the US economy back pre-pandemic levels of growth. This is also somewhat buoyed by the federal reserve’s stance on lower interest rates for longer, which also serves to inflate stock markets because corporations can access low-interest rate loans.
The Georgia runoffs are essentially on a knife-edge because they hold the potential to swing the balance of power in the 100 member US senate between the radical difference democrats and republicans. The November election left the republicans holding 50 senate seats and the democrats controlling 48. Only the two remaining seats in Georgia are undecided, and if Joe Biden’s party wins these seats, the balance of power will tilt towards the democrats.
While the US stock markets have largely ignored political events since the pandemic began, the upcoming Georgia elections cannot be ignored for the following reason: Joe Biden has promised to reverse corporate tax cuts, which were introduced by the Trump administration in 2017. This puts company earnings at risk. And while the old style of earnings to share price ratio has largely been ignored by stock market investors during what can only be described as a shift in fundamental analysis concerning how the markets perceive corporate valuations, should Joe Biden win control of both chambers of Congress, he would be in a position to reverse these tax cuts and send a shudder through wall Street.
Investors will be looking to reposition their portfolios in January, as the new year and first quarter got underway, and there are lots of new data to take into consideration, including the ISM manufacturing and services for December, and weekly jobless benefit claims, to consider, plus the November trade deficit and of course the unemployment report for December, which all come out in the first week of January, with the possibility of causing turbulence in US stock markets.
With this political uncertainty and the fact that the Dow Jones is at an all-time historic high, it lends itself nicely for a pullback, at least until the above are all factored into the market.
Thank you for joining this forex academy educational video.
In this session, we will be looking at the question of what can slow down forex trading momentum.
The forex market reportedly turns over more than 5 trillion dollars every trading day. It is the most liquid business on the planet. And it keeps growing, with the retail side of the business maintaining steady growth, with extra brokerages opening up, and more and more ordinary people trading online from home. The growth of the educational side of the market is also helping to attract would-be traders with promises of unknown secrets being opened up to them and quick riches to be made trading Forex.
While these topics are great material for another video, today we need to get back to the point of forex trading momentum, where one moment the market is absolutely flying about with lots of liquidity and volatility, with huge swings on price action, and exchange rates moving over 100 to 200 pips in a session and then suddenly stopping almost in its tracks and flattening out during periods of consolidation. So, what causes this?
There are several reasons. But first of all, let’s take a look at the biggest reason. Here is a timetable of the trading centres where Forex trading goes on 24-hours a day, 5 days a week.
The time zones are based on Greenwich mean time in this example, and we can see that London, including Frankfurt, begins its trading day around 7 AM in the morning, New York follows from 12 noon, Sydney joins the markets shortly after 9 p.m., with Tokyo joining the market at about 11 PM.
As with many other businesses, typically, you will find a surge of activity when people begin their day’s work. The forex market is no different. Traders start work at the desks and need to make money as quickly as possible because that’s what they get paid to do and because they will have orders from paying clients that need entering into the market for varying reasons, including hedging, closing out winning trades from overnight or longer time frames, closing out losing trades from overnight or longer timeframes or simply fresh speculative orders to be executed. They also need to manage or correct positions where they may have gone home in the evening, and the later session pushed particular trades in an unexpected trend. Plus, they will need to try and make money with their own bank’s trades.
And just like most people, energy levels tend to fade off after a couple of hours from starting work, and people need a break. And that is why shortly after the beginning of the London and European session and the Sydney and Tokyo sessions, we begin to see lulls in the market after a couple of hours of trading. This also happens during the latter stages of the US session.
However, this does not include the morning of the New York session, and the key reason is there will likely be economic data releases from the United States during their morning, where the US dollar, being the most widely traded currency, has a greater propensity to affect market direction after the release of economic data than any other release.
And so, another reason for lulls in market activity can be attributed to traders waiting for key market economic data to be released, and where the higher the likely impact of the data, the more likelihood of caution before the data release, which can cause flattening in exchange rates, while traders anticipate the release.
Another major reason for quiet times is the ending of the New York session and the beginning of the Asian session and where it is not unusual for the five areas to have varying views about where are forex exchange rates should be, which adds to the ebb and flow of the foreign exchange market and where typically as well as the slow down which is reflected on charts by periods of consolidation, we can often see price reversals and trend changes in trend direction at the end of one session and a beginning of another.
Thank you for joining this Forex Academy educational video.
In this session, we will be looking at one of the oldest adages in trading: sell at the top and buy at the bottom. And how can this be implemented in your trading for maximum results?
20 years ago, financial markets, including foreign exchange, were driven by fundamental analysis over technical analysis. That is to say that professional traders and analysts would base their trading around fundamental economic data, including policy-making decisions, interest rates, GDP, inflation, and political events, including wars. Technical analysis was in its infancy. In these times, it was much easier to predict where the bottoms and tops of assets were likely to be based on fundamental reasons alone.
Today, things have completely flipped to the opposite side. Technical analysis is heavily dependent upon where chart patterns dominate price movement and where fundamental reasons for trading often lag behind technical and sometimes seem to defy logic.
You only have to take a look at the Dow Jones 30 industrial average index, which is at an all-time record-breaking high of over 30,000 while the US economy is still struggling because the pandemic still has it in its grips. Fundamental analysis has gone out of the window on the basis that technical analysis is fuelling the US stock market to the upside, where hopes of a vaccine roll-out outweigh the fact that hospitals are currently at extremely high levels for covid patients, and where a new bleak record was passed this week of over 3000 deaths in a single day in the United States. Similar circumstances, albeit non-pandemic related, perhaps more to do with an overpriced stock market fuelled by the success of the 1920s where share trading on margin was rife probably caused the famous 1929 US stock market crash, which took years to recover from.
Currently, the US market is also buoyed by hopes of extra stimulus by the federal governments and where this money is finding its way into the stock market. Even so, the market is overbought, does not comply with earnings per share, and yet is still relentlessly bid.
Even so, where is the top? It is difficult to say in this hyped market, which is pulling back from every attempt to short it.
If the market reaction is so extreme and fundamental analysis is second to technical analysis, traders have to be on their guard and look for several signs that the market is topping or bottoming out to find a good entry point to trade in either direction.
In this daily chart of the GBPUSD pair, we can see a huge push lower at position A during the middle of March 2020, where Britain began to fall into the grip of the coronavirus, which plunged the exchange rate to 1.1400. Buyers were looking for an opportunity to go long because this was seen as the bottom of the bear move.
We have a high in September at position B, where there is a spike outside of the Bollinger band, where the candlestick is an upturned bearish hammer, and where the subsequent candlesticks are bearish, providing the trader with the knowledge that this is potentially a top at 1.3485. A subsequent high at position C, with a bearish hammer spiking out of the bands, provides chartists with a potential top at 1.3535.
Incorporating these simple chart lines at positions, A B, and C helps us visualize trend reversals. Once we have one or two candlesticks on the daily chart confirming that there is indeed a trend reversal in progress, we can drill down into lower time frames, as intraday traders, to look for opportunities to go short or long. We must never ignore fundamental reasons for taking a trade on. However, based on what has been set out today, we must conclude that fundamental analysis often lags behind technical analysis and therefore, by looking at swings in price action forming tops and bottoms outside of periods of consolidation, traders give themselves a better edge while stacking the odds in their favor and trading in line with institutional size traders who typically trade in this manner.
In conclusion, we are in an age where fundamental analysis often has no bearing on an asset price and where technical analysis and fundamental analysis are often out of kilter, but where eventually with two will catch up with each other.
Traders best opportunities of bagging more pips must be centered around reversals in price action based on longer time-frames such as daily charts, before drilling down into lower time frames such as an hourly chart and trade in the direction of the daily chart trend, to stack the odds in their favor of a successful trades, while never forgetting the importance of the fundamental reasons why a currency pair exchange rate might potentially be changing direction.
US stock market: Are investors walking into a trap?
Thank you for joining this forex academy educational video.
In this session, we will be looking at US stock markets, which have rocketed to historic highs, even though the United States economy is in the grip of the Coronavirus.
On Friday the 4th December, just post the non-farm payroll numbers, the S&P 500 index reached an all-time record high…
….this was also the case for the DOW Jones 30 industrial average…….
….the NASDAQ Composite index followed suit …….
….and so did the Barons 400 index
For all of these indices to simultaneously hit fresh all-time record highs is a very rare occurrence. It shows that investor sentiment is extremely high, potentially buoyed by a forthcoming and greatly anticipated next round for the Covid stimulus bill, if and when the democrats and republicans can reach an agreement on the size, currently estimated at $900 billion. The markets are also confident that the federal reserve is doing a good job in propping up the ailing American economy and sticking to a policy of low-interest rates for at least the next 2 years, which has typically corresponded with higher investment in stocks and shares, historically speaking.
Investors will look at the fed’s response to the crisis as a kind of insurance policy, that behind the scenes, the federal reserve will not allow the stock market to crash.
However, analysts who follow the Buffett indicator, which is the original measure for US market capitalisation, point out that since 1947 earnings per share have grown at around 6.21% annually, while the economy has expanded by 6.47% annually. This premise that the market capitalisation ratio to gross domestic product is based on the economy driven roughly 70% by consumption, where individuals must earn in order to buy products. And that consumption is where corporations earn their revenues, and ultimately this is where their profits come from.
The Buffett indicator shows that the mean average of around 0.7 has been closely adhered to since the 1950s, and the last time it broke away to the upside was in 1999, when speculators were investing heavily in Dot-Com companies, and where this led to the market crash in March 2000, and where we see that around this time the indicator pulls back to the mean average. Analysts at Deutsche Bank also point out that the recent run in US stocks has taken the market shift above the ratio of price to earnings above the level seen just before the 1929 stock market crash.
And here we see that the currents levels on the indicator are again highly inflated to a record high on the graph above the mean average at around 1.7.
…….
……and coincides with being above 2 standard deviations of the average range, which is an extremely rare occurrence.
And yet with the American economy still suffering from the pandemic, American corporations profit ratios are not reflective of consumer consumption, rather this time we have the Federal Reserve and US government stimulation packages which are churning out dollars into the market, and where investors are using much of those funds to push up the level of stocks due to FOMO, or fear of missing out. and where are the traditional corporate valuation matrix simply do not apply to certain stocks anymore.
Fear of a recurrence of the dot-com bubble correction, where investors ignored earnings per share valuations – many of these Dot-com firms were not making any profit at all – is another reason why we might potentially be looking at the top for stocks. Also, a fairly simple one; many of the favourites for investors, such as Amazon, Apple, and Tesla, for example, are not cheap anymore. This means that investors will be looking at cheaper stocks with growth potential, while others which are too expensive and are seen as potentially overbought. And in an economy which may not see growth return to any kind of normality for years, it adds weight to the thorny issue that the Dow Jones 30 industrial average – home to the top 30 most expensive stocks in the USA – and which is considered as a benchmark of the health of the US economy, may find buyers to be thin on the ground now, in which case a correction could be not too far away, based on everything set out in our assessment today.
Thank you for joining this forex academy educational video.
In this session, we will be asking the question, are there forex trading secrets? And hopefully coming up with some answers.
The internet is awash with firms, including brokers and educational platforms, offering to teach new traders the secrets of trading forex. Such as ‘’9 secrets to successful forex trading’’ or ‘’seven-day trading secrets exposed’’ or something along the lines of ‘’the five major secrets to apply to make a killing in forex trading.’’
Some Forex educational platforms and Forex brokers will use any gimmick they can to get new traders on board to service the revolving door of new traders coming in, blowing their accounts – where statistics show that will over 75% of new traders lose their money in the first 6 months of trading – while enticing new traders in to maintain their client numbers and keep their businesses afloat.
And so back to the question, are there any secrets in forex trading? Absolutely not! This is not the Knights Templar, nor the Freemasons, or a secret society. And it is most certainly not a get rich quick scheme as some people would have you believe.
In reality, Forex is a business – the largest business on the planet – which turns over trillions of dollars 24/5. It is complex: the financial markets are interwoven with each other, where a forex exchange rate trend can turn in an instant, with no apparent reason, other than sentiment.
It is heavily correlated with fundamental reasons and political ones, where a rumour from a tweet, or a speech by a policymaker, can cause severe volatility in the markets. Where trends can change because of a certain time of day, where perhaps one country stops trading for the day and another begins.
If the market isn’t changing because of fundamental reasons, it is constantly changing because of technical ones. That’s chart patterns. Technical analysis, or the study of chart patterns, including exchange rate price action, and the implementation of technical analysis tools and indicators is pretty much the backbone of forex trading, with the upmost single important thing being where the price is at any given time, and which is also known as price action. This, on its own, is of paramount importance because it shows who’s in control of a forex pair, whether it’s the bulls or bears, or whether the market is simply consolidating and no one is effectively driving the market in any particular direction other than sideways.
If somebody offers to sell you the secret to fixing your car engine troubles, you would probably laugh and take your car to a garage. If they offered you the secret to remove your painful appendix, you would cry in horror and run off to see your doctor. Forex trading is a profession not a secret ridden gimmick. The best traders learn about fundamental analysis, technical analysis, market sentiment, market correlation, how currency pairs move and why trends are developing, and when and why they stop and reverse. And this is the real key to making money while trading Forex: knowledge. The more you learn, the more you will earn.
So, in conclusion, don’t be seduced by offers of learning secrets, when here at Forex Academy our professional traders, some ex institutional, offer a totally free educational, informative service, with its reliable signal service, supported by a broker – EagleFX – which doesn’t need gimmicks, with the idea being that if traders make money on a reliable platform, where education is absolutely free, then everyone is a winner.
Trading Algorithms – The Elements of a Computer Language – Part III: Objects
The most striking feature of modern programming is object-oriented programming. This video will explain the underlying philosophy and why OOP is such a big deal in modern app development.
Procedural programming versus OOP
Traditional programming is based on procedures or functions applied to a pre-defined collection of data structures. The main procedure starts moving and modifying variables and structures to obtain an output to print or display on a screen.
The main drawback is that most of the primary data is globally allocated and potentially modified by other application sections. Thus a change to improve or correct one section of the code may interact with other sections, potentially creating hard to detect new bugs. The maintenance of large projects based on procedural programming is a nightmare, especially when a different programmer has to do it.
Object-oriented programming, on the other hand, uses objects with their own inner data structures. So, code mods happen within a single self-contained object, and any new bug is limited to that object.
Classes
The basic unit on Object-Oriented Programming is the Class. A Class is the description of an Object. Then, several objects are to be created using that Class description, called “instances” of the Class.
Simply put, a Class is a collection of data structures and the procedures or functions allowed for these data structures. Classes provide data and function together.
In our real-life, we are surrounded by objects with shape and functionality, such as cars, TVs, houses, and pants. All have their intrinsic properties. A vehicle has an engine, four wheels, battery, throttle, brakes, steering wheel, doors, seats, and so forth, and all these parts are also objects. But not all cars are equal; brand, color, engine power, seat materials, etc., change. That also happens with computer objects.
A new class can be created from a parent class, with new functionality, or with changing functionality from the parent class in a process called “inheritance.”
An example of a class
The Bag class is just a container for other objects. We can add or take out items to and from the Bag. The main data storage is in the self.data variable. But, bear in mind that self.data is different for every new Bag object created!. We can see that the data structure of the Bag object cannot be accessed but with the supplied methods, add, sub, and show.
A Python financial class
A financial class can be made of around a historical OHLC data structure. Using it, we can create new information such as indicators and various stats, such as swing high/low length and duration statistics, and other information related to price analysis and forecasting.
You can see an example of what a pro-built class can do by looking at the stock-pandas class package documentation. We can see that the stock-pandas project is solely focused on the creation of a class to handle statistics and indicators for a financial data series, presenting a complete package.
As we can see, the advantages of OOP are huge. Packages can be built, which, later, can easily be versioned, updated, and expanded. The creation of apps using classes and OOP is much more straightforward, so the time needed to complete a project is shortened drastically.
Now that we have reviewed the basics of modern programming, let’s move back to trading algorithms.
Trading Algorithms – The Elements of a Computer Language – Part II
A computer program is a combination of data structures and a set of instructions or commands in the form of functions that process the data structures to construct a solution or solutions.
Control flow tools
To efficiently process information, a high-level programming language owns specific instructions to do mathematical operations, check for conditions, and control data flow.
The if Statement:
The if statement is the most basic flow-control instruction. It allows us to check for conditions or the validity of a statement.
for example,
if x > 0 checks for the variable x being higher than zero. If it is zero or negative, it will deliver a False value. If over zero, it will provide a True condition.
The if statement, combined with the else statement, handles the flow of the information. If/else is mostly similar in all languages. ( Example taken from docs.python.org
Iterators
Iterators are used to move through the components or a data structure, such as lists or arrays. There are several ways to iterate, some language-specific, but most are present in all languages.
The for statement
The for statement is used to do an orderly iteration on an array or list. In C++, it has the following structure:
for (initialization; condition; increase) . Initialization is the starting point; condition defines the endpoint, and increase sets the step.
Python’s for is more versatile and simple. To loop through a list is straightforward (taken from docs.python.org):
But we can use the range() function to do a similar C++ for (taken from docs.python.org):
The While statement
The while statement creates a computer loop that is exited only after a certain condition is met:
For example, the above while loop appends the Fibonacci numbers up to n, storing them in the fibo list. The loop breaks only when a is bigger than n.
Function definition
In a computer app, the code repeats itself most of the time, sometimes the values may be different, but the basic computational structure is the same. To organize these computational structures, all computer languages have functions.
In C++ a funtion is defined with the following structure:
<out type> function name (<type> parameter1, …. <type> parameter n){
body
}
The out type is the output type of the function. It can be an integer, a floating-point, or any other data structure, pointer, or no output at all.
The parameters are inputs to the function but can be used to modify an external structure as well.
In Python, the definition is simpler.
def function_name ( parameter1…parameter n):
body
If the function returns a value or data structure, it is delivered through a return statement.
The following example shows the fib function, which computes the Fibonacci numbers up to the input parameter. The results of the Fibonacci computations are stored in the fibo list, which, after exiting the while loop, is returned. The variable res is assigned the output of the fib function and printed. Please note that the last two statements are not part of the fib function.
The last introductory article on high-level languages will talk about classes, objects, and object-oriented programming.
Once we have completed this basic wrap-up on programming language features, we’ll start studying trading-focused algorithms in the coming videos.
Thank you for joining this forex academy educational video.
In this session we will be looking at us stock indices, and trying to reason why they are at record highs when the US economy is faltering due to the ongoing coronavirus pandemic.
This is a chart of the S&P 500 index which measures the stock performance of 500 of the largest companies listed on the United States stock exchanges it is a commonly follow equity index.
On Friday the 4th of December 2020 the index rose to an all-time record high currently sitting at 3699. Remarkable considering the unit United States is still in the grip of the coronavirus pandemic and where hospitals are currently overrun with victims of the disease across the United States, and especially New York and California, where ICU capacity is down to just 15%, and where the governor of California has recently said he expects large areas of the state of California to be locked down within the next few days affecting businesses and individuals’ livelihoods.
In an almost identical trajectory since march the Dow Jones industrial average index has also reached record highs and is holding ground above the key 30,000 level. This is simply staggering bearing in mind millions of people are still unemployed and gross domestic product and have a key indicators show that the American economy is not showing a V-shaped recovery, as was expected and hoped for by the federal reserve.
The NASDAQ Composite index and Barrons 400 also simultaneously hit all time highs. A rare occurrence.
Conversely the US dollar index, or DXY, which is a weighted index against major currencies including the euro, British pound, and yen, over the same period since the middle of march 2020 has been falling from its peak of 103.00, to 90.7 at the time of writing.
Traders have been using the dollar index as any inversely correlated technical analysis tool in particular when trading the Dow Jones 30 industrial average.
One of the reasons for this is that as the federal reserve pour billions of dollars into the system many of these are being used by institutions, traders, speculators and investors to buy stocks and shares in the hope that the US economy will quickly recover once the pandemic is under control within the United States and things revert to normal, and where history tells us that many stock indices go on to recover over 10% of their market value following previous pandemics, including Sars, and asian bird flu.
It was no coincidence that these levels were reached after the November us non farm payroll where the unemployment rate fell to 6.7% from 6.9% and where 245,000 jobs were added, and although just year ago these types of numbers would have been seen as fantastic for the American economy, the November key jobs report, where analyst expectations were for over 600,000 jobs to have been added, was seen as disappointing.
And so while the US economy looks to be stalling and payroll numbers are weak and yet there is such optimism by investors which is keeping the US stock market buoyant. So what is going on what is really behind this? Certainly, the US dollar seems to be reflective of the poor state of affairs with the United States economy. And as previously alluded to, some of these dollars are finding their way back into the stock market, even though some major American corporations are lagging. The news that the covid vaccine will soon be rolled out across the globe has encouraged investors, but the truth may be that the market is expecting that the woeful economic data will simply force congress to quickly pass a stimulus bill before the Christmas break, and this would effectively prop up the American economy providing a much-needed lifeline for workers and businesses and where some of the anticipated $900 billion being talked about as a potential amount which could be agreed by both the democrats and republicans would likely maintain the buoyancy in the stock markets. The flip side of the stimulus is that on a supply and demand basis the influx of dollars will likely weigh on the dollar index providing counter currencies such as the Euro, Canadian dollar and the Australian and New Zealand dollars a lift.
Thank you for joining this Forex Academy educational video.
In this session, we will be looking at how to reduce your risk in a counter-trend set up.
Trading against the trend is inherently risky. However, as your experience grows as a trader, you will likely start seeing opportunities where trends run out of steam and look right for a reversal. These kinds of trades can often be extremely profitable if the timing is right.
Of course, trading any financial asset, but specifically foreign exchange, is almost impossible to correctly find entries and exits which are down to the pip perfect, i.e., identifying an entry or exit of a particular move within a single pip.
This is where it is important to adopt a variable approach to leverage. Quite often, new traders will simply execute the same amount of leverage per trade, no matter what the circumstances. So any particular trade, they might open with half a standard lot, or even a full lot, no matter whether they are trading after an economic data release, which might be low impact or a high-impact release such as non-farm payrolls, they keep their trade size the same no matter what, and this can be particularly dangerous and it is a poor aspect of money management. A variable approach is another string to the bow of becoming a more rounded trader.
The majority of the price action as shown during position A in this section from the 24th of November to the 3rd of December has largely been a sideways move while traders wait for the outcome of the Brexit future trade negotiations with the EU.
Although there was a spike outside of the range at position B, price action reverted back within the original range on the 2nd of December.
There is then a bounce off of the support line and a 200 pip bull run, which breaches the resistance line, and takes price action all the way up to within a pip of the key 1.3500 level.
This is a good opportunity for profit-taking for many traders and a potential double top reversal …….
…from this daily chart of the pair with which was a multi-month as shown during August 2020.
Under these circumstances, we believe there may be a reversal in price action, and we had decided to trade against the trend, believing that it will reverse at this point. And we initiate a short trade, with reduced leverage than perhaps we might normally use because we are trading against the trend, and then we will layer the trade with market executions or sell limit orders just above our first trade, dependant on risk, and because we cannot predict where the reversal will happen, if at all.
Had this been a real trade, at least two of the orders would have been filled, including the at market order and where there was a reversal of 89 pips, which is a healthy profit.
In this particular instance, we have taken advantage of uncertainty in the market with regard to Brexit, a multi month high, double top scenario, and a key round number 1.3500. We have reduced our leverage because of uncertainty and the fact that it was a counter-trend reversal trade, which can be inherently risky. But we have diluted that risk by lowering our leverage and layering the trades over varying exchange rates in close proximity to the key level of 1.3500. Stop losses should be implemented as per your personal risk appetite.
This style can also be implemented for long trades with similar principles, and the reduced leverage and layering style can be adopted in any trade scenario.
For beginners – How to trade the EURGBP with no trade deal Brexit
Thank you for joining this forex academy educational video.
Great Britain voted in a national referendum to leave the European Union June 2016. The United Kingdom officially left the EU you in January 2020 with a one-year transition period which ends on the 31st of December 2020.
This was to allow the EU and the United Kingdom four years to come up with a future trading solution with regard to laws and arrangements which would allow the United Kingdom to take back its sovereignty, which is what the people of Great Britain wanted.
However, unravelling the years of business ties between the two areas, including laws, fishing rights, humanitarian issues, worker’s rights, competitive fairness, financial regulatory alignment, including a whole myriad of rules and regulations has been one of the most complicated issues in modern times. The affair is turning into an acrimonious divorcAfter the transition period, theThe two sides agreed thod they would work towards having a free trade agreem,ent which would lead to an almost seamless continuation of business.
But the United Kingdom claims that many of the terms and conditions as set out by the European Union in order to grant a free trade agreement to the United Kingdom are seen as not acceptable to the British government. Some of these conditions are centred around fishing, where the EU wants to continue fishing in British sovereign waters, a so-called level playing field, where the United Kingdom cannot go out and sign up other trade agreements around the world by undercutting EU member states. And where the EU has said that any breach by the UK of such a future agreement, or where the EU changes regulations, and the UK does not fall into line, would be penalised by tariffs and which the UK has said this is totally unacceptable. Ten deadlines have come and passed between the two sides regarding reaching an agreement, and where currently, at the time of writing, there are just a few days left to instigate and agreement, and where both sides are saying this is now very unlikely to happen.
This is a daily chart of the euro to Great British pound pair ,or EURGBP, and where we can clearly by the blue candlesticks that since the latter part of November 2020, the Euro is gaining in value on the exchange rate.
Investors believe that the sentiment has changed in the latter stages of November and certainly since the 7th of December, and where they believe that in the current state there will likely be no deal and therefore because the European Union is economy is much greater than that of the United Kingdom that the Euro will fare better than the pound in the event of a no tariff-free arrangement being reached.
In in the same chart we have highlighted a section A, where the pound was gaining against the euro since August, because the market considered that an agreement would be reached.
So how can investors get in on the action and ride the pair hire based on current sentiment?
Firstly, we need to bring the chart down to a smaller time frame, such as the one hour. Here we can see a defined bull channel, with areas of support at two points and areas of resistance at two points as show by the exchange rate touching the two purple lines, and where we might consider going long at a pull-back to the support line, perhaps somewhere around the X mark.
By reverting back to our daily chart we can see some potential targets, or areas of resistance, the closest is 0.9294 which was reached in September 2020 and way back in the middle of March this year, where we have a target/resistance level of 0.9500.
Of course the exchange rate might be a little different by the time you get to view this video, however, should there be a no tariff deal agreement and where the United Kingdom crashes out of the EU on world trade organisation rules, where tariffs will be imposed by either side, but most likely to be more detrimental to the UK than the EU, you should then be looking for setups such as we have shown today to buy the pair.
Trading Algorithms – The Elements of a Computer Language – Part I
A computer language is a formal language to convert our ideas into a language understandable by a computer. Along with computing history, languages have evolved from plain ones and zeroes to assembly language and up to the high-level languages we have today.
Assembly language
Assembly language is a direct link to the computer’s CPU. Every assembly instruction of the instruction set is linked to a specific instruction code to the CPU.
Fig 1. The basic structure of an X86 CPU. Source cs.lmu.edu
The CPU characteristics are reflected in the instruction set. For instance, an X86 CPU has eight floating-point 80-bit registers, sixteen 64-bit registers, and six 16-bit registers. Registers are ultrafast memories for the CPU use. Thus every register has assembly instructions to load, add, subtract, and move values using them.
A computer program developed in assembly language is highly efficient, but it is a nightmare for the developer when the project is large. Therefore, high-level languages have been created for the benefit of computer scientists.
The Elements of a high-level language
A modern computer language is a combination of efficient high-level data structures, elegant and easy-to-understand syntax, and an extensive library of functions to allow fast application development.
Numbers
A computer application usually receives inputs in the form of numbers. These come in two styles: integer and floating-point. Usually, they are linked to a name called “variable.” That name is used so that we can use different names for the many sources of information. For instance, a bar of market data is composed of Open, High, Low, and Close. We could assign each category the corresponding name in our program.
Integers correspond to a mathematical integer. An integer does not hold decimals. For instance, an integer division of 3/2 is 1. integers are usually used as counters or pointers to larger objects, such as lists or arrays.
A floating-point number is allowed to have decimals. Thus a 3/2 division is equal to 1.5. All OHLC market data comes in floating-point format.
Strings
A string is a data type to store written information made of characters. Strings are used as labels and to present information in a human-understandable form. Recently, strings are used as input in sentiment-analysis functions. Sentiment analysis
Boolean
Boolean types represent true/false values. A true or false value is the result of a question or “if” statement. It can also be assigned directly to a variable, such as in
buyCondition = EURUSD.Close[0] > 1.151
In this case, buyCondition is False for EURUSD closes below 1.151, and is True when the close value is higher than 1.151.
Lists
We usually do not deal with a single number. If we want to compute a 20-period moving average of the USDJPY pair’s Close, we would need its last 20 closes. To store these values, the language uses lists (or arrays in C++). A list is an ordered collection of values or other types of information, such as strings.
Since Lists are ordered, we can refer to a particular element in the list using an index. For instance, if we were to retrieve the candlestick Close two bars ago of the USDJPY, we would ask for USDJPY.Close[2]
Sets
A Set is an unordered collection of elements. Sets do not allow duplication of elements. That means it eliminates duplicate entries. Not all languages have built-in Sets, although it can be made through programming if needed.
Dictionaries
Dictionaries are a useful data type that maps a key to a value. For instance, in Python
tel = {‘Joe’: 554 098 111, ‘Jane’: 660 413 901}
is a telephone structure. To retrieve Joe’s phone, we would write:
mytel = tel[‘Joe’]
with mytel holding 554 098 111
As with sets, not all high-level languages have built-in dictionaries, but a savvy programmer is able to create one.
In the next video of this series, we will explain the elements for flow control.
As we have already said, computers are dumb. We need to explain to them everything. Moreover, digital computers are binary. They only understand ones and zeroes. Nothing else.
Compilers and interpreters
To make our lives easier, we have created interpreters and compilers, able to translate our ideas into binary. Basically, both do the same job. Compilers produce a binary file that a computer can later execute, whereas interpreters translate each instruction as it comes in real-time.
From idea to the algorithm
Usually, traders think about when to enter and exit trades. An example brought by George Pruitt in his book The Ultimate Algorithmic Trading System Toolbox is the following. A trader wanted a code to enter the market and told him:
” Buy when the market closes above the 200-day moving average and then starts to trend downward and the RSI bottoms out below 20 and starts moving up. The sell-short side is just the opposite.”
No computer would understand that. In this case, the idea was partially defined, though: To buy when the price was above the 200-day SMA, and the RSI crosses down below 20. But what did he mean by “downward trend”? or “starts moving up”?
Pseudo-code
The first step to make a trading algorithm is to create an approximation to the code using plain English, but with more concise wording.
In the example above, Pruitt says that he could translate the above sentence into the following pseudo-code after some calls to his client:
The number inside brackets represents the close x days before the current session; thus, [1] is yesterday’s close.
In the pseudo-code, close below close[1] and close [1] below close [2] and close[2] below close[3] is the definition of a downtrend. But we could define it differently. What’s important is that a computer doesn’t know what a downtrend is, and every concept needed for our purposes should be defined, such as a moving average, RSI, and so forth.
The code
The next thing we need to do is move the pseudo-code to the actual code. There are several languages devised for trading. MT4/5 offers MQL4/5, which are variants of C++, with a complete library for trading. Another popular language is Easylanguage, created by Tradestation, which is also compatible with other platforms, such as Multicharts. Another popular language among quants is Python, a terrific high-level language with extensive libraries to design and test trading systems.
The code snippet above creates a Python function that translates the above code idea. In this case, the myBuy function must be told the actual asset to buy ( which should point to the asset’s historical data), and it checks for a buy condition. If true, it will return a label for the buy and the level to perform the buy, the next open of the asset in this case.
Systematic or discretionary?
The steps from idea to pseudo-code to code is critical. If you do not have a working algorithm, there is no way you could create a systematic trading system. But this is only the beginning. Creating a successful automated trading system is very hard and involves many developing, testing, and optimizing cycles. The market shifts its condition, and not always your system will perform. Then, you have to ask yourself if you’ll endure the drawdown stage until the market comes in sync with the system again.
Some systematic traders think that the best way to attack the market is to have a basket of uncorrelated trading systems, which are in tune with the market’s different stages: low-volatility trend, high-volatility trend, low-volatility sideways, high-volatility sideways, so your risk and reward is an average of all of them.
In the coming videos, we will dissect the steps to create an automated trading system. Stay tuned!
Almost all traders, novices and pros alike, know at least the basics of technical analysis. Still, not many know how to convert a trading idea into a set of rules and then test them for profitability. This video series aims to be an introduction to algorithms applied to trading. Even if you are not considering creating one EA or trading bot, we think it is very interesting to be proficient in converting your trading idea into formal code and test it. We will use mostly pseudo-code, but also python, a very easy-to-learn but powerful high-level language, and Easylanguage, developed by Tradestation, which is almost as pseudo-code because it was designed to be read as a natural language.
What is an algorithm?
An algorithm is a set of rules to perform a task in a finite number of steps. Basically, an algorithm is a recipe.
For example, if we were to create an algorithm to make a phone call manually. A possible solution could be this :
1.- Open the phone
2.- select the keyboard
3.- dial each number from left to right
4.- Click the green phone icon
5.- Hear the calling sound

6.- Busy tone?
    A- no ---> wait  60 seconds for the answer.
        Did somebody answer?
                Yes--> Start a conversation
                    I - Conversation ended?
                            Yes --> Hang up.
                No --> Hang up
    B- Yes ---> Wait 120 seconds and go to 4th step
Algorithms used in Trading
There are many ways to create Trading algorithms, including advanced sentiment analysis, evaluating the words used in trading forums and news releases. Still, we will focus on algorithms for historical price action data series.
The ability to create, test, and evaluate a trading algorithm is a terrific ability to own. This allows creating market models that map and profit from the market’s inefficiencies. If you happen to find one set of rules that historically made profits, it could likely continue making profits in the future. This is the basic premise of automated algos, expert advisors, and trading bots.
Algorithm properties
Inputs: zero or more values can be externally supplied. Some algorithms don’t need inputs, although the majority will, and of course, a trading algorithm will need to get timely data from the market to generate outputs.
Outputs: at least one result should be delivered. That is logical. The output may not only be a text. It can be a picture, a sound, or a market trading order.
Unambiguous: Each instruction must be explicit, with a single meaning.
Finite: It ends after a limited number of steps.
The algorithm should precisely specify what the computer should do. The computer is not smart. It is dumb. You should tell it precisely the action it has to make.
Effective: Every instruction should be basic enough to be made by hand or uses other algorithmic sub-units with the same property. Of course, the action must be feasible, which means the computer can perform that action because the instruction is included in the instruction set of the programming language you’re using.
The key to a good algorithm, as with recipes, is to break the ideas down into simple building blocks.
Flow Diagrams
Algorithms can be more complicated than a simple recipe. Besides, a recipe is interpreted by a (supposedly) intelligent cooker. On the other hand, algorithms are to be interpreted by brainless CPUs. Besides, algorithms usually accept a stream of data inputs, which must be transformed until an output or output is produced. Flow diagrams are a pictorial representation of the algorithm’s process and data flow.
A Flow diagram is a very handy tool to develop your ideas into coherent algorithms because it helps you spot potential flaws and improvements and should be the first step before proceeding to the actual code.
In the next chapters, we will continue developing this basic idea, applied to trading, using trading examples.
Further reading:
The Ultimate Algorithm Trading Toolbox, by George Pruitt.
In Two-Tier Optimal f part I, we discussed the virtues and drawbacks of optimal f trading. In this part II video, we will present a methodology that will almost ensure that our initial capital is preserved with the possibility of astonishing growth factors on our trading account. This content is exclusive, and, so far, you will not see it explained elsewhere.
System requirements:
This methodology is valid only with profitable strategies. This method is not a miracle solution for losing systems.
It works best when the risk is homogeneous. That is, the dollar risk is a constant R factor to the rewards.
The better the system, the higher the and smoother are the rewards.
The Two-tier Strategy
1.- We split the trading account un two portions. One portion ( 25% of the total in our case) will be used with Optimal f positioning. The other part will be applied to a 1% risk positioning.
2.- After a determined goal (2X, 5X, 10X, 20X of the Opt-f portion), the account will be rebalanced ( by adding both sub-balances together) and then re-split(25%-75%) to start a new cycle. The cycle will also reboot itself if the Opt-f section’s balance goes below 25% of the value at the beginning of that cycle.
What was the procedure to test the two-tier Opt-f position system?
We took the current Signal Table closes signals and created two 10K trading histories of what would have been one year of trading activity. Thus, resulting in two collections of 10,000m years of trading data. One of the collections was to be used with the Optimal f position sizing portion, and the other one was employed in the 75%-portion of the account. The Python code for the entire simulation is shown below.
We did this procedure using several targets for the balance of the portion traded using Opt-f: 2X, 5X, 10X, and 20X. We focused the results on the following parameters: Average final capital, max final capital, min final capital, average trades need to 10X total capital appreciation, average max drawdown, The drawdown with 1% probability of occurrence. In the below table, we also present the results of the 1% risk and 100% Opt-f strategies. ( click the image to enlarge).
Discussion
We see that the 1% risk strategy is not bad at all since it can multiply by five the initial balance in one year. It does this with an average max drawdown of 8.79 percent, with the odds of reaching a 16.2% drawdown on one every 100 years. We see also that, on average, it needs 664 trades to multiply by ten the initial capital.
On all two-tier columns, we see a remarkable fact that the min final capital is 10,486. That meant that in all the 10K years of simulated market action, not a single one ended below the initial 10K balance. Thus, this strategy seems to protect us against the loss of the initial capital. That is a terrific psychological reinforcement to withstand the high max drawdowns it presents. The use of the 2X goal is the best choice for the less bold investors, as this method offers an average max drawdown of 38.32%, with a 1% chance of reaching 59% drawdown. After one year, the average final capital is $8.5 million, with a starting capital of only 10K. This positioning strategy multiplies by ten the capital, on average, every 113 trades. The second best choice is a 5X goal. That will more than double the yearly returns at the expense of a near 50% drawdown on average. On the table, we can see that the more we increase the goals to rebalance, the more the account growth, but also the max drawdown.
We can see that these strategies’ growth is orders of magnitude lower than fully Optf position sizing. Still, the attractiveness of this strategy is that the odds of being smaller than 10K after one year of trading are virtually none.
More ideas
We used 1% as the size used in 75% of the total capital in the preceding trading sizing proposals. Of course, we could modify that to better profit from the total capital with almost no increase in drawdown and fully preserving our initial capital. You can make your own simulations on this to find the best fit for you. As examples, let’s present three more simulations using Optf/10, Optf/ 5, and Optf/2 with 2X rebalancing goals.
In the image above, we see that using Optf/5 in 75% of the capital will deliver huge profits with 40%-63% Drawdown figures and 79 trades to 10X capital appreciation. All this with almost no chance to blow up the account.
Final words
This video shows exclusive and never taught position sizing methodologies that protect the initial capital and offer vastly superior results to the 1% risk standard methodology. But you must be aware that we are assuming the trading strategy is effective long term. The trader will also need to find the safest optimal f value by performing the proper computer simulations.
That also shows that position sizing is part of a trading system that really helps you achieve your monetary objectives. And for optimizing it, you need to know the optimal f of the system you’re using.
Of course, the market will limit the trading size we can reach without influencing it, but as theory, these methodologies are real wealth multipliers for the serious trader.
To employ a two-tier methodology in the real market, you will need to be fully organized, have an appropriate spreadsheet to follow the trade results, have two split balances, and compute the size of the coming positions.
In our past video presentation about the Kelly Criterion and Optimal f position sizing methods, we have learned that using these position size methods bring the maximal growth factor to any trading account using a profitable strategy. But, optimal fraction position sizes also presented drawdowns of over 90%, making them unsuitable for any trader except for a robot.
Nevertheless, optimal fraction position size shows the fastest growth rate, meaning achieving a determined goal in minimal time. Consequently, if we were to devise a methodology to reduce drawdown at tolerable levels, diminishing the risk of ruin to zero, and boost the basic 1-percent risk equity progression to unseen levels, we could take advantage of a terrific methodology and produce psychologically acceptable growth optimization. That is the object of the current video presentation.
To make this analysis, we used the currently available data from our Live trading signals. That way, our study is as close to a real system as it can be.
At the time of this writing, we have delivered 203 signals since March 20. Thus, about 51 signals per month, that is, 2.5 signals per trading day. The general statistics were:
STRATEGY STATISTICAL PARAMETERS:
Nr. of Trades : 203.00 Percent winners : 65.52%Profit Factor : 2.10 Average Reward Ratio : 1.11
Sample Statistics:
Mathematical Expectation : 0.3800 Standard dev : 1.3682VAN K THARP SQN : 2.7774
To find the safest optimal f, we did a Monte Carlo resampling of the original trade sequence. The resampling was done with what would have been one trading year using 10,000 resamples, supplying us with 10,000 years of synthetic market activity.
The resulting optimal fractions were plotted and shown below. We can see a Gaussian bell curve centered at 0.62.
But the average f is not a safe fraction because 50% of the values lie below the average. We seek an optimal f that guarantees as much as possible that no future values lie below it.
Opt f Key Values
       max: 91.33%
   average: 62.58%
       min: 23.57%
Thus, to be safe, we want the minimum f, which is 23.57%.
The Live Trade Signals using a fixed 1% risk per trade
To create a reference from which to compare our proposal, we have computed what would have been four years of trading activity using our Live Signals.
The next figure shows the equity curves resulting from the 10K resamples, corresponding to a 1% dollar risk on each trade and over what would have been approximately one year of activity.
We see that starting with $10,000, the end capital of the equity curves range from $19,967 up to over $140,000, although the average ending capital is $53,122.
      Average ending Capital : 53,122.77
          Max ending Capital : 154,077.50
           Min ending Capital: 19,967.23
From these data, we can also create an interesting statistic to answer the question of how many trades are needed to reach a determined goal. In this case, we present the Trades to reach 10X. The curve results from computing this value on all 10K equity curves and computes the odds relative to the number of trades.
In the case of the 1% risk, we see that the average time to reach 10X, the initial capital is about 650 trades, with a minimum of 400 days and a maximum of 1000 days. Not bad at all. But that can be improved dramatically using a mix of conservative and aggressive position sizing.
The optimal F Positioning Strategy
Using the optimal f positioning strategy, a bold investor will navigate in the turbulent waters of one of these equity curves:
The chart is on a semi-log scale because the range of values is too vast to handle on a linear chart. We see that the y-axis show scientific notation, but do not fret. The number of trailing zeros of the equity corresponds with the last digit is in superscript. For instance, in the previous figure, we see that the ending capital after one year of trades ranges from below $1,000 to a theoretical value with 22 trailing zeros.
The next figure shows the cumulated probability of reaching a certain number of trailing zeros:
We observe that a small portion of the equity curves end below 4 digits, meaning they are net losers. The following data clarifies this by showing relevant figures:
      Average ending Capital : 517.14 billion
          Max ending Capital : 43,096,478,975,341.38 billion
           Min ending Capital: 153.51
     Capital ending above 517 billion : 55.63 % of the equity curves
     Capital ending above 1 million :  92.51 %
     Capital ending above 100,000 : 92.96 %
     Capital ending below 10,000 :  6.8507 %
     Capital ending below 5,000 :  3.4253 %
And, next, the chart that shows the power of trading using optimal f. The chart shows the time to reach 10X the initial capital,
The graph shows that the average time to reach 10X growth (50% probability) went from about 620 days down to 42 days. The same growth achieved in one-tenth of the time!
The Two-tier risk system.
The proposed system aims to profit from the rapid growth of an optimal fraction position sizing while minimizing the risk of blowing up the account. In this video, we will outline the idea and, in the following videos, will present its results and also the optimal requirements to make it work and minimize the risk.
The critical value here is the percentage of times the optimal f ends below 10K in a determined period. Here we will take 80 trades instead of one-year of trading, as this shows a more realistic use in a Two-tier system.
40-trade figures:
    Average ending Capital : 213,793
        Max ending Capital : 5,127 billion
         Min ending Capital: 154
The key idea is based on the odds of the trading capital ending below the initial 10K value. In the case of sequences of 80 trades, we see that the odds are roughly 13.3%, and the odds of ending below 50% of the original figure is just 10.4%.
That is the risk for the opportunity to have an average of $213,793 ending capital, which is over 21X. The risk/ reward ratio of the proposition is 214/5, which is 43. That means we can be wrong up to 42 times and recover after just one good trading sequence. Our initial proposal is to take 1/4 of the capital to allocate for an opt f positioning strategy.
The Two-tier optimal f proposal
Take 25% of your current trading balance and use it for the optimal f strategy. Use the rest 75% for 1% risk trades or let it be in cash. (more variations possible)
Let computations of the optimal f strategy be separated in its own pocket to compute the subsequent trades.
The account will be rebalanced after a determined goal has been achieved or goes below a predetermined level ( in our case, we will rebalance if the Optf part drops below ¼ of the initial capital on each cycle).
After rebalancing, a new cycle of 25%-75% allocation begins.
In our next video, we will deal with the results and trade parameters of this combined strategy, as well as our advice on which features are desirable to make this strategy optimal.
This video will be dedicated to explaining the relation between performance and drawdown. It is an essential topic since most of the trading community ignores the fact that the drawdown of a trading strategy or system is not an independent value. It is position sizing dependent. Furthermore, the profitability of a trading system is also dependent on the size of the position.
Imagine several investors trying to choose a copy-trading service, and you need to rank the potential candidates. Which parameter do you think most of them would choose to grade the quality of that group of systems? Total returns? Average trade return? Percent winners? Drawdowns?
The majority would rank them by total returns, without any further analysis on how the returns were obtained. This could lead them to select the worst candidate instead.
The fact is that returns and risks are interlinked in all investments. You cannot increment returns without increasing the risk. Consequently, traders and investors must analyze both simultaneously.
Let’s look at the characteristics of returns vs. drawdown using a simple position sizing method applied to the trades of one year using a sound system such as our Live Signals Service.
Let’s see first how this system behaves using just one mini-lot size, which corresponds to $1 per pip gained or lost.
The figure corresponds to a trader having $1,000 initial capital, using a constant one micro-lot trade. To compute the maximum drawdown, we created 10,000 synthetic account paths using Monte Carlo resampling. The corresponding max drawdown distribution is shown below.
The Average Max Drawdown is 1.94 % with a very tiny possibility a 8% drawdown.
Let’s see how this system performs under increasing lot sizes:
1 mini-lot size
The corresponding drawdown curve is shown below:
In this case, the average max drawdown goes to 11.77%. But, there is a 30% chance (about one in three) that max drawdown goes to 20%, and in about 2.5% of the occasions, the max drawdown went as high as 40%.
Let’s use now one lot
And the corresponding max drawdown curve is
In this case, the average max drawdown is 40%, but there is a 20% chance of a 65% drawdown and a 5% chance of an 85% drawdown. 40% drawdown is about the limit a usual trader can endure, but inevitably a 65% drawdown would force most traders to stop trading, even when we can see that the system is profitable.
We can see that even using a constant trading size, the drawdown grows with the position size. Of course, we can observe that the returns also grow. Furthermore, profits grow at a much higher rate than risk. From the preceding examples, any astute observer can notice that moving from one micro-lot to one lot, 1-year returns went from $1,158 to $115,840, a 100X increment, while the drawdown moved from about 2% to 40%, a 20X increase.
Therefore, the theory behind position sizing is aimed at optimizing both return and drawdown. Of course, there is no single solution to this problem. The solution must fit the particular psychology of the trader.
A retail trader’s insight into how bankers trade Forex
In this session, we will give retail traders some insight into how professional bankers trade forex, with their own bank’s money, in the forex market.
Wouldn’t it be absolutely fantastic if everybody traded forex the same way? But of course, that is not the case because traders use different time frames, have different opinions about where currency exchange rates should be, they have different views on political and economic situations which will affect forex exchange rates, and this dynamic array of variances makes Forex moves very difficult to predict on a long-term basis. Situations can change in the blink of an eye and cause price action moves and reversals, which nobody could have foreseen.
However, if retail traders knew what was going on behind the scenes at a major investment bank, might it give them a better understanding of how price action is affected by the big guns’ actions? Well, yes, it would.
Firstly, it is he said that under 10% of bank traders’ own banks’ funds, accounts for 90% of all forex volumes. The best way to explain this is to say that the average forex retail trader probably trades between a couple of dollars per pip, with larger account balance traders ramping their trades up to $10 or a standard lot, equivalent, and perhaps a little more when risk suits. And now factor in the fact that over 75% of retail traders lose all of their money in the first 6 months of trading.
And now, let’s look at bankers. The majority of their trading is for their corporate or high net worth client base, where they instigate forex trades on those client’s behalf. And where some of these trades are speculative, and some of these trades are because of clients doing business in other currencies abroad, or perhaps hedging against inflation or portfolios or fluctuating exchange rates, etc.
But when the bankers themselves come to trade, these guys do not mess about. They are likely to instigate a spot or forward Forex trade in ticket sizes ranging from $10 million up to $500 million. And in which case, they are certainly not picking their trades on a whim. They do not scalp, and they do not go long or short because a stochastic is overbought or oversold, or because an RSI has reached a particular area, or because a Fibonacci retracement to X, Y, or Z level has occurred.
Professional bank traders have a dedicated team behind them who are professional analysts and economists advising them. They have a defined fundamental and technical view of where an exchange rate should be and where reversals in price action might occur, and they tend to be swing traders, not intraday traders, and they usually only do a couple of trades a week on their own bank’s book. But how do they choose their levels?
You definitely will not find something like this one hour chart of the EURUSD pair on a professional bank trader’s screen, which is cluttered with lagging indicators.
However, you probably would find something like this daily EURUSD chart. But what are they looking at? What information does such a chart provide them?
Actually, it provides them with a wealth of information, such as here we have added some notes, including at position A , which shows defined lines of resistance and support, in a wedge-shaped formation, where a bullish breakout occurs.
And at position B, where price reverses 300 pips from the key 1.200 level, before forming a support line and where the price is moving higher, potentially retesting that key level again.
Now, if our professional bank traders bought this pair at the breakout from position A and rode that trade up to the peak at position B, they would have made 1000 pips on that trade, on a multimillion Euro – in this case – ticket size. The profits would have been incredible.
Therefore, we know that professional bank traders take a longer-term view of the market. They enter with large size ticket trades, and they use a minimal amount of technical analysis indicators, preferring to draw their own trendlines while looking for breakouts and concentrating heavily on key numbers for support and resistance.
While bankers have deep pockets in terms of how much exposure they have with regard to stop losses, it is almost impossible for a retail trader to incorporate the same amount of risk into their trades. However, if a retail trader understands where these large ticket trades are occurring, it could be beneficial in terms of their own trading setups.
In conclusion, no matter what your trading style is, look at the longer time frames and look at key areas of support and resistance, which is the institutional size traders maybe referring to, in order to better select your trades on the lower time frames.
Fed saturates the markets with dollars – what next?
In this session, we will be looking at the extraordinary amounts of US dollars, which have been printed by the federal reserve in America and flooded into the system to try and prop up the US economy during the coronavirus.
Since the pandemic began and started to bite in the United States, it is estimated that over 20% of all circulating US dollar bills were printed during this time.
Although the federal reserve has publicly declared that their monetary policy has not been designed to save Wall Street,…..
….there is no denying from this chart that dollars, which are required to buy United States stocks, are finding their way into US stocks and indices, such as the Dow Jones Industrial Average Index shown here, which had climbed from the panic sell-off in March 2020 when the pandemic began to take a grip of the United States, up to record highs of over 30 thousand.
Purely on a supply and demand basis, the shock and magnitude of the influx into the market of the US dollar has gone a long way to shedding its market value against currencies, including the major currency pairs as shown here on this dollar index where it was at a high of 103.00 in March, and while the fed has been pumping dollars into the system, it has collapsed to 91.70 at the time of writing.
While the safety of gold saw investors take flight here during the latter part of March 2020, causing the precious metal to rise in value in a risk-off event during the early stages of the pandemic in the USA to a peak of over 2000 an ounce, and where traders have pulled back while shifting their focus to the US stock market, in a risk-off phase, and where gold currently sits around 1800 per ounce.
The federal reserve has been getting into the markets indirectly, via the backdoor, by talking to hedge funds, mutual funds, credit facilities, market makers, and commercial paper funding facilities, and instigated a huge emergency repo loan operation with the New York fed, where it is said that over 6 trillion dollars have as entered into circulation through this facility.
The Fed’s pumping of dollars into the market, where its value has crashed in value relatively over the last 100 years, has given fuel for the rise in interest for bitcoins and other cryptocurrencies and as we have seen gold and other precious metals, while investors try to hedge against dollar depreciation and inflation, as the dollar continues to lose value against other assets.
And by the time the new president-elect, Joe Biden, takes office, the two political houses in the USA, currently at loggerheads, will agree more stimulus, in the range of 1 to 2 trillion dollars, and where once this has been agreed, this will only pour more oil on the burning cauldron and the effect will likely be the US dollar’s further decline, with a knock-on effect being volatility in the financial markets, and higher prices for consumers.
Thank you for joining this forex academy educational video.
In this session, we will be looking at the EURUSD pair.
This is a daily chart for the pair, which shows that the bulls are in control and pushing the pair up to the key 1.20 level from the current 1.1961 at the time of writing.
This week’s broad dollar weakness has pushed the dollar index under the key 92.00 level, has certainly helped to give the euro a lift. However, while publicly declaring a neutral stance on the strength of the euro, the ECB will no doubt privately be hoping for or a decline, simply for export reasons while the Euro area is still in the grips of the pandemic, and where the recovery path is muted.
Some analysts believe that the current level of ECB monetary easing policy is discounted in the pair’s exchange rate and believe that leveraged investors are reluctant to continue long positions from these highs……
….and where the market saw a distinct pullback from the 1.2016 level to 1.1607 at the beginning of August 2020. Certainly, If the big guns stop buying because of these reasons, price action will stall at the key 1.2000 level for a second time, and a reversal would follow
Other fundamental risks include a new US president in the waiting and whereby President Biden’s post-inauguration monetary policies will directly affect the markets and especially US stock markets and the value of the dollar, whose decline has helped lift the Euro in recent months and where the Covid relief financial stimulus package has been a long time in coming.
Also is the conundrum of the ongoing Brexit free trade agreement negotiations between the EU and UK. A failure to reach an agreement in what is seen as the eleventh-hour talks, before the end of the transition period on the 31st of December, would mean increased tariffs between the EU and UK where the EU exports than it imports, and which would be potentially harmful for the ailing EU economy. This would affect the value of the euro negatively.
Now let’s look at the technical risks.
The daily chart clearly shows a support line at the key 1.1600 area, and we are very close two a retest of the key 1.200 line to the upside. Should that happen, we will have had two attempts at a support line and two attempts at a resistance line, which will give us a confirmed sideways range for the pair. The risk for bulls is a potential double top formation, with its danger of a reversal. The previous 300 pip, reversal as shown, must be a warning sign for buyers.
The next test would be price action moving above the 1.20 line, pulling back to it, and finding support there, potentially leading to a higher continuation.
Traders should look to use the 1 and 4-hour charts to gain an intraday perspective of what is happening around this key 1.2000 level, to ascertain if it will become an area of support or resistance while factoring in the very risky fundamental reasons as previously alluded to.
Thank you for joining this forex academy educational video.
In this session, we will be looking at the end of the most recent bull run for the BITUSD pair.
This is a daily chart for the pair. As we see here, the pair has been on a bull run and has been conforming to this upward trend line since April 2020. The price range found support at the all-important $10K level, which coincided with the support line at position A. The pair found a bid tone up to position B, where price action did not revert to the support line, preferring to fade up to the line of resistance where we see a breach above the $14 k line which coincides with the area of resistance at position B giving the pair one of the largest single-day moves to the upside for several months.
We then see an extended rally up to position C see at $19.450k before a major pullback. So, what caused this?
Firstly, we need to go back in time to 2017, shown here on the monthly chart, where bitcoin to the US dollar hit an all-time high hit around $19.5K, depending on the broker, shown here at position A, before crashing to $3K in the middle of 2018, at position B, and then taking 2 years to reach the $19.5K area as seen at position C. This is a double top formation, where smart money investors, saw the potential of a reversal in price action, while many traders were hoping for a continuation to $20K and beyond.
Now we need to drill down to the 1-hour chart. We have a classic area of support and resistance at position A, where the resistance line is breached to form a push up to $19.5K area, before a pullback to the support line and a second attempt to move higher, which forms a double top, and the price does not sustain the move higher and falls back to the support line at position C, before crashing lower with large candles suggesting extreme volatility through eventually punching through the support line at position D, which becomes an area of resistance, before the pair crashes to a low of $16.3K.
This move came about due to a series of important factors, including historic highs, followed by a crash, followed by another bull run, but where cautious traders would be reminded of the previous crash and were prepared to selling bitcoins and bitcoin futures, as we see on our charts, because of the nature of bitcoin which has no store value you other than the fact that it is of limited supply, and is predominantly a speculative instrument.
Thrown into the mix was the current bull run topping out just before the US Thanksgiving holiday, where traders will have decided to unwind their trades and take their profits.
Bitcoin proves again that it is a highly dangerous asset to trade. With one story of a $100 million loss in the press today, timing is critical. The main BTCUSD lost 11% in 24 hours and dragged other crypto assets lower in the panic. However, by using simple trend and support and resistance lines and dropping up and down in chart time frames, traders can gain a clear understanding of the risks and potential for turns in price action.
Thank you for joining this Forex Academy Educational video
The US dollar is the most widely traded currency on the planet. In terms of volume, the biggest currencies traded against it are the Euro, Japanese Yen, the British pound, Swiss franc, the Australian and New Zealand dollar, and Canadian dollar.
The dollar is measured as a weighted value against these other currencies and is referred to as the dollar index or DXY. Here we can see that at the time of writing, the value is 91.79, a two-year low.
As we can see here, the dollar has been broadly declining against this basket of currencies since March 2020, when the index hit a high of 103.00, just before the pandemic began to take a grip in the United States. And with the pandemic still gripping the United States, where just last week 1 million new cases were recorded, could the DXY continue its demise, perhaps down to the 2008 crash level of 72.00? Certainly, some analysts are predicting a slide into the high 80.00’s?
With winter knocking on the door in the United States and pressure mounting on hospitals, the nation’s economy, which has been showing signs of a recovery, albeit at the expense of a lockdown, where President Trump favours the economy over individual’s health, and which might prove a sticking point with the second wave resurgence in motion and a new president in the waiting.
And with US stocks at record highs and with the Dow Jones industrial 30 index somewhat inflated around the 30,000 level, could a short sharp reality check be on the way for the American economy, where the unemployment rate has started to rise in recent weeks?
If you believe the answer is yes, then us stocks should fall, and in which case we might see the dollar being bought as a safe-haven currency and possibly a rally to the mid 90.00’s.
Another key factor is a failure to pass the new US stimulus bill, which might cause the federal reserve to become more proactive and take an aggressive stance on quantitative easing, which would be negative for the US dollar. This is unlikely to happen until the January inauguration of the president-elect Joe Biden.
Another contentious issue which will affect the dollar is the continuation of the Brexit future trade agreement talks with the European Union, which are dragging on but must be concluded shortly if there is to be enough time to implement a new tariff-free trade deal which both parties want, but which seems to be unobtainable because of the lack of agreement on issues such as fisheries and a so-called level playing field, where the EU is concerned that the UK will use its new free trading status to undercut it for trade deals as it goes out to sign up new ones around the world.
And therefore, any dollar related trading should be done with extreme caution as these issues unfold and where recent swings in pairs such as the GBPUSD, sitting at 1.3315 and EURUSD at 1.1965 at the time of writing, could see significant moves in either direction based on the above metrics. Caution is advised.
Thank you for joining this Forex academy educational video.
In this educational tutorial, we will be looking at one of the main reasons why new traders lose money when they start trading Forex.
A first, let’s take a look at this warning which regulated brokers in the United Kingdom must adhere to on their website: contracts for difference, also known as cfds, are complex instruments and come with a high risk of losing money rapidly due to leverage. 72.6% of retail investor accounts lose money when trading cfds. You should consider whether you understand how cfds work and whether you can afford to take the highest risk of losing your money.
We have hidden the name of this broker, but in fact, 72.6% is one of the lower percentages of retail traders losing money, some are above 80%.
And yet, these high levels of losers remain the same year after year. So, what is going on? Unfortunately, most new traders will not go to the lengths of studying how the currency markets work. They hardly ever bother to learn about fundamental analysis, which is crucial. Most of them will look at a couple of videos on YouTube, where so-called traders claim to have made money on a particular trade setup, which they may have the need to record several times previously in order to come up with one successful winning trade. And yet most new traders will follow this strategy blindly and where of course, the markets can change direction in an instance, thus leaving them wondering what went wrong and how they lost their money.
The next common mistake made by new traders, who may have trolled through the internet to find some trade setups, is to overload their screens with too many indicators, which can be a hindrance because one ends up focusing on the indicators, which tend to be lagging price action, and not the most important indicator on the screen itself; price action, which is a leading indicator.
Often these types of traders will look at one of the indicators, which might suggest price is going to go in a certain direction, and then trade according to that one single indicator, which may be in contradiction to the others. Occasionally they will be right, but more often than not they will be wrong, and end up losing money on a trade.
Let’s take a look at that chart again, which is a 1-hour chart of the British pound to US dollar, and by stripping out all of the indicators and drawing in three lines, we can much more easily see that price action is simply gravitating towards three major levels, 1.31 1.32 and 1.33.
INSERT C again
Yet this was impossible to see with all of the indicators on the previous chart.
And now, when we add in three very simple trendlines, we can see a clear direction of this pair, which trades within the trendlines and within the 3 key levels of 1.3100, 1.3200, and 1.3300.
Unless taught, most new traders would never consider drawing trendlines on their charts and stripping away many of the technical indicators they have become reliant on.
Another area where new traders fall down is trading over economic data releases because they have not bothered to follow a calendar or are not aware are of the significance of avoiding trading during times of high impact data releases.
Or trading during the end of a particular time zone, where the new time zone traders may have a completely different approach to the markets due to the local sentiment, which can cause price action reversal.
Trading the markets, especially foreign exchange, is extremely complex, just as the warning at the beginning of this video mentioned. New traders are advised to comprehensively learn about how professional traders go about their daily business. They must learn how to read price action, which is the best leading indicator of all. They must also learn about fundamental analysis, how one market will affect the other, such as the stock market’s relationship with the foreign exchange market.
In conclusion, the absolute good news is that all of this information is available on the forex academy website. It has been put together by extremely competent and experienced traders with a wealth of knowledge and great success behind them. Be patient; take the time to troll through all of the videos because every one of them will help you to become a more successful trader.
This is a small presentation about how, at Forex.Academy, you could discover the secrets behind risk control; and how position size could affect your profits and your probability of ruin.
This is a small presentation about how, at Forex.Academy, you could discover the secrets behind risk control; and how position size could affect your profits and your probability of ruin.
This is a small presentation about how, at Forex Academy, you could discover the secrets behind risk control; and how position size could affect your profits and your probability of ruin.
Overbought and oversold, how can you tell when the market will reverse?
Thank you for joining this forex academy educational video.
In this session, we will be looking at when a currency pair is overbought or oversold and how to take advantage of this.
To try and gauge the best way wait to take advantage of when a market is overbought or oversold, we must first take a look at the biggest by volume currency pair traded in the forex market: the Euro against the US dollar, a so-called major currency pair. And this is a one-hour chart of recent price action.
To establish when a pair is oversold or overbought, there are a multitude of tools available. We will focus on one oscillator and price patterns.
First of all, we have the stochastic oscillator. This tool consists of two moving averages that crossover at certain points, and when they move up and cross the 80-line, an asset is said to be overbought, and when the moving averages move lower and under than the 20-line, it is said to be oversold.
One of the problems with the stochastic oscillator, as we can see here, if we draw a magenta coloured vertical line, the market is actually oversold at the halfway point between the peak and the trough of this move. The pair continues to move lower after it is oversold. This is common with the stochastic.
…in this example, it has moved lower by a further 41 pips after showing as oversold, before price action eventually does turn around and move higher, and it is then when the stochastic begins to comply with the price action.
One way that professional traders will guard against using the stochastic oscillator to get into a trade too early is to wait until the indicator has gone above the 80 and its moving averages have crossed over and moved under the line before they enter a short trade, or have moved under the 20 line, crossed over, and moved up above the line before they will enter a long trade.
Professional traders will very rarely use a single indicator such as the stochastic on its own to enter a trade.
In this A B C scenario, we have more clues about potential future price direction. First, we have the stochastic showing oversold at position A, and when price action reverts higher to position B, price action appears to stay inflated and ignores the stochastic, initially. However, when price moves lower at position C, we have a divergence in the stochastic and price action, where the stochastic has moved lower to the 20% line, and price action at position C has not moved lower to the level at position A. It has formed a higher low, and this is an indication in itself that price action may be fading to the downside, especially when coupled with the hesitation to move lower at position B, and whereby a bear candle spike outside of the Bollinger band at position C is another hint that price action may move back inside the bands, because, as you will probably know, 95% of price action will revert inside the Bollinger bands if it spikes outside.
This setup, simply by using the stochastic to show oversold, where its moving averages have moved under the 20 line, then crossed over and moved higher than the 20-line, plus divergence in price action, and a higher low set up, and a candle spike outside the Bollinger bands has been the set up for this bull trade which saw 140 pips to the upside.
Simply look out for this setup in reverse to take on a bear trade.
Thank you for joining this forex academy educational video.
In this session, we will be looking at the Brexit conundrum, where Great Britain, which has left the European Union, will have completed its transition period on the 31st of December, and which this date is enshrined in law, and cannot be moved, unless by an act of legislation, which is completely unlikely, bearing in mind the government’s stance on sticking to this date.
British businesses and Europeans too, are bitterly disappointed that a formal no trade deal has not so far been agreed between the United Kingdom and European Union, where the two sides seem to be at loggerheads over fishing rights, and the so-called level playing field where the European Union is worried that the United Kingdom might undercut European businesses when the UK forms trade deals with other countries around the world, once the transition period ends.
This affects UK businesses who simply do not know whether they will be levying tariffs against the EU should a free trade deal not be set in place, and whereby they are simply not in a position to know which types of rules and regulations they will be following on the 1st of January 2021.
Rumors and speculation are driving the financial markets, where one moment the two sides are close to implementing a free trade deal, only to be scuppered by officials on either side saying they are still miles apart, but where while there is hope that an 11th-hour free trade deal can be completed. Traders are looking on the positive side, and this is reflected in the British pound, here seen on a one-hour chart of the GBPUSD pair where it is most widely traded.
The swing in price action between positions A B and C is over 400 pips during the 10 days of trading here. These are significant moves. But interestingly, we can see that price is largely conforming to within two key levels, 1.31 and 1.33, with a slight bias to the upside. A and C is a classic double top reversal formation.
Here we have highlighted the pullback from position C to position D, which has respected the 1.3200 line after the pullback. It is a 50% retracement of the earlier move from A to B, and this is significant because traders believe there will be a last-minute attempt to close a free trade deal between the two sides, who are playing this situation like a game of poker, and where neither side wants to be the first one to blink.
So where next for the pound? Certainly, if a free trade deal is agreed on, the pound should strengthen against the dollar. Some analysts predict moves of to 1.400, should a free trade deal be agreed on. But price action could revert lower to potentially to 1.2500 should the UK leave on WTO rules.
Any trading on the pound should be done with the utmost caution and with tight stops in place. Look out for moves in price action to these key trade levels, which are round numbers, and use them in your trading setup. Expect volatile price action the longer this is drawn out, bearing in mind two deadlines have already been passed, one being the 15th of October as set down by the British government’s and more recently the middle of November, which were deemed necessary to implement new legislation pertaining to a possible free trade deal. And wherever possible, instigate break-even stop-outs on your trades.
Is a war developing between China, Taiwan, and the USA?
Thank you for joining this Forex academy educational video.
Is a war developing between China, Taiwan, and the USA?
Taiwan was a Dutch colony between 1624 and 1661, having been administered by China’s Qing dynasty from 1683 to 1895. But today, China regards Taiwan as a breakaway province and says it is determined to retake it. However, Taiwan’s leaders argue that it is a sovereign state, with its constitution, democratically-elected leaders, and about 300,000 active troops in its armed forces.
China has been piling the pressure on Taiwan’s President, Tsai Ing-wen, to acknowledge the “One-China” policy since before she took over the role in 2016.
And with the 2019-20 crisis in Hong Kong, as a result of the China / Hong Kong National Security Law, some protesters, fearing extradition to mainland China, and facing criminal charges, have been escaping to Taiwan, many with their passports confiscated, elect to take the perilous 370-mile sea voyage to Taiwan which has promised assistance to the people of Hong Kong, thus antagonising China.
After decades of hostility between China and Taiwan, things started improving in the 1980s, and China took advantage by putting forward a formula, known as “one country, two systems” – such as implemented in Hong Kong – and under which Taiwan would be given significant autonomy if it accepted Chinese reunification.
Also, throughout 2018, China put pressure on international companies by forcing them to list Taiwan as a part of China on their websites. Those who declined were threatened to be banned from doing business in China.
In the meantime, the US has been supporting Taiwan, much to the annoyance of the Chinese Communist Party, with Washington sending its highest-ranking politician to hold meetings on the island because what it said was an “increasing threat posed by Beijing to peace and stability in the region.” The US approved an $8 billion sale of F-16 fighter jets to Taiwan last year, taking its fleet to over 200, also angering the Chinese government.
In a more recent development, Chinese fighter jets have been entering Taiwan’s airspace. SU-30 fighters and Y-8 transport planes have been spotted over Taiwan during September 2020, fuelling tensions in the region.
Japan, worried about the number of US and Chinese military exercises in the region over the South China sea, see the possibility of an escalated conflict perhaps as the result of an accident.
Should such a conflict between China and America occur, what might we expect from the financial markets? Mayhem, confusion, and extreme market volatility, stock indices around the globe would fall, but especially within the United States, and we might see the Japanese yen and Swiss franc being bought as safe-haven assets.
China seems determined to retake Taiwan, as much as Taiwan appears to want to break away officially. The Chinese government would very likely not back down, and I’ll poke a finger in the west by provoking them into military exercises while flying over Taiwan’s airspace, which China sees as its own.
This is a crisis that he’s not going to go away anytime soon. It will undoubtedly escalate. Traders are advised to keep an eye on the escalating conflict because it will likely lead to spikes in many asset classes.
How to take some risk out of currency trading – Beginners
Thank you for joining this Forex academy educational video.
One of the challenges for new traders, especially in the forex market, is the sheer volatility concerned with the most popular currency pairs, which typically tend to be the major pairs.
Very briefly, these are currencies such as the British pound, the Australian and New Zealand dollar, the euro, the Swiss franc, the Canadian dollar, and the Japanese yen, which are all traded against the United States dollar and commonly known as the major currency pairs. These currencies are associated with the biggest economies in the world and are the most widely traded in terms of volume, and this factor means that quite often you will see extreme volatility in the pairs, and this is where new traders find it difficult to get in and out of a trade successfully.
This is a 1-hour chart of one of the major pairs, the USD Japanese yen. We have highlighted two significant moves, one was a bullish breakout at position A of 200 pips, and the other relating to the overall move covered by the arrow at position B, was a bearish trend lower of 150 pips, thus giving back most of the previous move.
The issue here for new traders is that the move at position A was associated with a risk reversal event pertaining to covid vaccine developments, and the subsequent move at position B was the Japanese yen being bought because of its safe-haven status. This makes this currency pair difficult to trade and subject to volatility. These volatile moves can be large, as we can see, and happen without warning. These types of moves are usually detrimental to new traders.
Here is a one hour chart of the British pound and US dollar over a 10 day trading period. The moves on the chart have been subject to rumours and speculation with regard to the ongoing future trade negotiation between the United Kingdom and the European Union. The tunes have been trying to best position themselves regarding any potential outcome that those negotiations might have and where they are currently at a critical stage with time running out.
The total amount of moves in pips from the five trends, as shown in the diagram, equals 700 pips. This is an extreme amount of volatility, and where price action can change unexpectedly, often after unscheduled news pertaining to the negotiations, and where rumours abound and affect the price action. This is not for the faint-hearted, and again this can catch out new traders as they try to gauge where to go long and short.
This could potentially be a solution for new traders who want to dip their toe in the water and trade currencies for the first time I’m without the risk of the major volatile currencies. This is a one-hour chance of the Australian and New Zealand dollar pair. This is not a major currency pair, yeah, because the dollar is not included, in which case it is classified as a cross-currency pair.
Because the Australian and New Zealand economies are extremely similar, and where the countries are in close proximity, and where both export largely to China, and because neither of these currencies is used as a safe-haven asset, such as the United States dollar, Japanese yen, or Swiss franc, for example, we tend to find smaller and less aggressive moves in this pair.
Here we can see one price action move to the downside at position A, gaining 100 pips, and at position B, a period of consolidation, followed by a further move lower at position C, of 80 pips. These moves are enough to make a living, yet not usually aggressive enough to catch traders out, especially during times when both countries are not active, i.e., during the European and US sessions, and where all the related economic data has been released to the market, and in times where no key policymaker speeches are due.
Let’s take a closer look at the consolidation period from the previous chart. We have a confirmed sideways price consolidation trend, as confirmed by two areas reversing lower from a clear line, which becomes a line of resistance, and where there are two reversals in price action from another straight line, such as shown on the chart, which becomes an area of support.
Any subsequent reversals from either the support or resistance line are good opportunities to go long or short, such as those as indicated on the chart. Incidentally, at these points, price-action has also spiked outside of the Bollinger bands, and when price action moves inside them, this is also an indication of a potential price action reversal.
In conclusion, if you are a new trader and adverse to market volatility and want to trade a less volatile pair, this will highly likely suit you.
Forex Tips For Beginners – Stacking The Odds In Your Favour!
Thank you for joining this Forex academy educational video.
In this session, we will be looking at how to tilt the odds in your favour by showing you some cool tips to keep you out of trouble and tilt the odds in your favour of making successful trades.
The forex market runs 24-hours a day, 5 days a week, but typically, the busiest times, where you might expect a spike in volatility and larger price movements, is during the first hour of the beginning of a particular regional session. So, for example, at around 7:30-8:30 AM GMT, the European and UK session starts, and the FX market will usually become more active as more cash volume flows into the market. The same applies to the US session and then the Asia session as led by Sydney and followed by Japan.
Often trends will finish in one region and turn in the direction as the new region opens. This is down to differences of opinion, economic data releases, sentiment, and profit-taking as one region retires for the night. Wait until such times as the new trading session is well underway and until you can identify a potential trend.
Become a master of Bollinger bands. This technical analysis tool was invented by John Bollinger in the 1980s.
It is a chart tool that calculates two standard deviations on either side of the exchange rate, but it’s used in many different asset classes such as stocks and shares because of its success and the fact that it is highly regarded by the trading community.
One of the key components that traders look for when trading Bollinger bands is that 95% of trading activity will remain within the bands. And shown here on this one hour chart of the USDJPY pair where we have highlighted a few examples of what has happened when the price has a move outside of the bands, traders push the pair back inside, and this often results in a price action reversal.
Another major tool traders use are trendlines. A trendline is typically manually drawn onto a chart to identify price action direction. Again, using the 1-hour chart of the USDJPY pair, we have drawn in some trendlines.
An area of support and resistance, which forms the basis of a trend, is officially recognised when price action has reverted to either the support or resistance trendline on a minimum of two occasions. Here on the left side of the chart, this is clearly the case.
Three distinct trends become apparent using this technical analysis feature.
In this diagram, we have overlaid the Bollinger bands with our trendlines. Again, this is the same USDJPY pair and 1-hour time frame.
Now we can wait until a trend has been confirmed, where price action has hit either the support or resistance line on two occasions, and then we can also wait for the price action to breach the Bollinger band to increase our odds of the price action being driven back into the bands.
At position A, we have a confirmed downtrend, but where price action does not breach the Bollinger, yet it still moves higher.
At position B, we have a change in trend direction as confirmed here on the chart, but where the resistance line breach and also the breach of the Bollinger band cannot be considered as a confirmation of a reversal until such time as price action has fallen underneath the resistance line, which it clearly does. This is the time to short the pair. And, at the bottom of this move, we have a breach of the Bollinger band and where price action finds support before moving higher, which is the time to cut the short position and buy the pair.
In conclusion, use the trendlines and Bollinger bands together in this fashion to increase your odds of a successful winning trade.
Thank you for joining this forex academy educational video.
How to trade the US dollar Japanese yen pair?
The US dollar Japanese yen is one of the so-called major pairs, and accounted for 13.2% of all the daily forex transactions settled during 2019. And the yen is the most frequently traded currency in Asia.
The United States is seen as the largest economy on the planet, albeit battered and bruised by the Covid pandemic, and Japan also has a strong economy, largely export-driven, and many things in common with the United States, including large stock markets. The relationship between the two countries is ever improving and has evolved significantly since the post-world war II era.
The pair can be extremely volatile at times and prone to large swings, but the basic rule of thumb is that when the United States was pre covid and its economy was strong, traders preferred dollars over yen. And since the United States has been in the grip of the pandemic, and even though the economy still massively outweighs that of Japan, traders prefer to buy the Japanese yen in times of uncertainty. It is seen as a safe-haven currency.
Let’s take a look at some price action on this monthly chart, where we see an A, B, C, D price swing since August 2006 of almost 13,000 pips. This is not a pair to be traded without caution and tight stop losses by retail traders.
This weekly chart highlights two periods A and B between 2018 and 2020, where the difference between the top and bottom of both ranges is approximately 1000 pips. Again, these are account busting moves if you are on the wrong side of the trade and without a cautious stop loss in place.
And yet, the overall trend as seen clearly here, again, on the weekly chart, which shows a snapshot of the pair since April 2017, is a downtrend. The yen is stronger overall.
Here we are still looking at the weekly chart. However, we have highlighted a couple of stages in the price action for this pair. Firstly, we must note the high at position A, with an exchange rate of 112.17, and the low at 101.17, which came just a couple of weeks later, where the yen was being bought as a safe-haven asset against the US dollar as the pandemic began to take hold. This was a significant swing in the exchange rate.
Now take a look at the bear channel shown at position C. Institutions look at the higher time frames and, as they hold all the aces in terms of their ability to move the markets with the size of their forex transaction, this is where retail traders need to focus their attention with regard to likely price action moves for the longer term.
Of course, retail traders should never trade on weekly or monthly timeframes because they would need to incorporate huge stop losses. We have already demonstrated with this pair moves of over 1000 pics is simply nothing here.
But they can and should use the information to try and establish the overall trend that institutional traders are looking at.
And here, we have brought the timeframe down to an hourly one, and we can see that since the 10th of November 2020, we have two peaks forming a line of resistance. Two areas forming a line of support and the grey circle, which clearly shows a breach of that support line, and with all of the uncertainty going on with regard to a new United States president, the worsening situation with regard to the pandemic in America with 150,000 new cases reported just a few days ago; we can only surmise that with all of this information that traders may continue to push the pair and to the previous low of 101.00 which we saw earlier on the monthly chart while favoring the safe-haven stats of the yen over the US dollar.
In conclusion, traders should be looking for potential signs of a weakening or pullbacks to get on board to short this pair. As we have clearly seen, the pair is subject to huge price swings, and tight stops should be incorporated.
Profitable Forex trading is an elusive goal for many traders. According to most statistics, over 75 percent of traders lose money. This comes for several reasons. There are well-known causes of this unfortunate outcome. Most traders get blown out because they bet too much and lose all when the market turns against them. Another source of failure is their psychological bias to let losses grow and cut their profits short. But today, we will focus on one key factor: How to assess entries and exits properly.
The States of a Market
Many people classify market action into over six states: Bul, Bear, Sideways with high or low volatility. Although this is usually correct, it does not offer enough simplicity to make decisions. The best way to look at market action is similar to what the Elliott Wave Theory states: Elliott stated that the market had impulsive phases and corrections of this primary impulse. We don’t need to be a genius to see that it is logical. Waves need to swing for it to form. But impulses and corrections have different properties. What works on one, it does not work on the other. Thus, the secret to master the trade is to
Assess which state the market is on
Apply the proper tools for entries and exits.
Impulse Properties
Impulses are characterized by directional movement. Bull or bear, we can see a steady price movement toward a new equilibrium, as impulses are created by an imbalance between supply and demand. The volatility on impulses is directional, and the tools to apply are moving averages and superior form of them such as instant trend, MAMA, MESA, and similars.
Chart 1 – Bitcoin 4H chart impulsive Phase
In chart 1, we show Bitcoin moving in its latest impulsive phase, although we can also see a glimpse of corrective structures. The main idea here is to follow the trend. The chart shows a ribbon formed by Ehlers Instant trend, an advanced indicator freely available on Tradingview but also MT4 and MT5 platforms.
We see that the indicator is right at delivering timely entries and exits. The chart also shows its 50 and 200 simple moving averages, heading up and supporting the trend. We can see that the touching of the 50-SMA line could be used as well to enter or add to the position, although the instant trendline seems to lead the 50-SMA. Tradingview’s Instant Trendline Indicator colorizes the candles’ body so the upward phases can be spotted with ease.
Corrective Properties
Corrective phases come at the end of an impulse. We have to realize that impulses come from a lack of equilibrium between buyers and sellers due to actions to find a new fair value. The fair price is unknown; thus, usually, the impulse creates overbought or oversold conditions. When some savvy traders spot this, they start to unload their positions in a profit-taking activity. That lowers the price to a level where it finds new buyers. The price moves up now, but the memory of traders who lost near the top makes more selling pressure ahead of this level, lowering the price and creating a cyclic path. Thus, the main characteristic of corrective phases is its cyclic characteristic, whereas the main feature of impulses is their lack or decline of cycles.
Since the cycle is the main component of corrections, The best way to time them is by using an oscillator, such as the Stochastic, RSI, or an advanced wave oscillator. If you’re price-action oriented, you may use support-resistance levels and breakouts to spot the right entries and exits.
Chart 2 – Bitcoin 1H chart Corrective Phase with Ehlers Stochastic CCI, Stochastic, and AutoCorr Angles.
As an example, we show on chart 2 the corrective phase of Bitcoin that started after a move up to $15,000 from the last consolidation of $13,500.
The image shows the stochastic oscillator( third curve) and two advanced oscillators buy the innovator of this century, John Ehlers, The Stochastic CCI, and Autocorrelation Angle. These two can also be found on Tradingview.com and MT4 and MT5 platforms.
We see that the Ehler’s Stochastic CCI (second curve, following the price) can precisely time the cycles on the chart with razor-sharp precision. However, the Stochastic oscillator is not far behind and can be used to profit from these cycles or confirm a reversal candle.
The bottom image shows the Autocorrelation angles indicator.
Autocorrelation is an advanced way to spot the short-term memory of the markets. A sharp move on the angle will show a transition from bear to bullish and bullish to bearish phases. This indicator is harder to handle, though.
There are many others, such as the Even better Sinewave indicator, shown in the third chart. The Even Better Sinewave is designed to find the dominant cycle of the price action. Sometimes, the market loses its pace, as happens in the whipsaw (amber) shown. But most of the time, this advanced indicator can time the cycle changes accurately.
Chart 3 – Bitcoin 1H chart Corrective Phase with Even Better Sinewave Indicator
To conclude
Markets have two phases: Impulsive and corrective.
Each needs the right tools to find suitable entries and exits.
Traders need to spot first the state of the market.
If Impulsive, apply Averages or advanced versions of moving averages and follow the trend.
If corrective, use oscillators to spot turning points.
Don’t be conformist. Look for advanced tools and learn to use them. They will give you a better edge.
Has time run out for the Brexit future trade deal? Where next for the Pound?
Thank you for joining this forex academy educational video.
The British government set itself a deadline of 15th of October with which to had a formal future, a tariff-free trade deal with the EU by the 15th October 2020.
That deadline came and went and was subsequently extended to the 13th of November, where, at the time of writing, no such agreement is in place. The United Kingdom is set to leave the European Union transition period on the last day of 2020. With both the European Union chief negotiator Michael Barnier, and the UK’s chief negotiator on this issue, David frost, both proclaiming that the other side needs to move on key issues such as fisheries, I need a so-called level playing field, it is highly unlikely that a deal can be reached in time I’m for the legal framework to be set in place whereby any such new tariff 3 agreement can be implemented on the 1st day of January 2021.
So, what are the options? The UK government cannot extend the negotiation period because the end of the transition period date is set into law. And so if they will not budge on the requirements and terms of a future trading partnership with the EU, it will appear that the British will be leaving on WTO, or world trade organization, terms, and it is perceived that this would be bad for the British economy, whereby a tariff-free arrangement with the European Union would be in the best interests of both sides because it would offer a smoother, future, trading arrangement.
Let’s have a look at how this is being played out in the forex market, where the most widely traded British pound pair is the GBPUSD.
This is a daily chart for the pair. And we note and expansive bull channel, which has been conforming since the middle of May 2020. This tells us that price action has been fuelled by the potential of a future tariff-free trade deal with the EU. The overall price action has been to the upside. Although this has been waning since early September, such as position ‘A’ and the most recent high was at 1.33.
However, if we bring that daily time frame down to the 4-hour chart, we now see that although price action was waning to the upside at position A on the 1-hour chance, price action for that period has been conforming to an expanding bearish channel on the 4-hour chart.
Now let’s look at what has been happening for the pair are on a 1-hour chart over the last 8 days. Here we can see that price action has been conforming to this triangle where initially we have a bull run up to a peak of just above 1.3300. Since then, price action has been falling lower, to just above 1.3100, and where price action is now conforming to the fundamentals with regard to the potential of a no tariff future trading arrangement deal Brexit.
As time runs out, with no sides giving up any grounds in order to compromise for the sake of a future tariff-free trading relationship, the pair will continue to come under pressure to the downside, in which case the pound is likely to lose value against its counterparts and especially with the United States dollar, notwithstanding the fact that the US economy is suffering because of the covid pandemic and where 150,000 cases were reported in a single day this week, heaping more pressure on the federal government to find fiscal solutions to this problem, which is not going away anytime soon.
USDCHF sinks to multi-year lows below 0.9000. Where next?
Thank you for joining this forex academy educational video.
In this session, we will be looking at the USDCHF pair, which sank to a fresh low on Friday 6th November.
On this one-hour chart of the pair, we can see that on the 2nd of November, it had rallied to a high of 0.9207, before moving lower and where the market became extremely volatile on the 4th of November, but where the pair failed to re-establish itself at the previous high of just two days earlier. The size of the bars which have been highlighted can only mean that extra volume and volatility had crept in, and all of these moves can be associated with the lead up to and just after the US presidential election.
On Friday the 6th of November, the pair had moved over 200 pips lower to find support at 0.8982, a multi-year low, before recovering to the key 0.900 level.
In fact, we would need to go back to April 2014, which was the last time the pair had been so low. And much of this can be attributed to the strength of the Swiss franc, which is bought as a safe-haven asset by investors around the world who see value In the Swiss economy overall.
Although the chart is a monthly one, the huge swing in the price range of over 3000 pips in August 2014 worried institutional investors and traders, and that, ….
coupled with the Swiss National Bank’s abandonment of its cap on the Euro of 1.20 francs, which in January 2015 saw the EURCHF pair collapse to 0.8052 with some brokers, before recovering ground eventually to 1.04. Many traders were ruined by the unexpected move, and firms, including the Forex broker Alpari, went broke.
The Swiss National Bank has publicly stated on many occasions that it would defend the Swiss franc against strengthening with other currencies, especially the euro and the United States dollar because a strong Swiss franc means that exports become expensive and makes the country less competitive and that this is bad for the Swiss economy.
They either intervene to sell their currency or threatened to do so, and that coupled with the huge swings in price action which we have just shown you mean only one thing; traders are extremely cautious about trading the franc, which is prone to spikes, and shock moves caused by the Swiss National Bank intervening in the money markets.
That, however, has not stopped the Swiss franc being bought during this extremely volatile time, which has largely been brought about by the covid pandemic, where economies such as the United States and Europe have been badly affected, and of course, the current theme around the United States presidential election which has been the impetus for the push below 0.900 for the USDCHF pair.
This is certainly one pair to trade with tight stops and where the bias to the downside remains for the foreseeable future.
Thank you for joining this forex academy educational video.
In this session, we will be looking at the EURUSD pair, which has found a recent bid tone at the time of writing and is approaching a significant area of resistance.
In this monthly chart, we can see the overall declining price action, which has been conforming to the trendlines from December 2007, where price reached a heady high of over 1.600 against the US Dollar, to a low in January 2017 of 1.0350. That’s quite a fall.
The continuation with the rejection of the declining resistance line and a failure at position A of price action to continue down to the support line gave rise to a lack of institutional sized sellers and a shallower support line forming around position B until price action reverted to the resistance line, where it eventually breached it at position C. This shows that institutional size traders were finding the Euro attractive than the US dollar at around the time of the Covid pandemic seriously affecting the United States economy, while the Europeans got to grips with the pandemic in terms of financial relief packages for EU citizens and businesses.
The big test for institutional size traders is whether or not this is just a breach and that price action will move back inside the channel to retest the shallower support line at position B or if there is a sustained move higher, which will be a failing of the monthly trend.
In this chart, we have reduced the monthly candlesticks to a daily chart to try and identify the section of price action which has been going on since the monthly resistant line was breached in order to try and ascertain where the levels are where we might find further resistance and which might cause price action to revert back into to the monthly channel or to try and identify if the price action will continue outside of that trend and form a new bid trend.
In this chart of the daily time frame, we have identified a clear area of resistance at around 1.1950, followed by a period of support at around 1.1717, which eventually is breached to just above 1.1600, only for price action to find support here and move higher.
Price action has currently reached a double top formation, and with the original area of resistance only around 50 pips above it, the next test will be to see if the price action will continue up to the resistance line, then move above it, fall back to it and where that then becomes an area of support – such as our hypothetical arrows – and that price action will conform a continuation to the upside and the end of the monthly bear channel.
Conversely, should price action move back below the support line, and then back up to it, and fall lower and where they support line becomes an area of resistance, again – such as our hypothetical arrows – this will tell institutional traders that the breach of the monthly trend may see price action fall back in line with the bear trend.
New traders are advised to look at the longer-term trading picture, such as the daily and monthly charts because this is where the swing traders look for trading ideas, and this includes institutional size investors, and these types of traders have big money to play with, which will have a major impact on price direction in the forex market.
How to save a forex trade with no stop loss with the use of hedging!
Thank you for joining this forex academy educational video.
If you are relatively new to trading, you will no doubt understand what it is like to be in a losing trade, and what it feels like losing money, and seeing your profit and loss fall. It is uncomfortable
Unfortunately, this is all a part of trading. Losing is a part of winning. The most important thing is that you win more money than you lose in order to sustain a profitable account.
One of the biggest areas that new traders fall down is a lack of understanding of leverage and a lack of understanding of money management, and risk management, all subjects for another video.
And the biggest aspect where traders lose money is because of a lack of setting a reasonable stop loss in accordance with their account size, and where quite often new traders will lose all of their money in their accounts on a single trade.
This is purely down to poor risk management and not incorporating a tight enough stop loss. But what if you have been implementing strict money management and tight stops, but simply forgot to put one on a trade which is running against you and where you are starting to worry. What are your options?
Let’s say that you identified a potential short trade, for example on this one-hour chart of the GBPUSD where you noted areas of support and resistance in a wedge formation and thought that the price action would punch through at position A, because the pair was also overbought. The technical analysis is not important.
And so let’s imaging that you have gone short in half a lot at 1.2939, and you forgot to put a stop loss for whatever reason, and the pair has shot out of the wedge formation so the upside. What are your options?
You already know the answer to this option: close the trade, take the loss, learn the lesson, and move on.
Another option would be to hedge the position, should your account size allow you to do so. This would mean that you simply buy a half a lot – the same size as your short trade, as we have done here at position B, at 1.3075. In which case, you have two open positions in the same lot size, which are effectively maintaining the losing position balance. However, this gives you an opportunity to have think about the trade and consider other options to try and salvage some of your losing funds.
The most important thing for any trader is to protect his or her profits and not how messy it might look with regard to winning and losing trades.
If you feel that the trade is running out of steam to the upside and about to reverse, you have the option of going short again at position B, in this example, in a minimum of a half of a standard lot, and in the event that the trade falls back 50% of the way to your original open position you will have a net position, which you can either close both trades, or let it run back down to the original opening trade at position A, where you will be in profit, and manage that trade should it come lower, which might mean closing trade A out and letting the second B trade run on.
Another option is to buy a standard lot at position B, in this scenario, which is double your original size, and will have the effect of reducing your loss to zero and even turning into a profitable trade should it move higher to a point being approximately 50% higher than total spread of your losing trade, less your original spread and commission.
You then have the option that if and when the trade becomes net, to close out both trades, or just close the losing trade from position A, and let the B trade run on. Use a tight stop loss at the net position to protect your profit.
All of these options are risky and with the exception of the original hedge, require tight stop losses. Again, the most critical factor is the protection of your profits, and quite often these options will help you out of a trading nightmare. Although this scenario was based on an original short trade going wrong, it applies to a long trade and any financial asset.
Joe Biden President-Elect? How might the markets react long term?
Thank you for joining this forex academy educational video. In this video, we will be looking at the present, with Joe Biden of the democratic party as President-elect.
At the time of writing, Joe Biden would appear to have an unassailable lead in the US presidential elections. No doubt, President Trump will use every tool and trick at his disposal to try and hang on to power, including legal intervention in what he calls fraudulent voting, which, according to the press, is totally unfounded.
However, with votes still being counted in a handful of remaining states, and with Joe Biden well out in front, it would appear ear that he has one foot in the White House already.
What would this mean for the financial markets?
The Democrats, headed by Joe Biden, have lambasted Trump’s policies over the last 4 years. They will likely try and reverse many of the policies implemented by the Trump administration. One of the Democrats’ election pledges was to impose extra corporate regulation, taxes, and healthcare spending, all of which would be negative for the stock markets in the United States unless, of course, they are healthcare-related, or in the green sector, where Joe Biden has pledged to spend more money, to reduce greenhouse gases. Joe Biden has pledged to give the country a leading role in global efforts to curb climate change, a reversal in direction from the Trump administration where Donald Trump withdrew from the Paris climate agreement in 2017.
Another policy that has helped Joe Biden gain votes is his pledge to penalize companies, presumably by taxation, that moved jobs abroad. This will undoubtedly have been why the Midwest saw a surge in Democratic votes because it is the industrial heartland of America, the so-called Rust Belt.
In a twist, where investors might have bailed out of stocks due to a potential shift in policy under a new administration, with regard to higher taxes for corporations and more regulations, which would tie the hands of corporate companies and potentially affect their earnings capabilities, the markets have been airing on the side that a potential democratic party victory may be the quickest route to a generous government stimulus continuation package, and this of course, in the current economic uncertainties, would be a welcome thing.
In the lead up to the election, we can see here that the US dollar index, which is a measure of the dollar value against the basket of major currencies, the price has fluctuated between 92.00 and 94.00 since mid-August, with pressure currently to the downside at the time of writing.
One of the biggest gainers against the Dollar has been the Swiss franc, where the USDCHF pair fell below the 0.900 level on Friday 6th November as the franc was being bought as a safe-haven asset. The last time the pair hit this level was in 2014.
Another asset that is bought in times of uncertainty is the Japanese yen. Here we can see that also on the 6th of November, the USDJPY currency pair fell below the key 104.00 level to reach 103.37, and analysts will be looking to the low in March of this year where the pair fell below the 102.00 level and possibly a test of the 101.00 exchange rate.
And while the euro and pound have also made gains against the United States dollar, the Dow Jones 30 industrial index has flattened just above 28,000, as buyers try to figure out the actual winner of the presidential election, which as mentioned looks very much like Joe Biden, and what the democratic policies are likely to do for the American economy as previously stated.
Extreme volatility has prevailed over the last few weeks, and that is likely to do so in the following days and weeks until whoever actually wins the next president of the United States.
Longer-term, the markets will be looking at Democratic policies if they officially win the election and be looking for them, will they, won’t they, covid stimulus package to be agreed upon by the Democrats and Republicans.

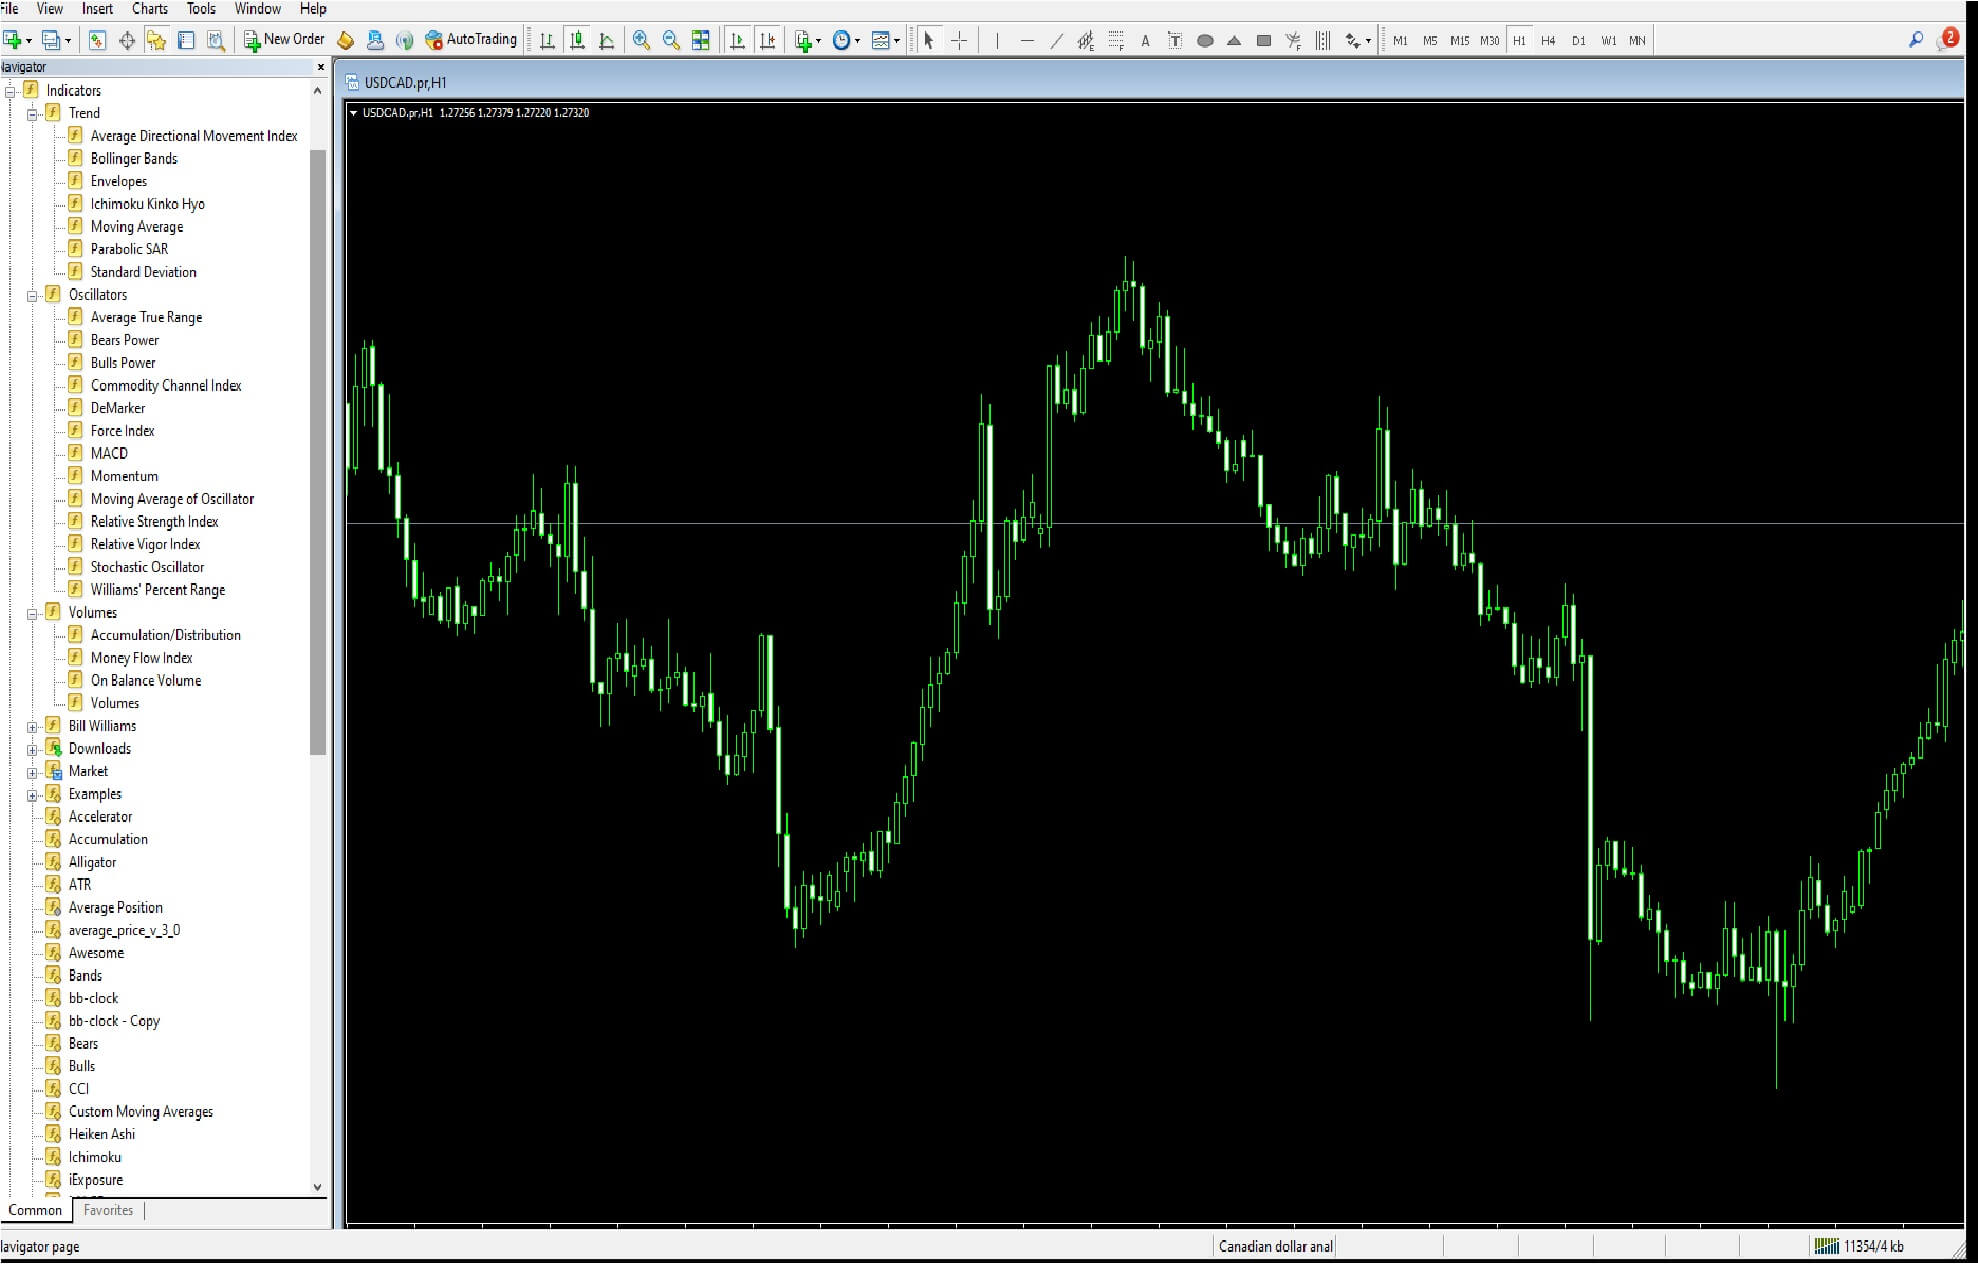
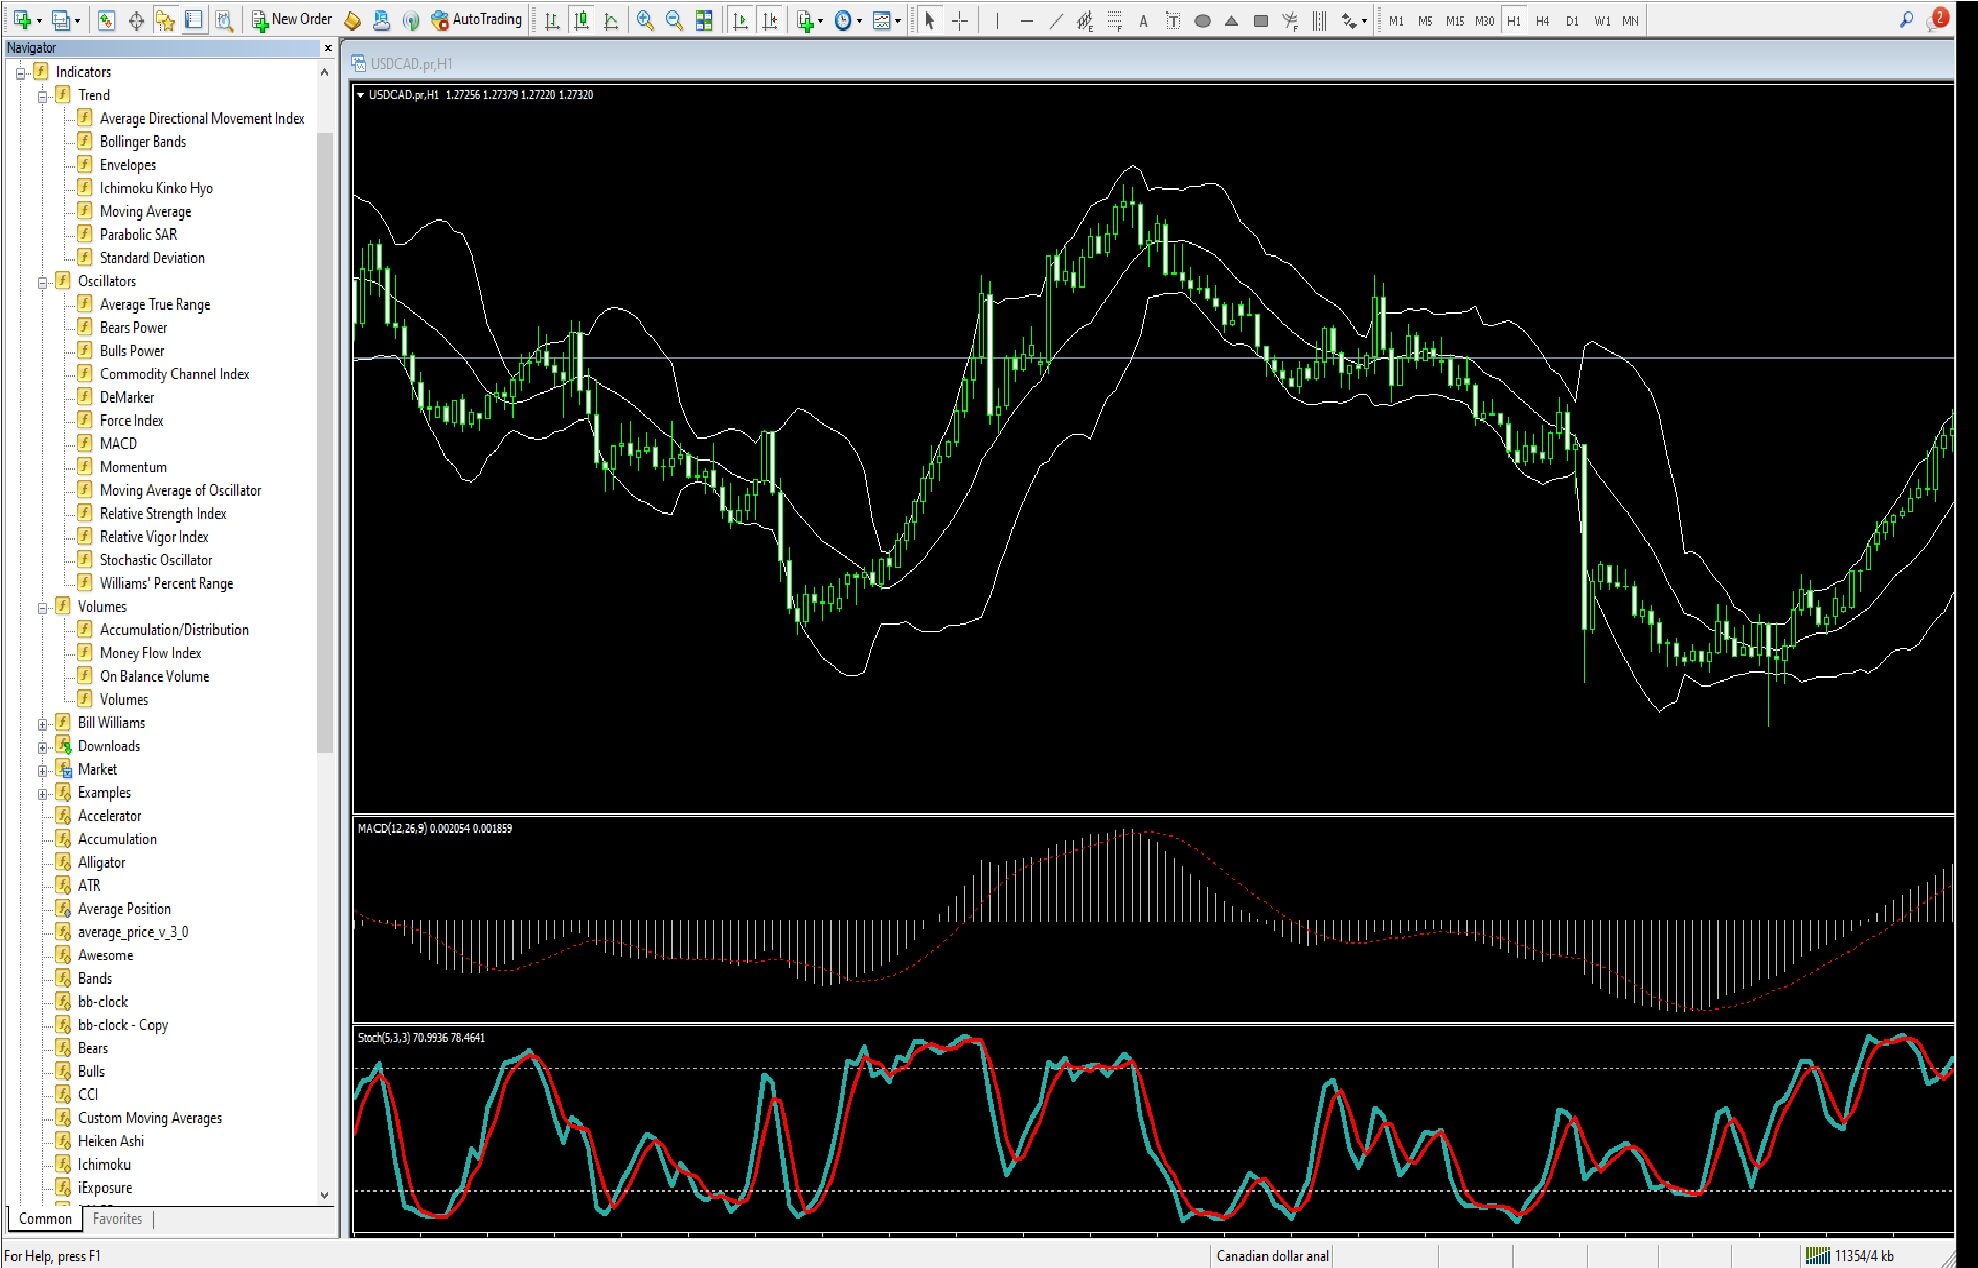
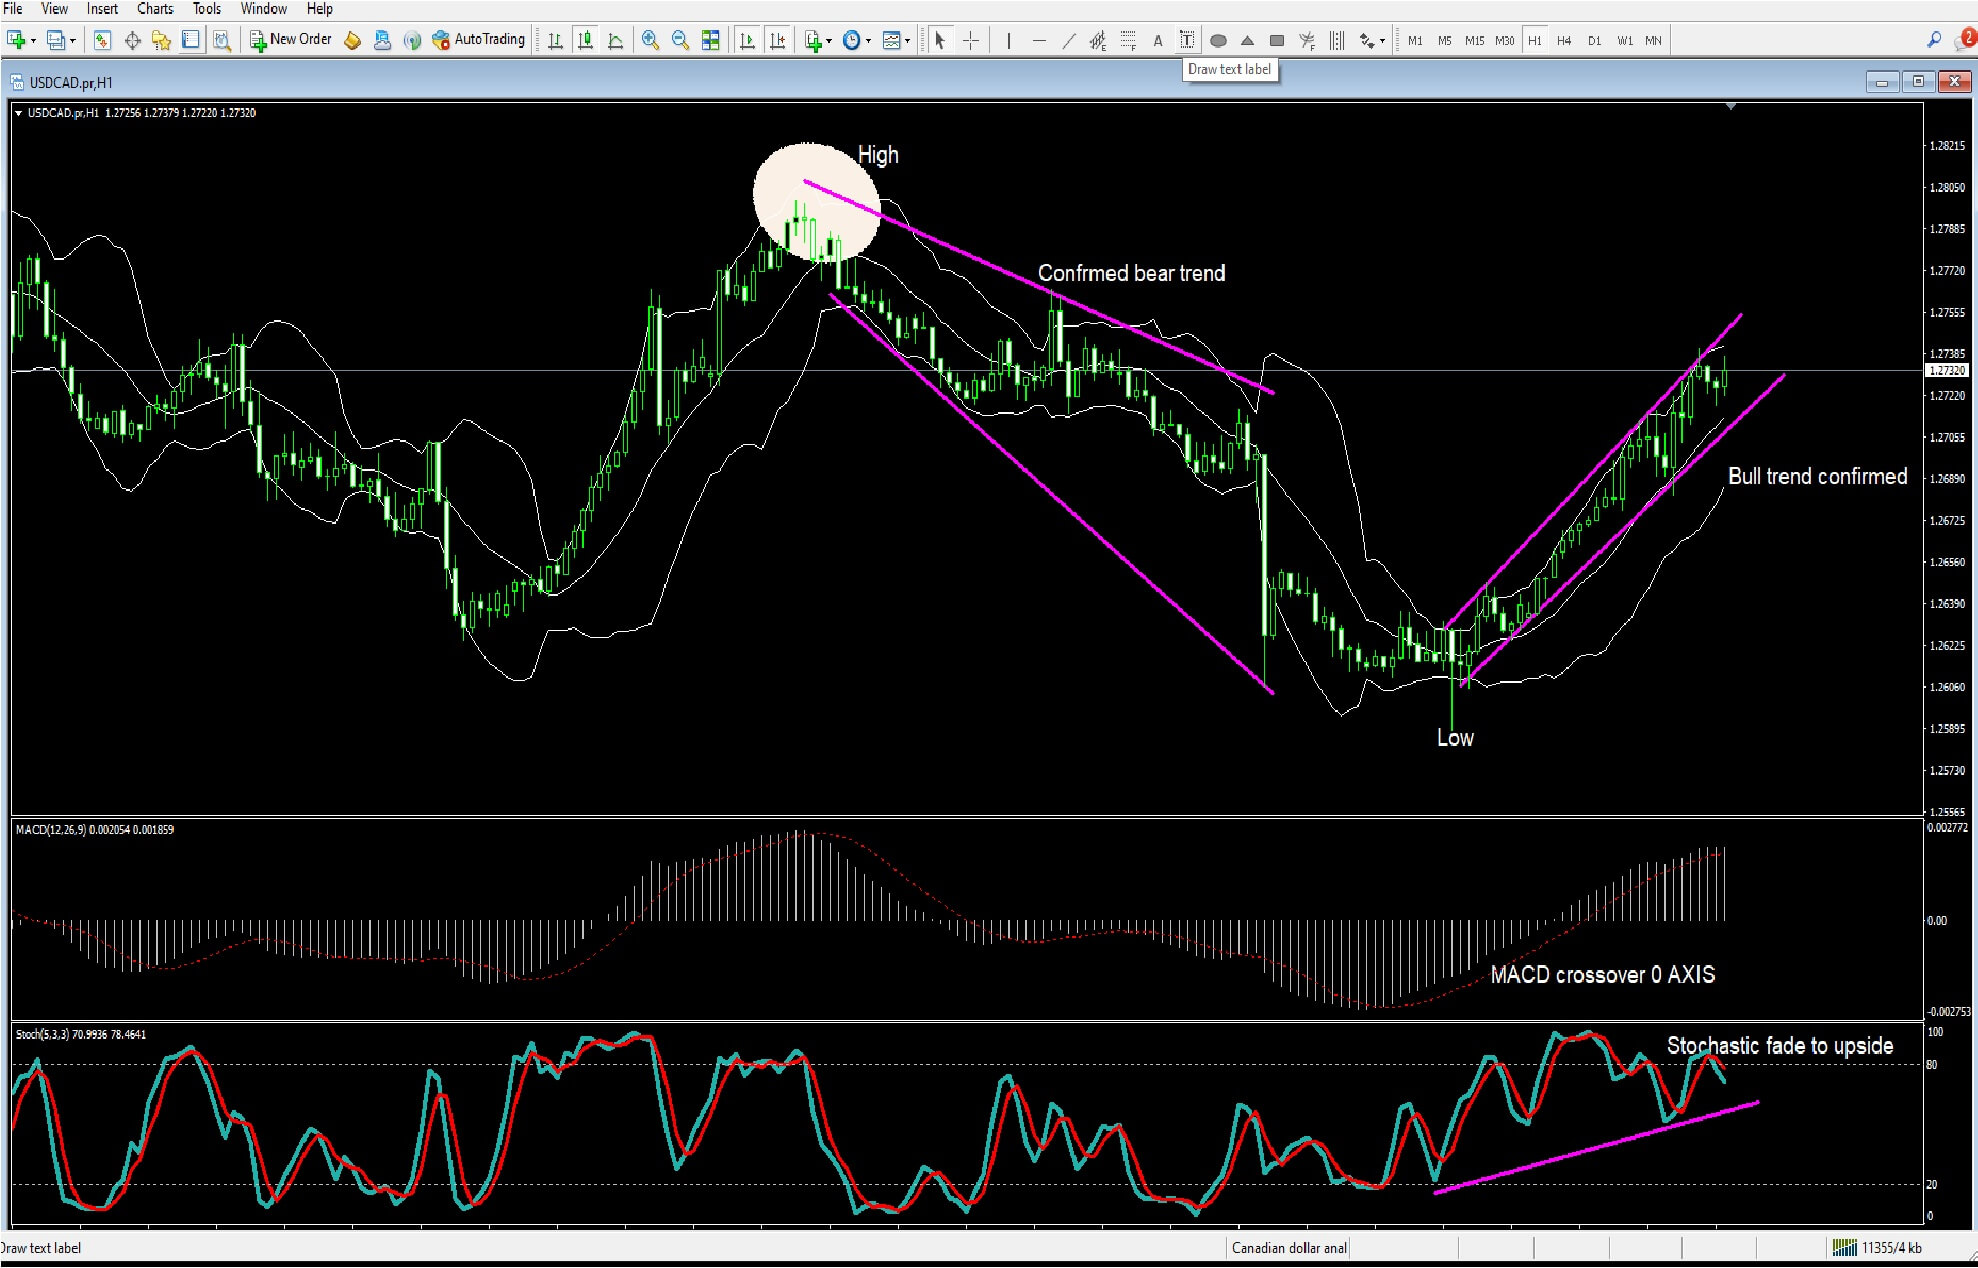
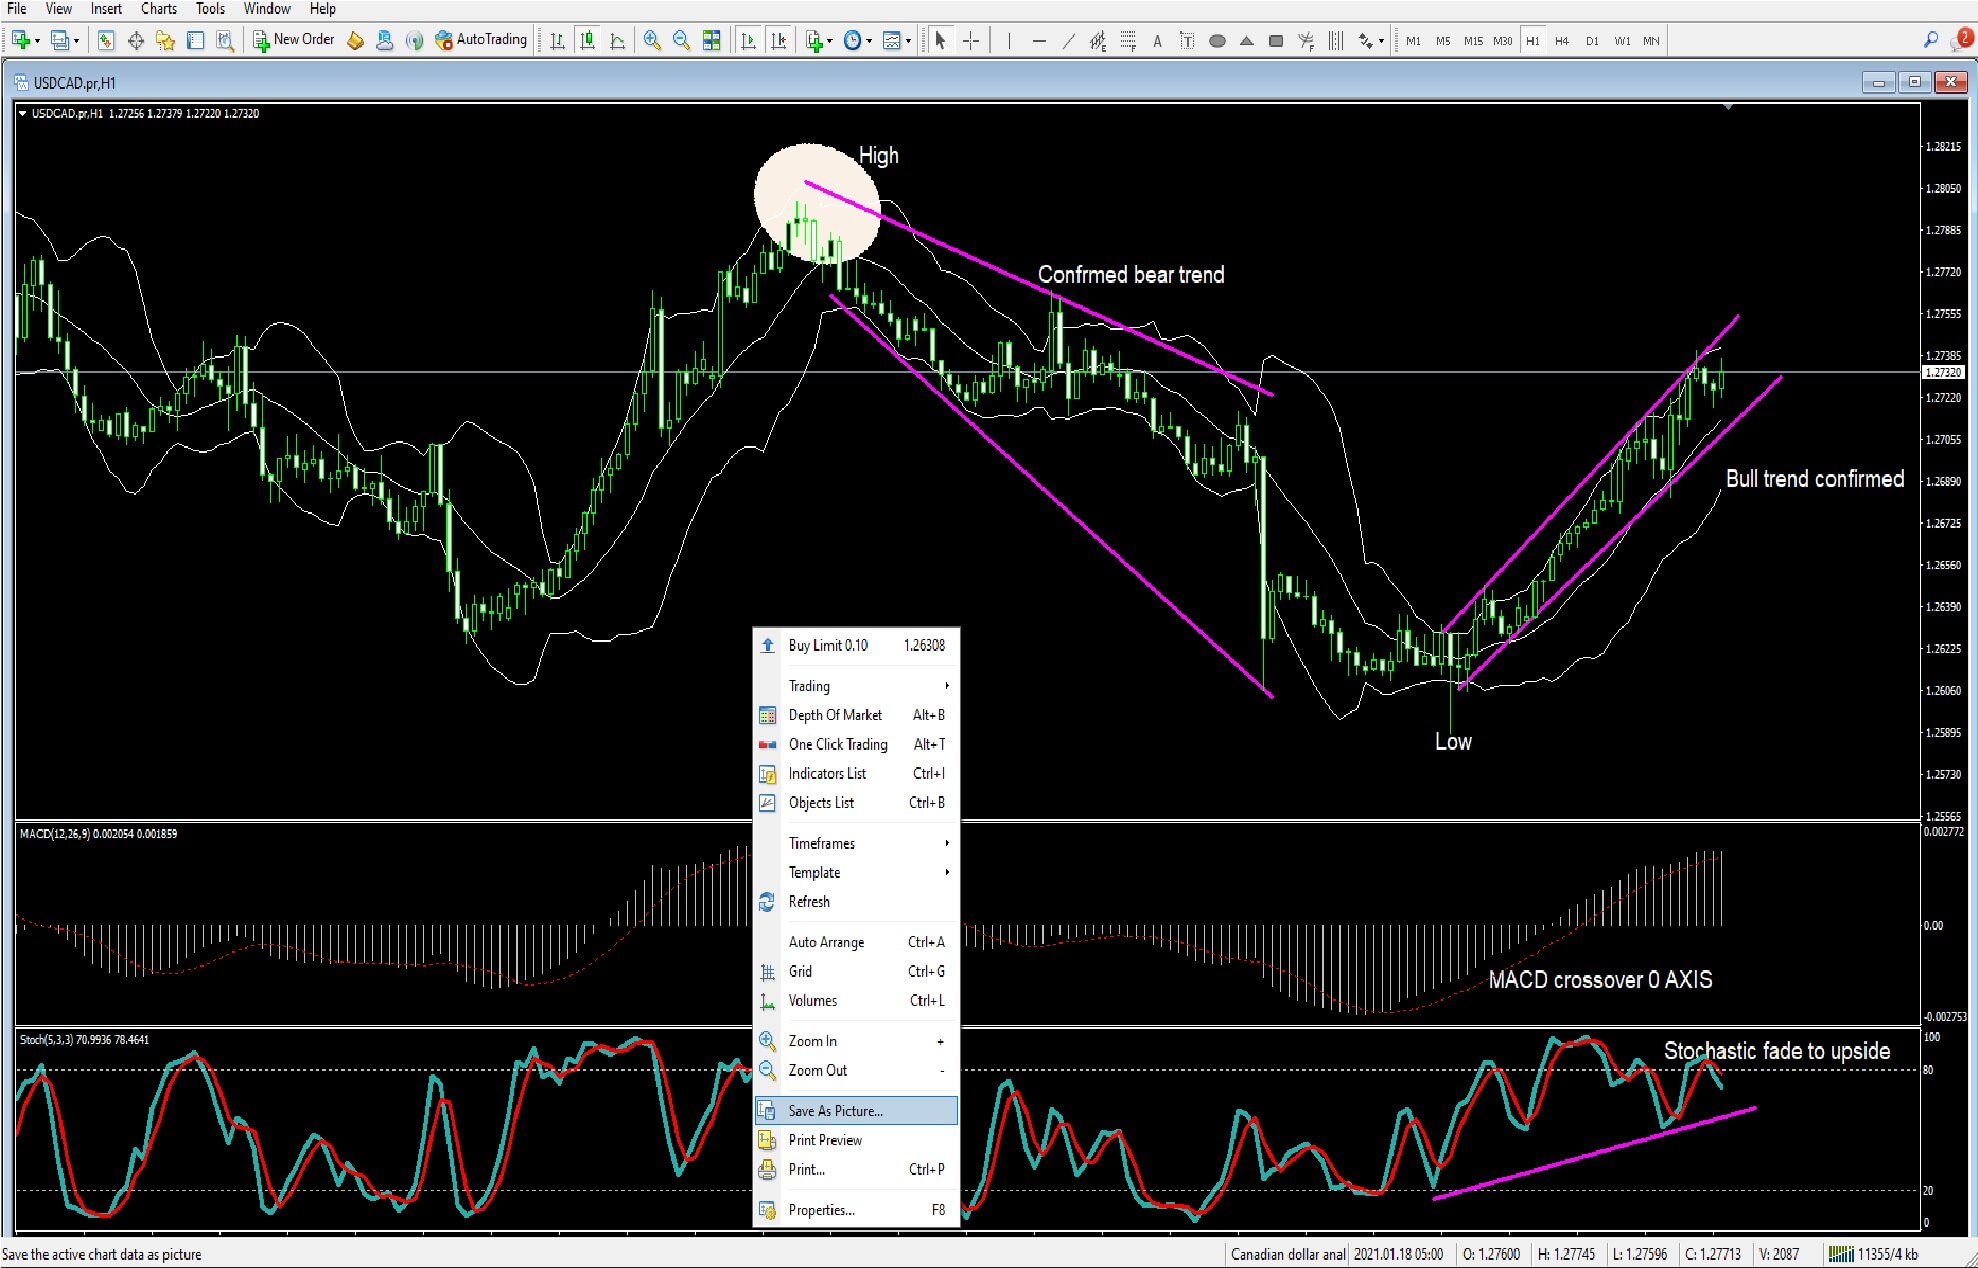
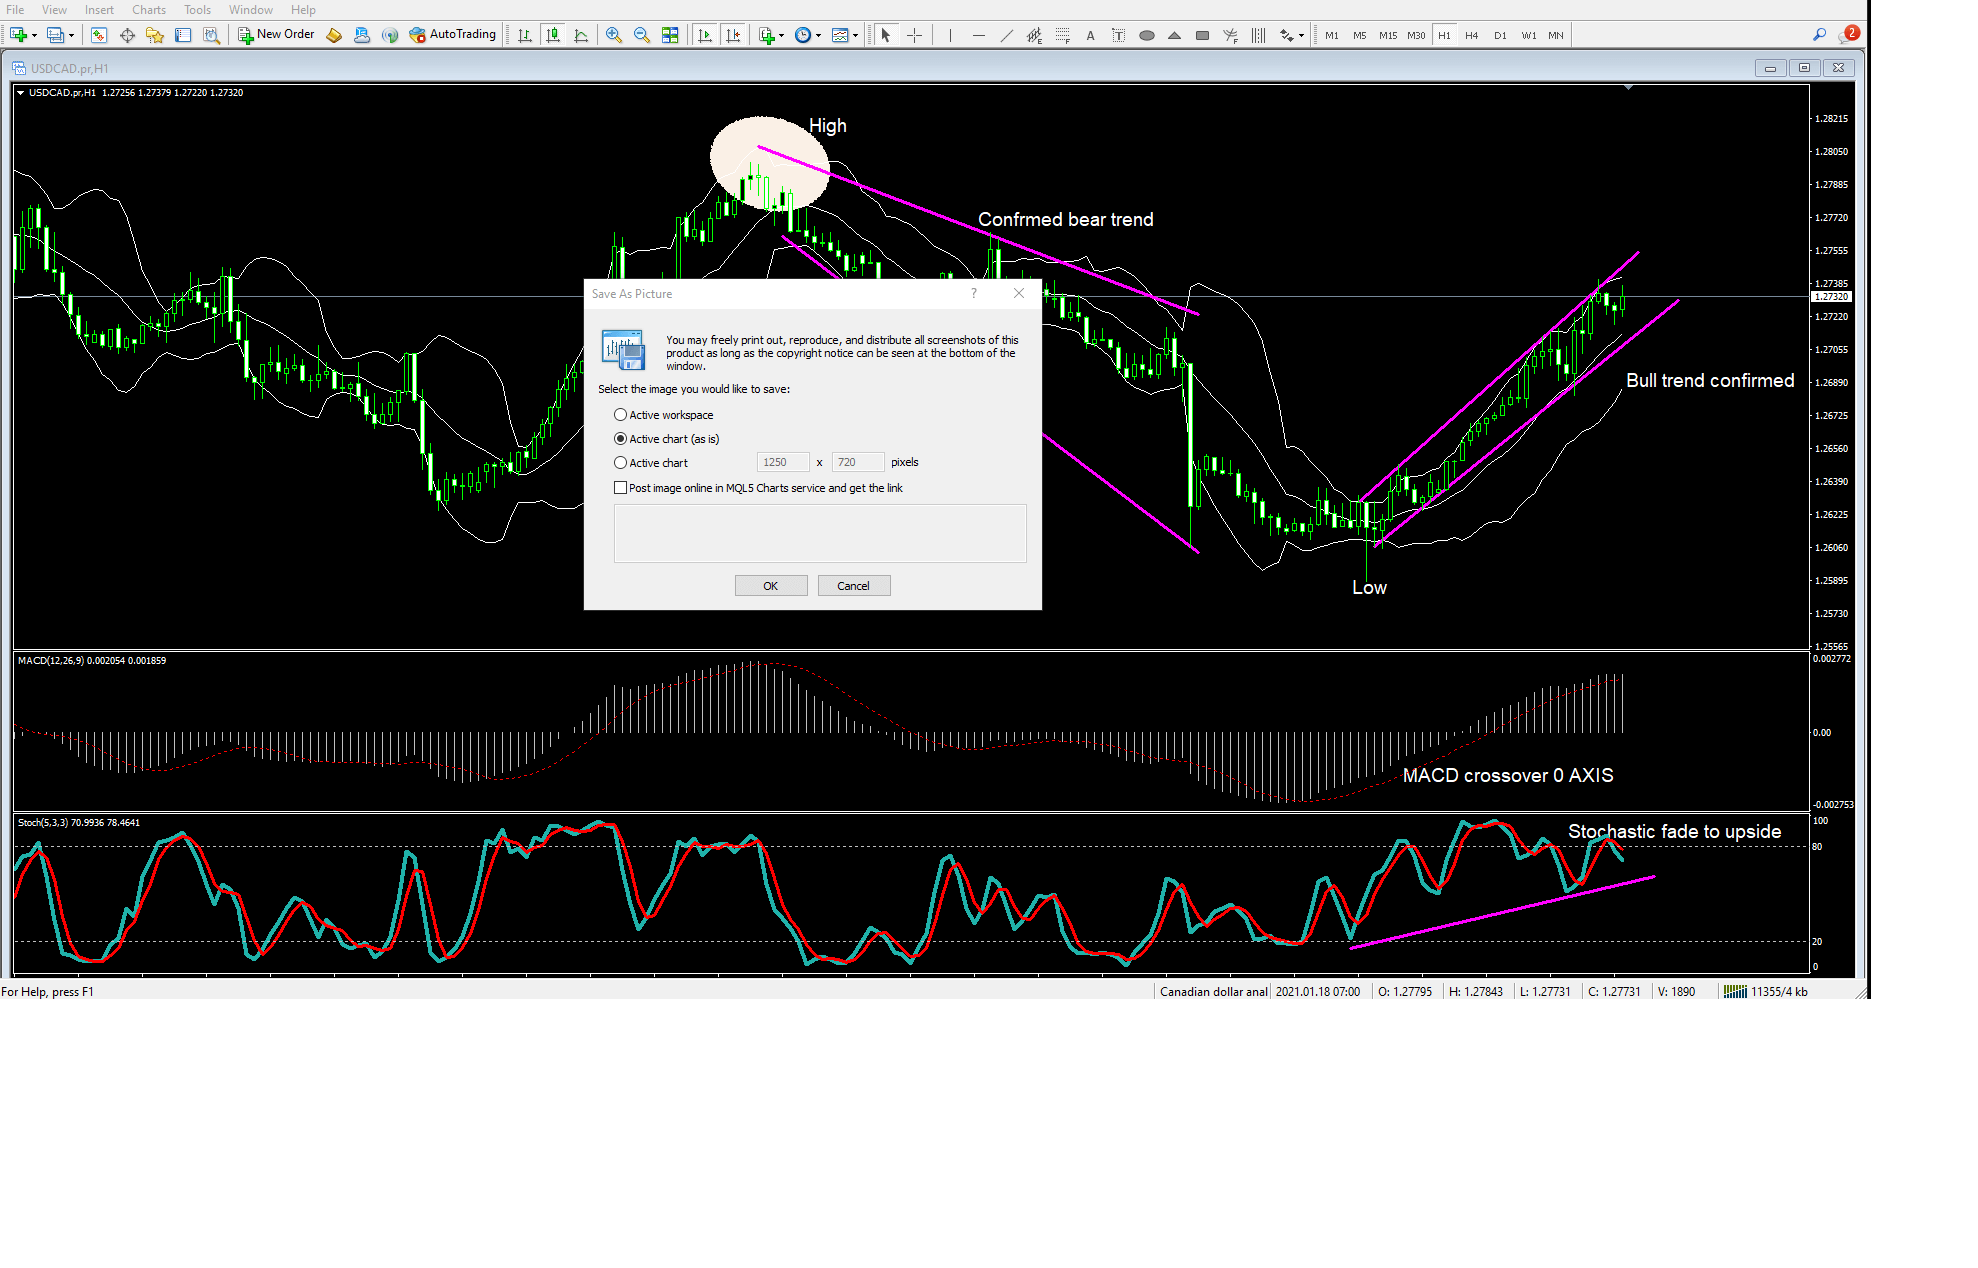
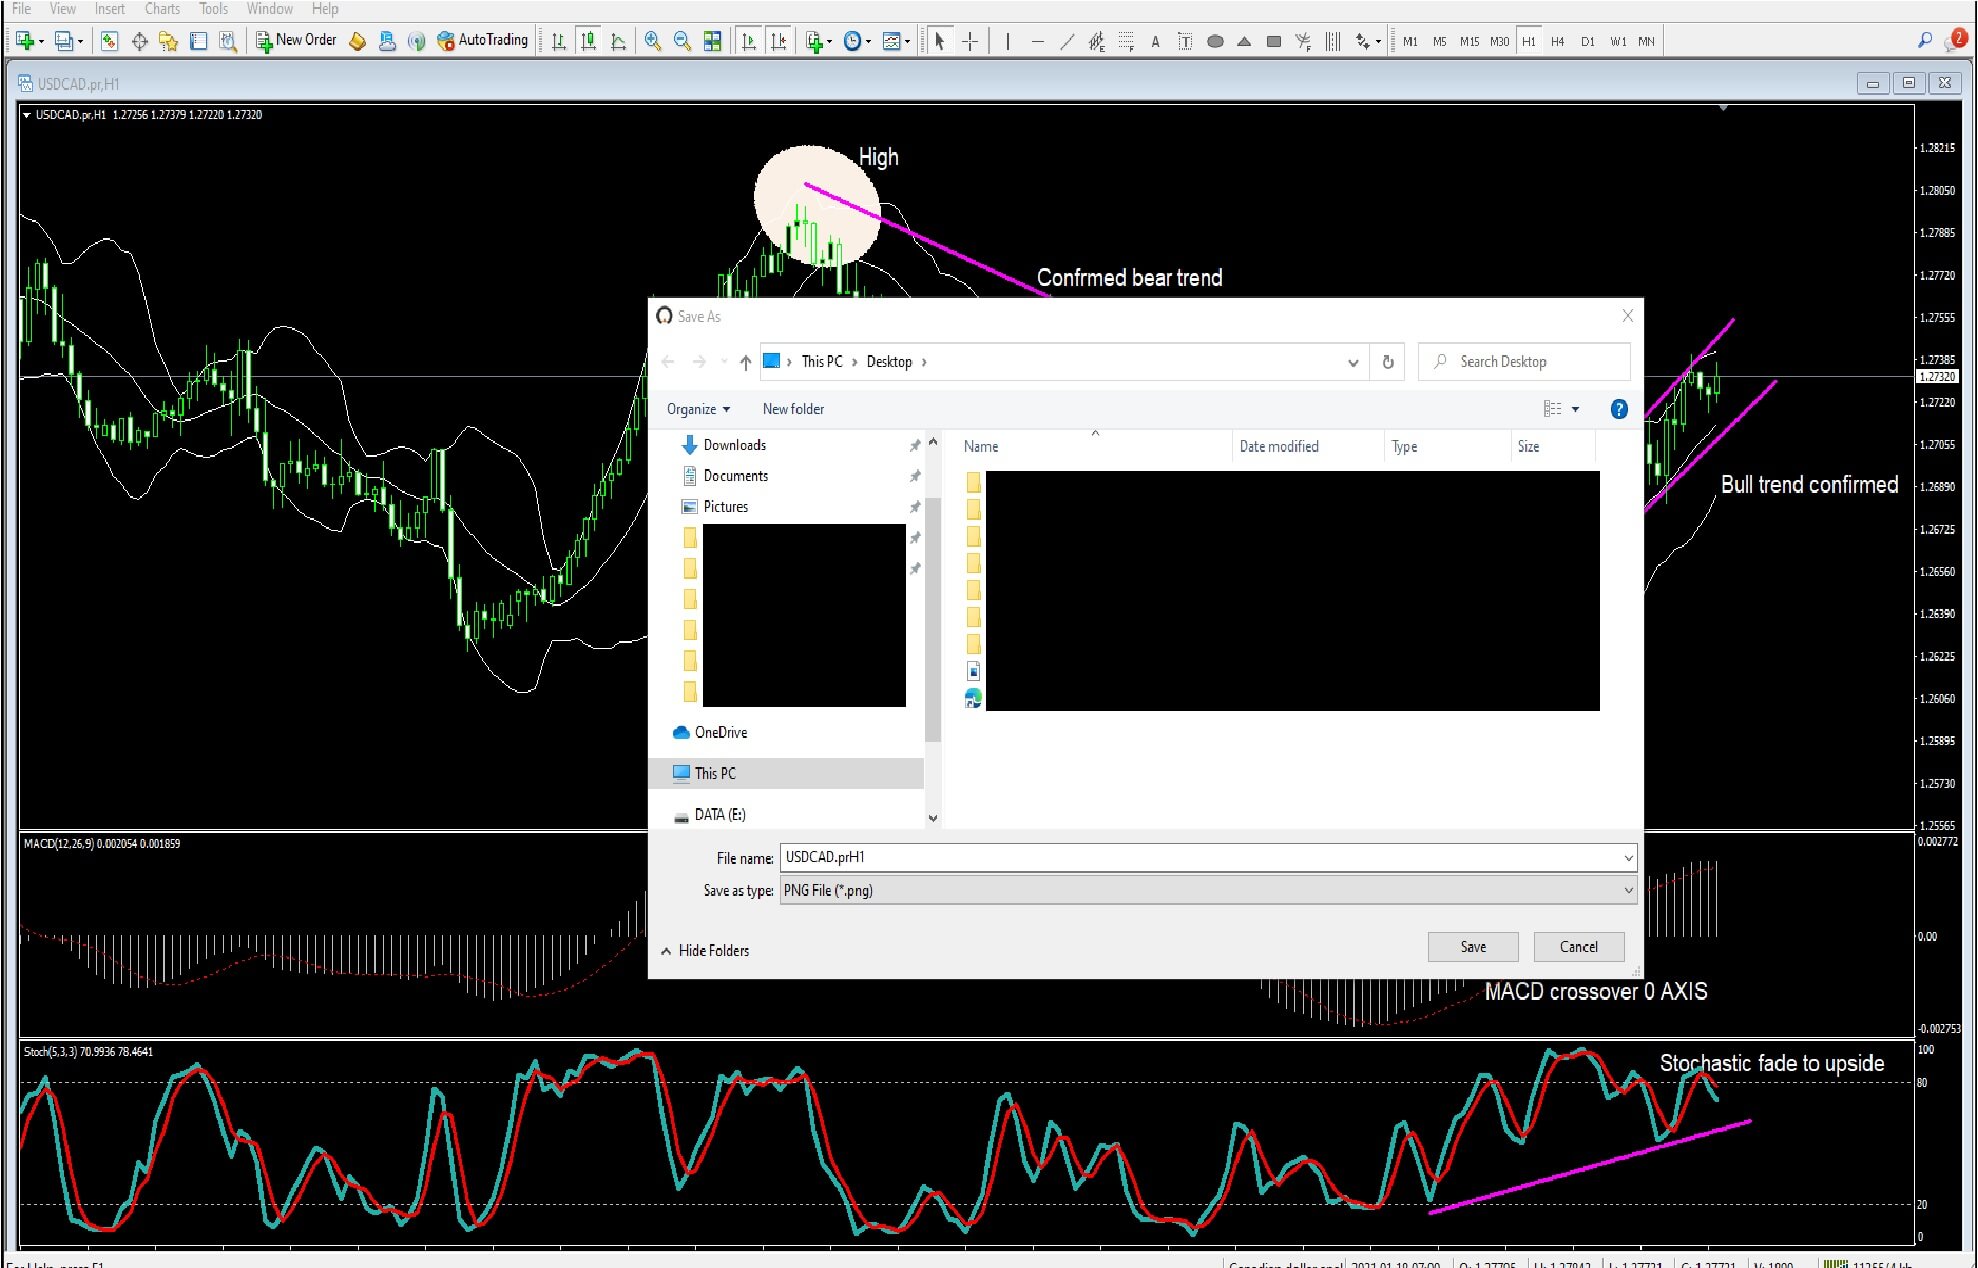

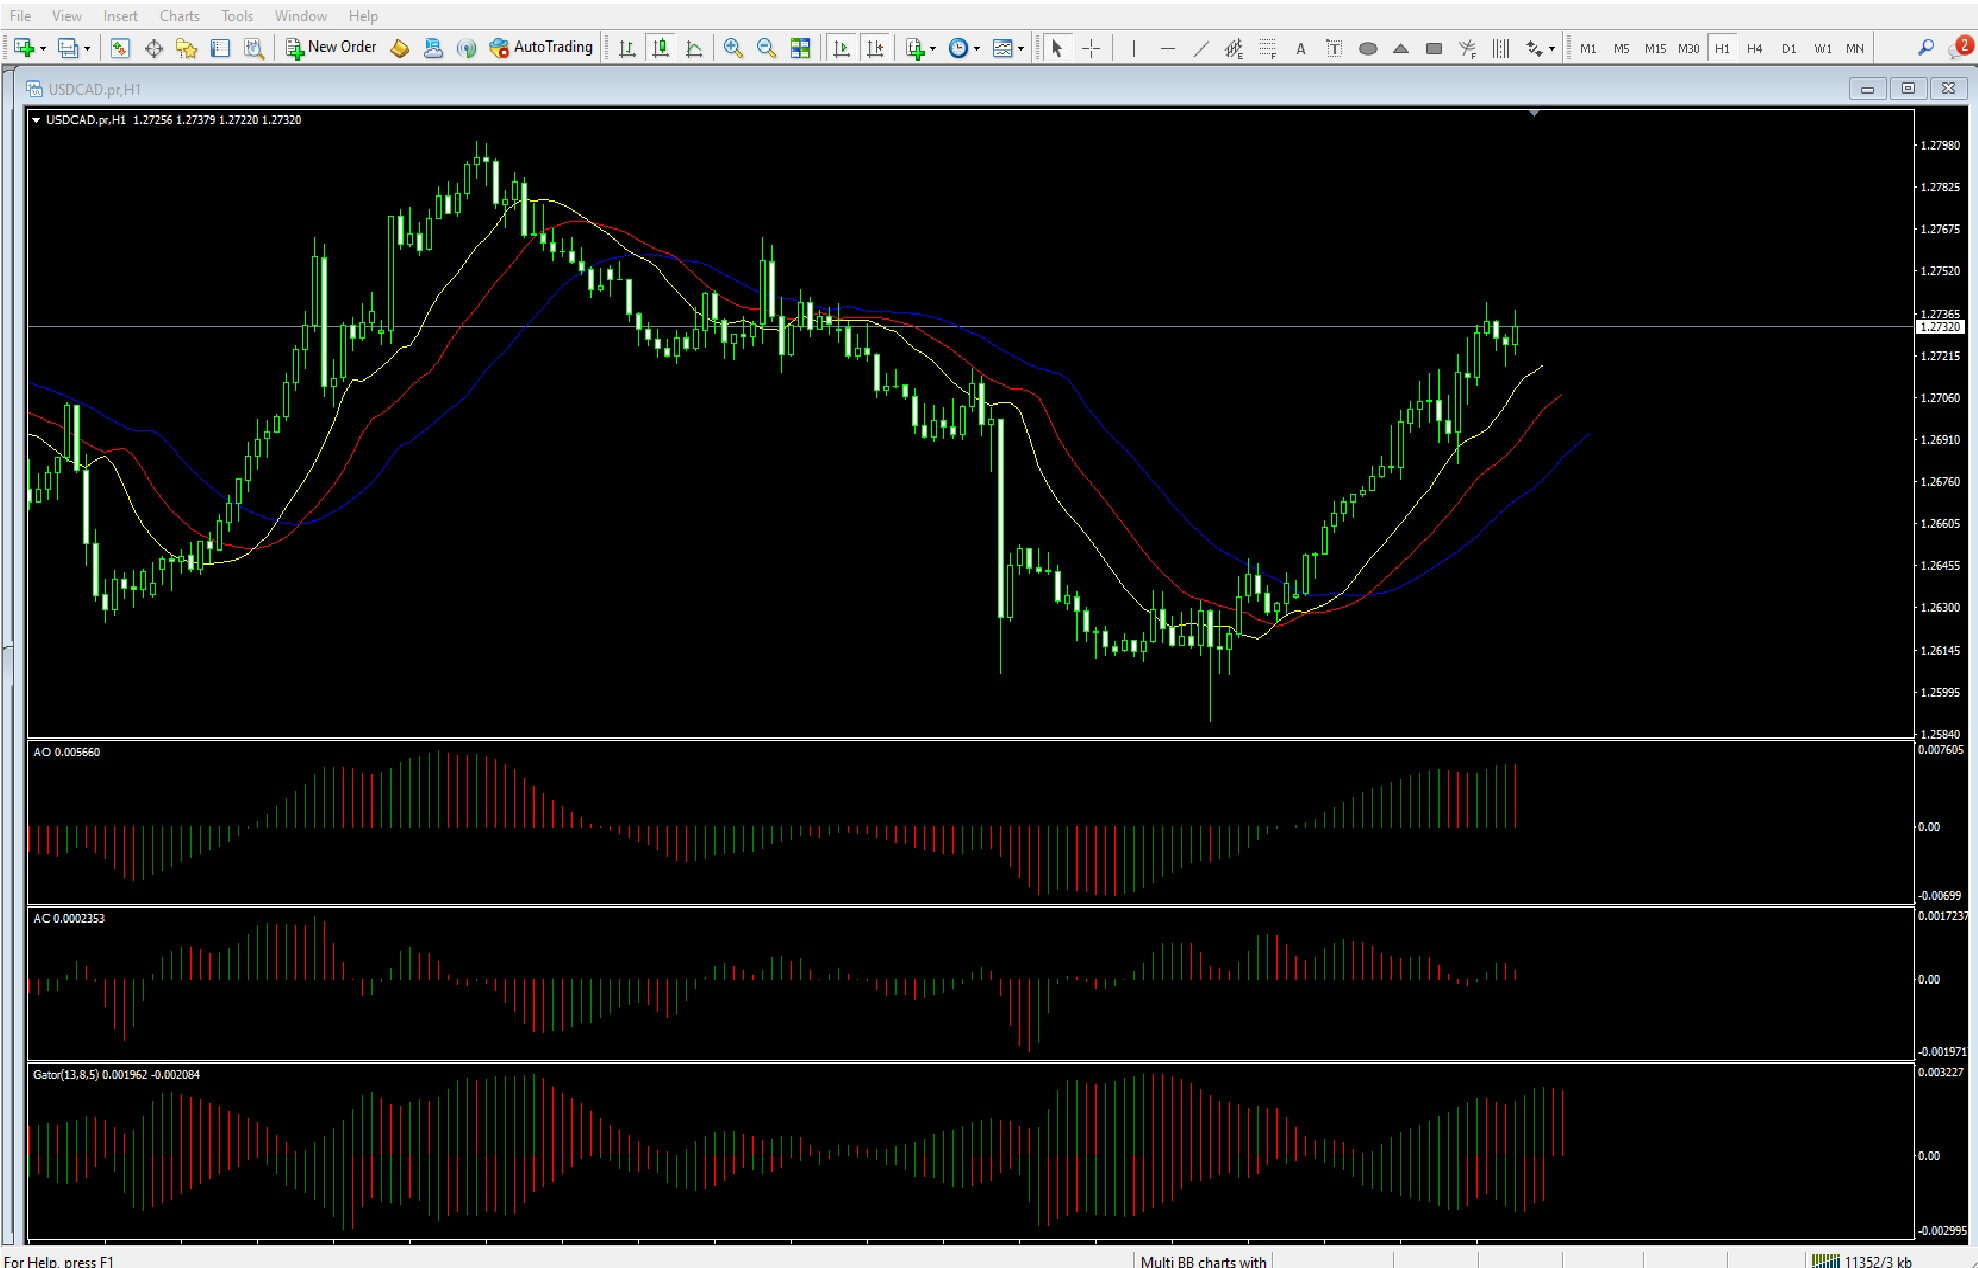
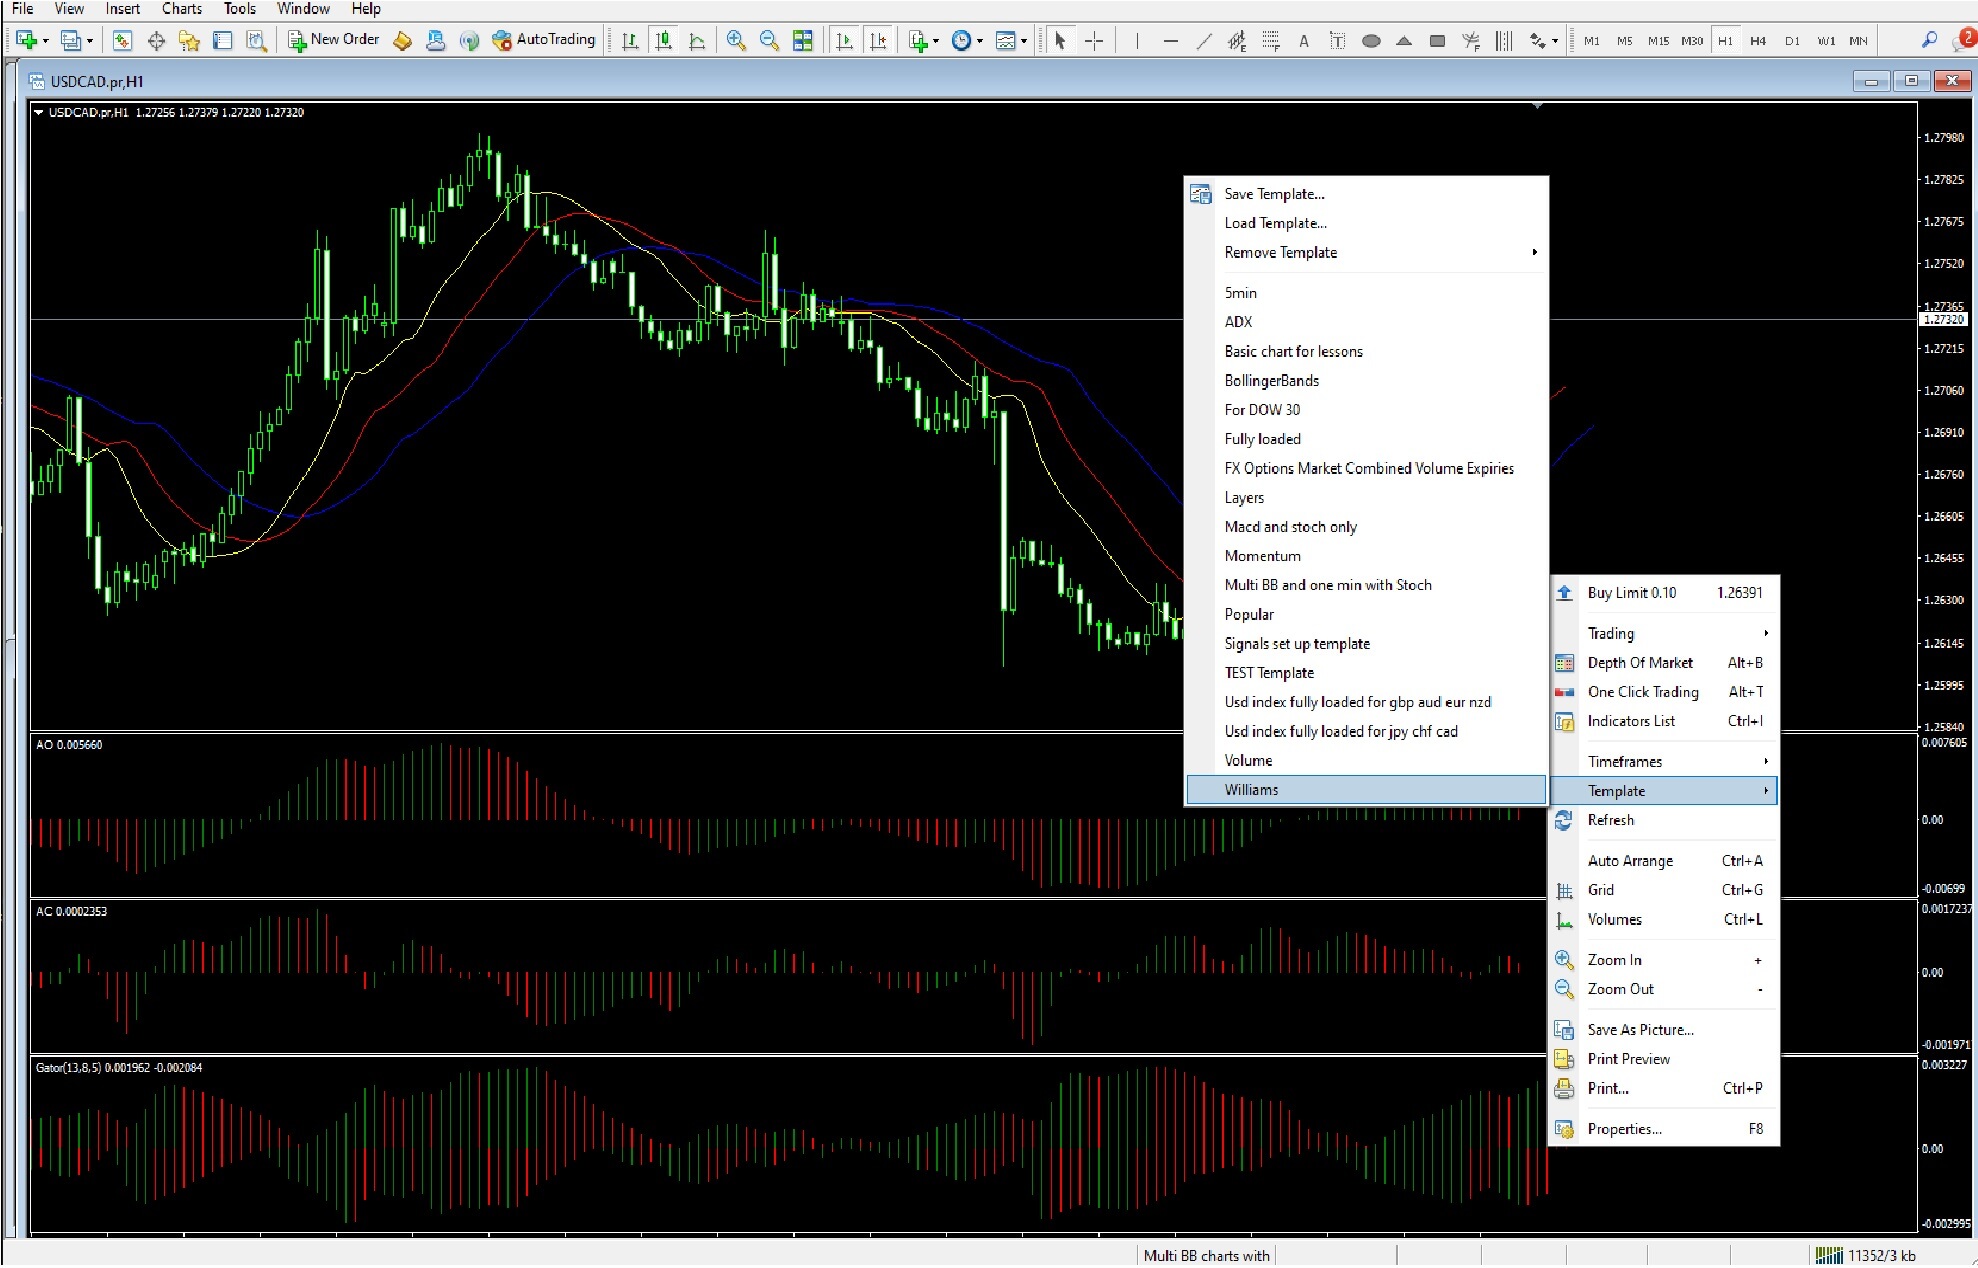
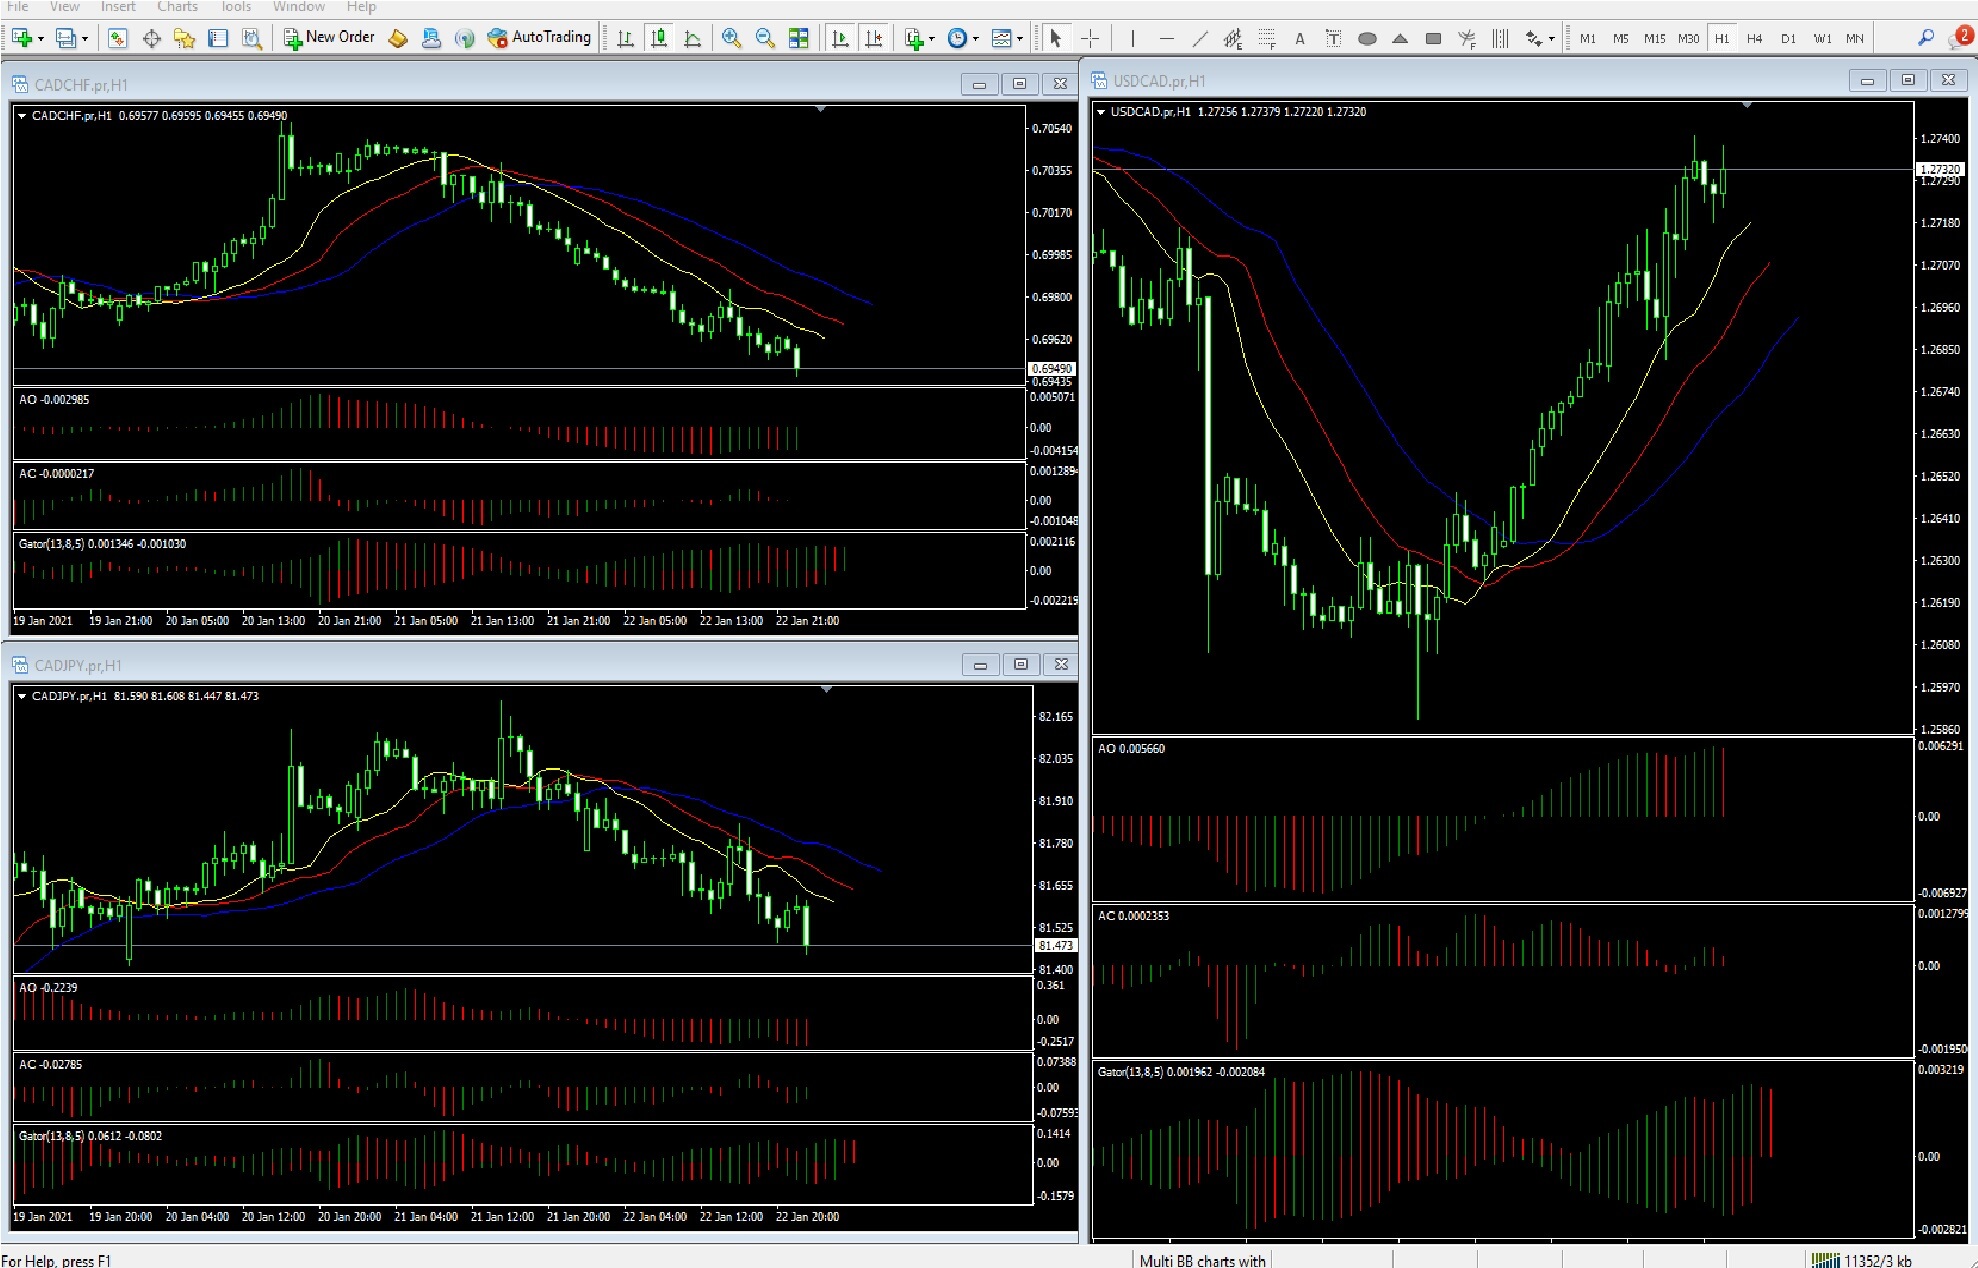
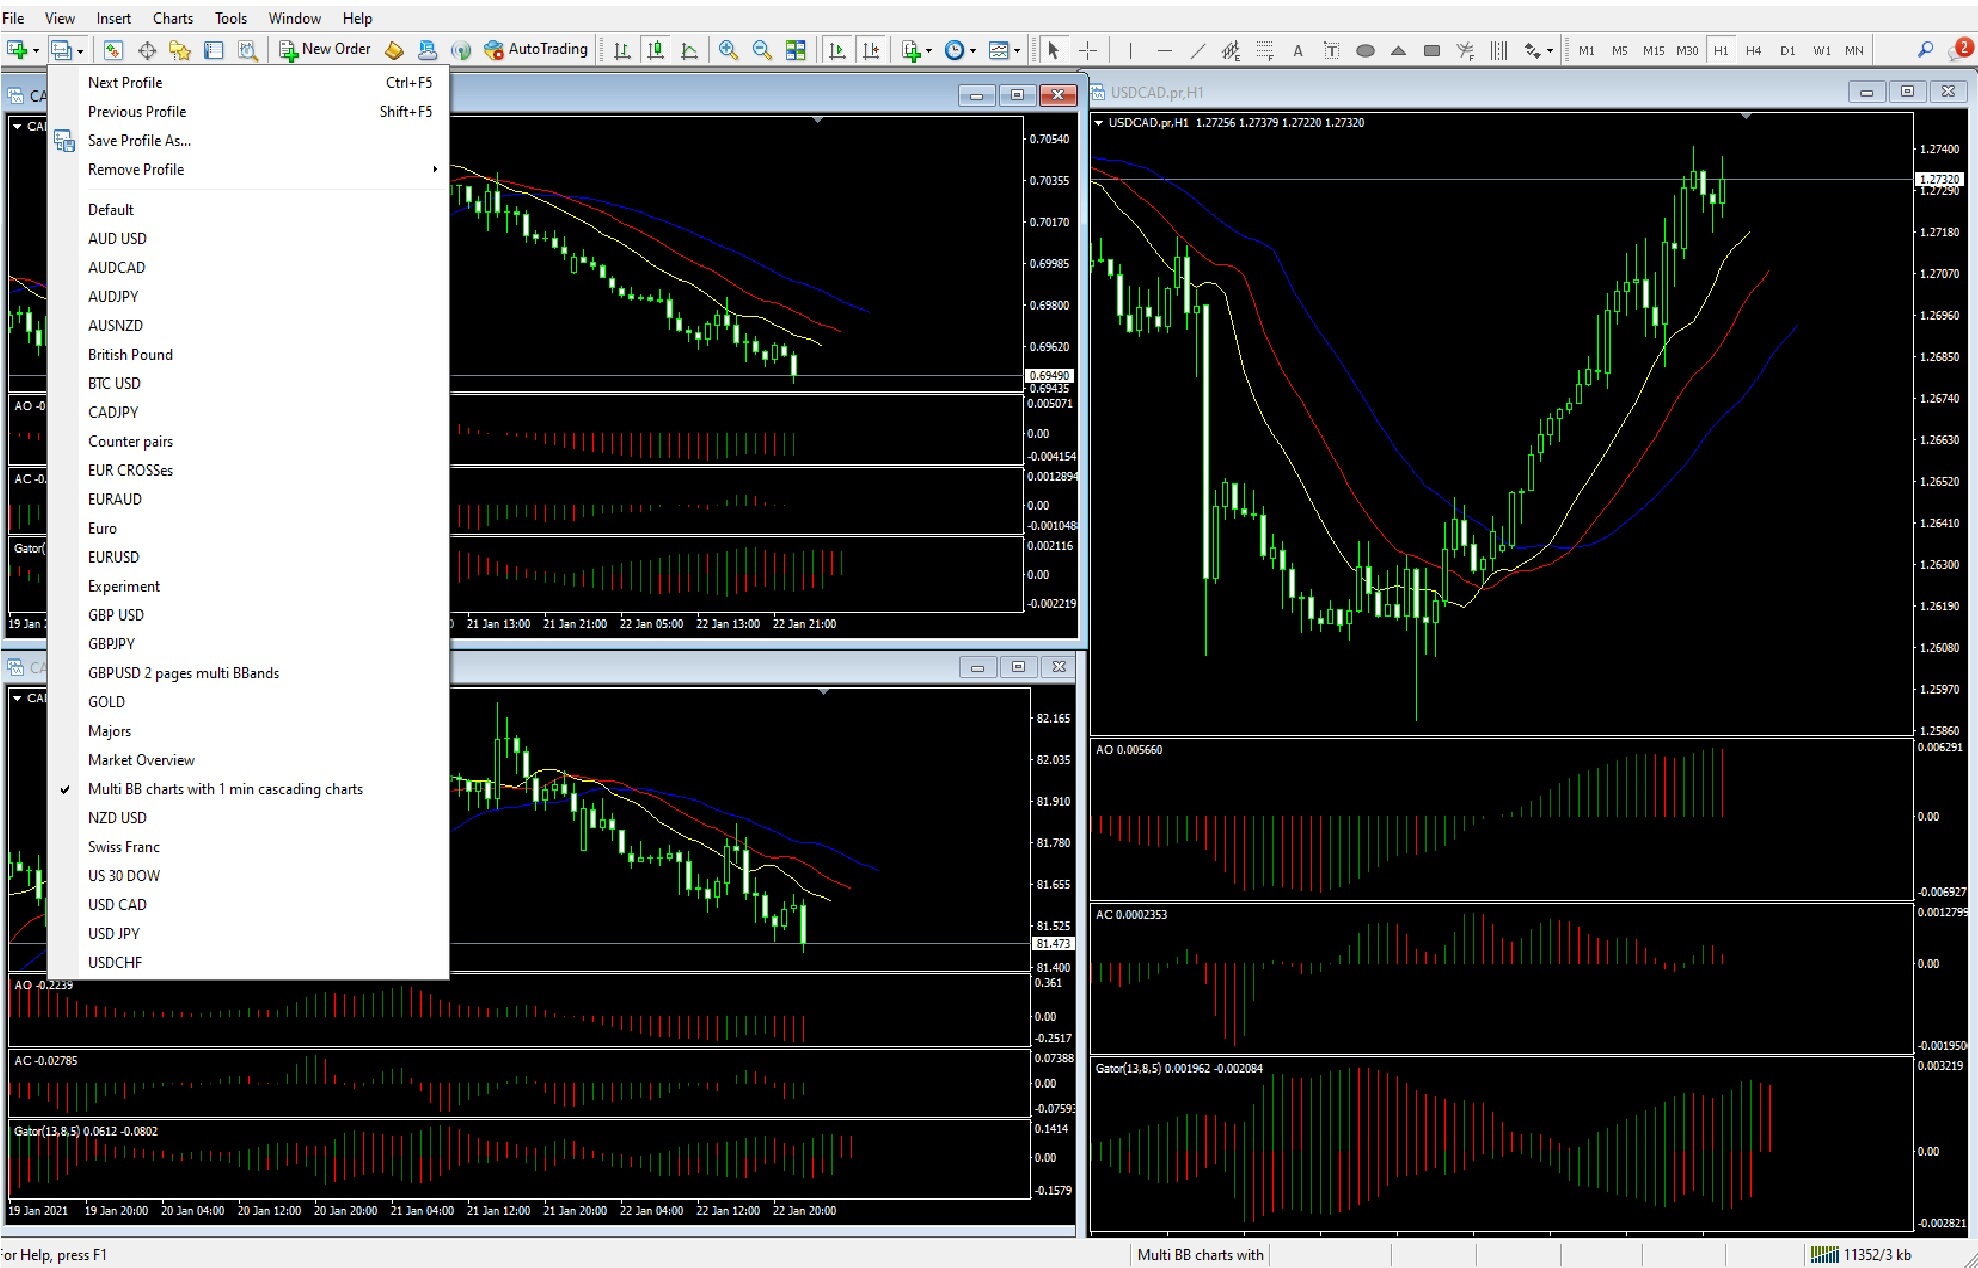
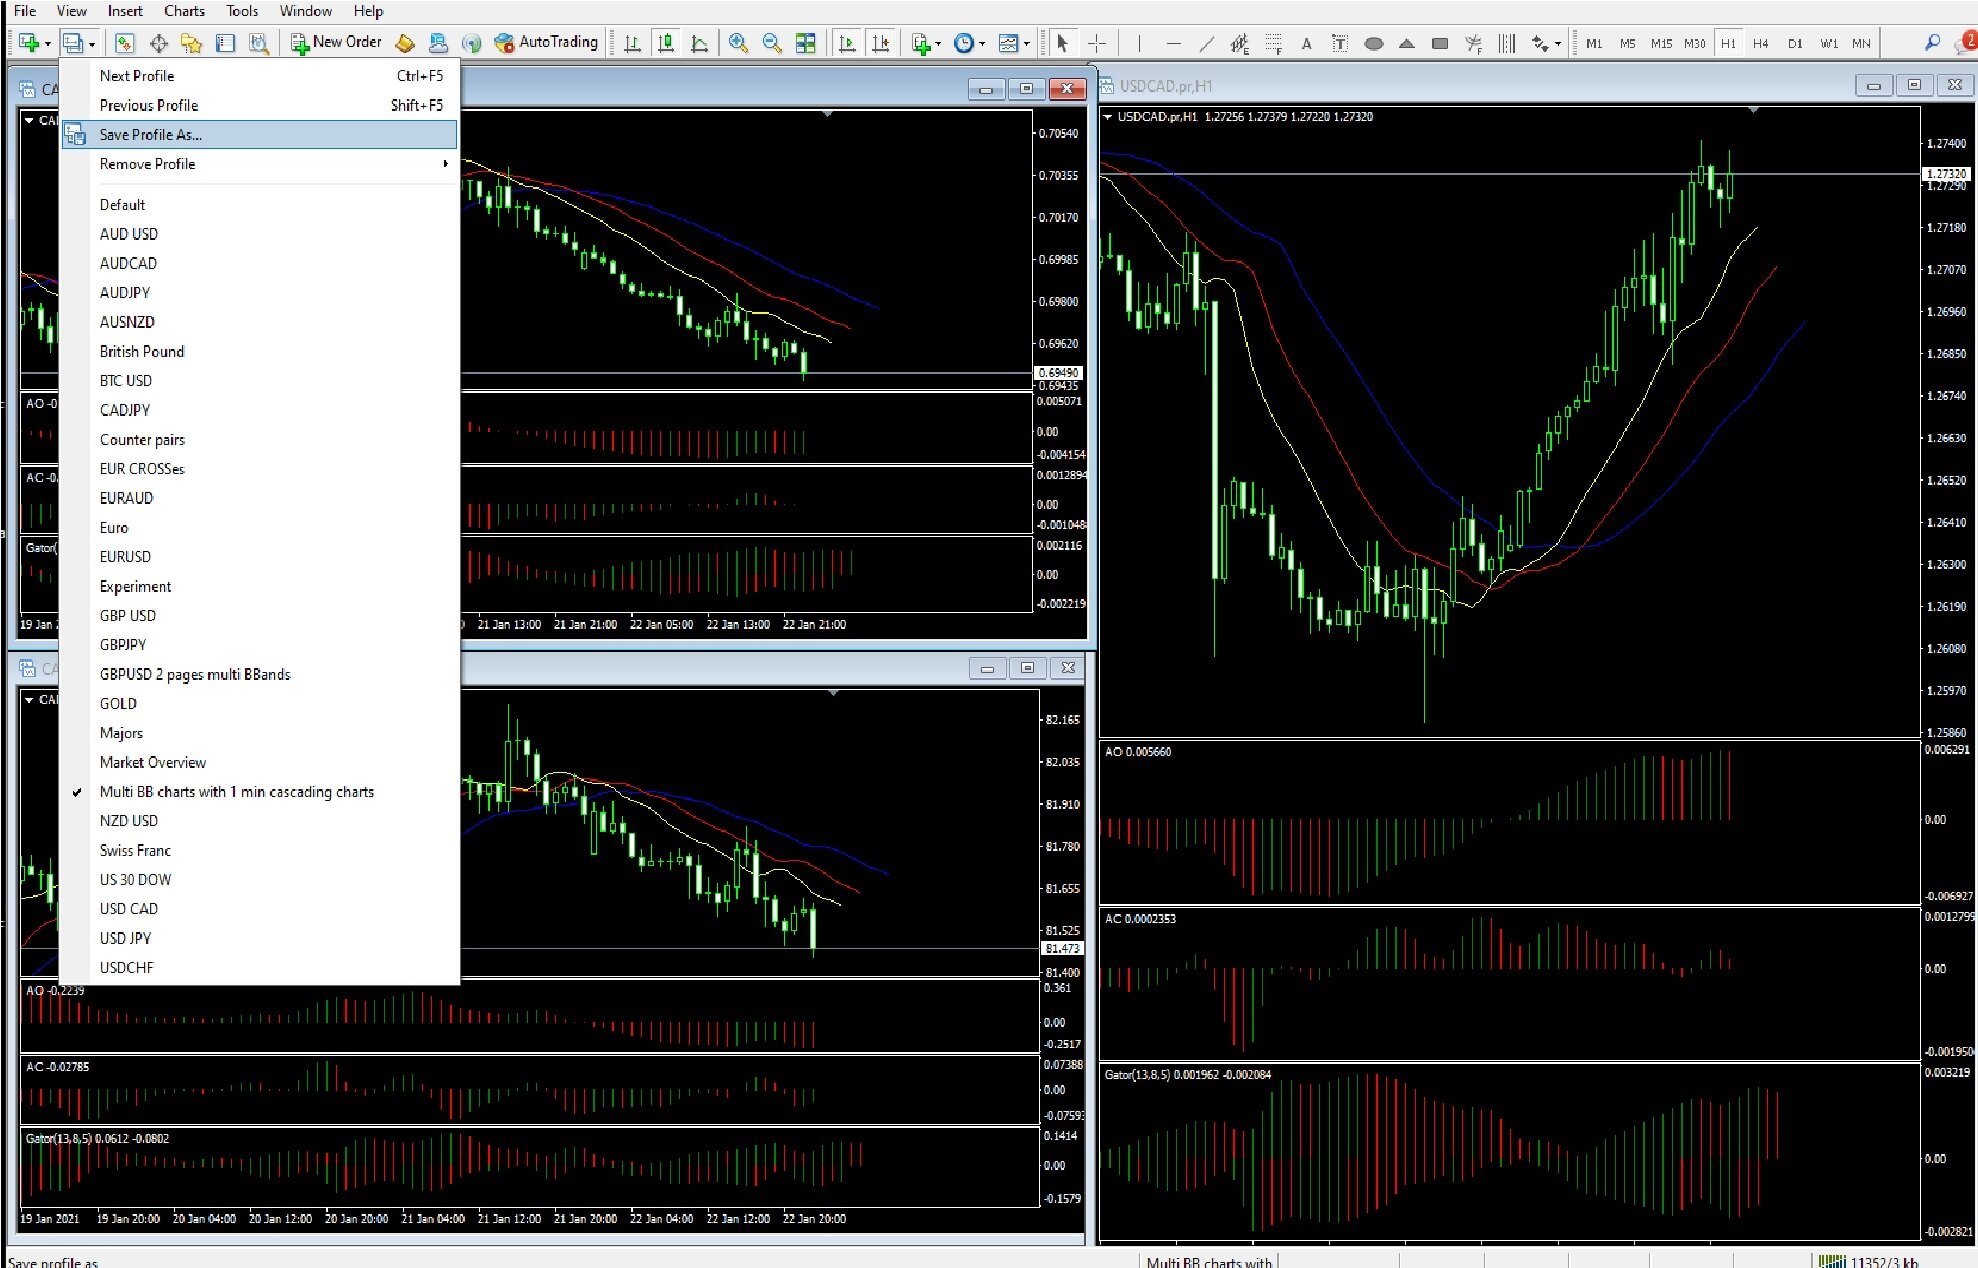
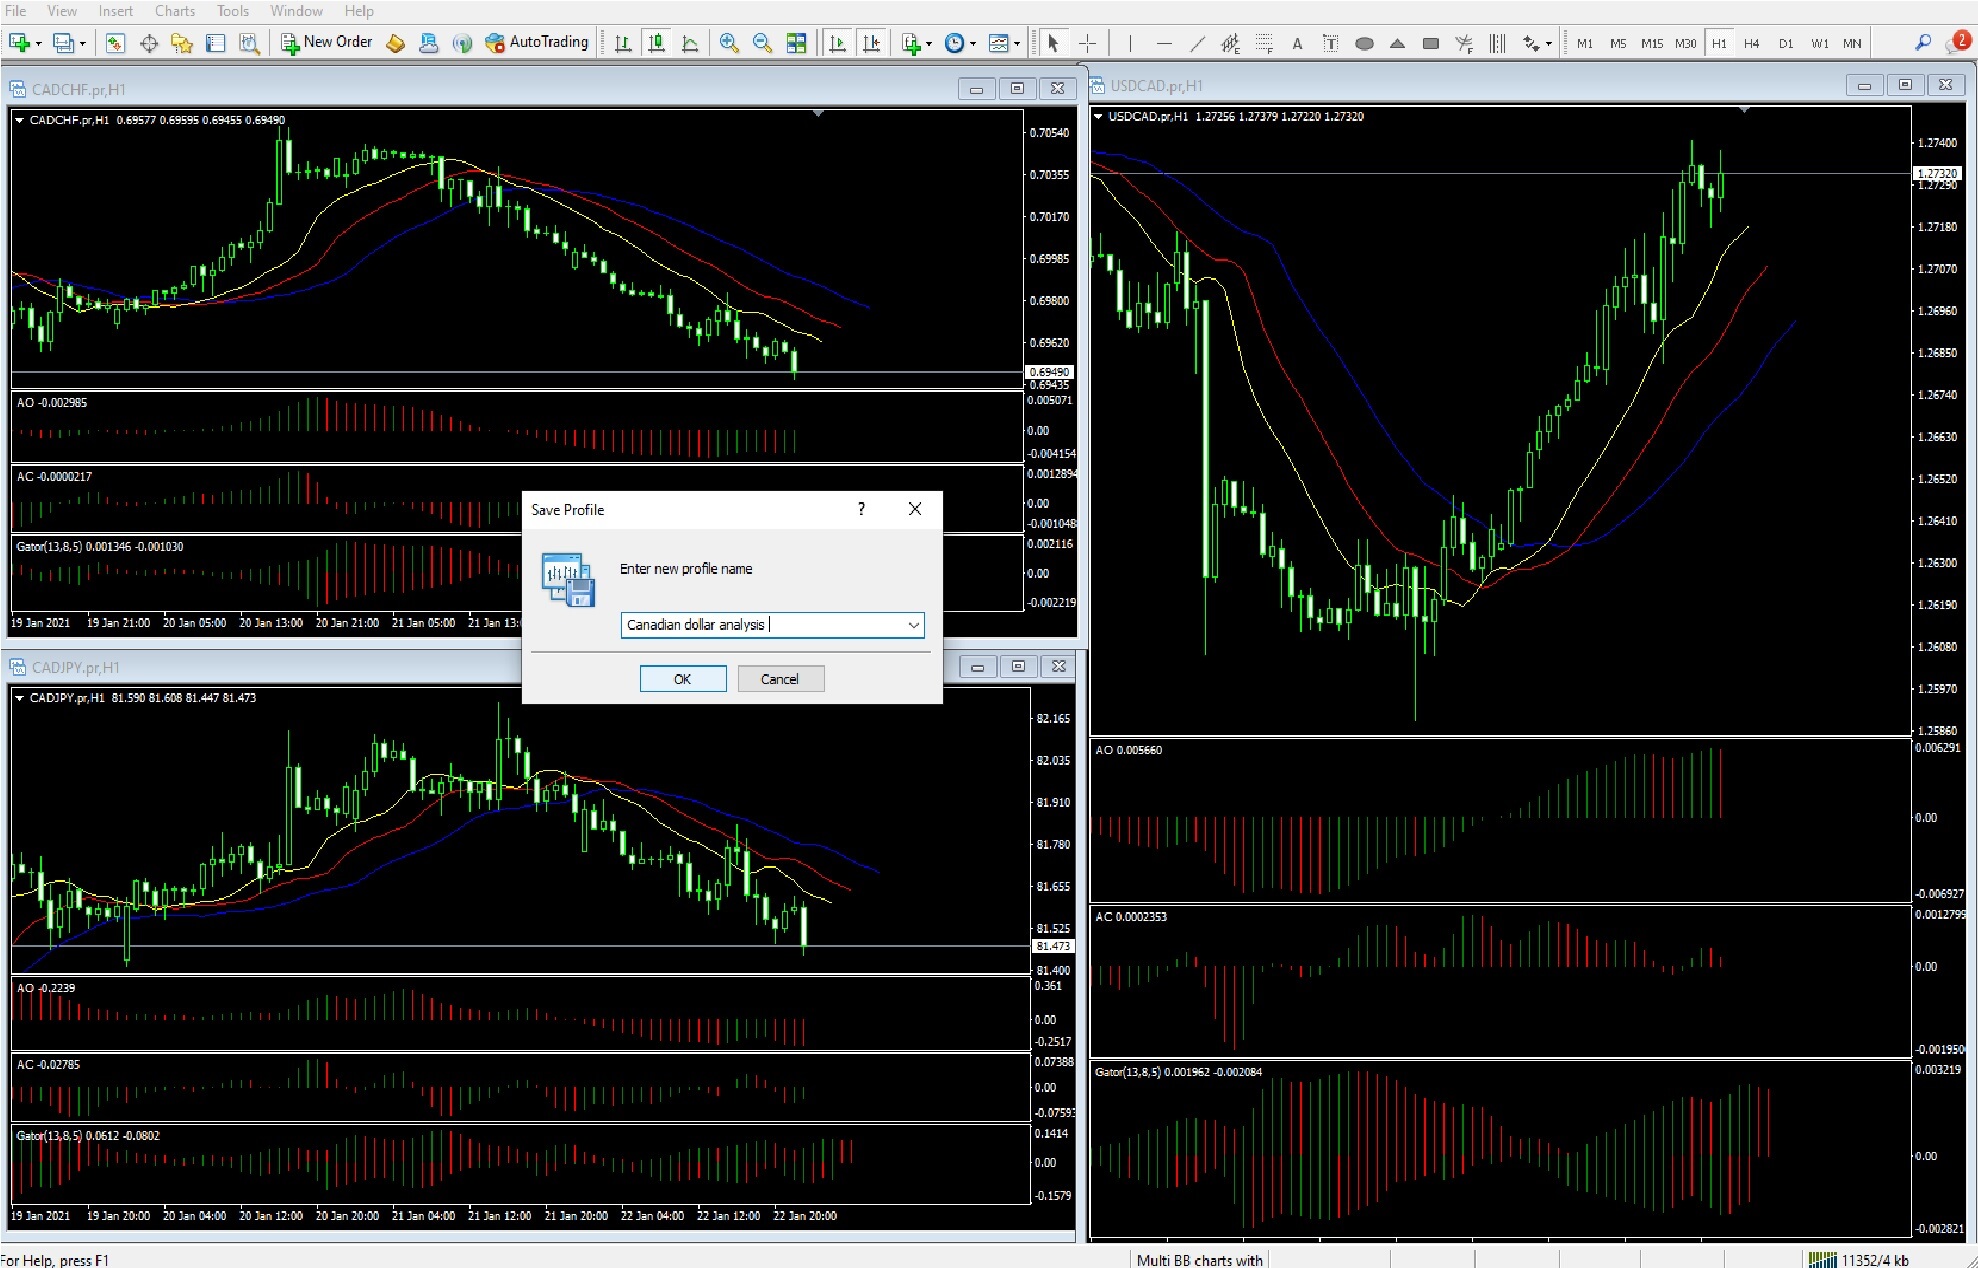
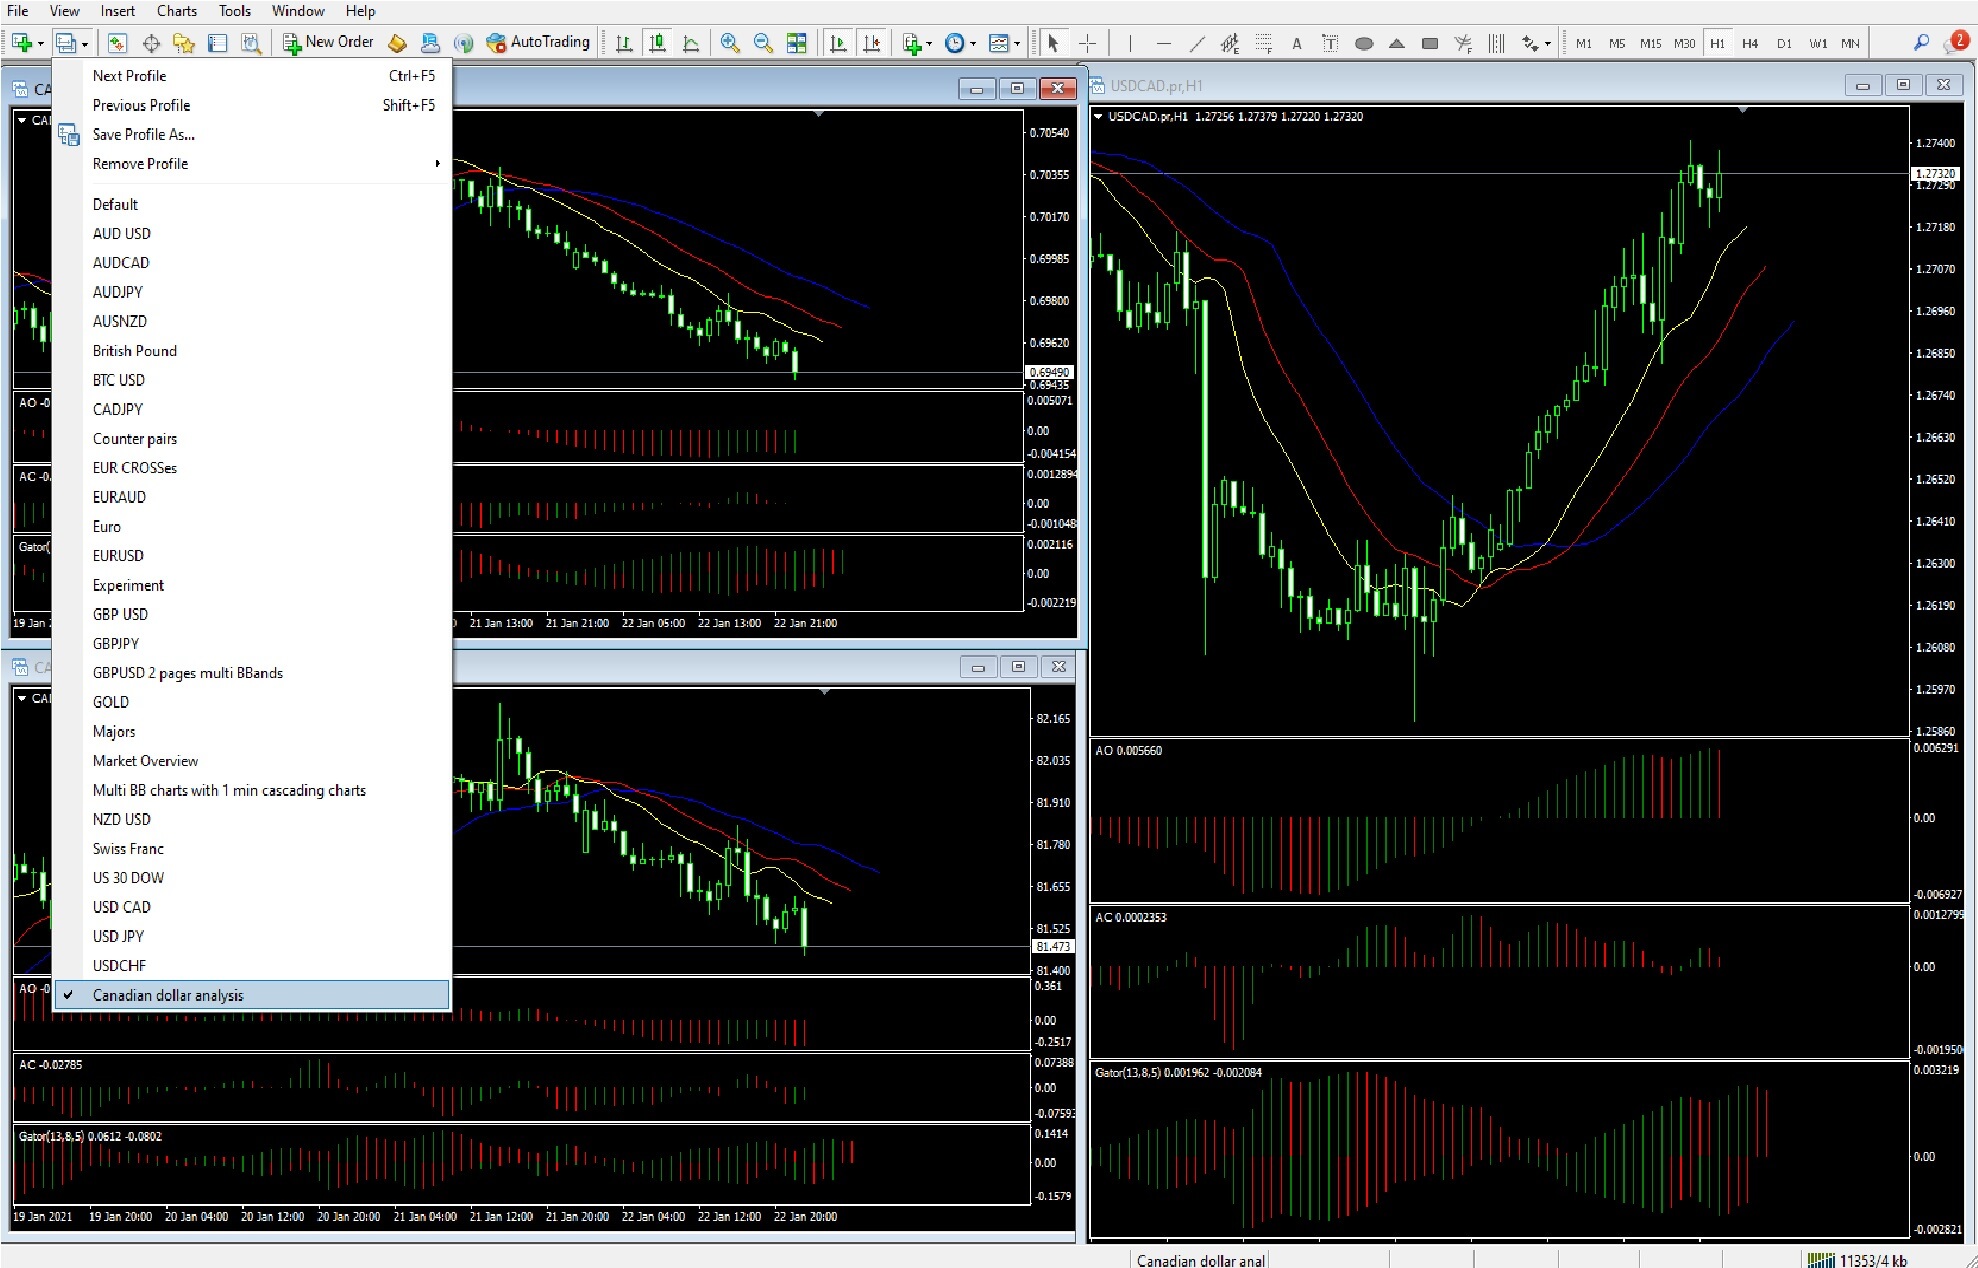
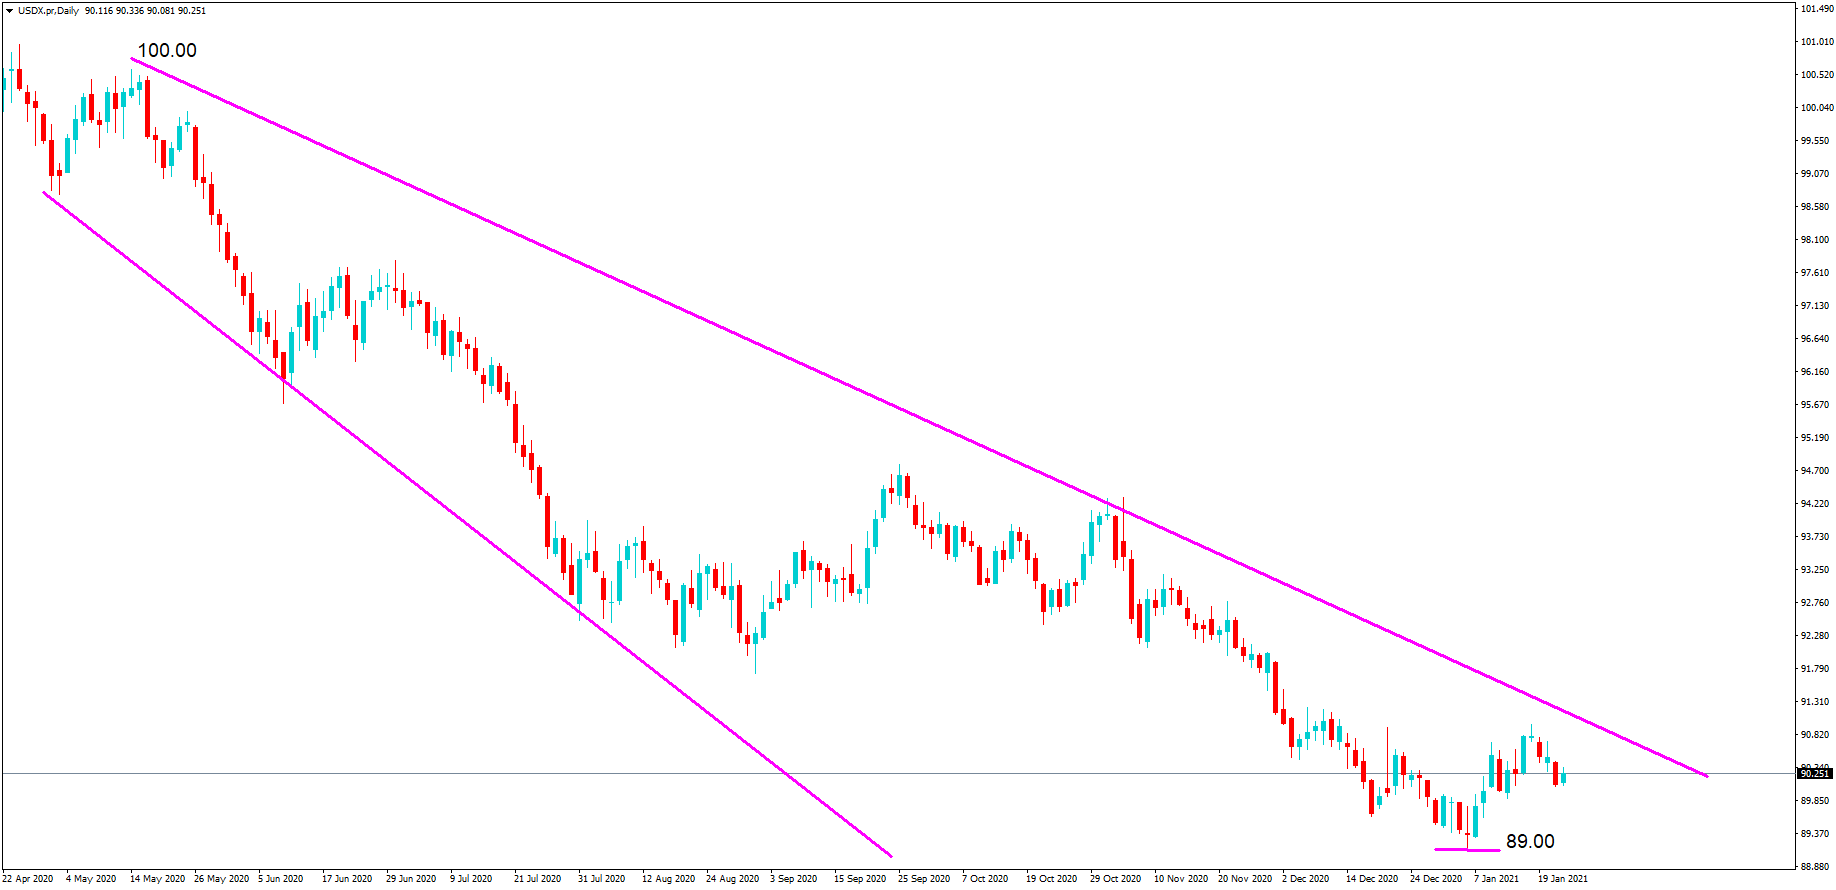
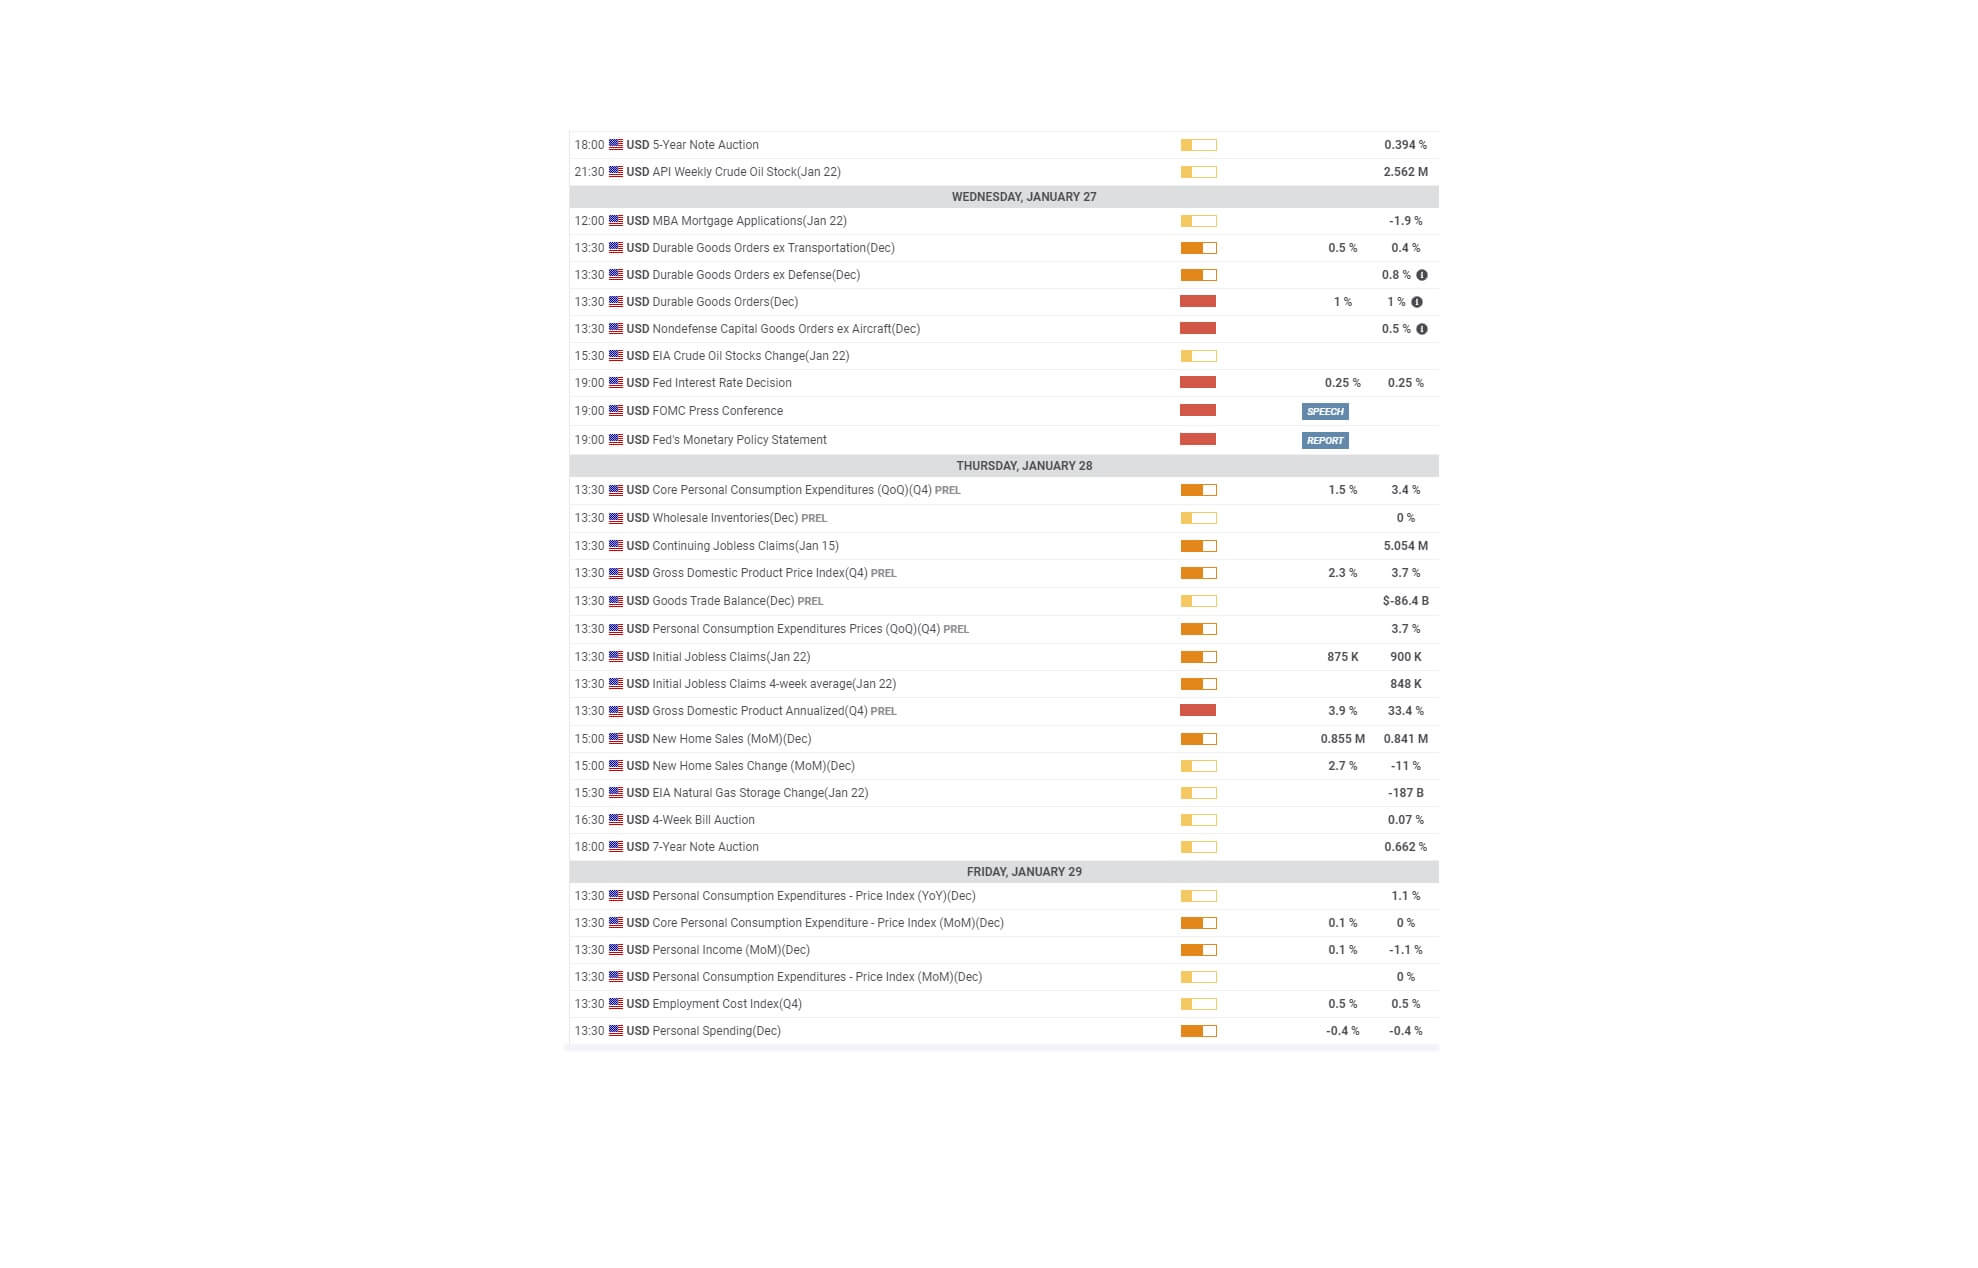
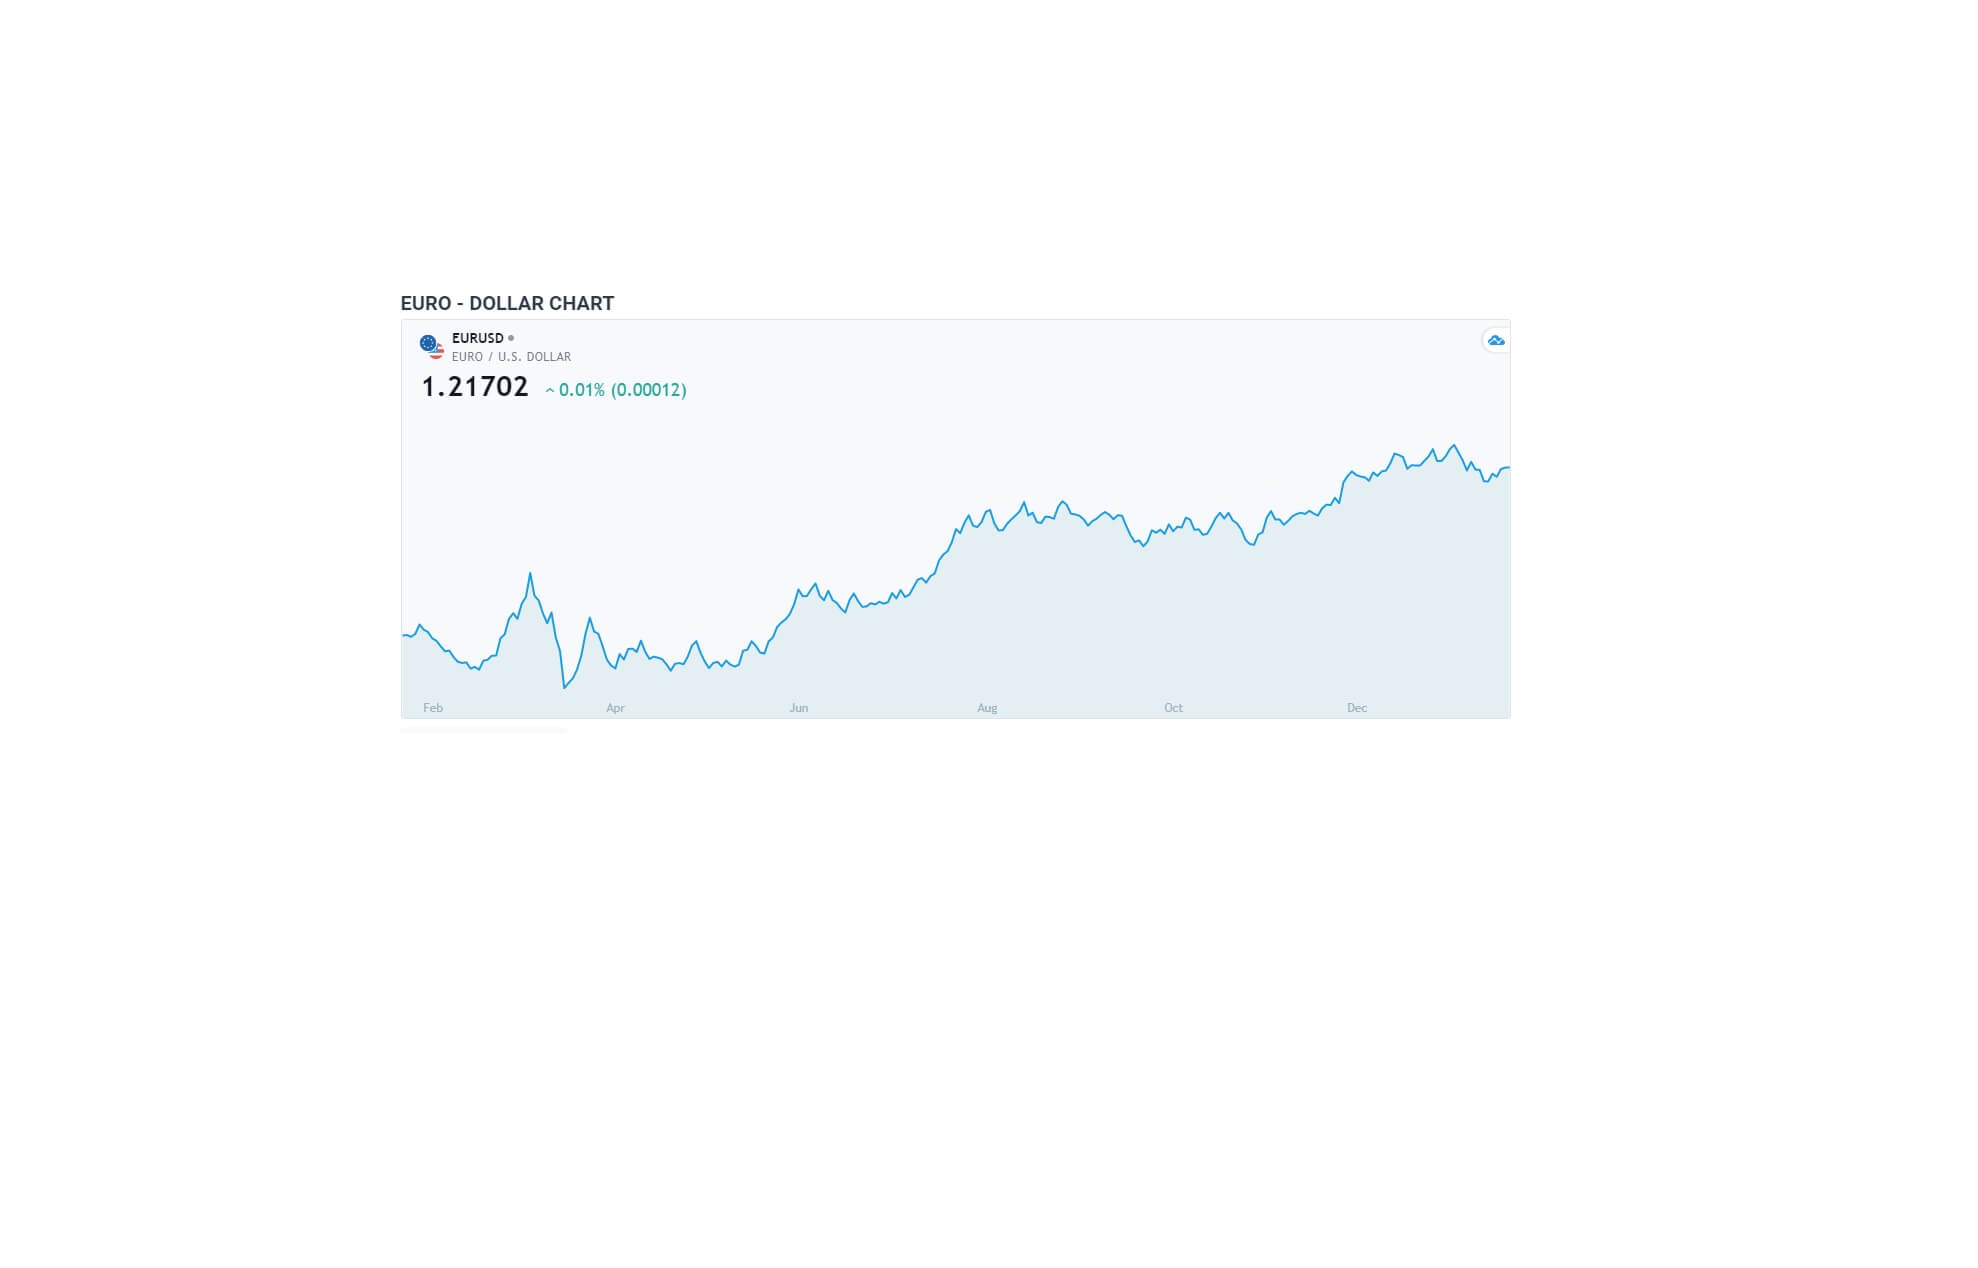
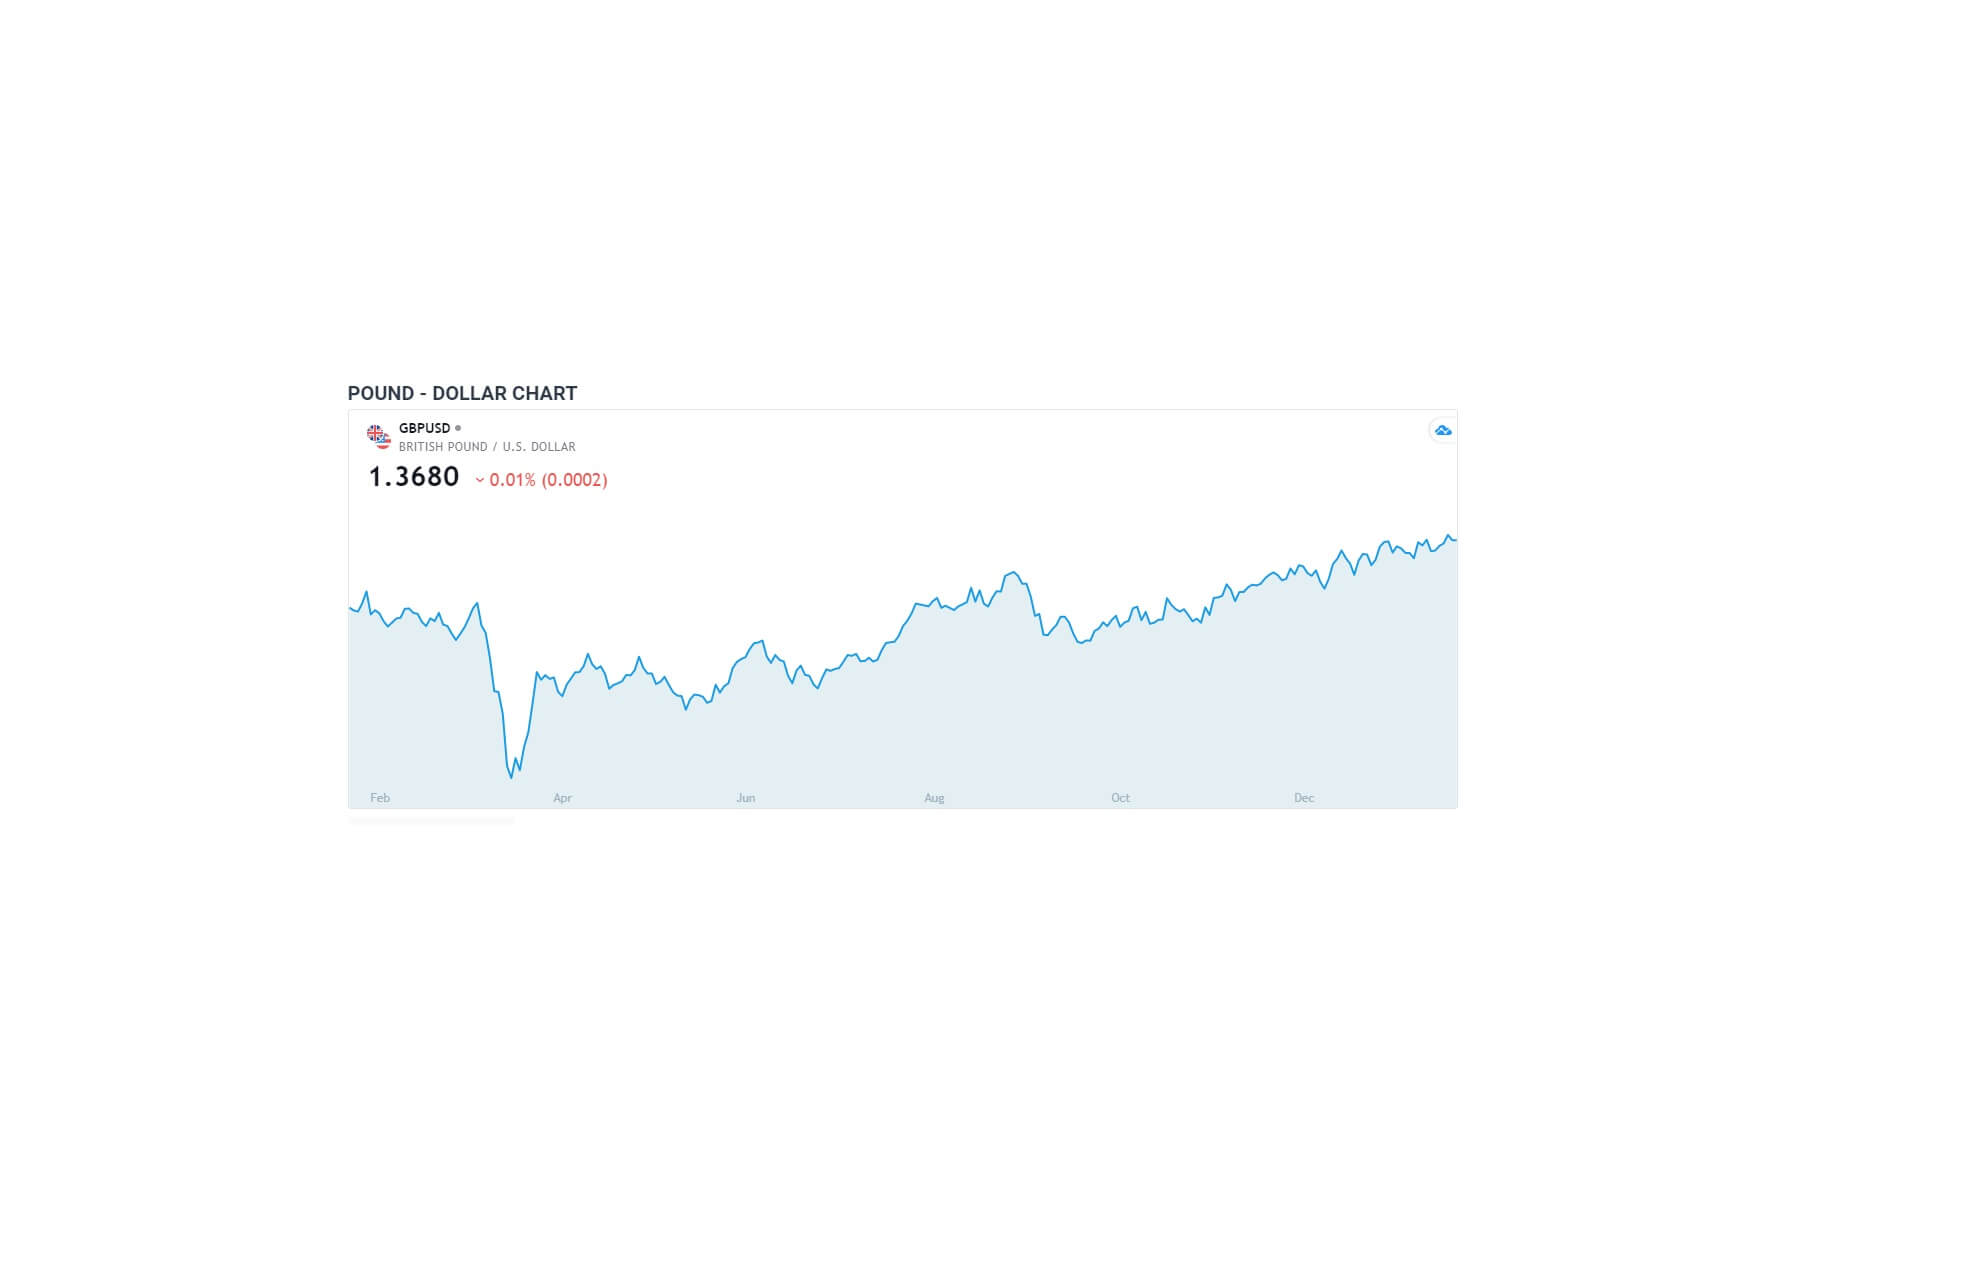
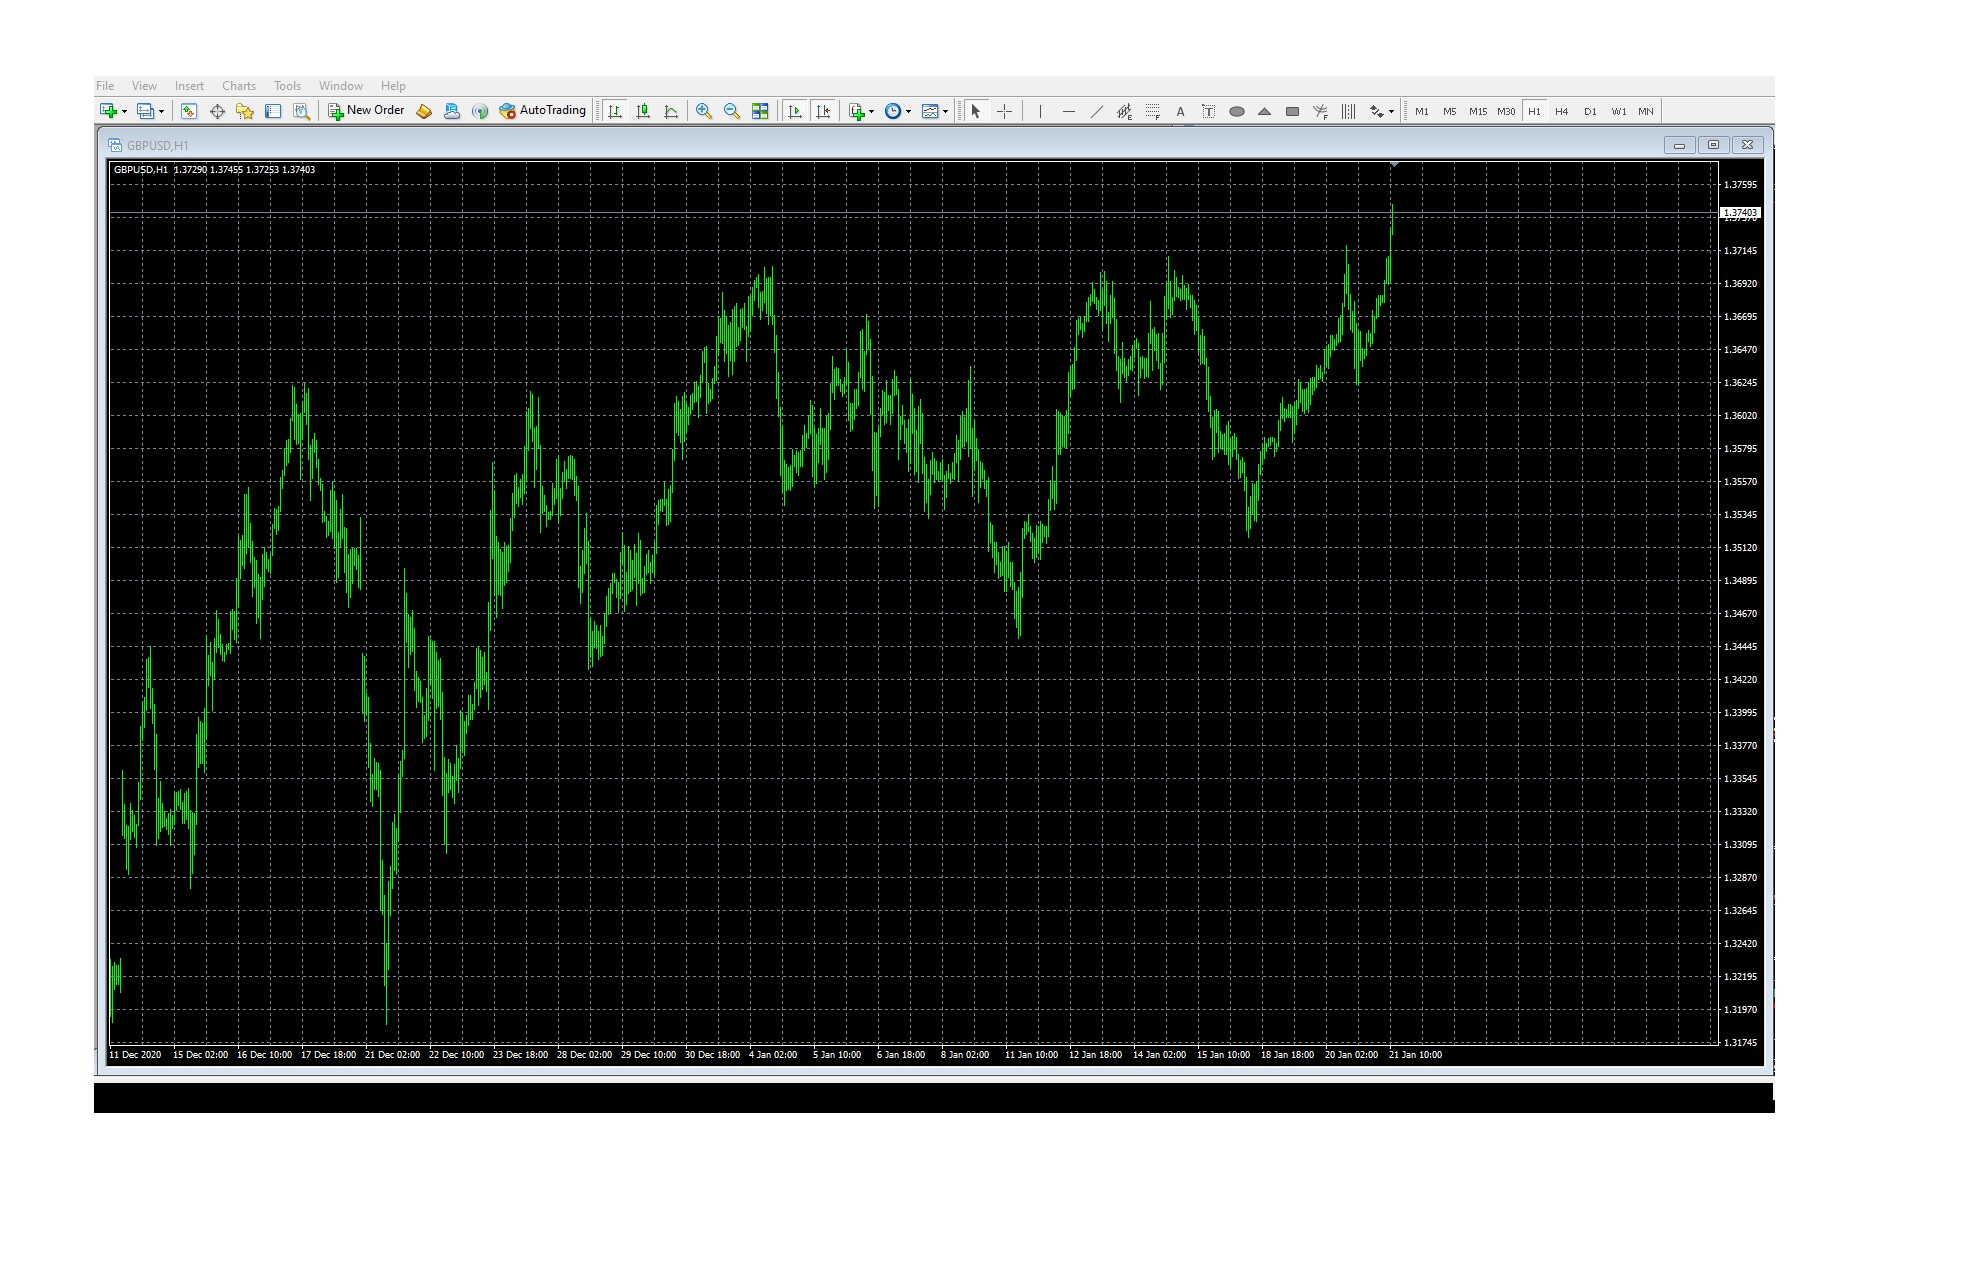
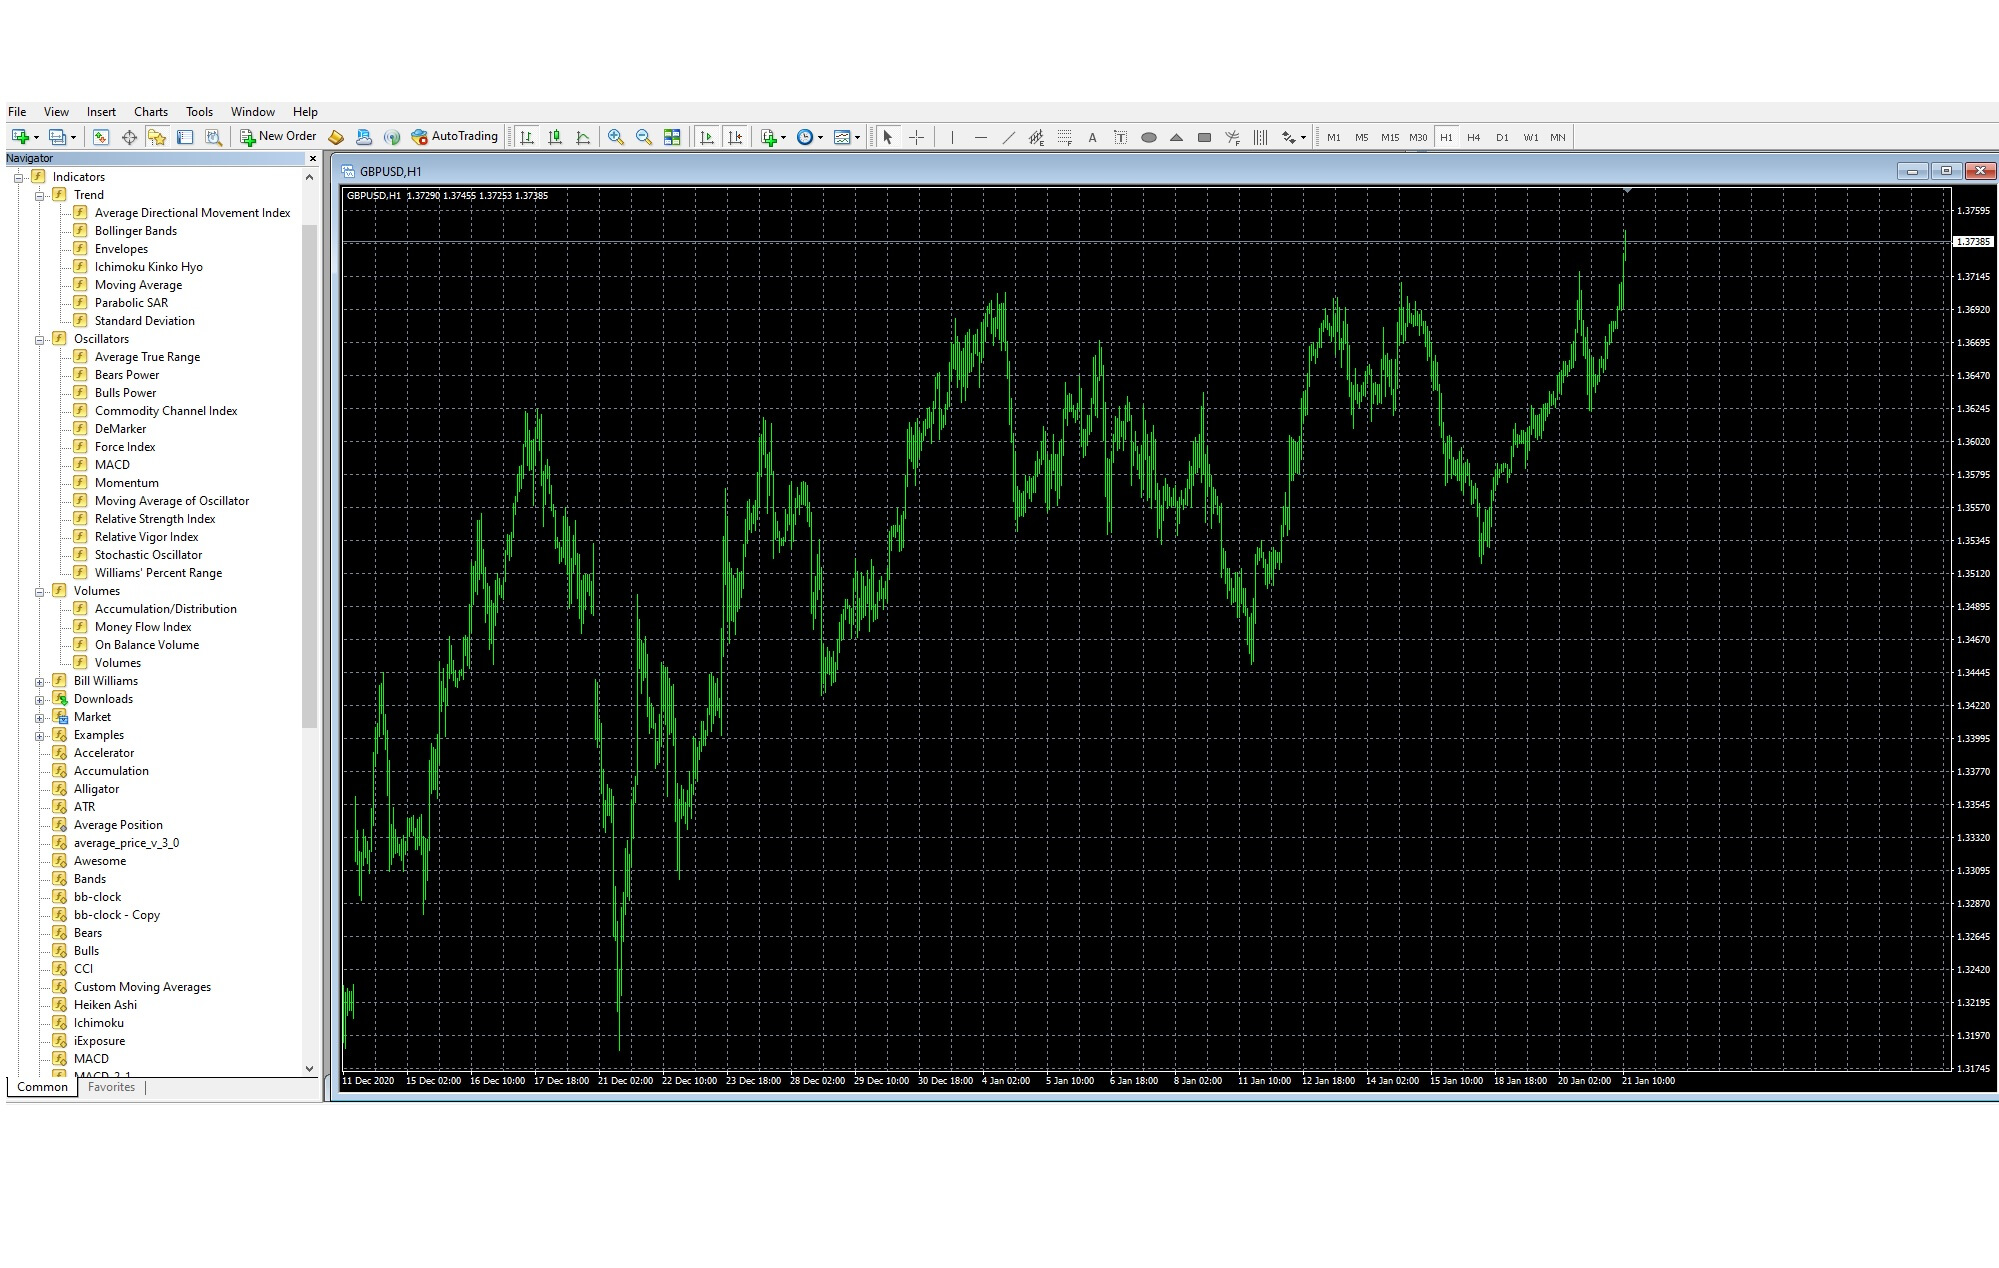
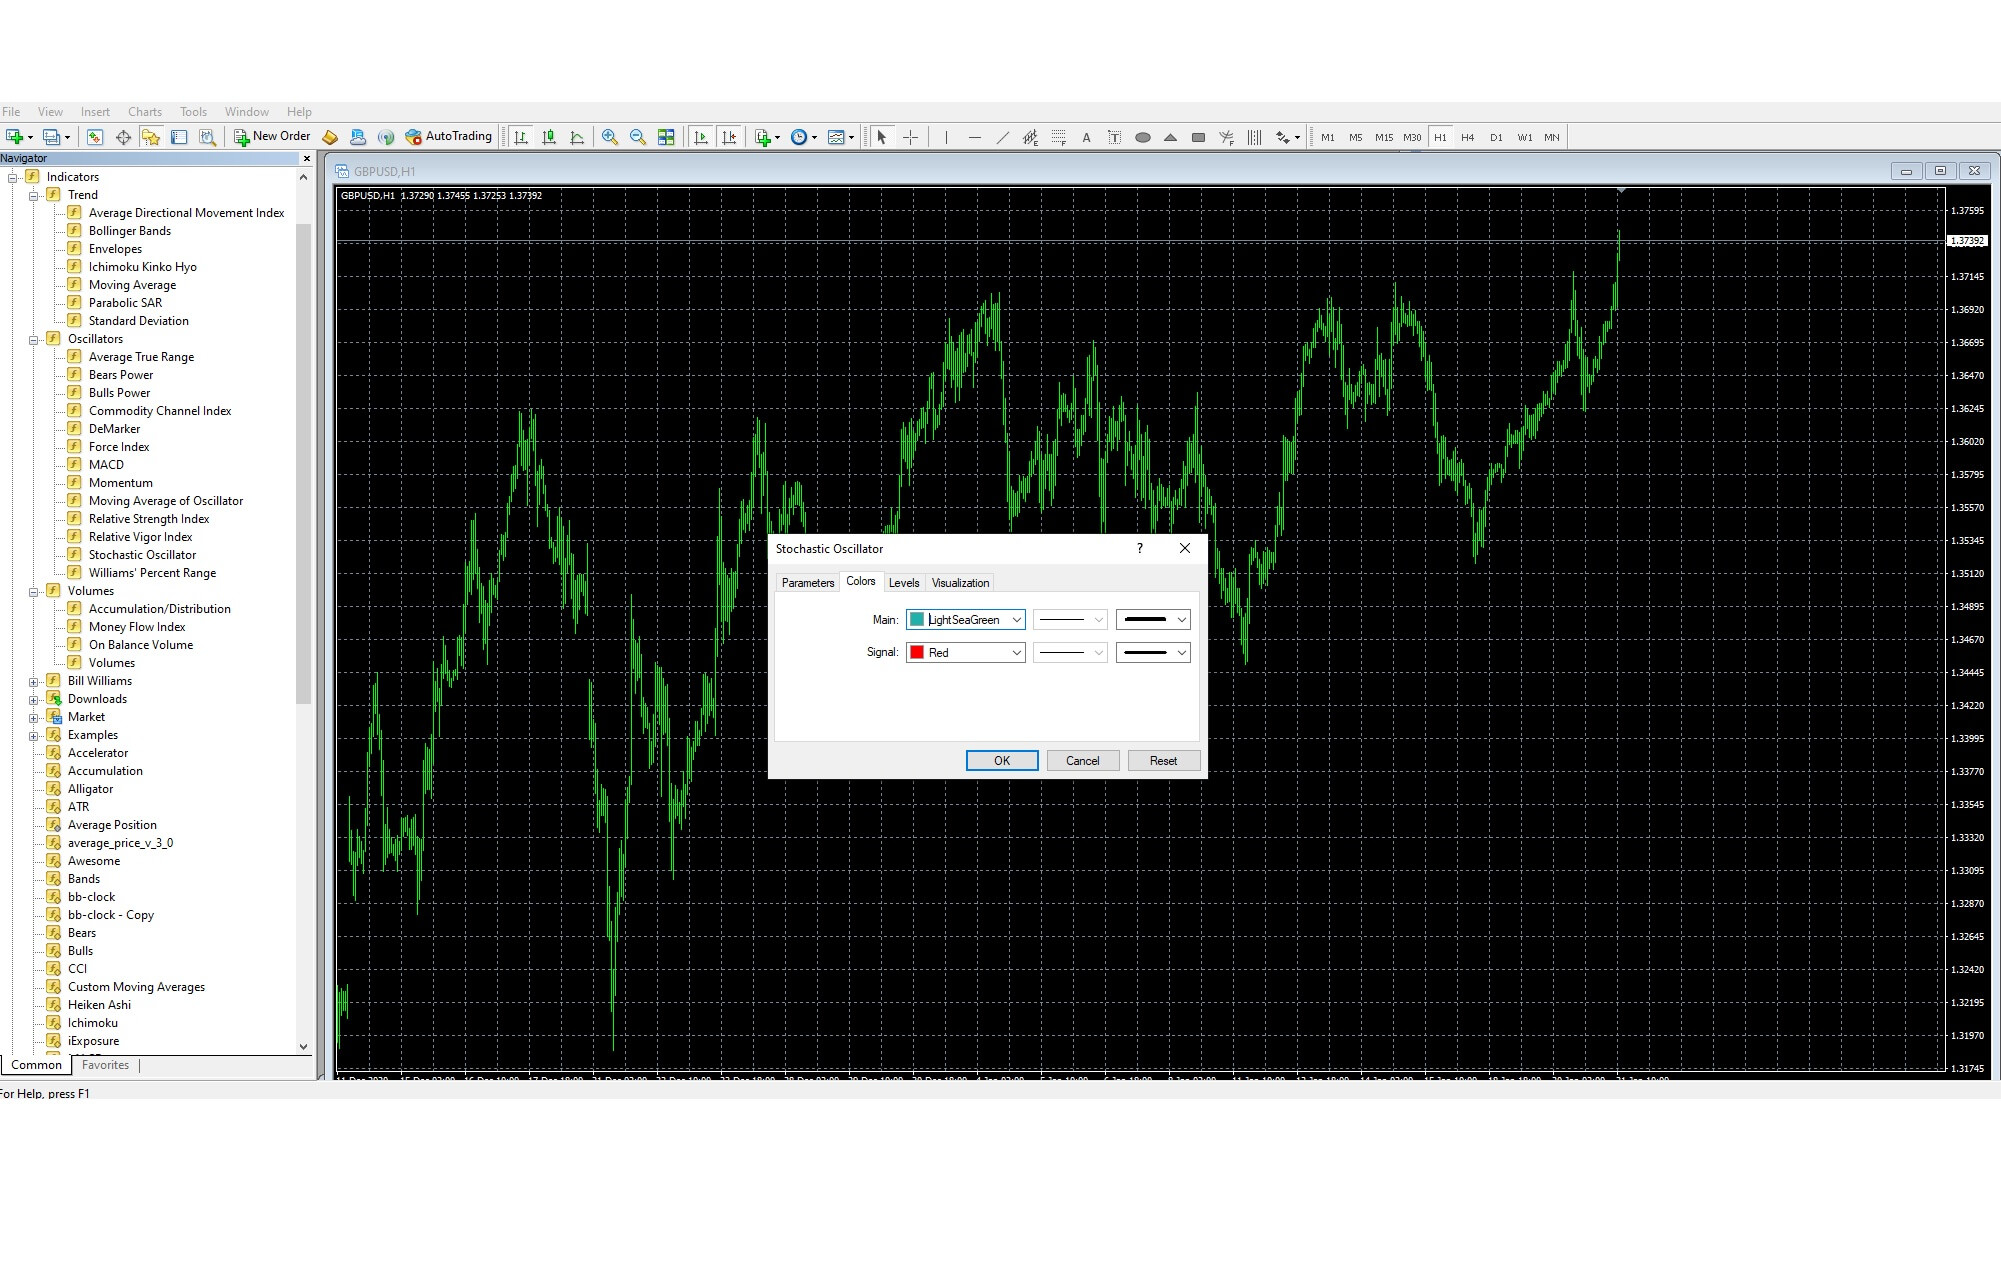
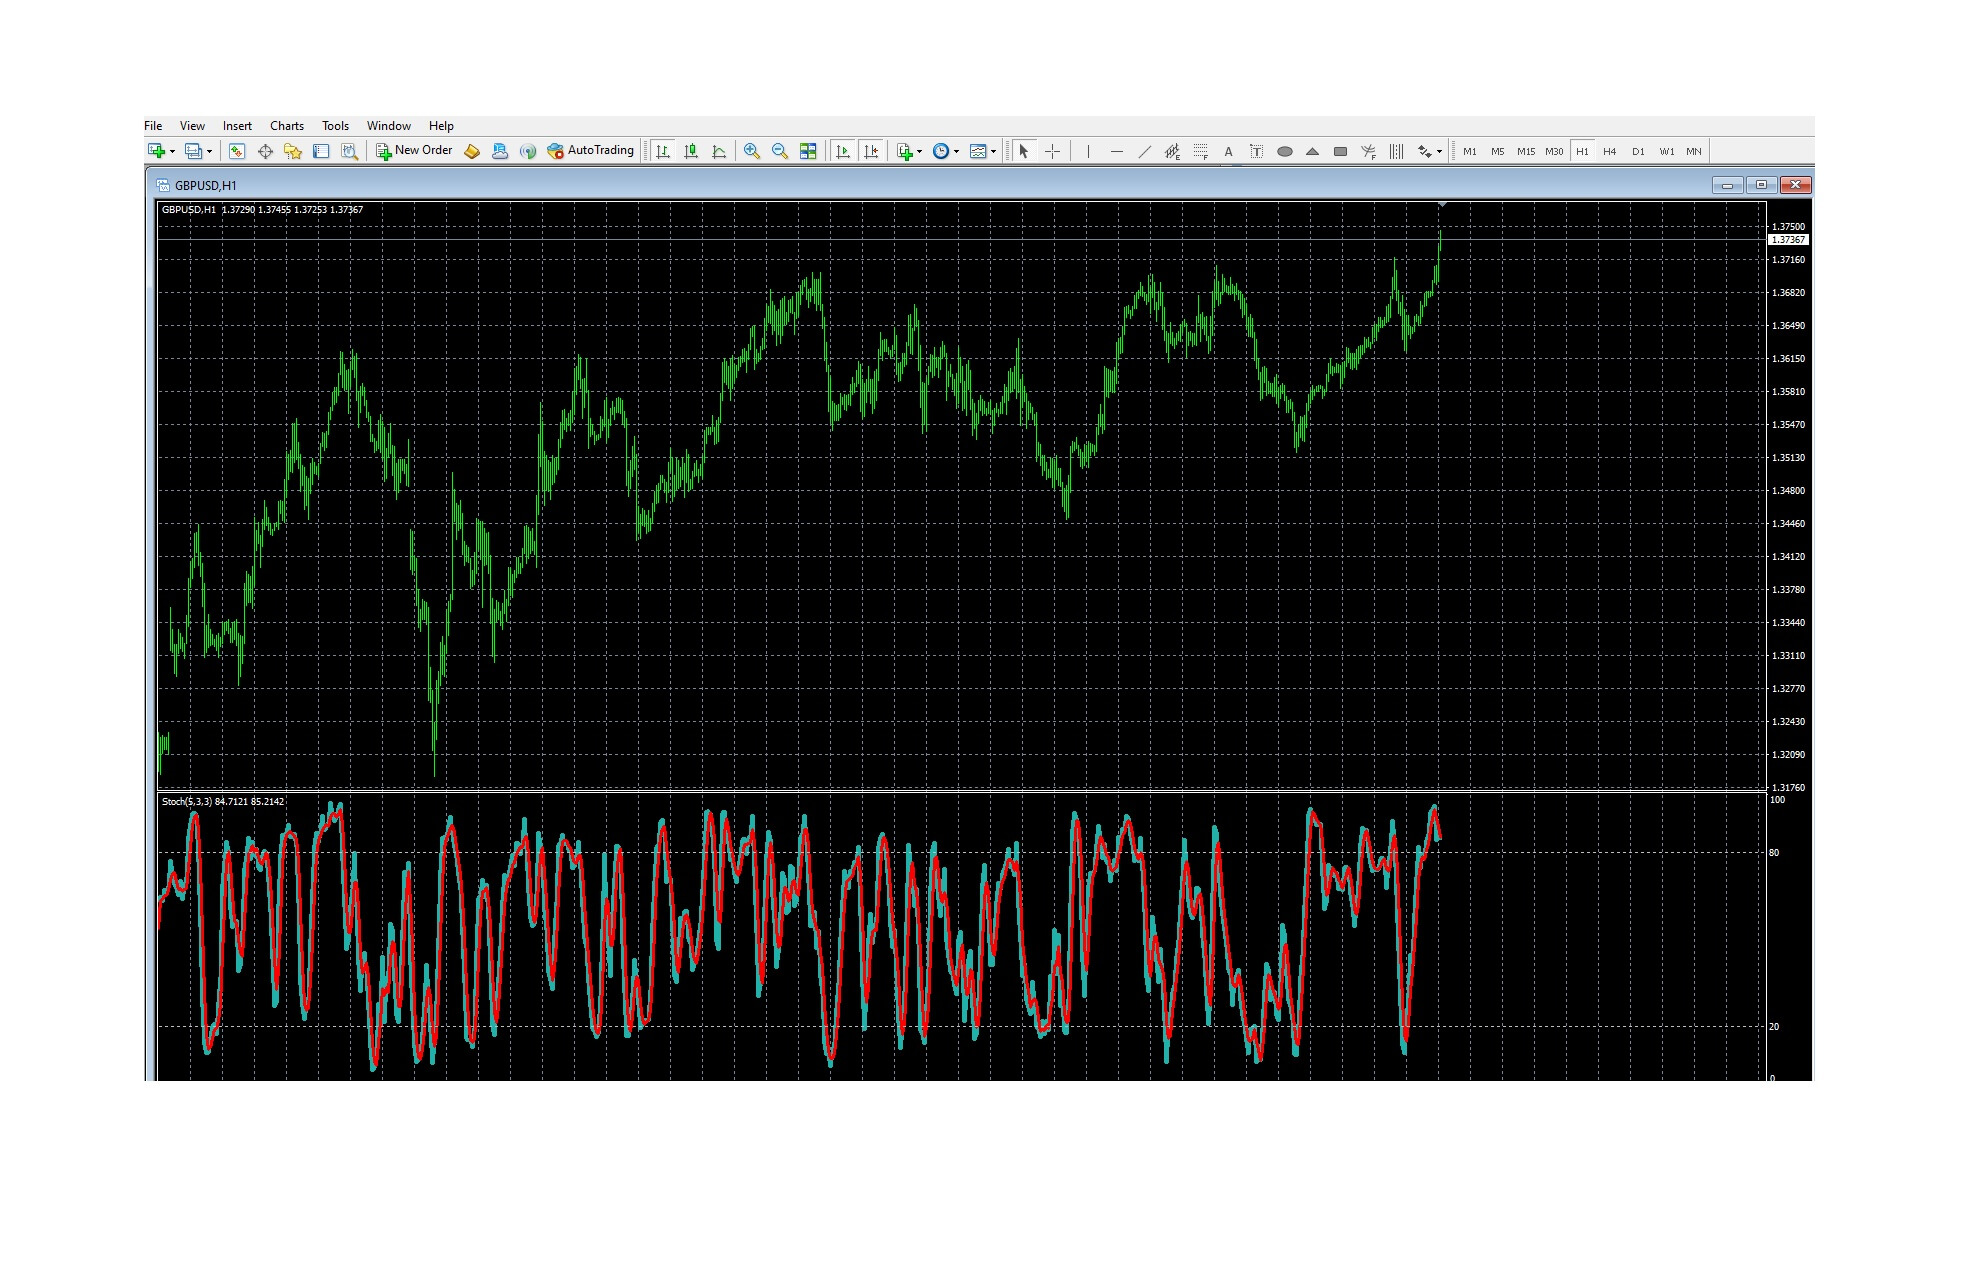
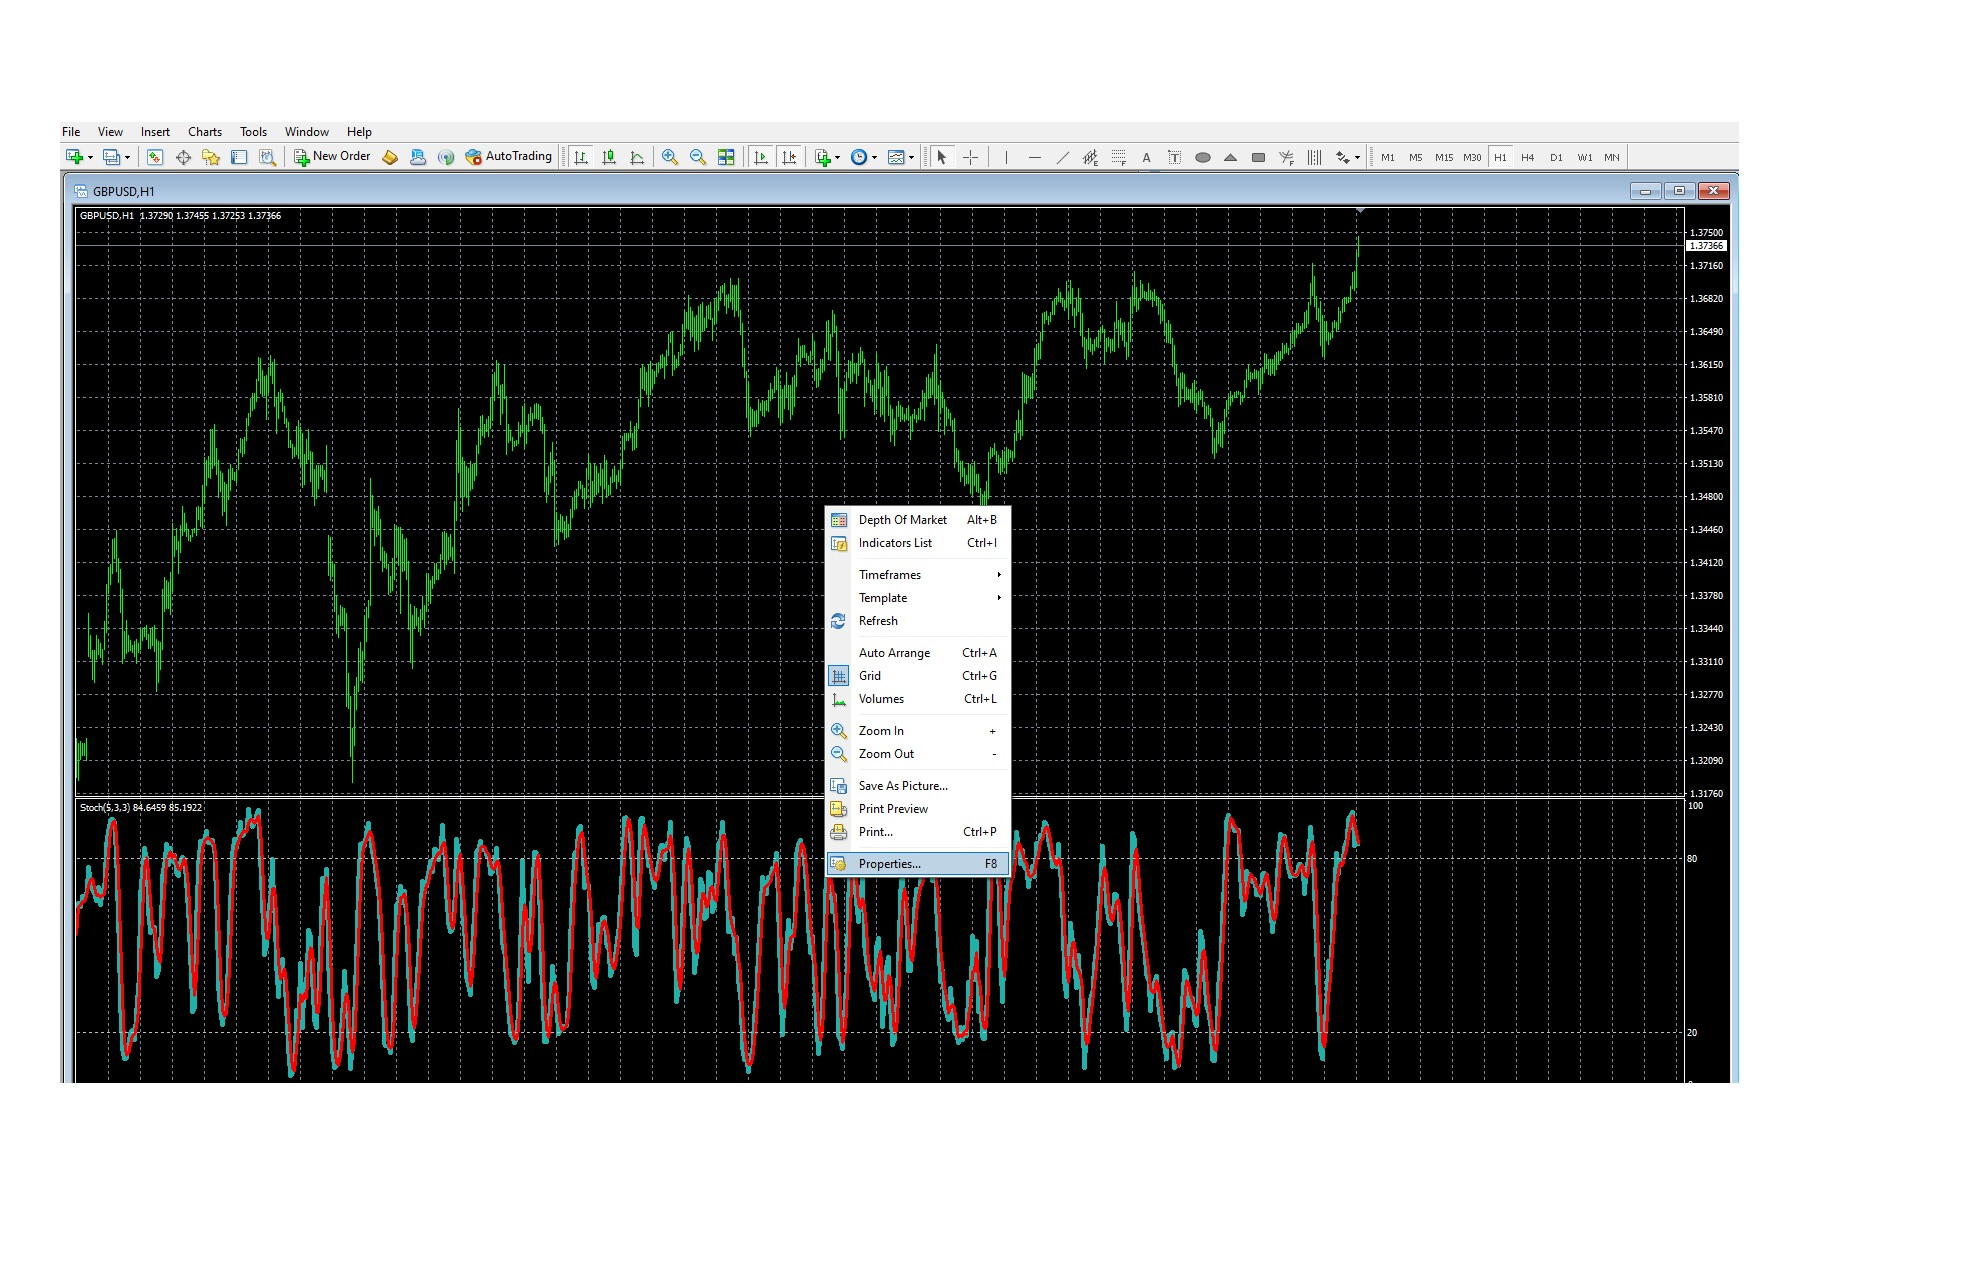
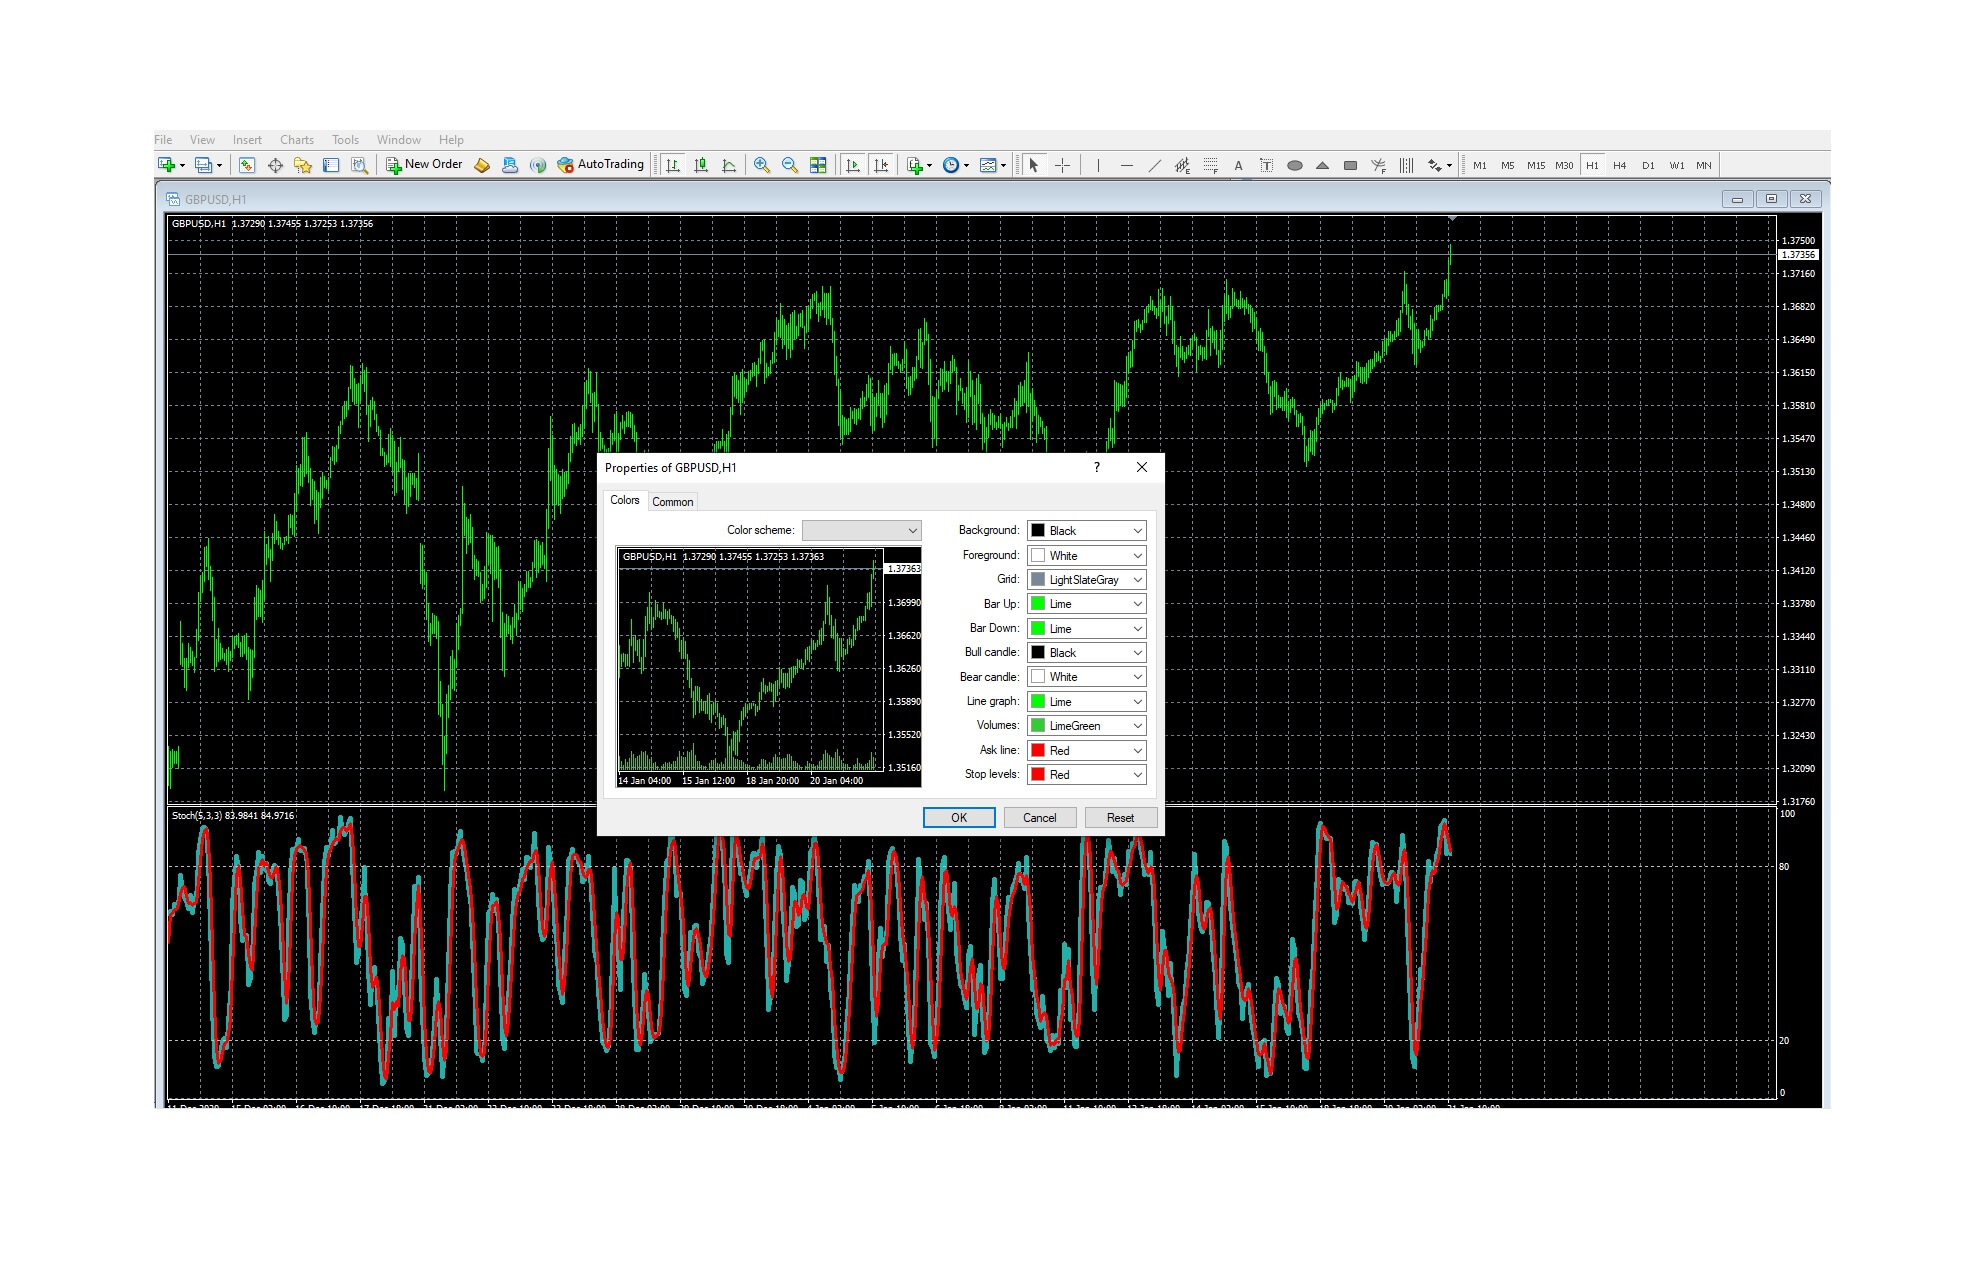
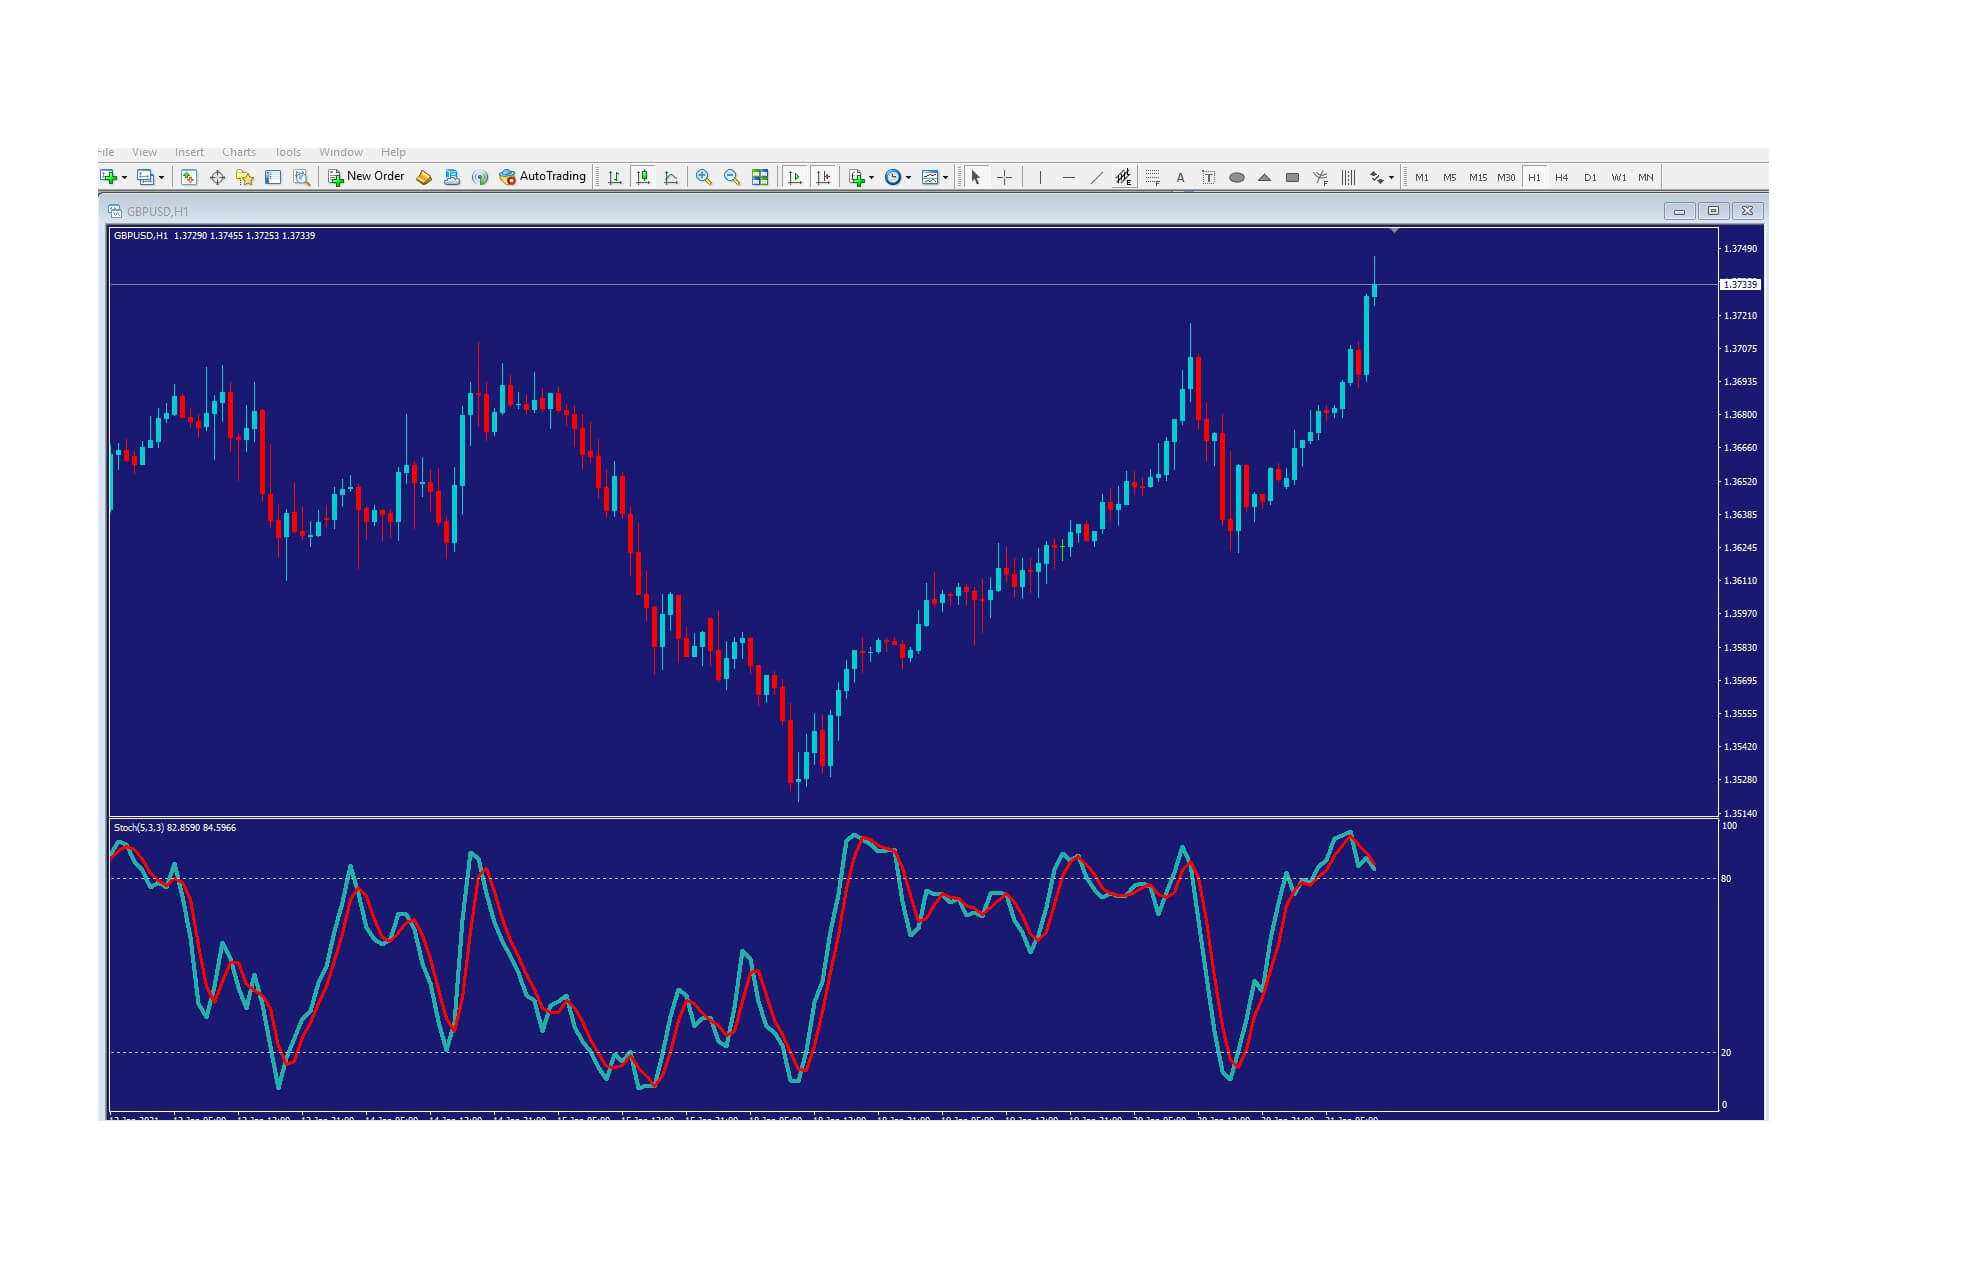
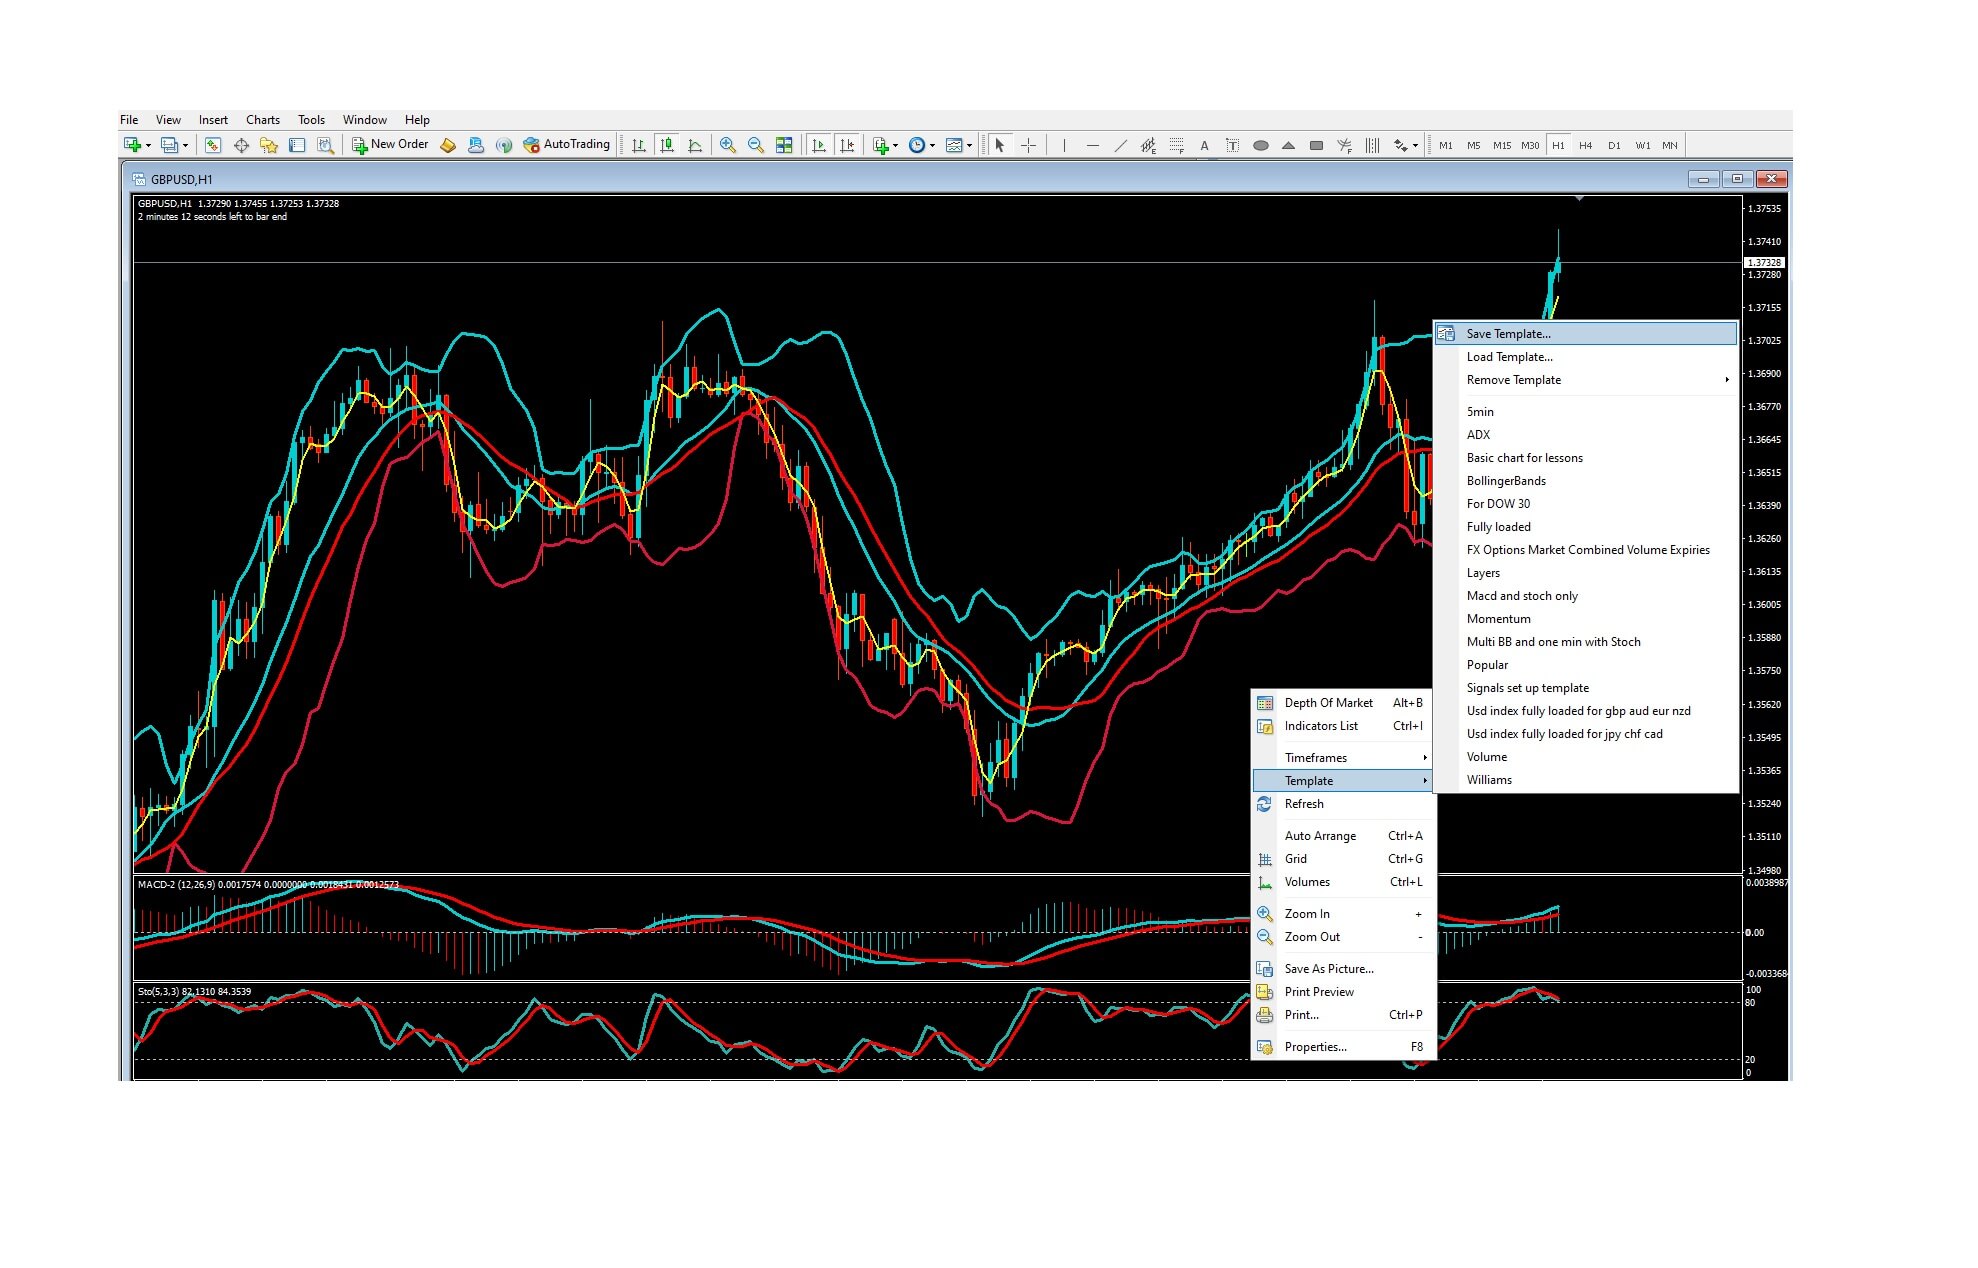
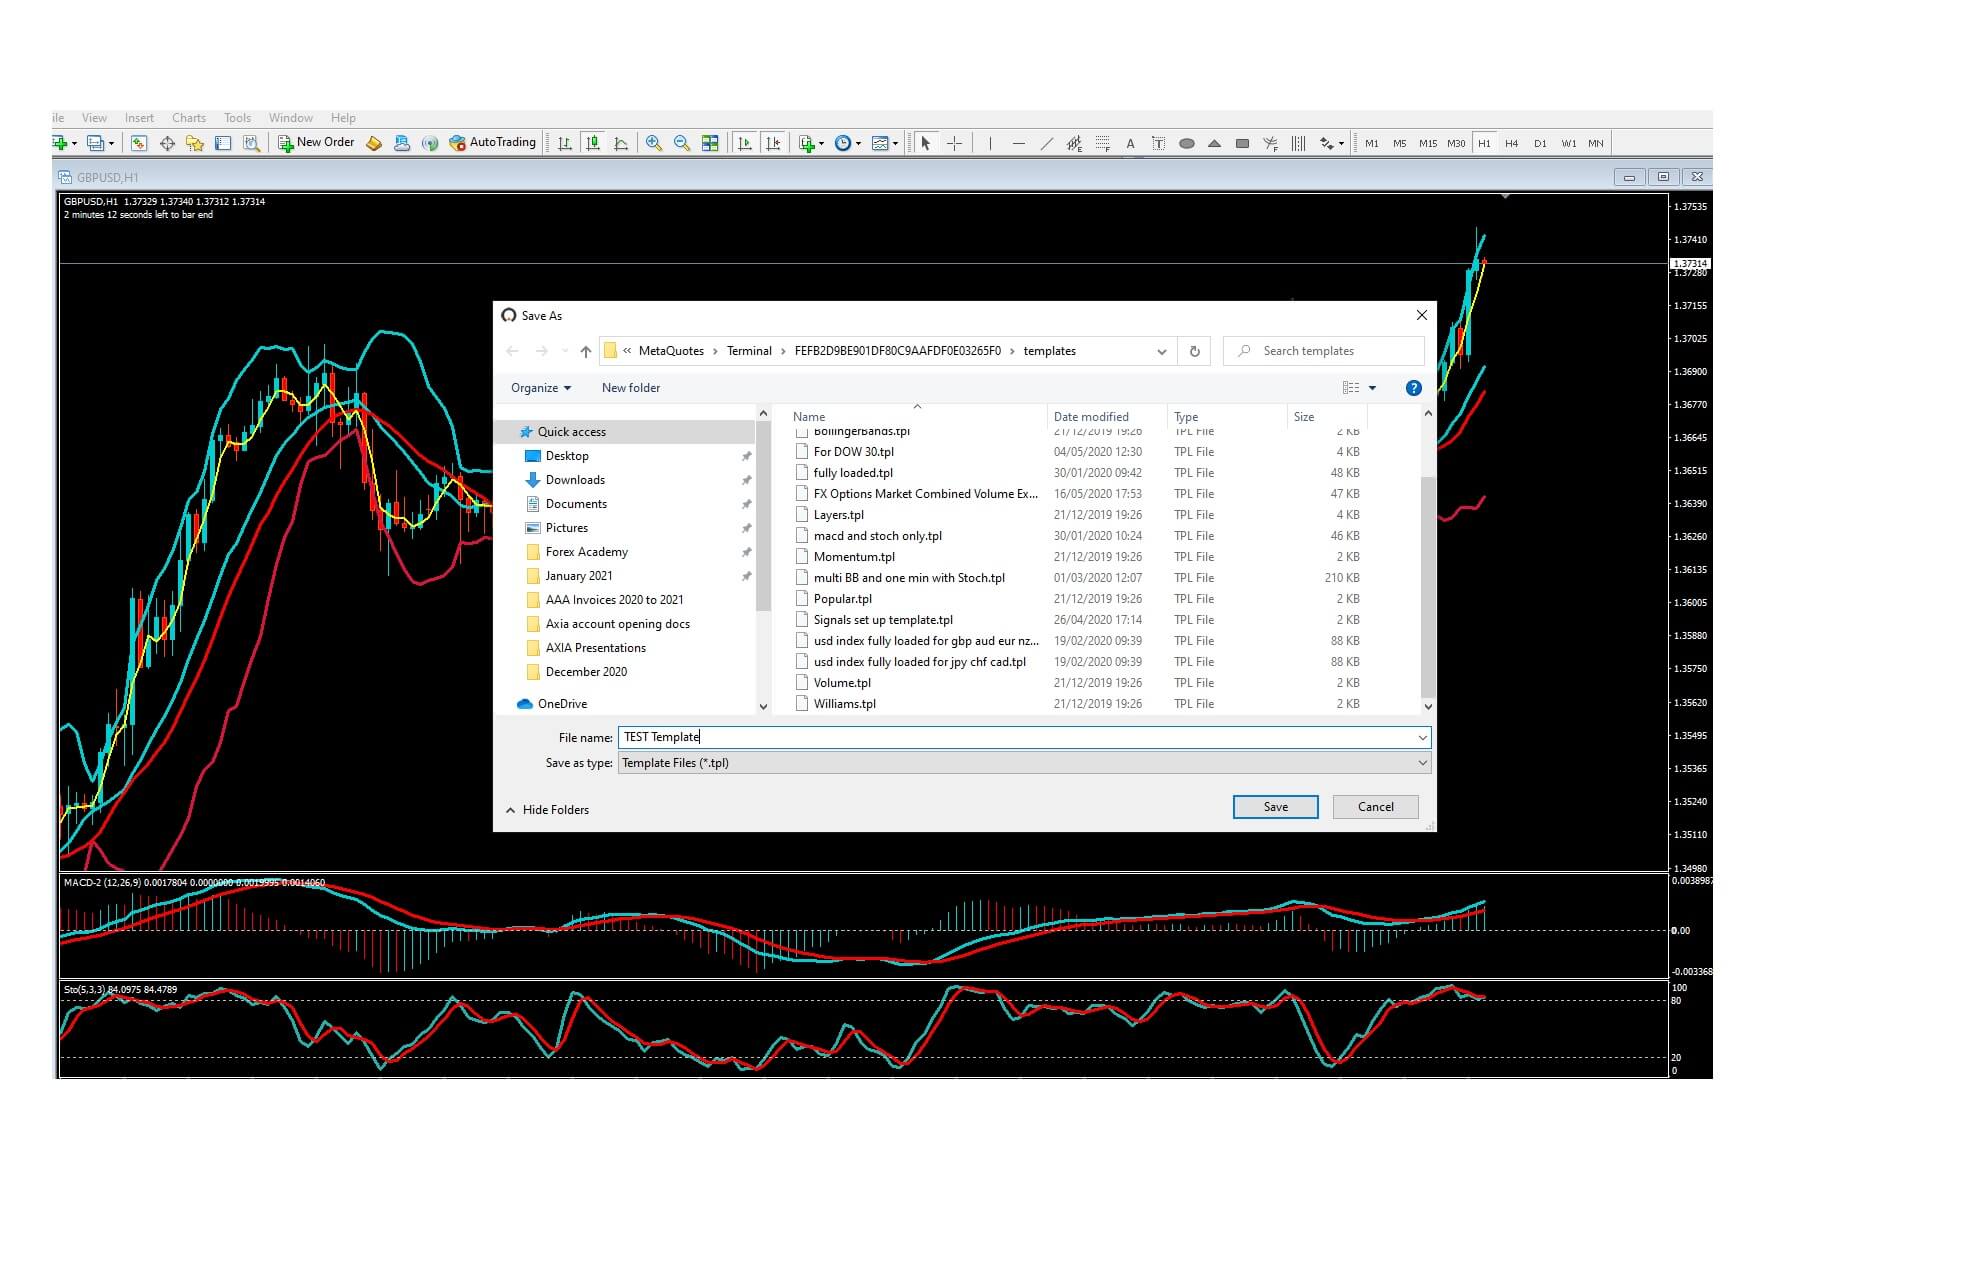
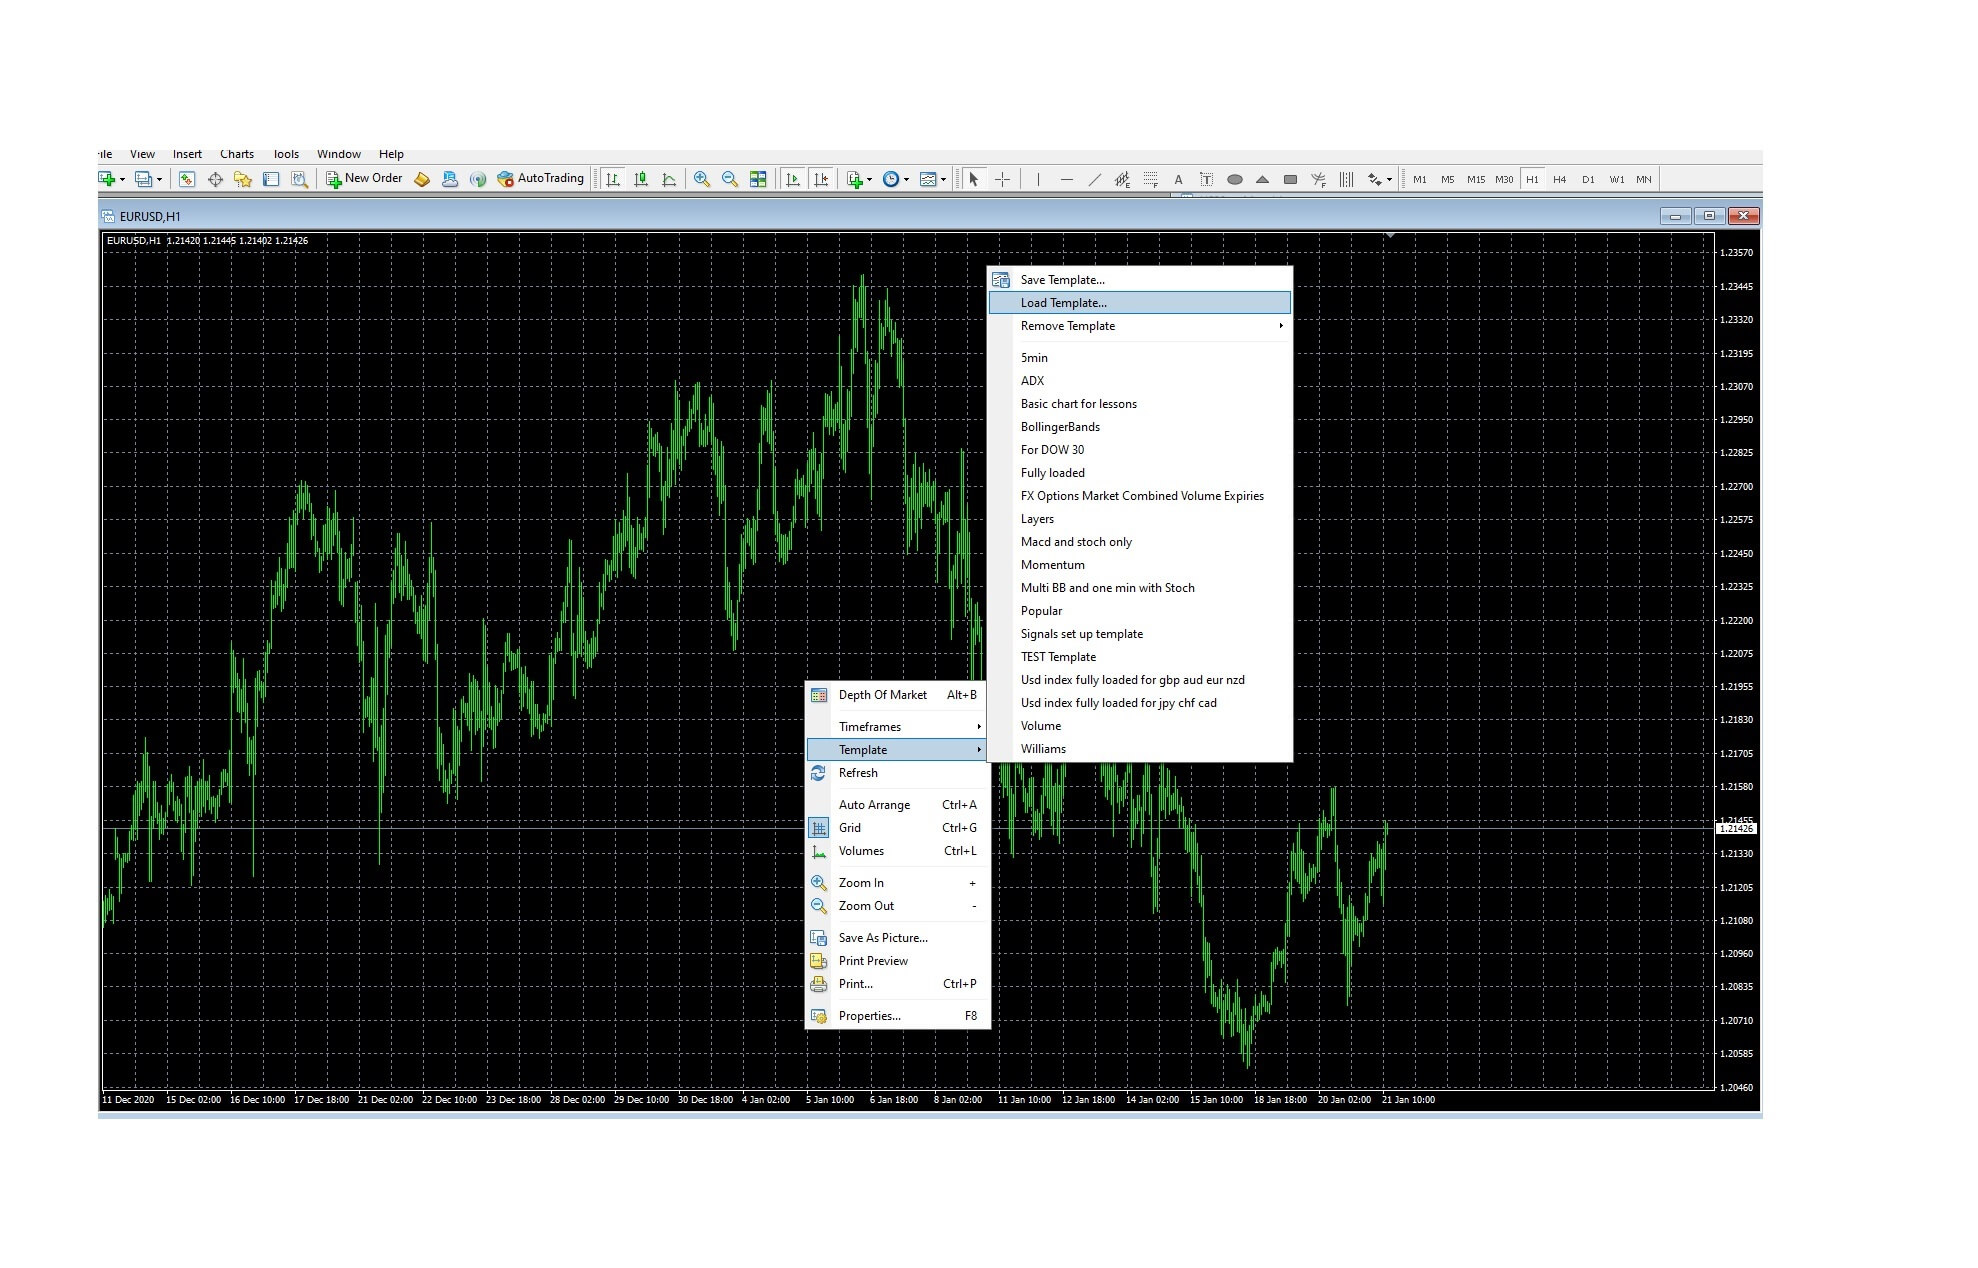
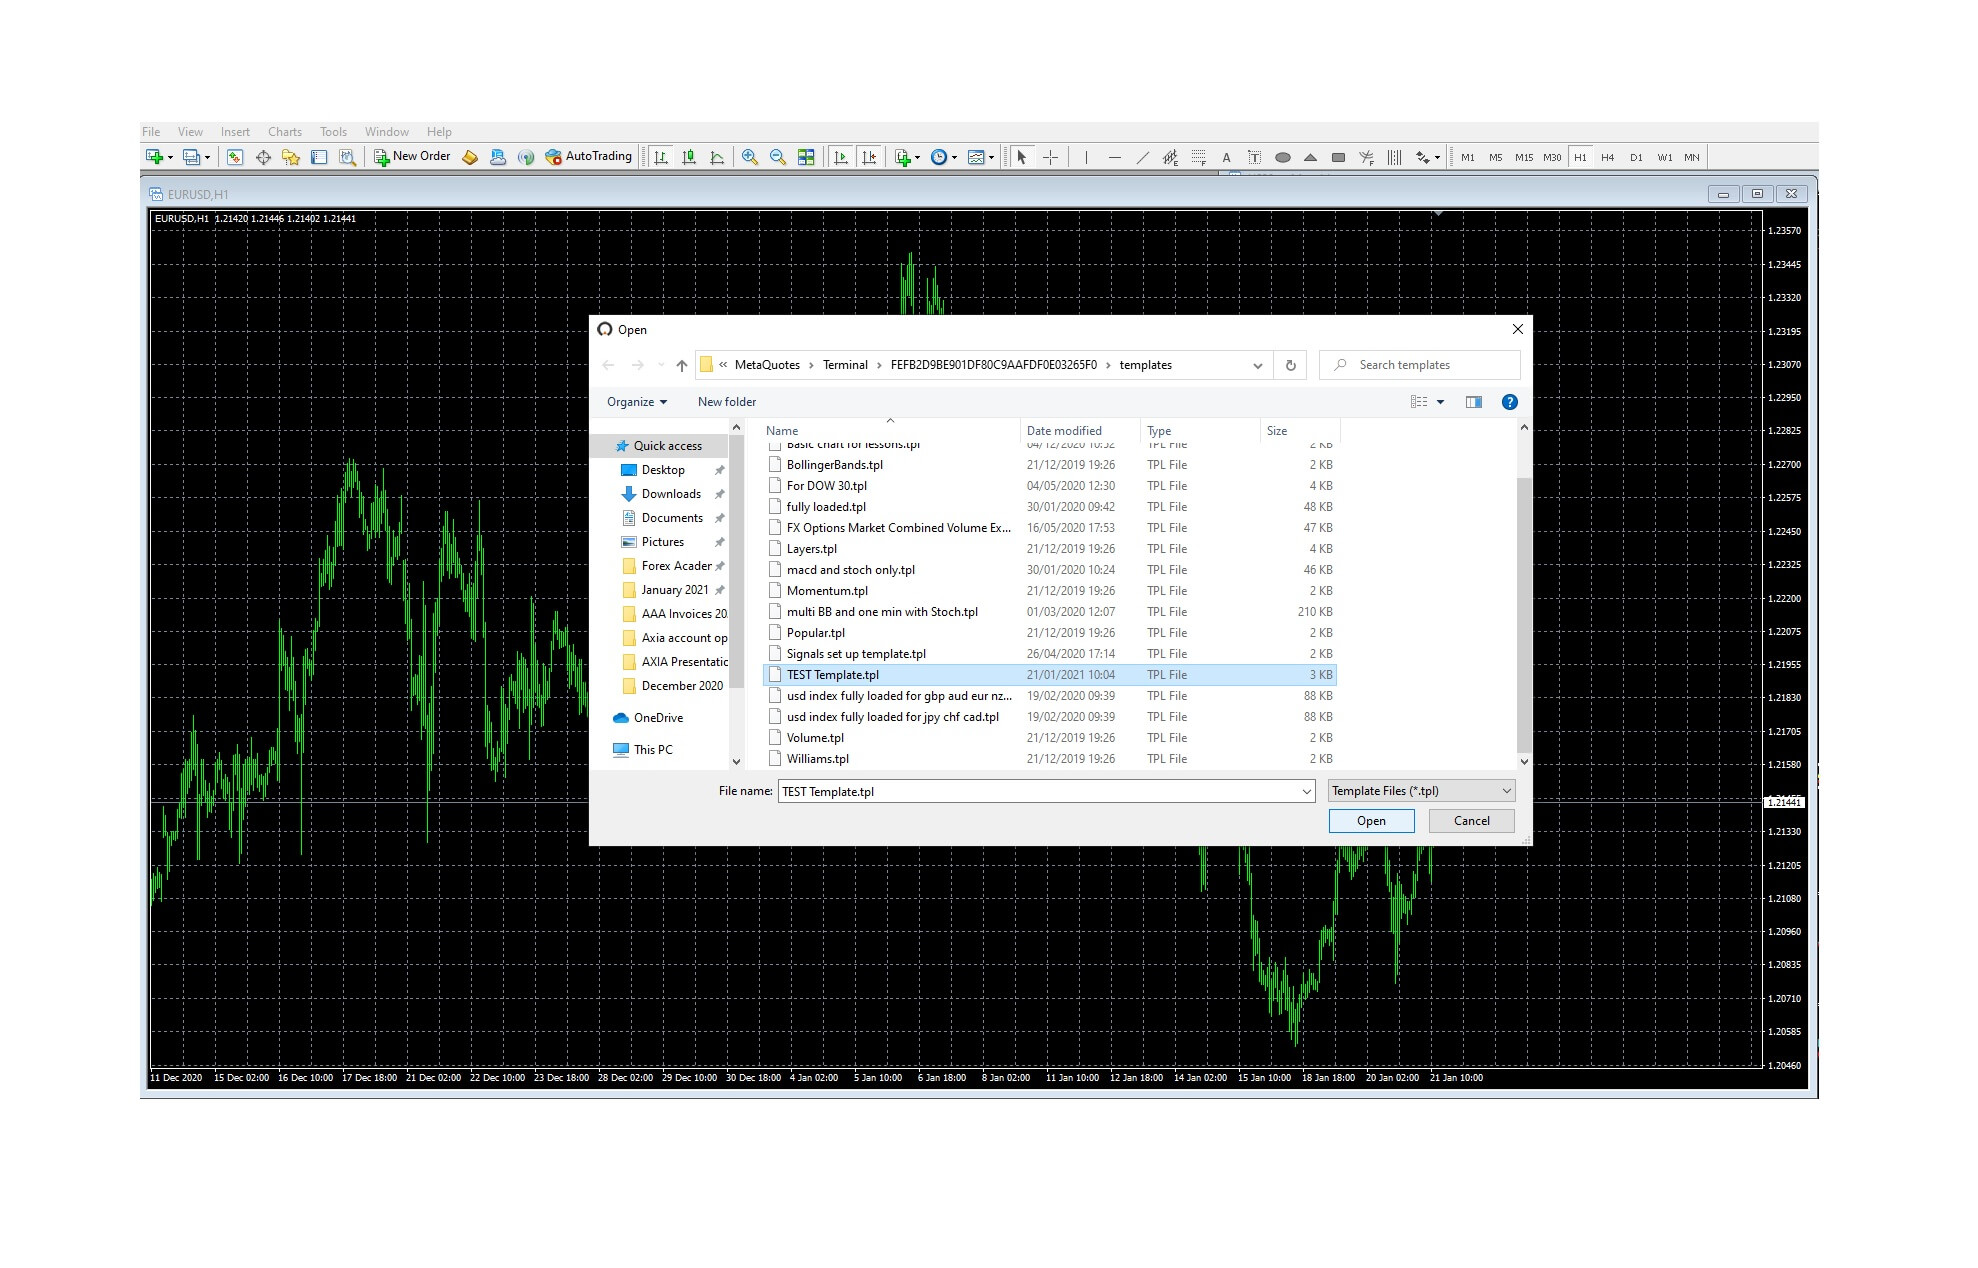
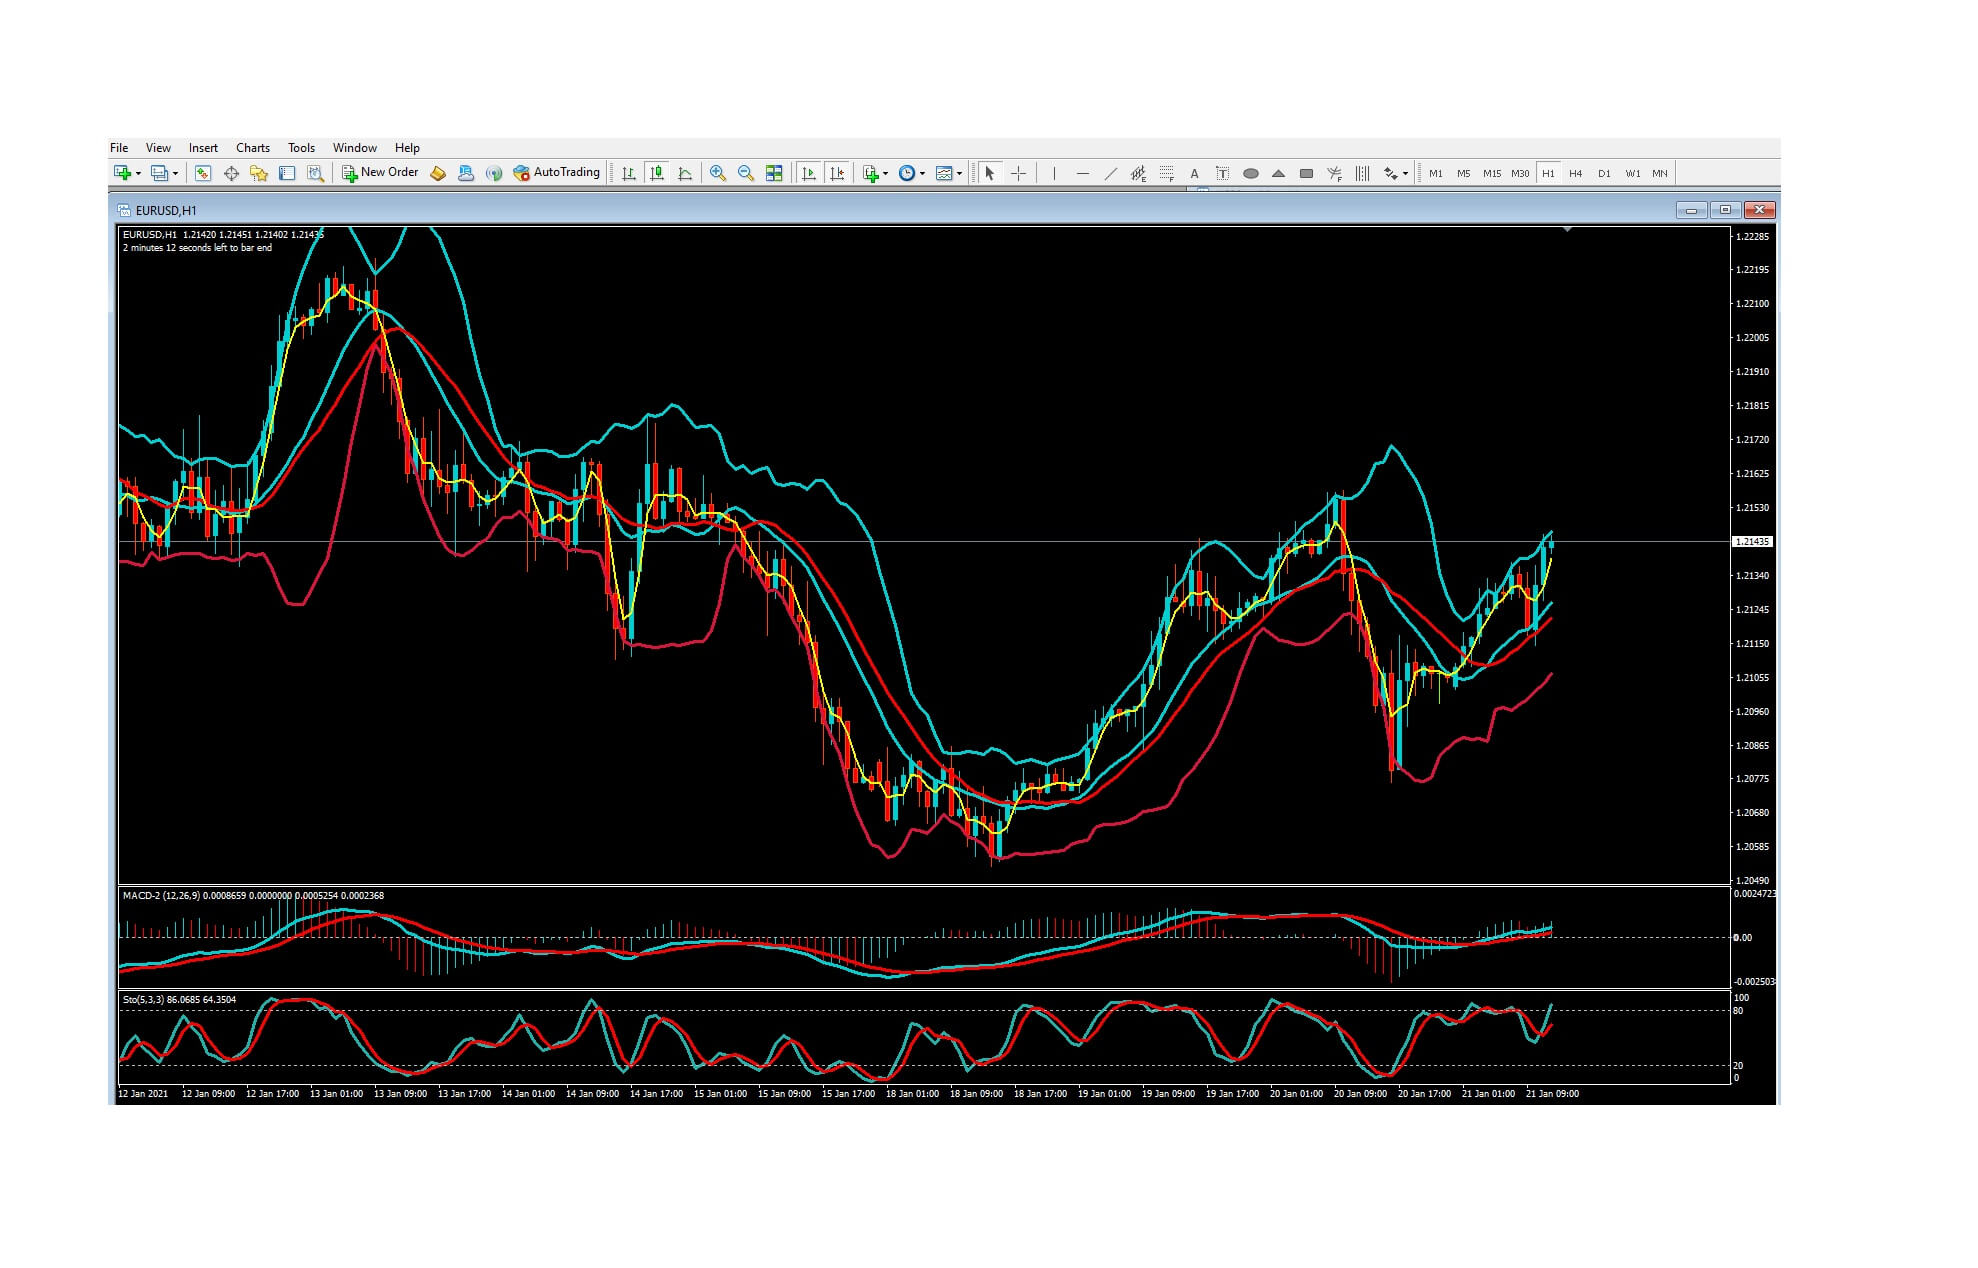
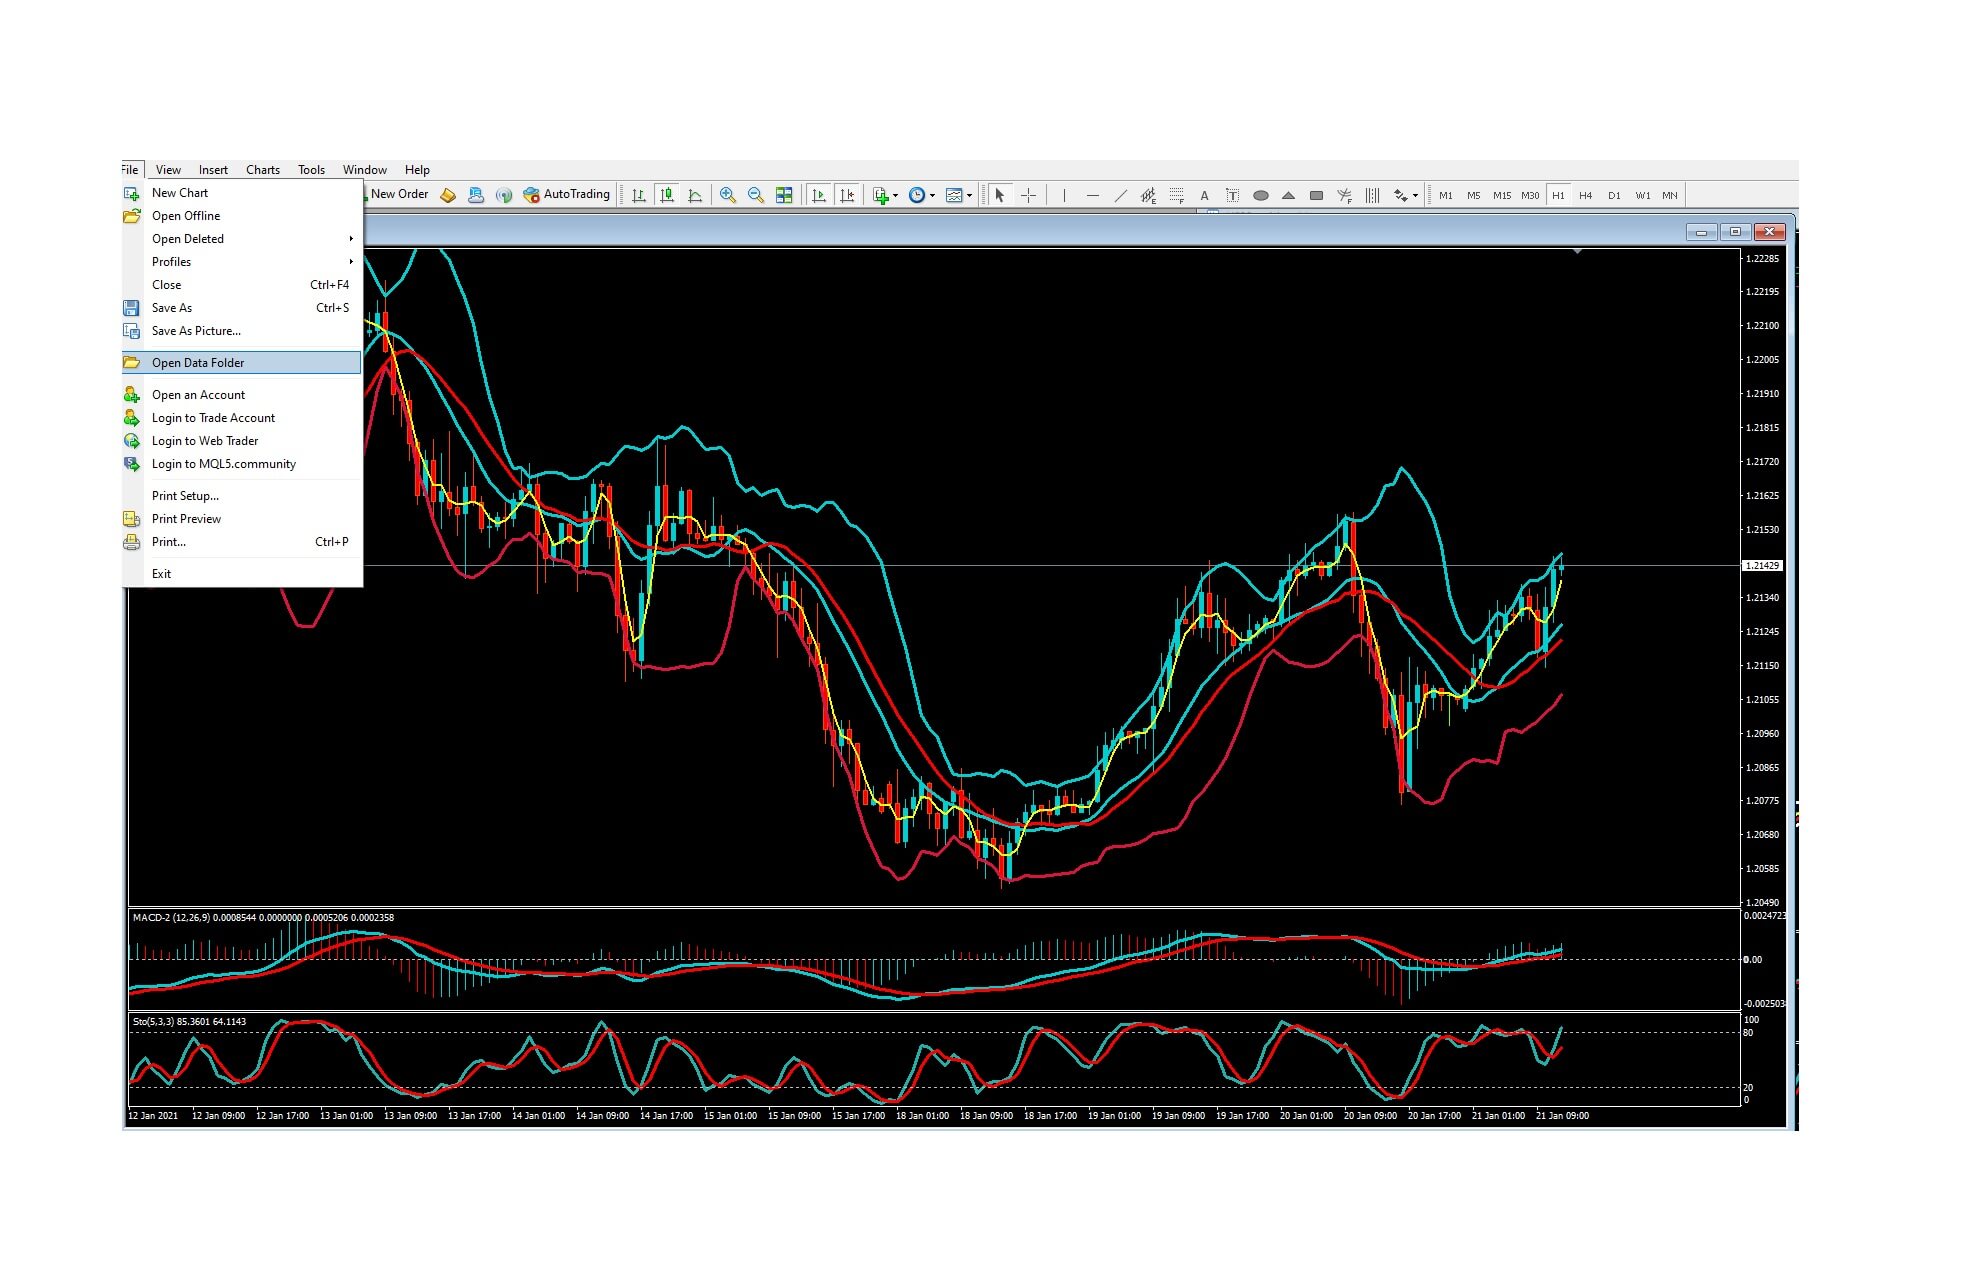
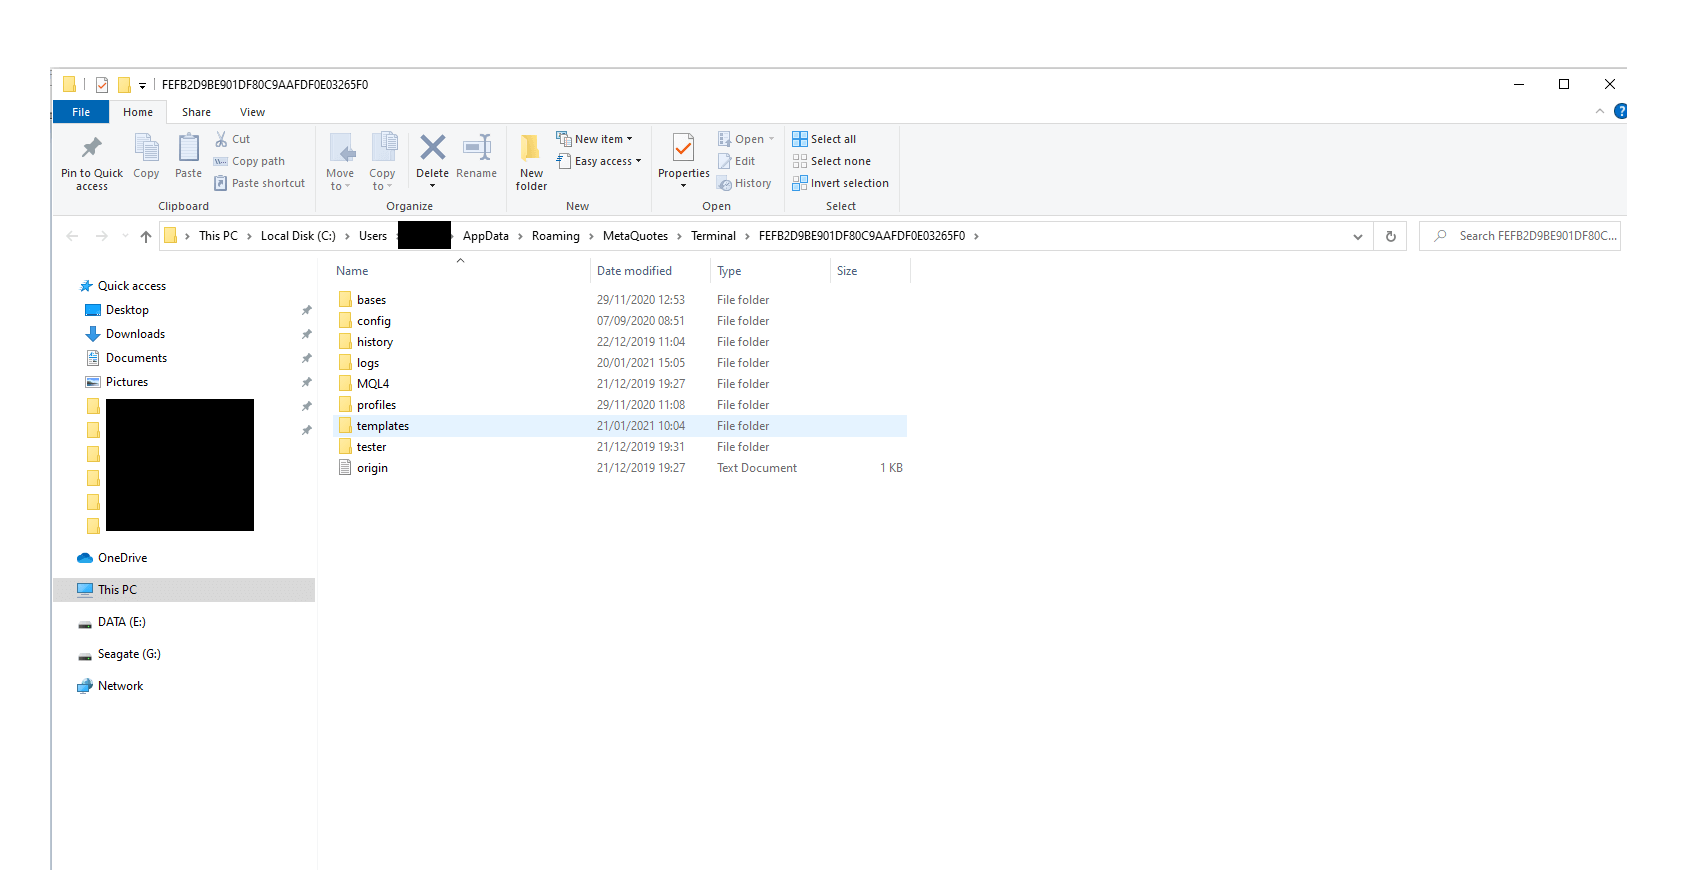
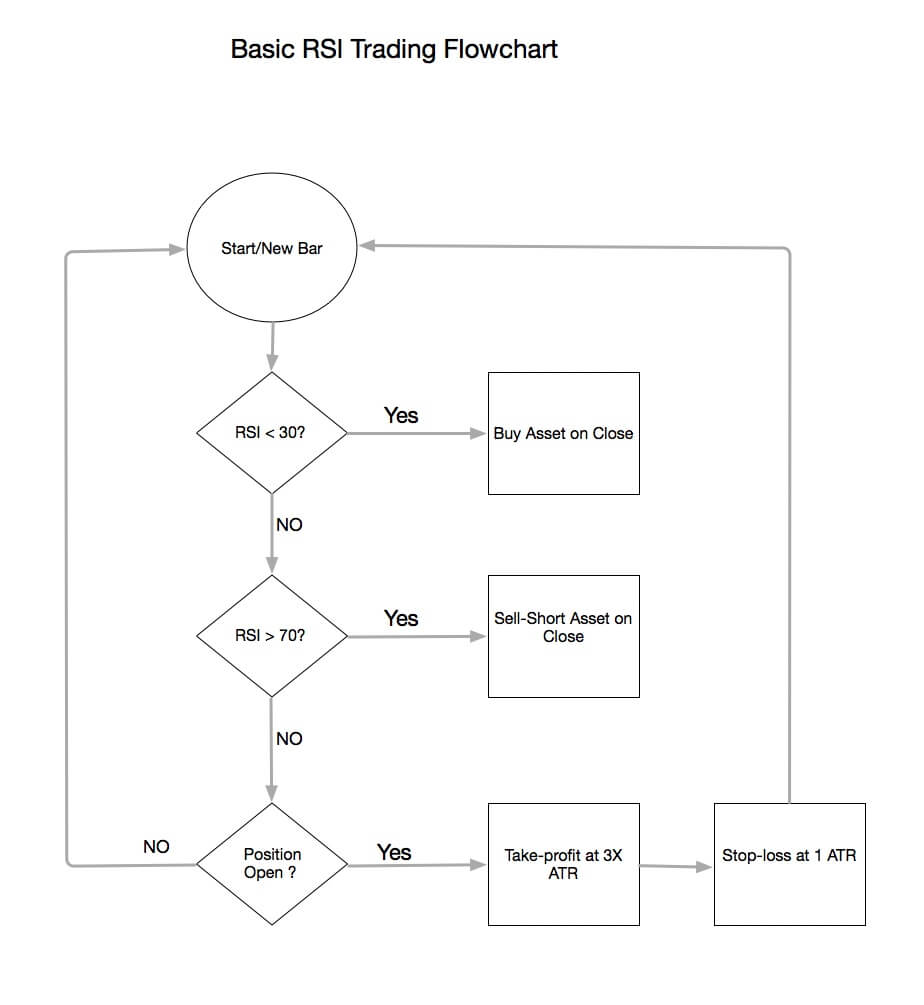
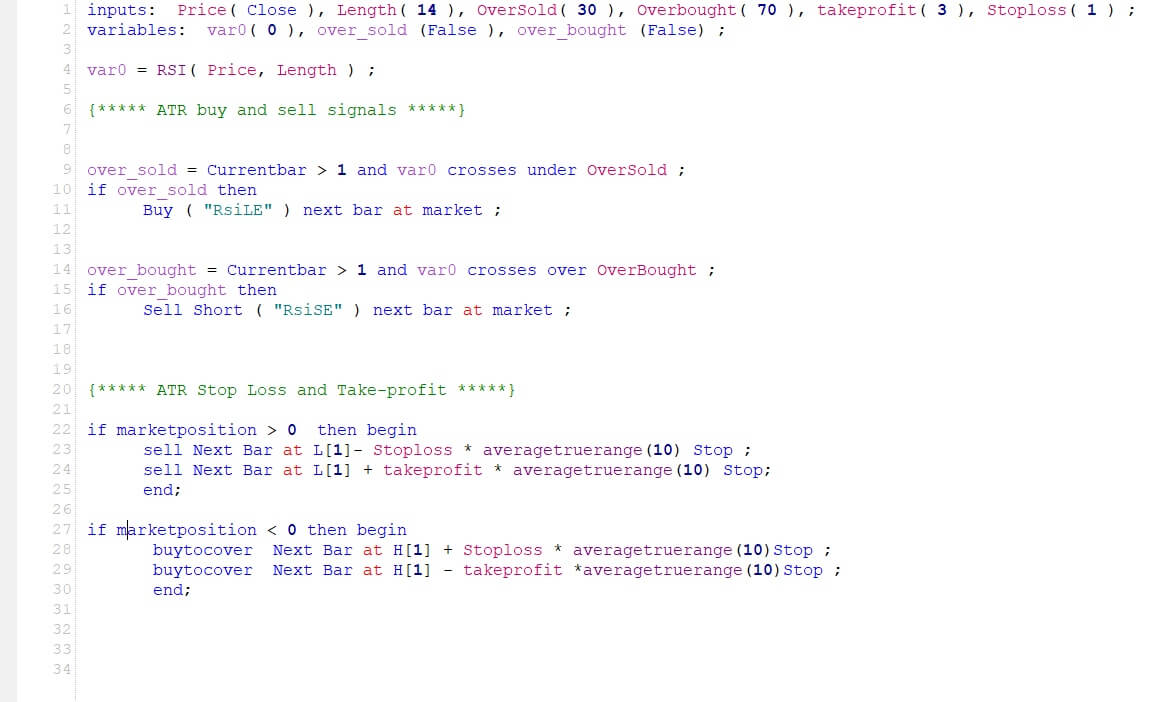
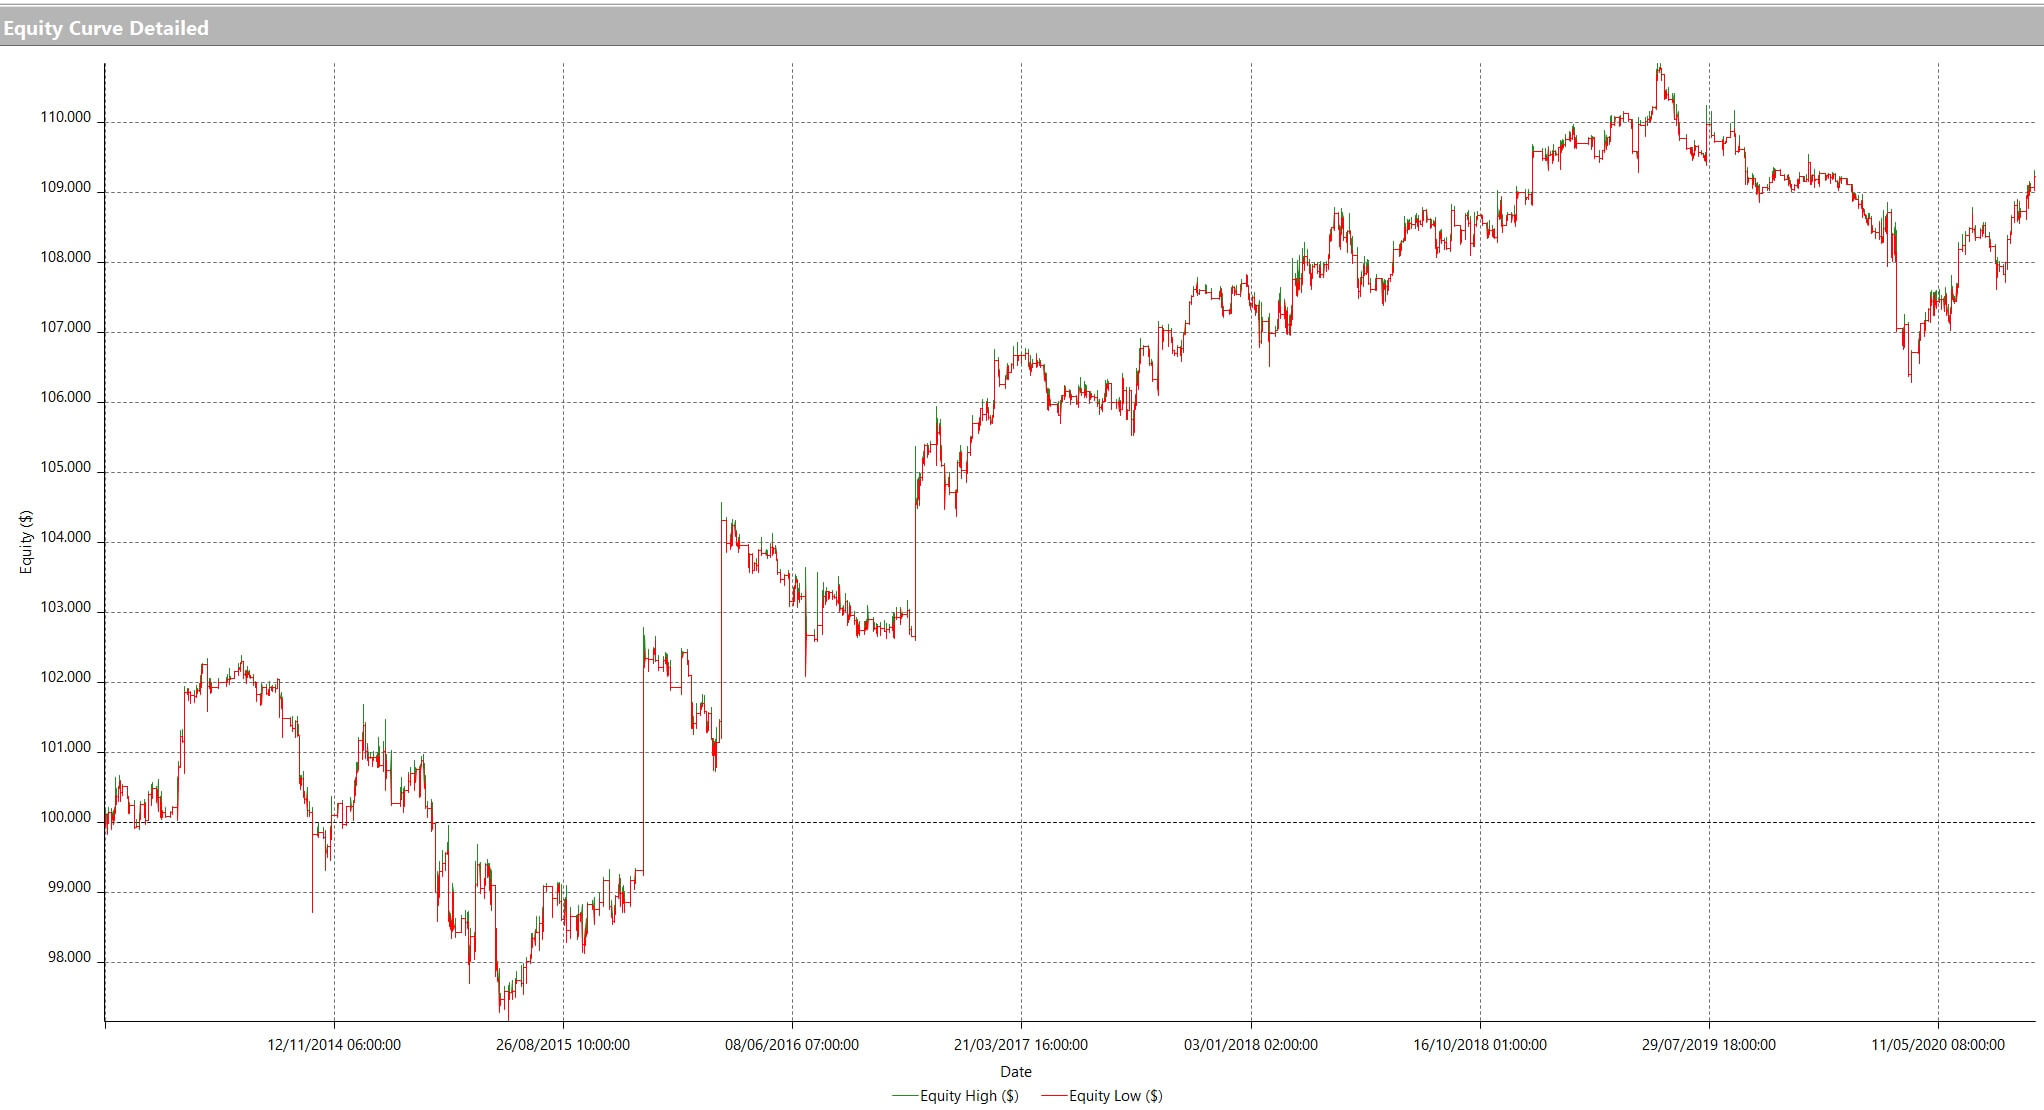
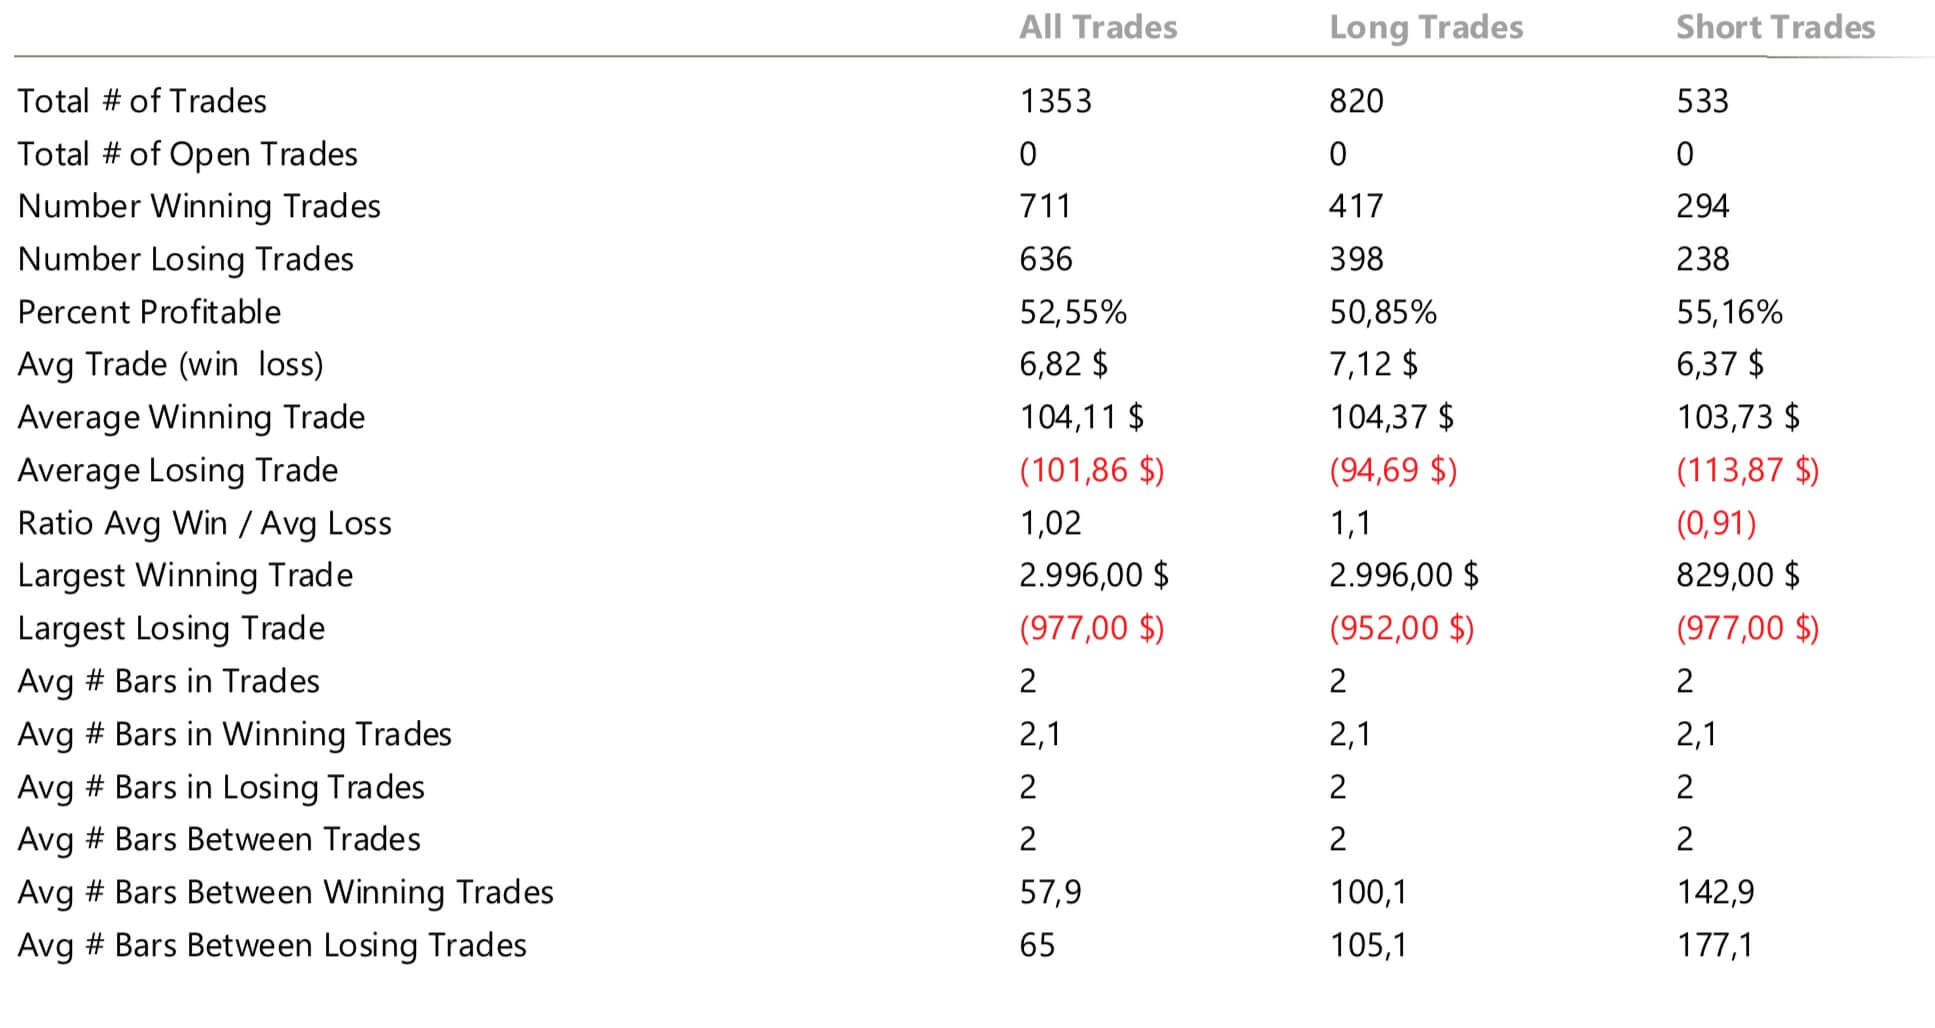

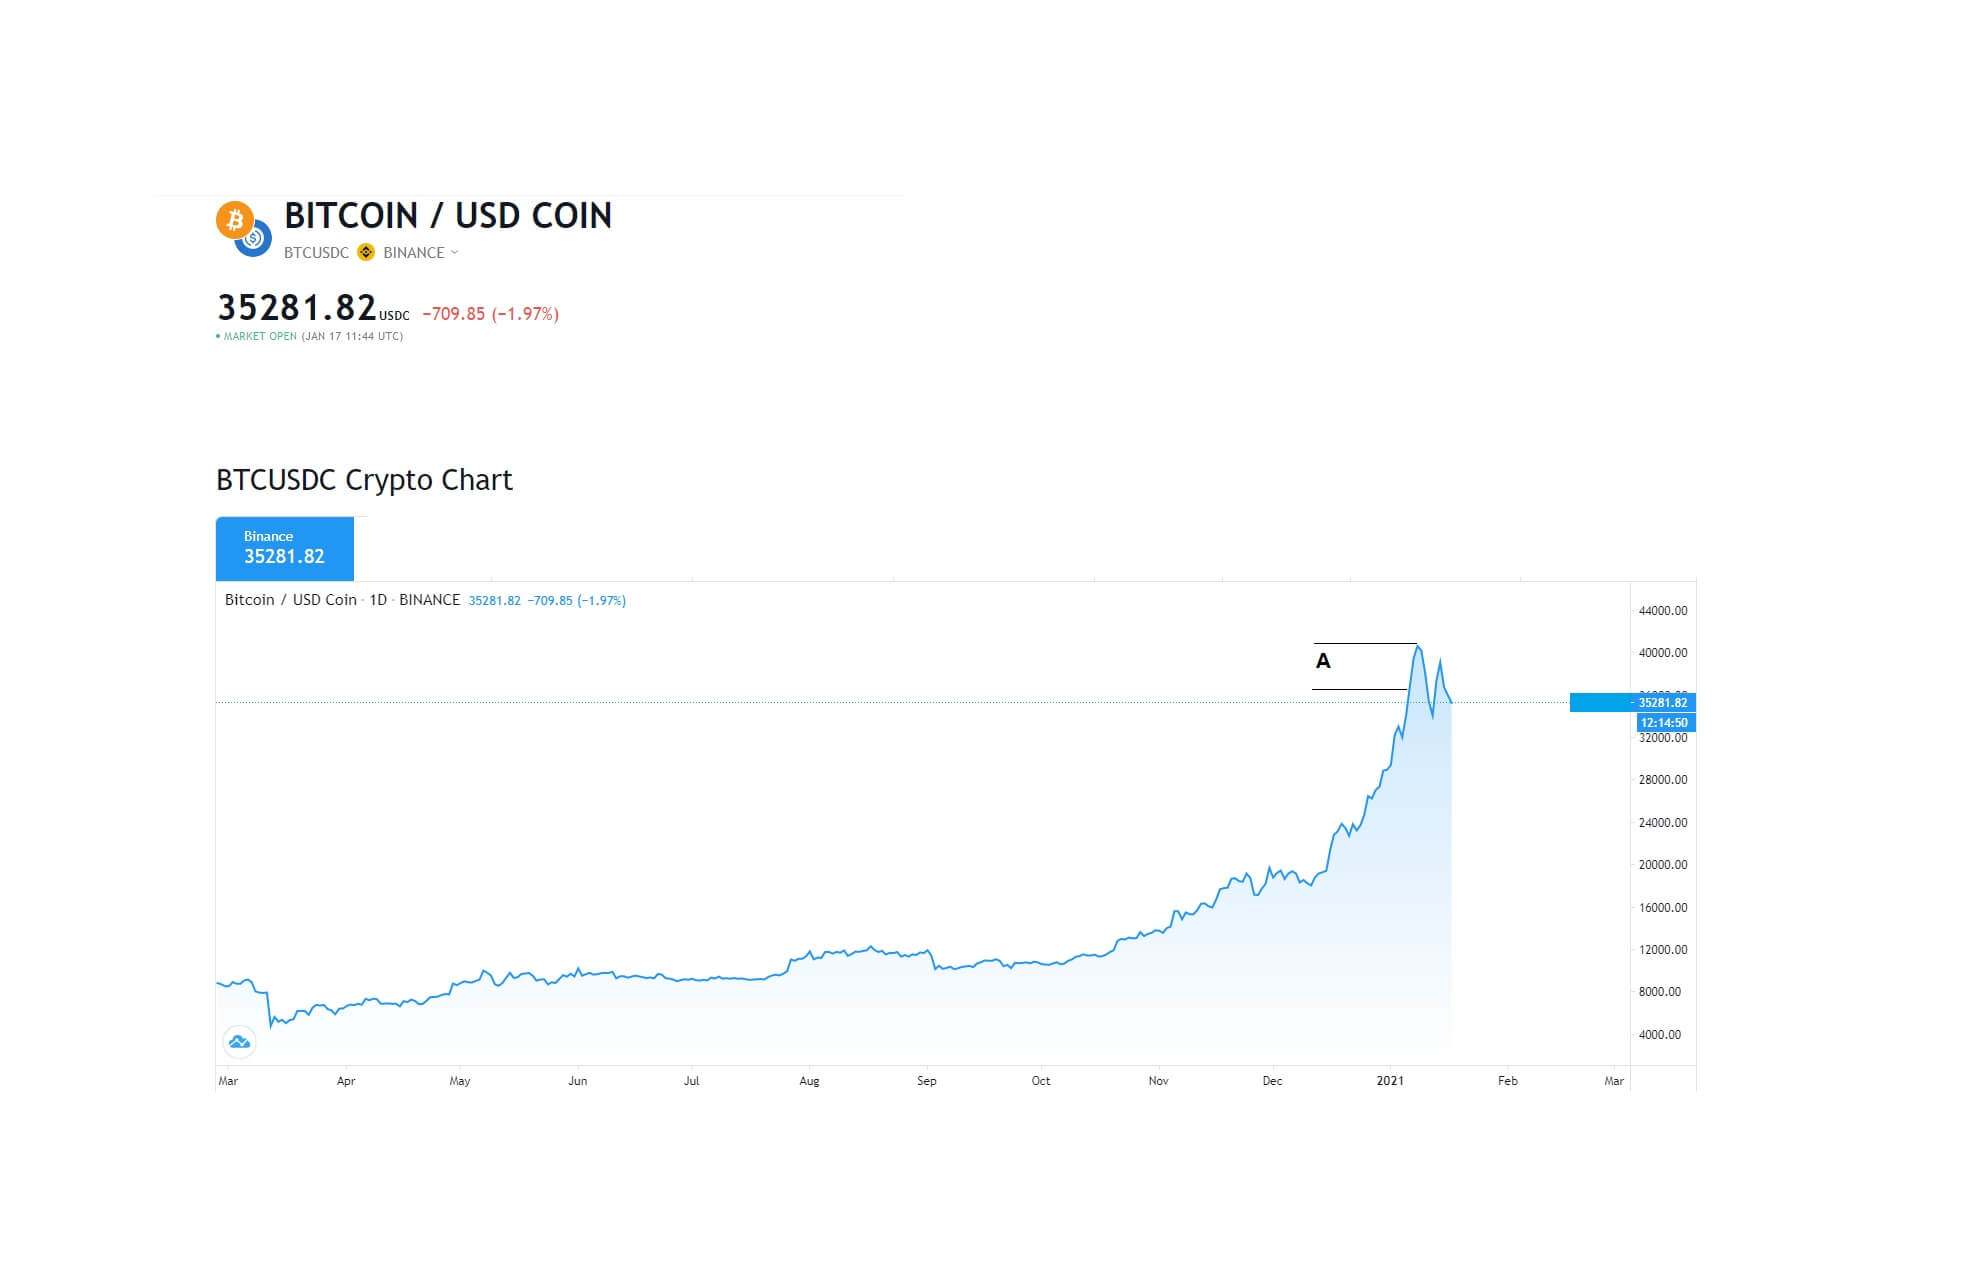
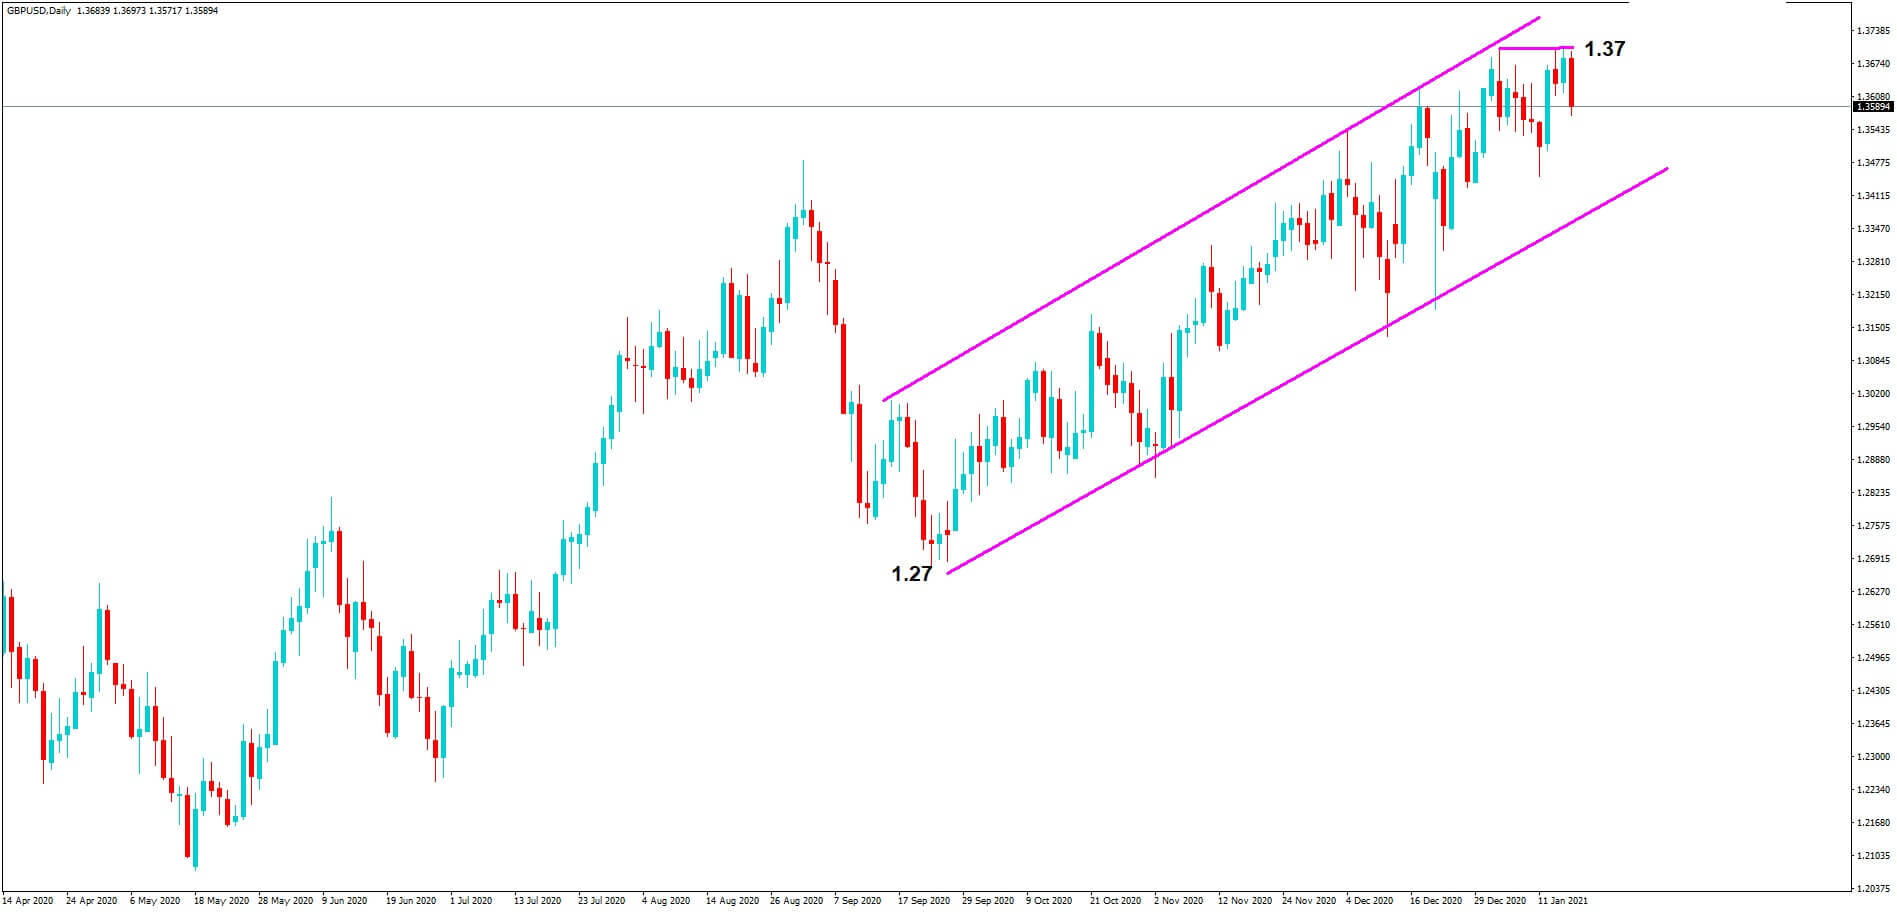
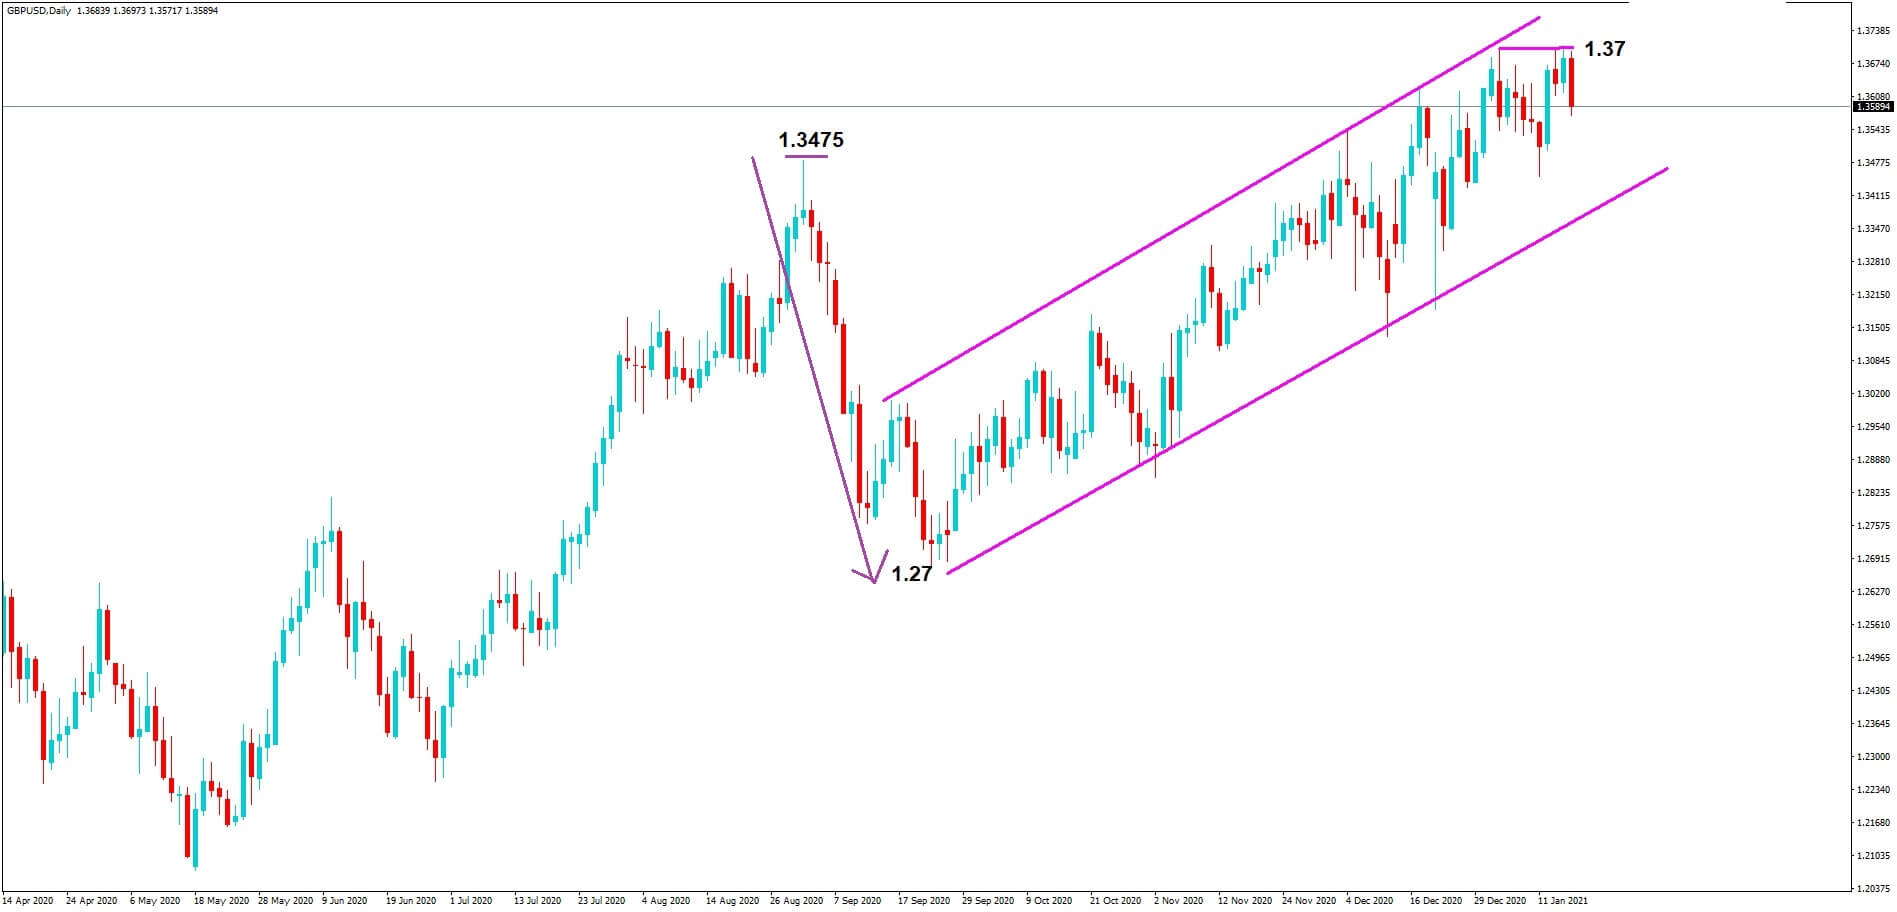
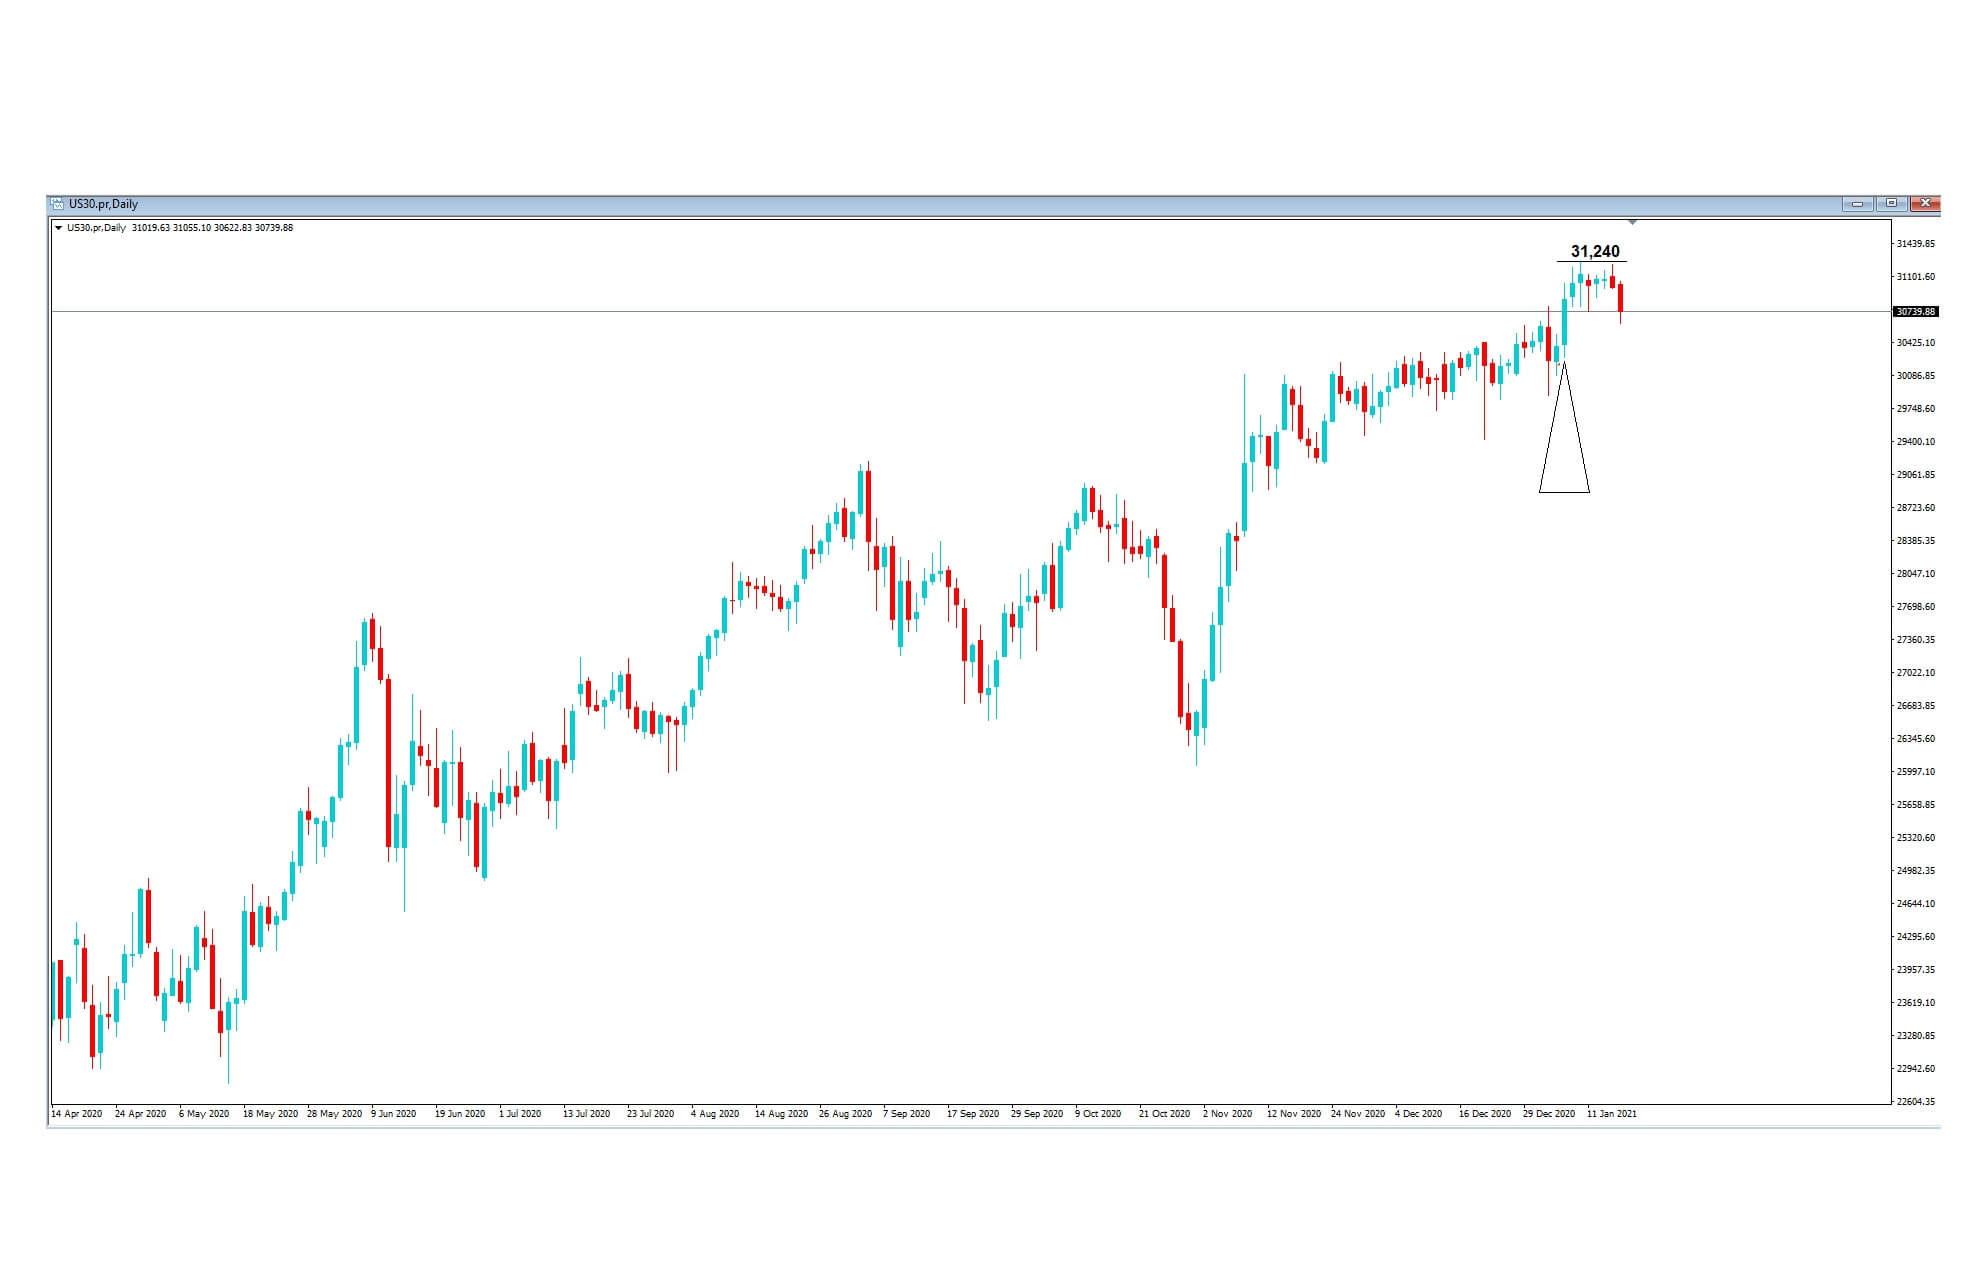
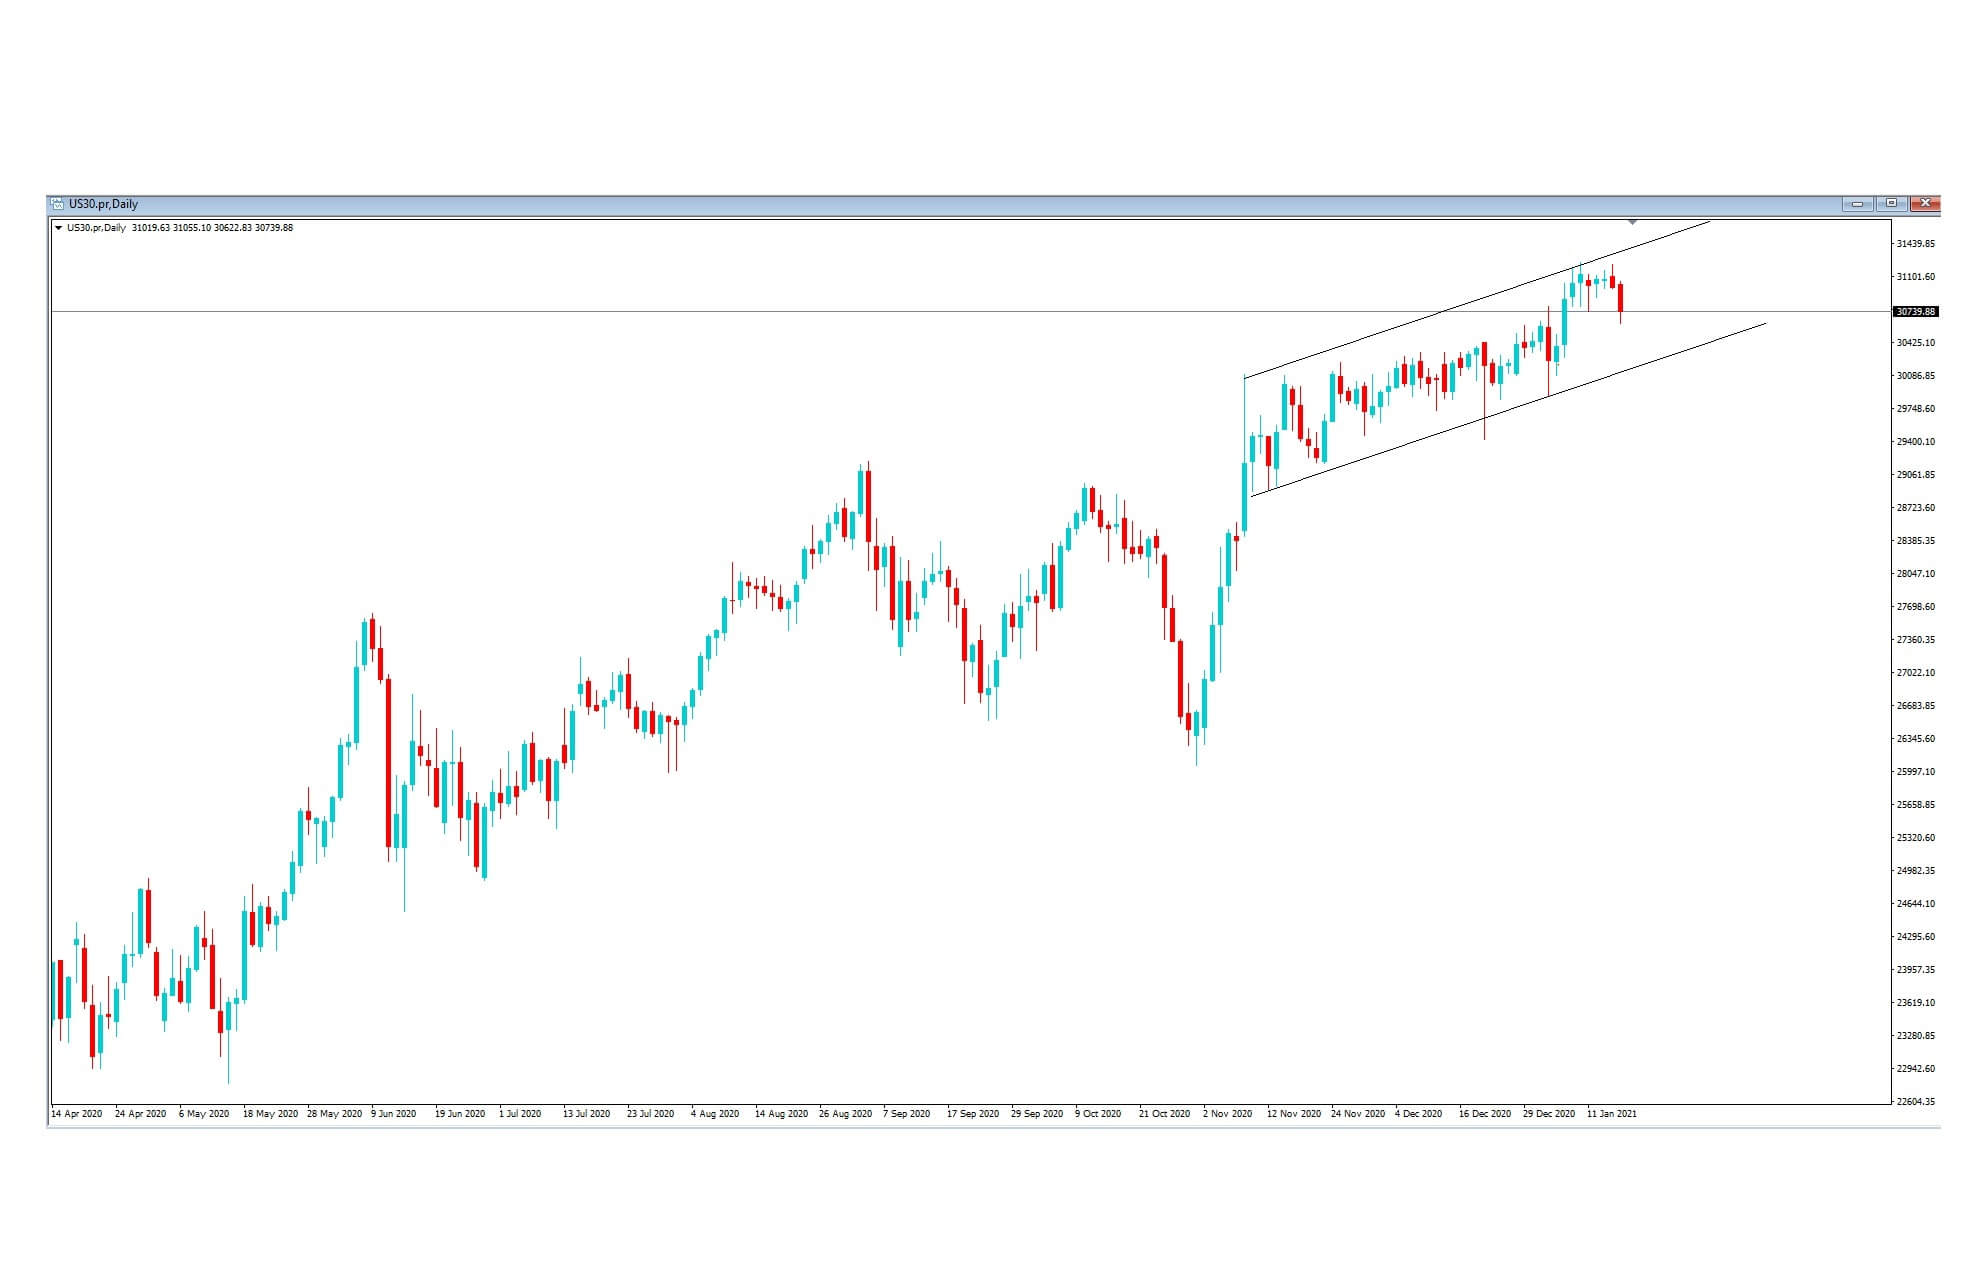
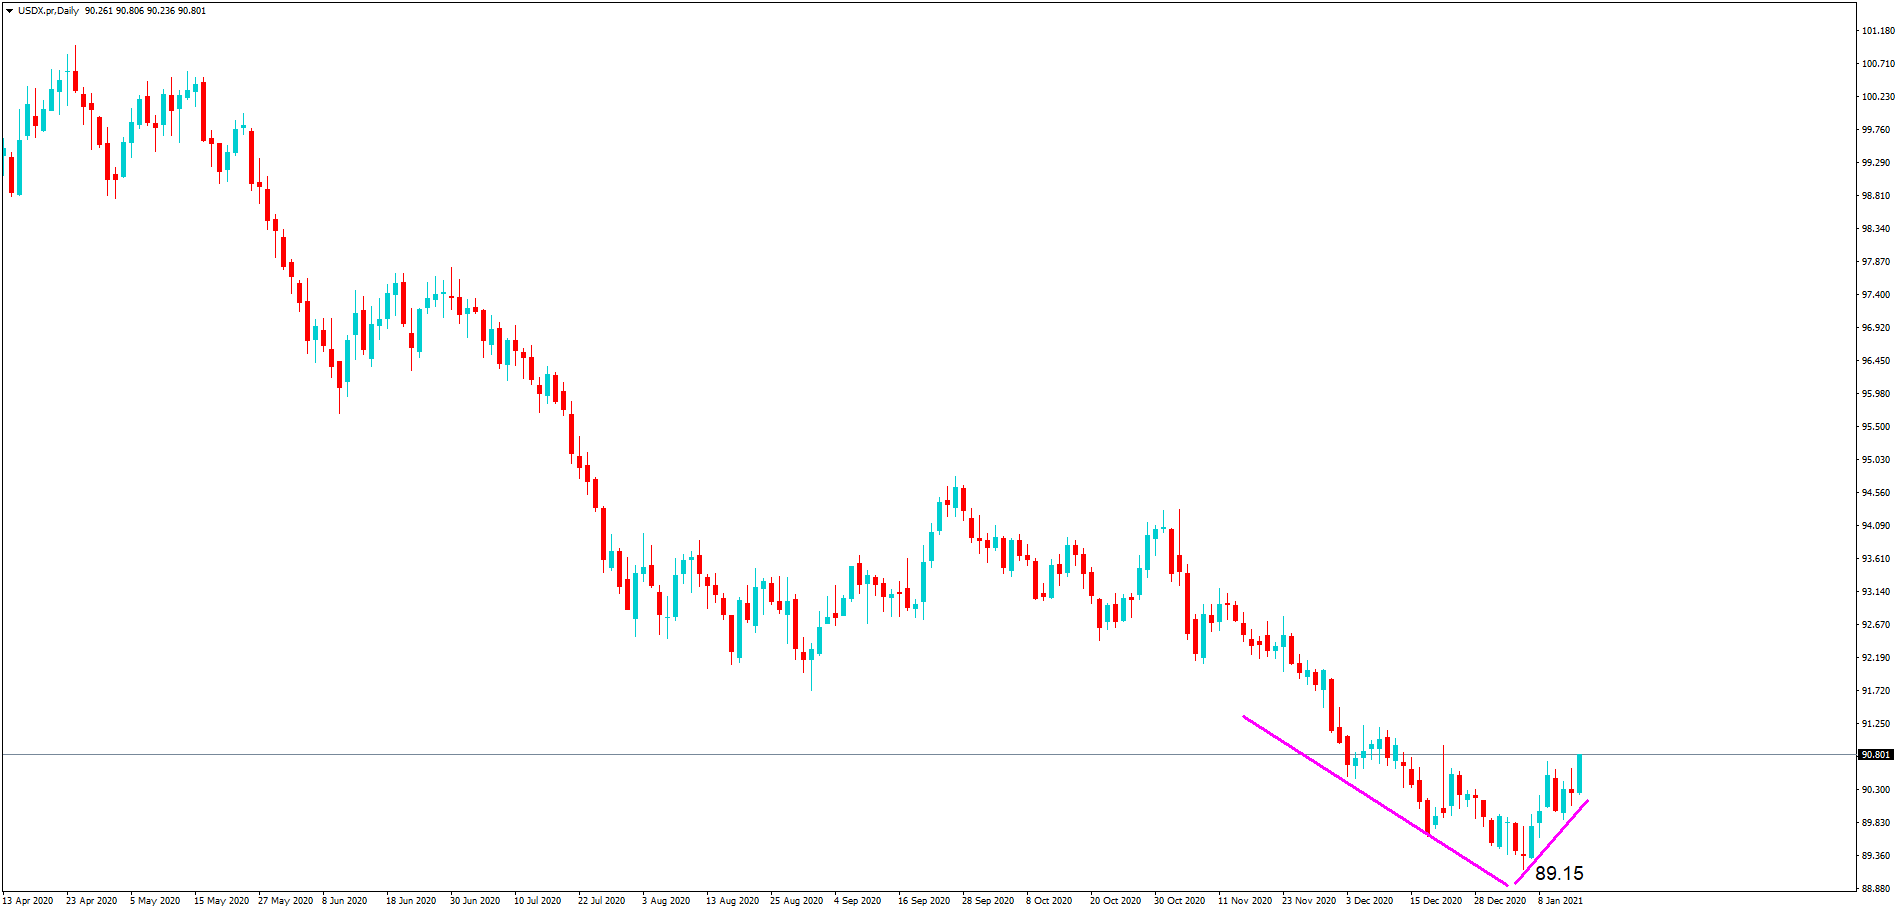
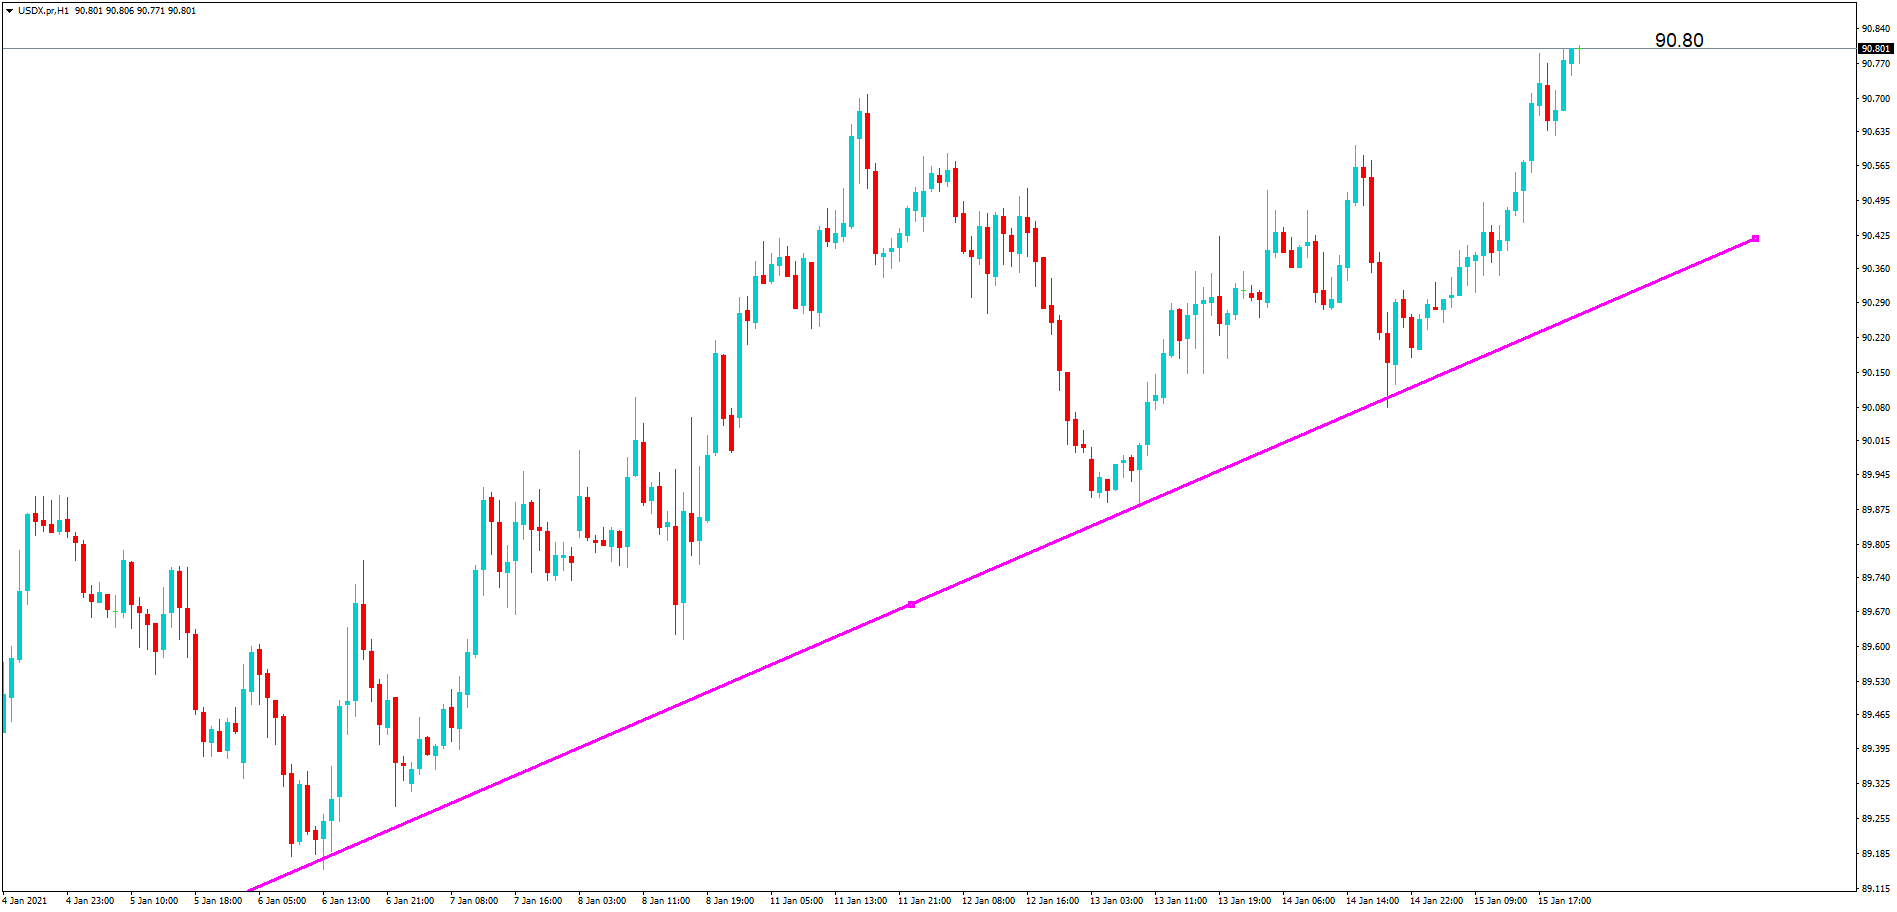
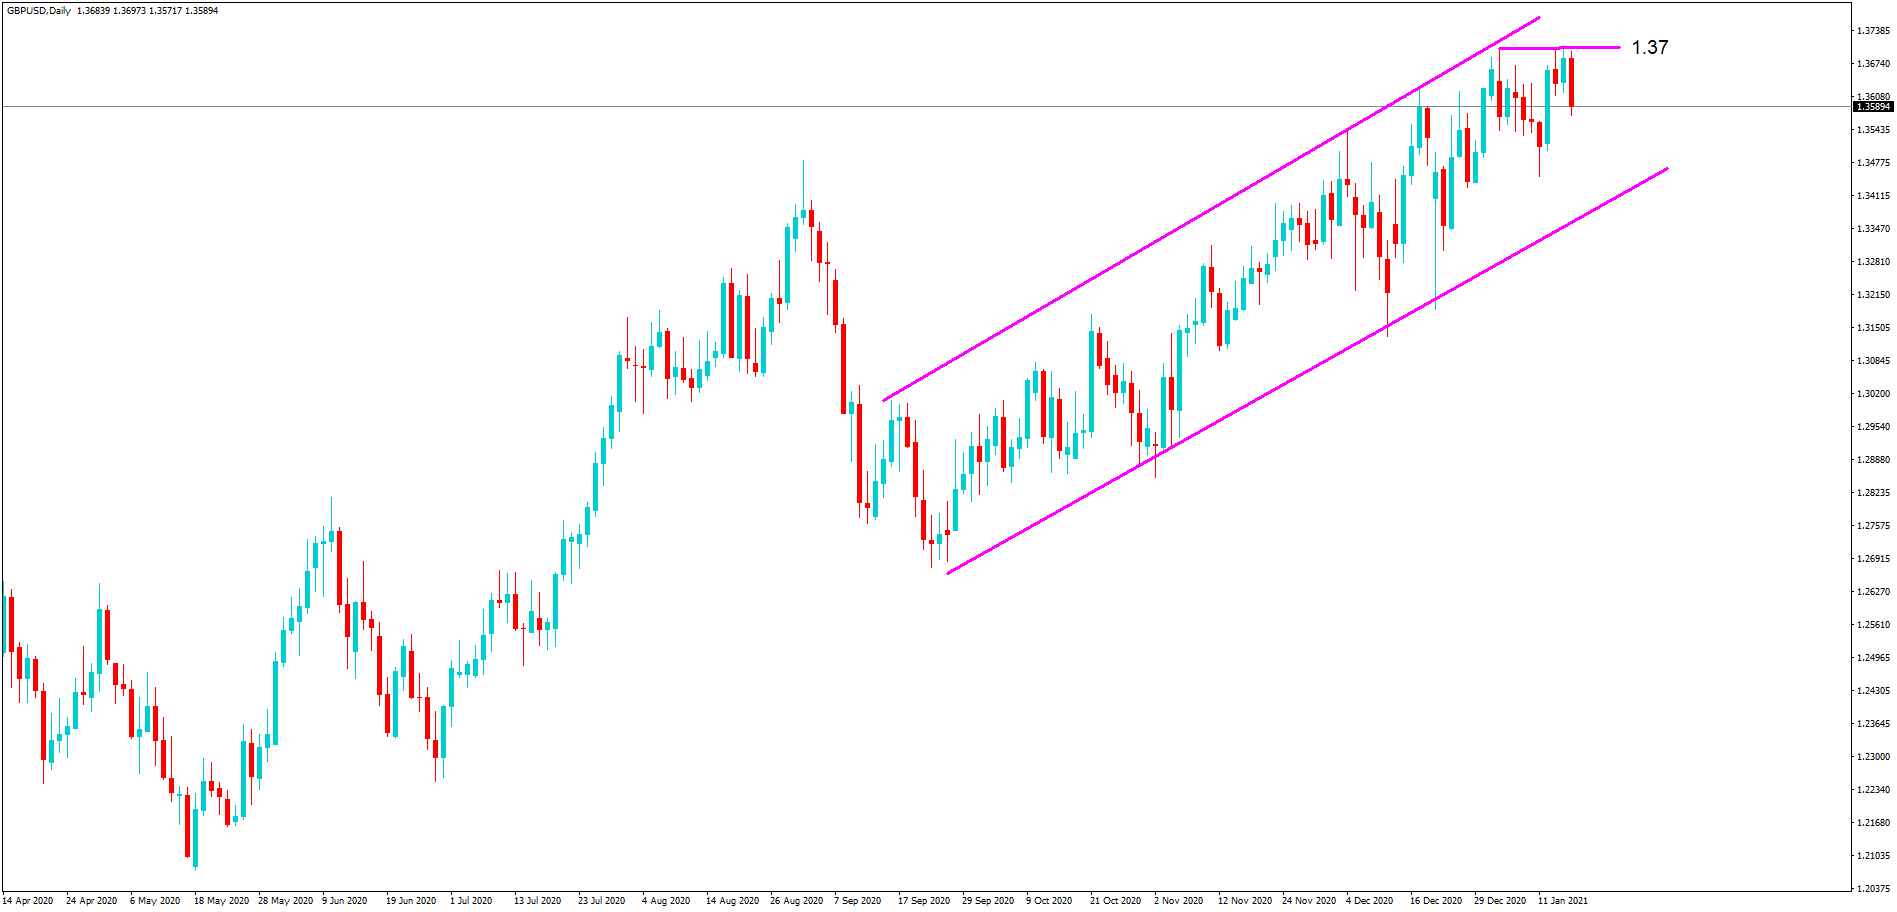
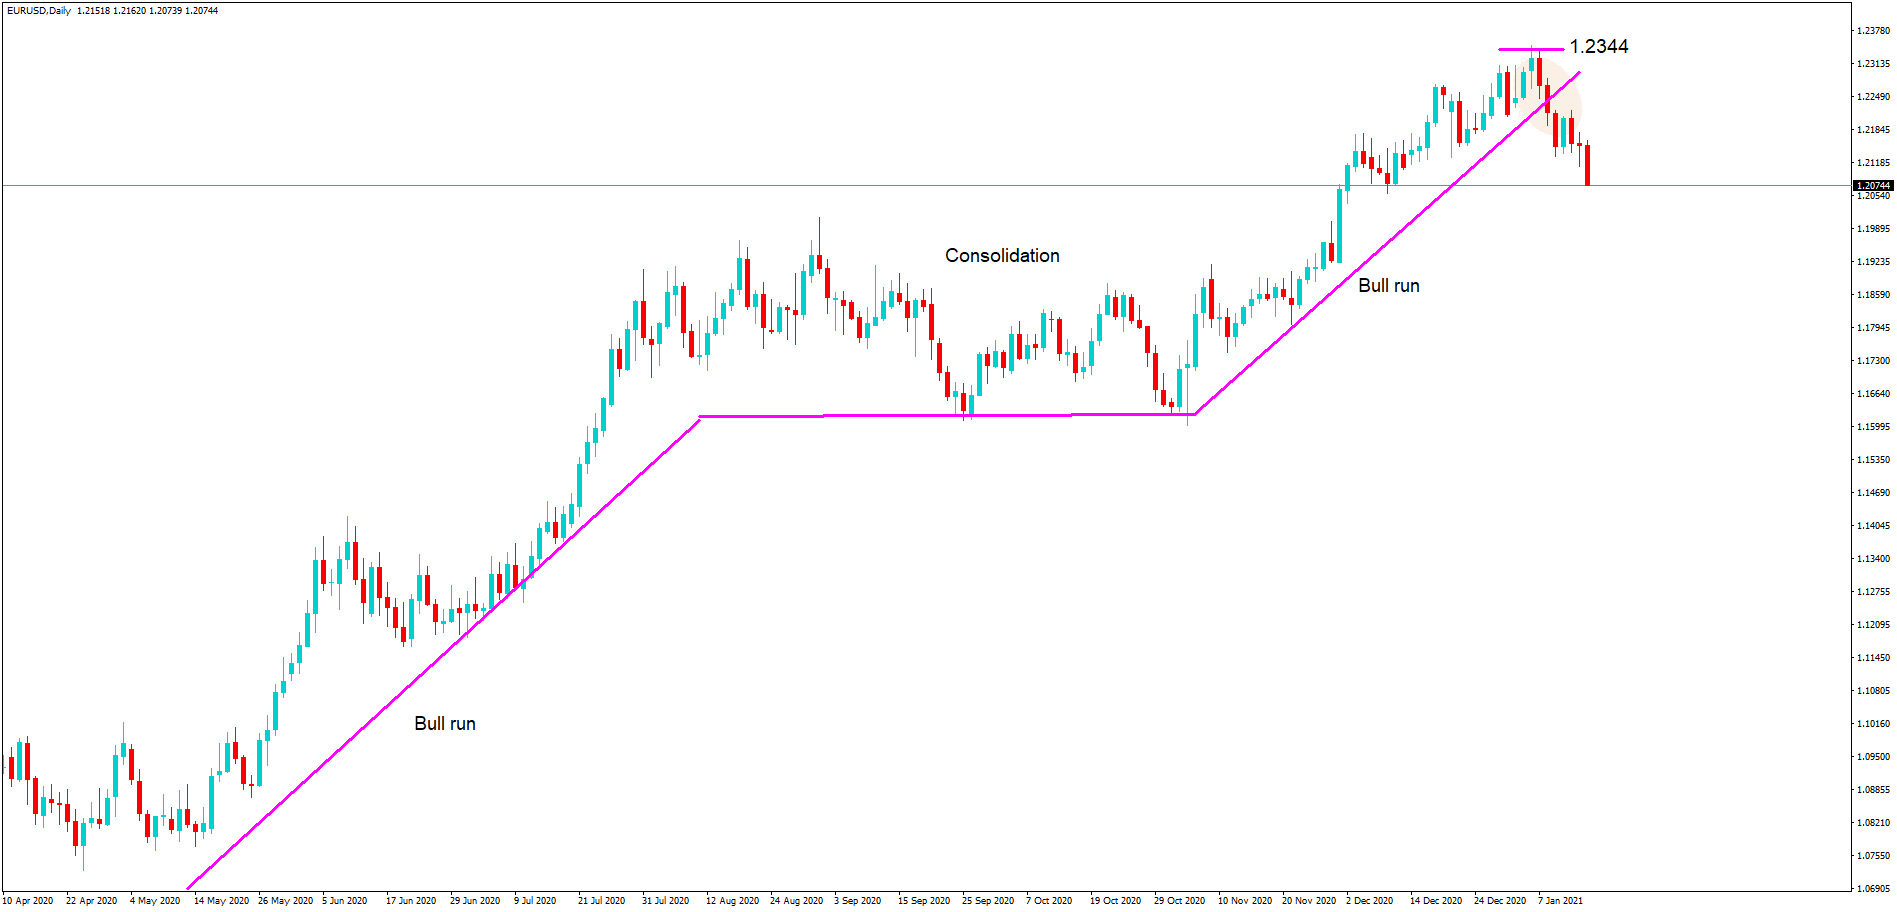

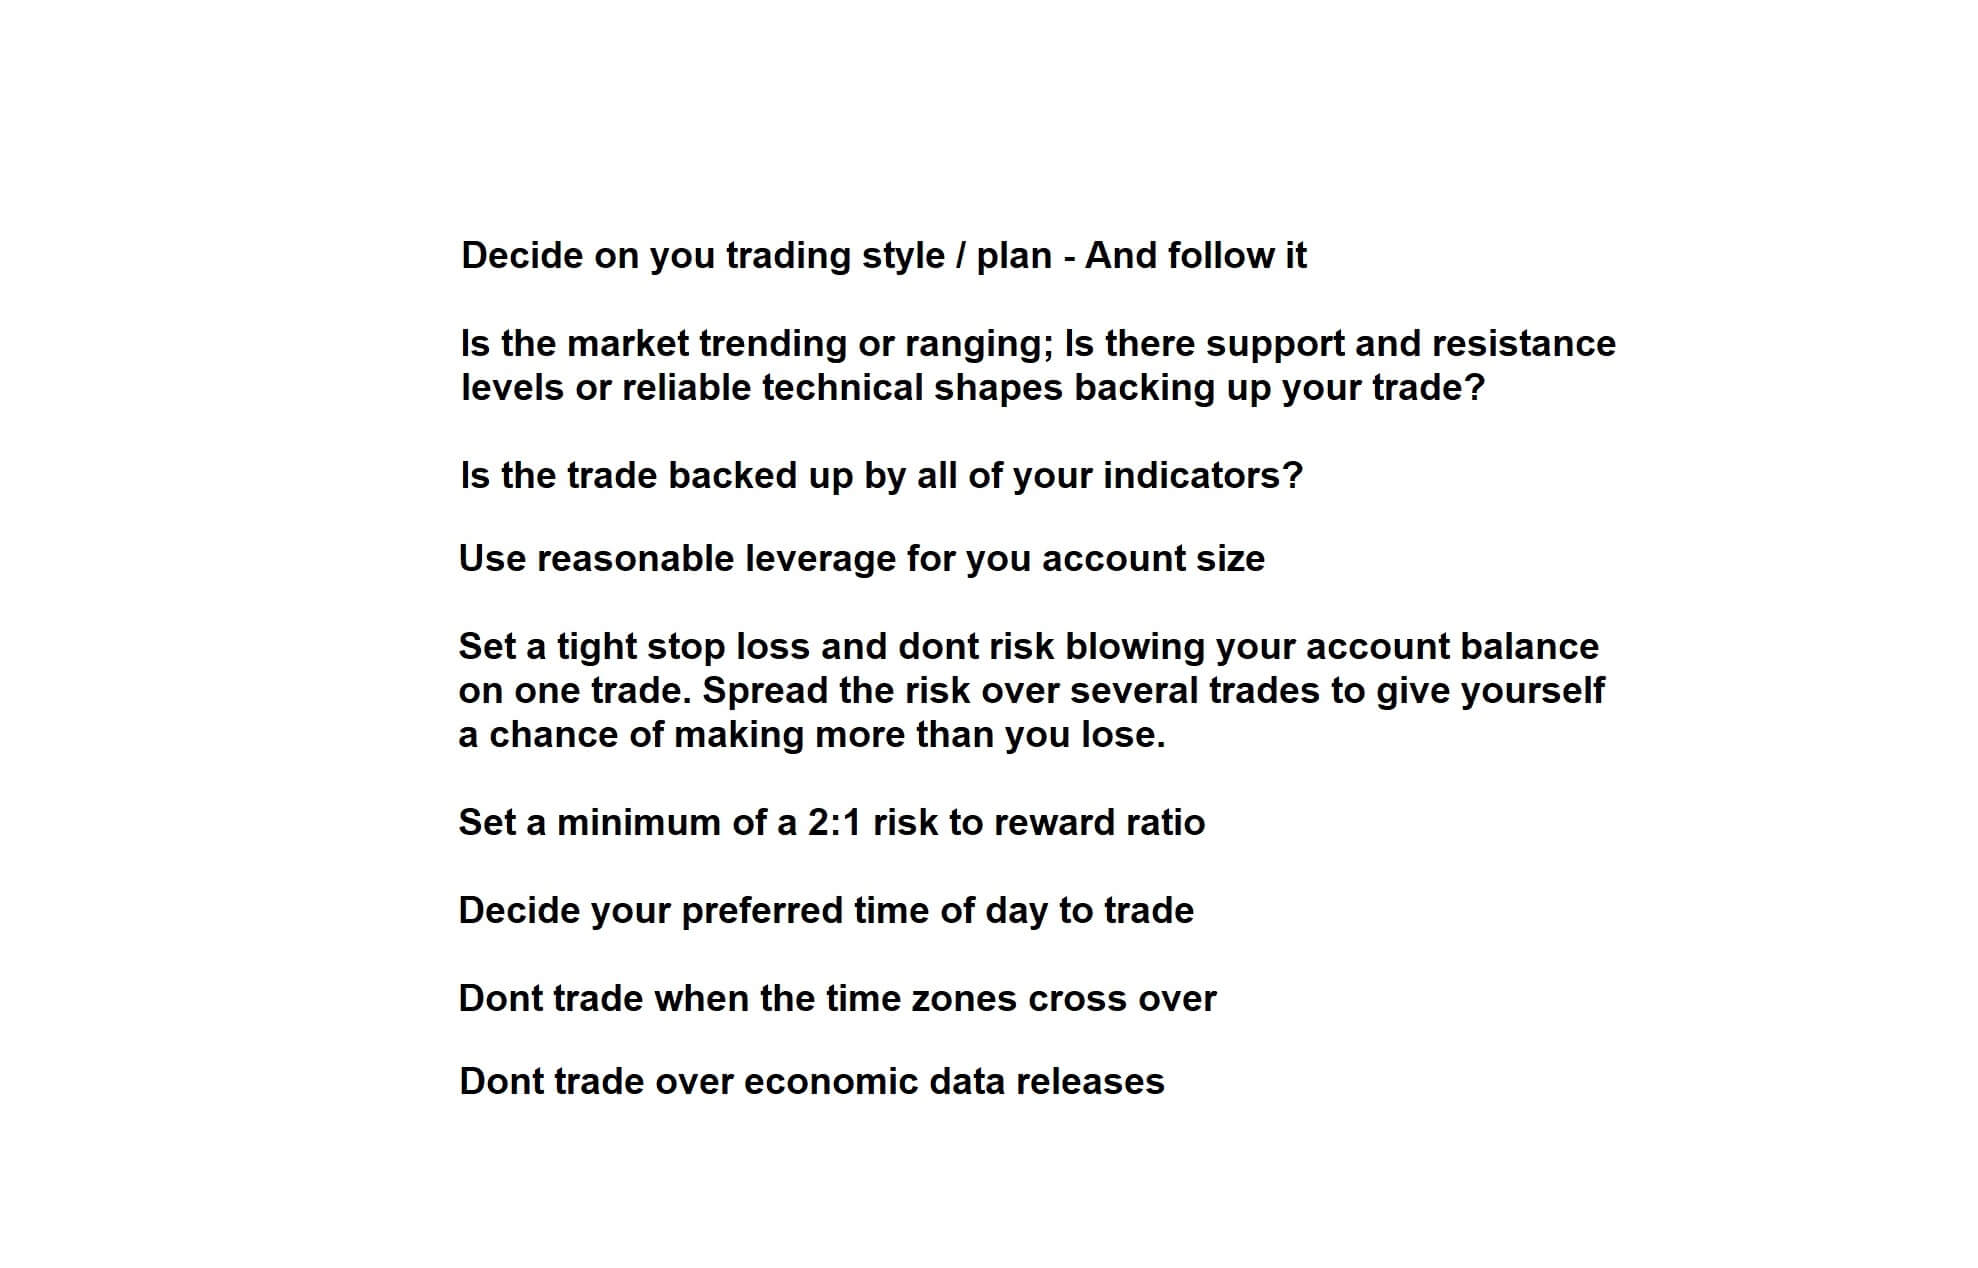
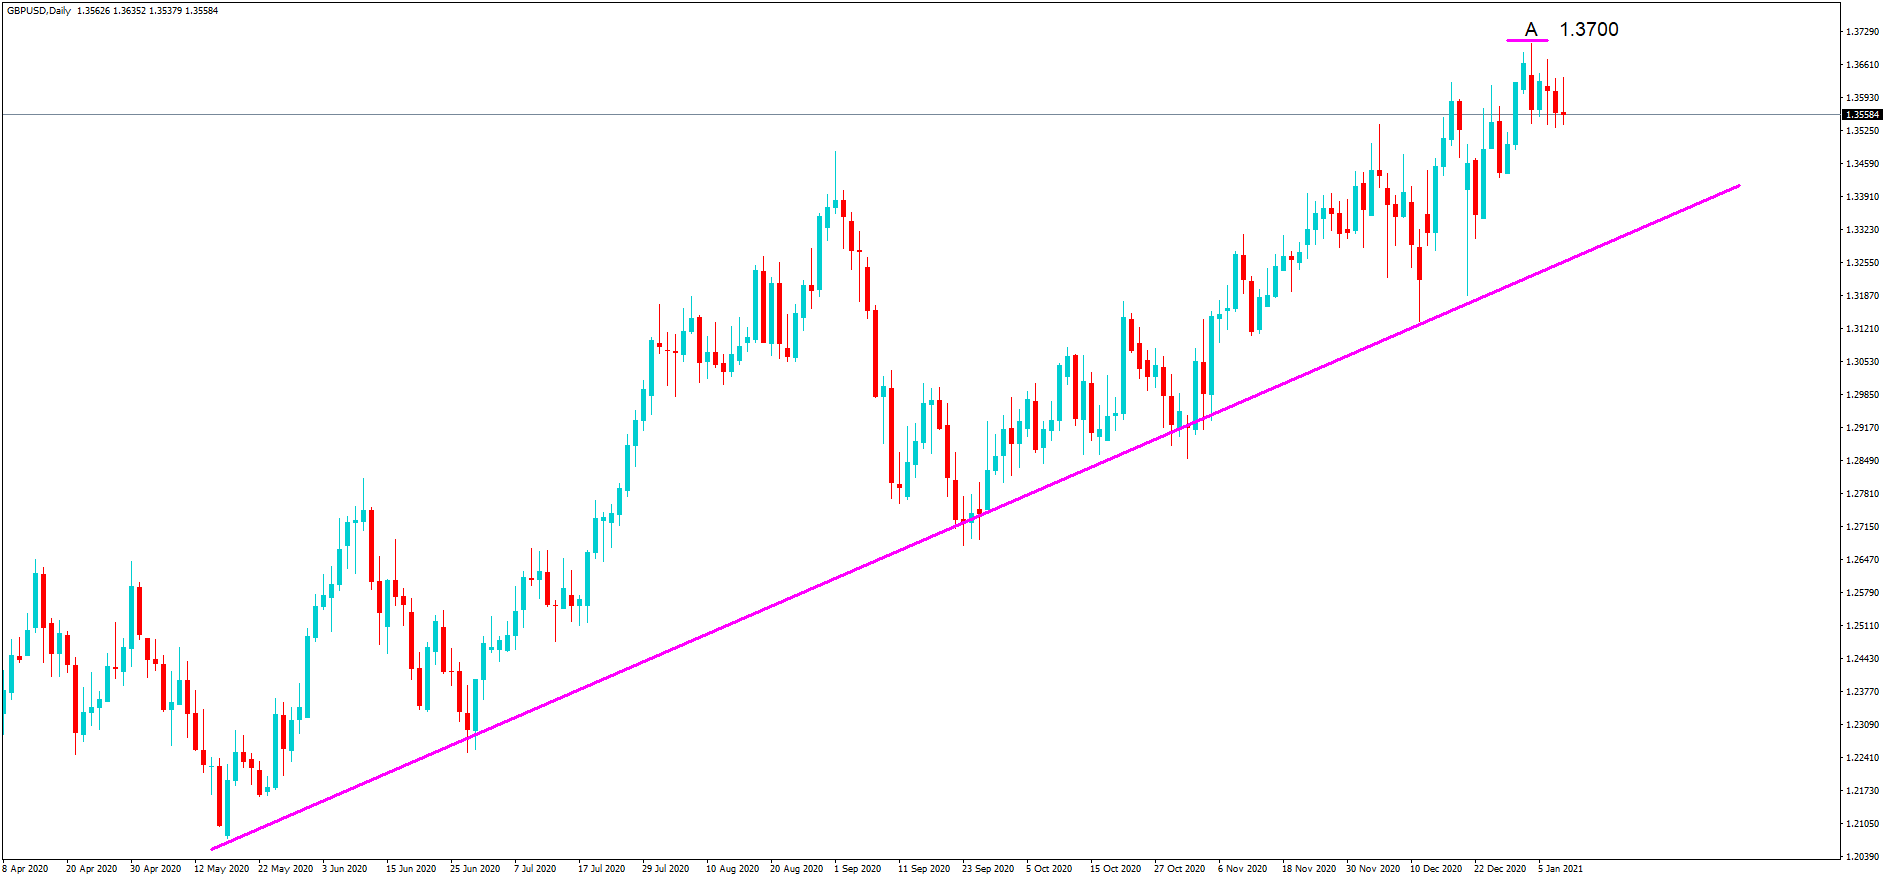
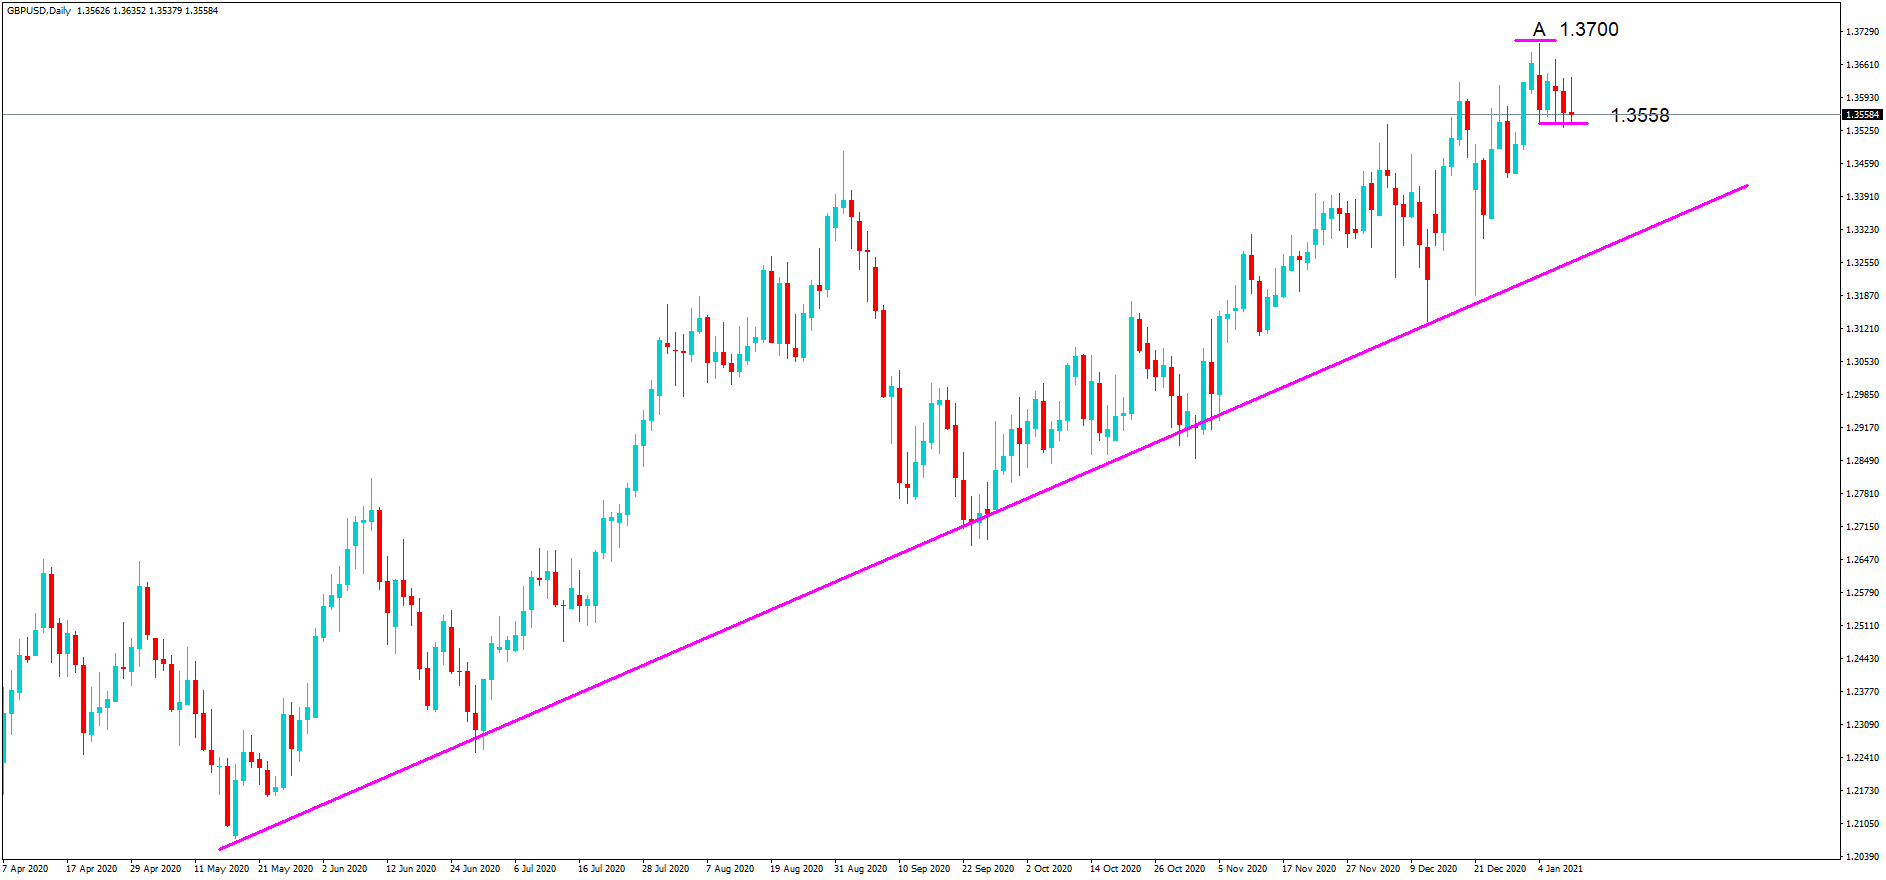
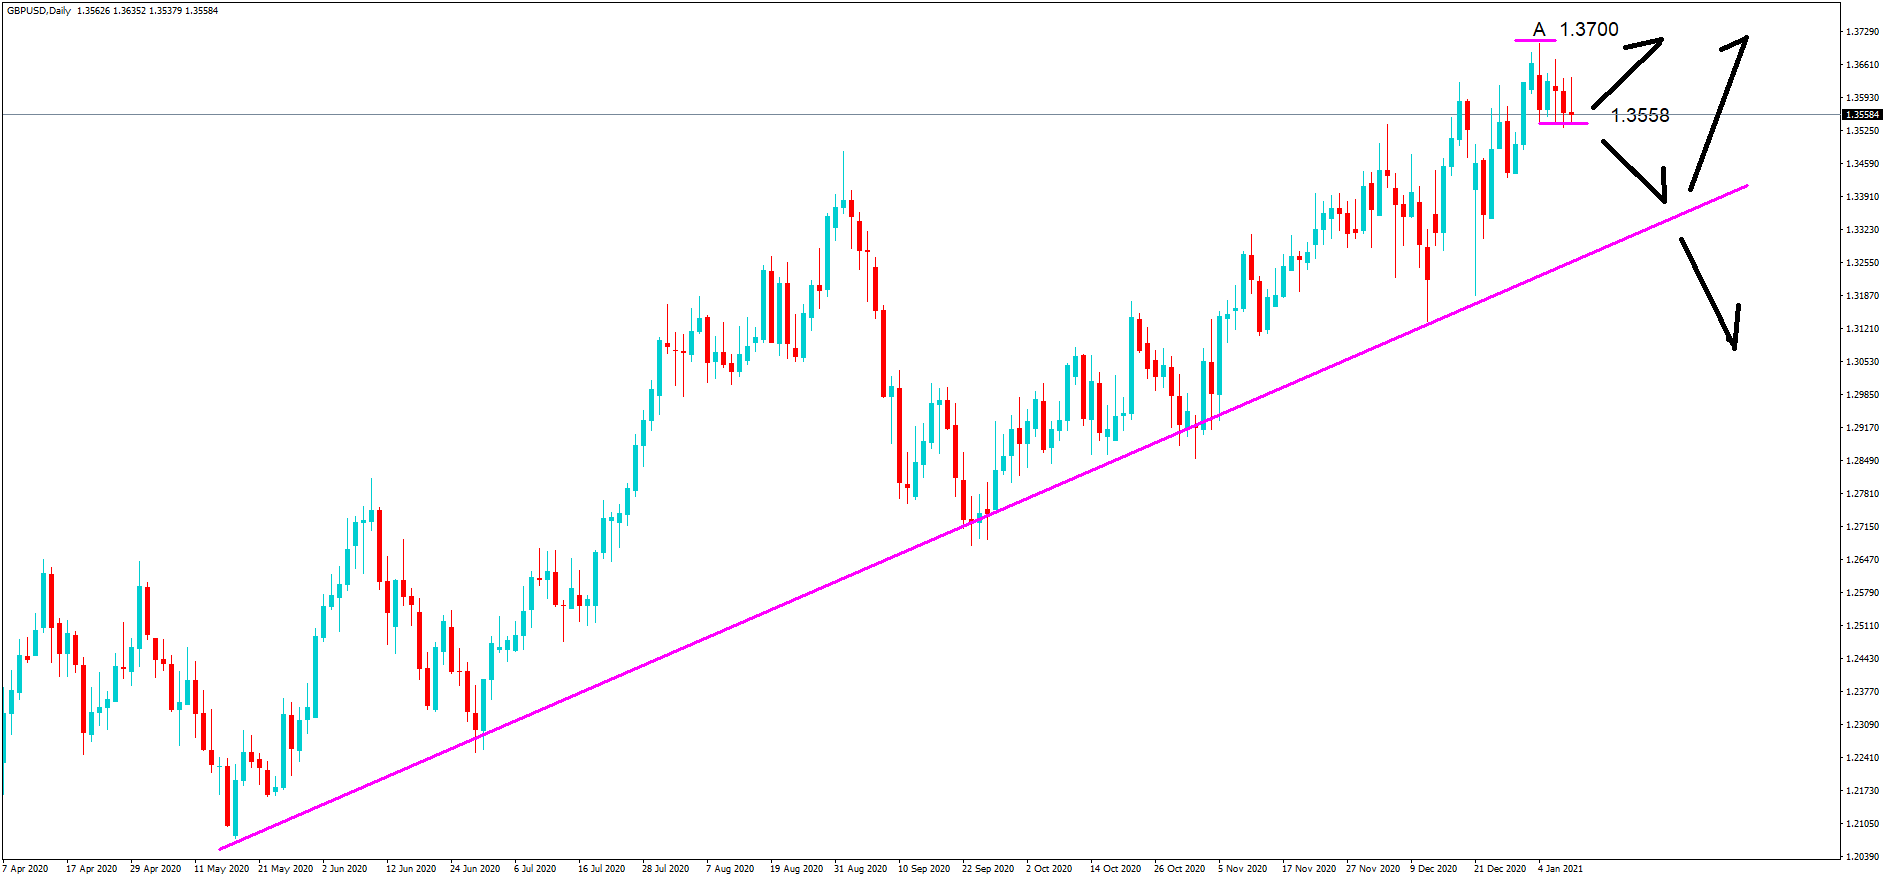
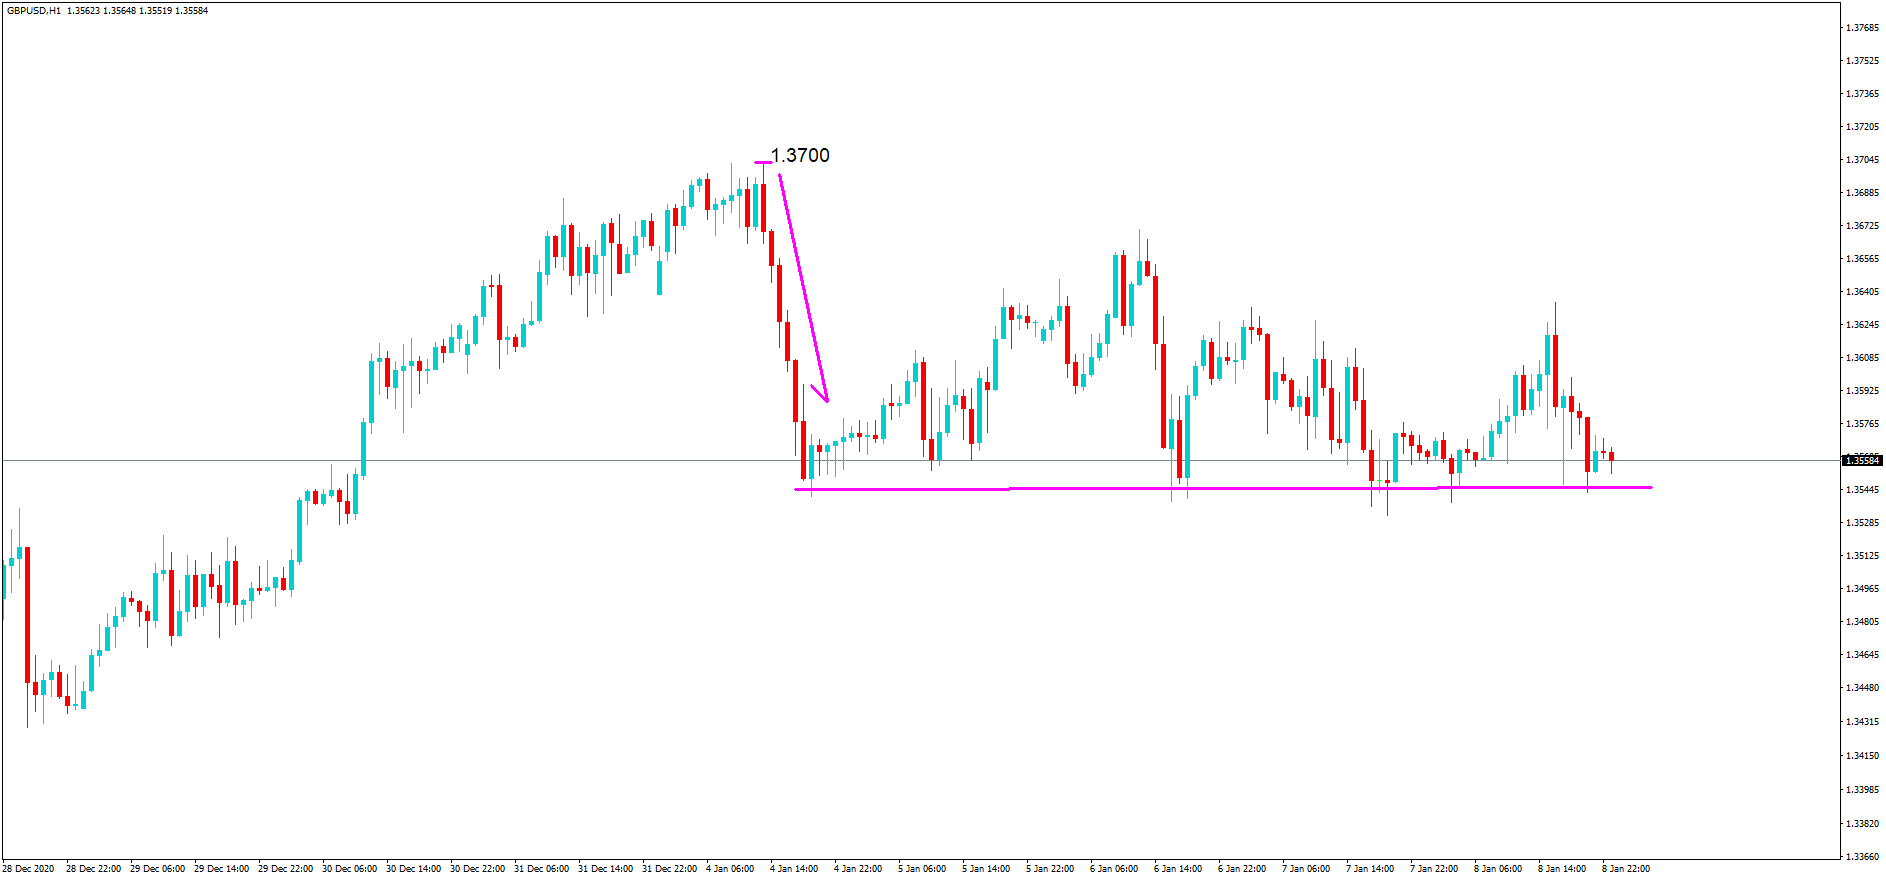
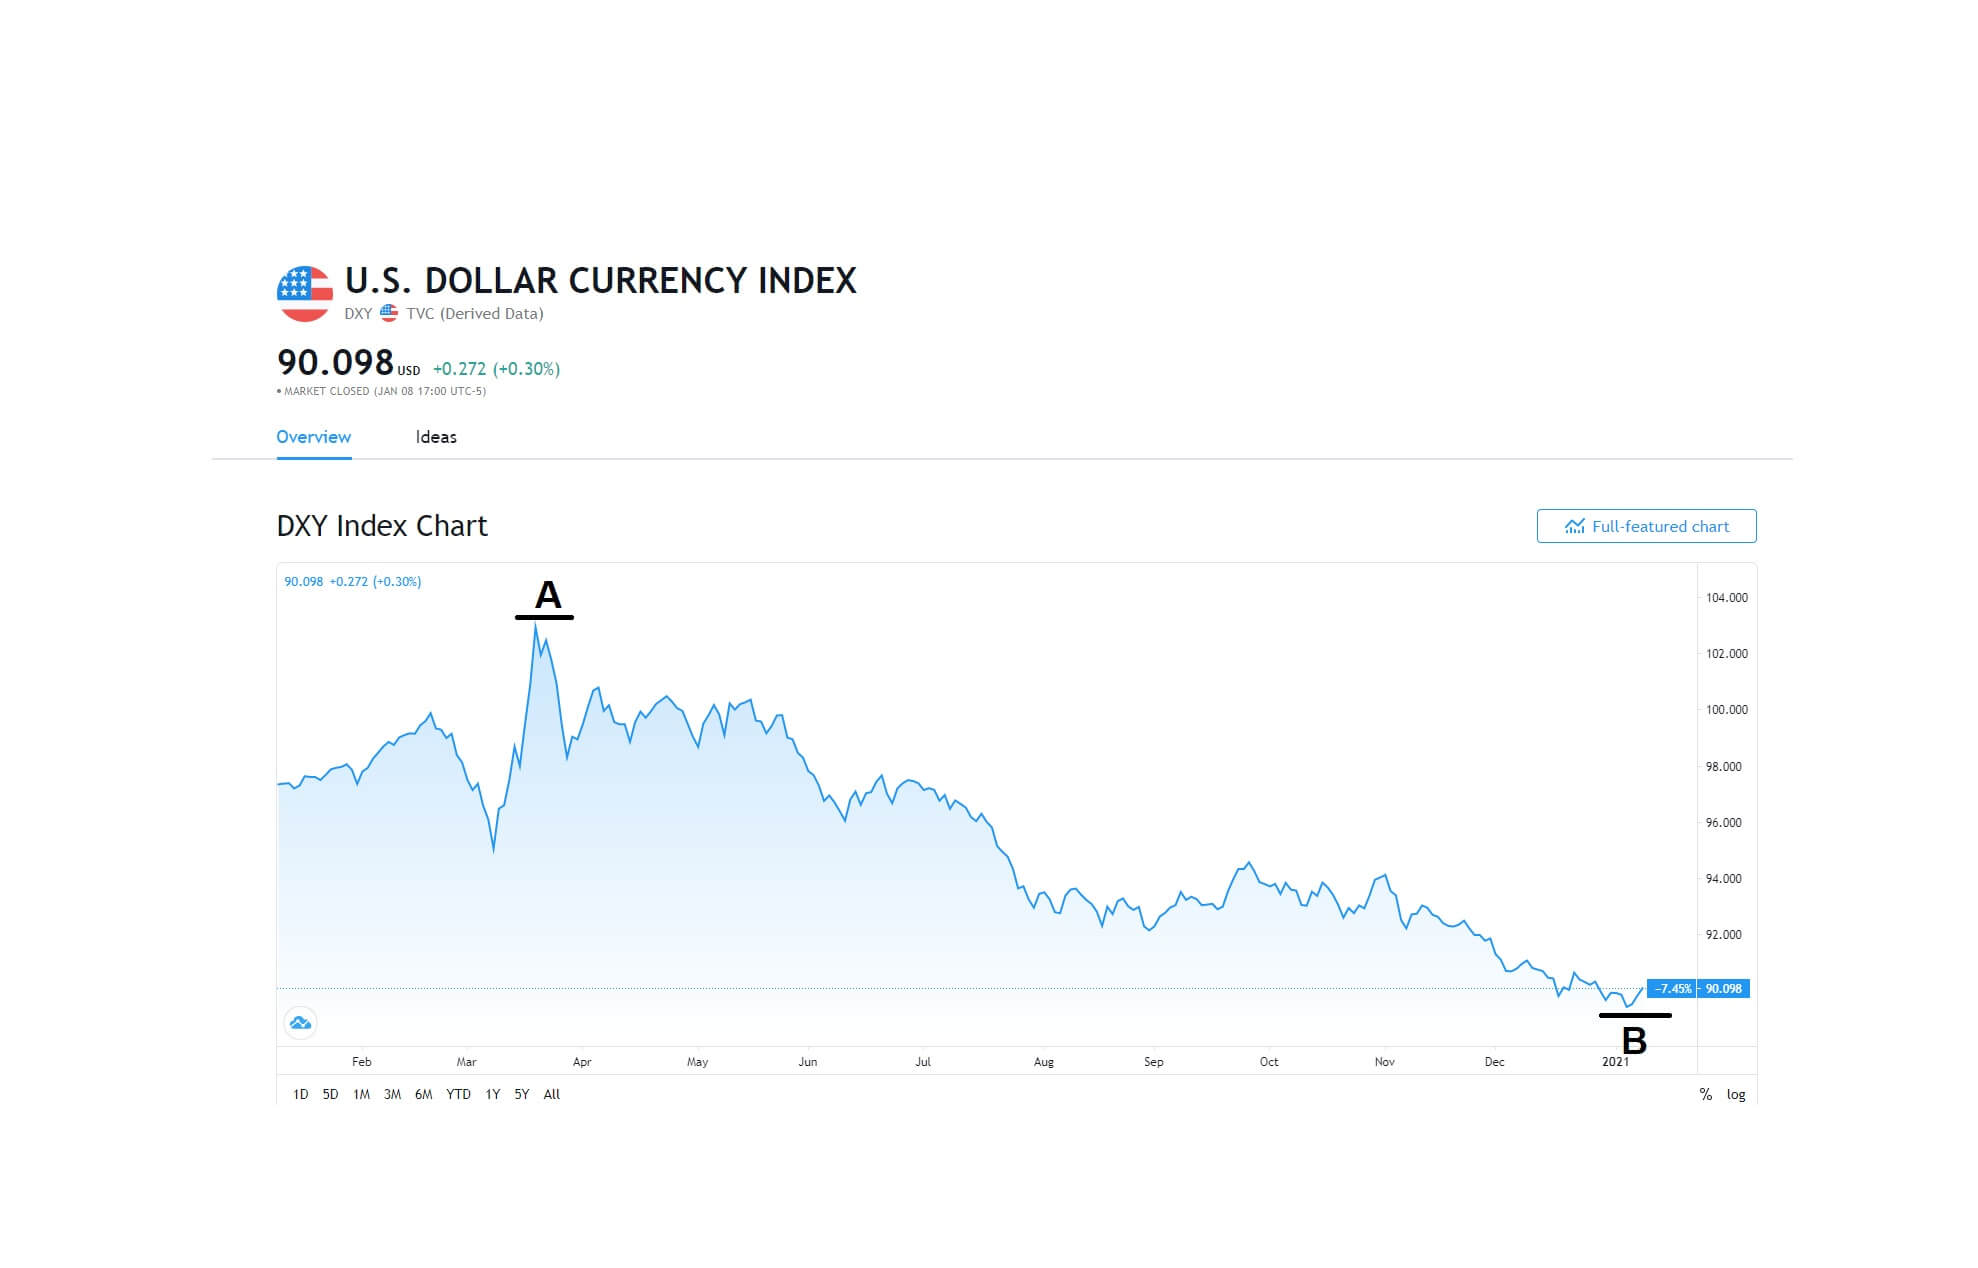
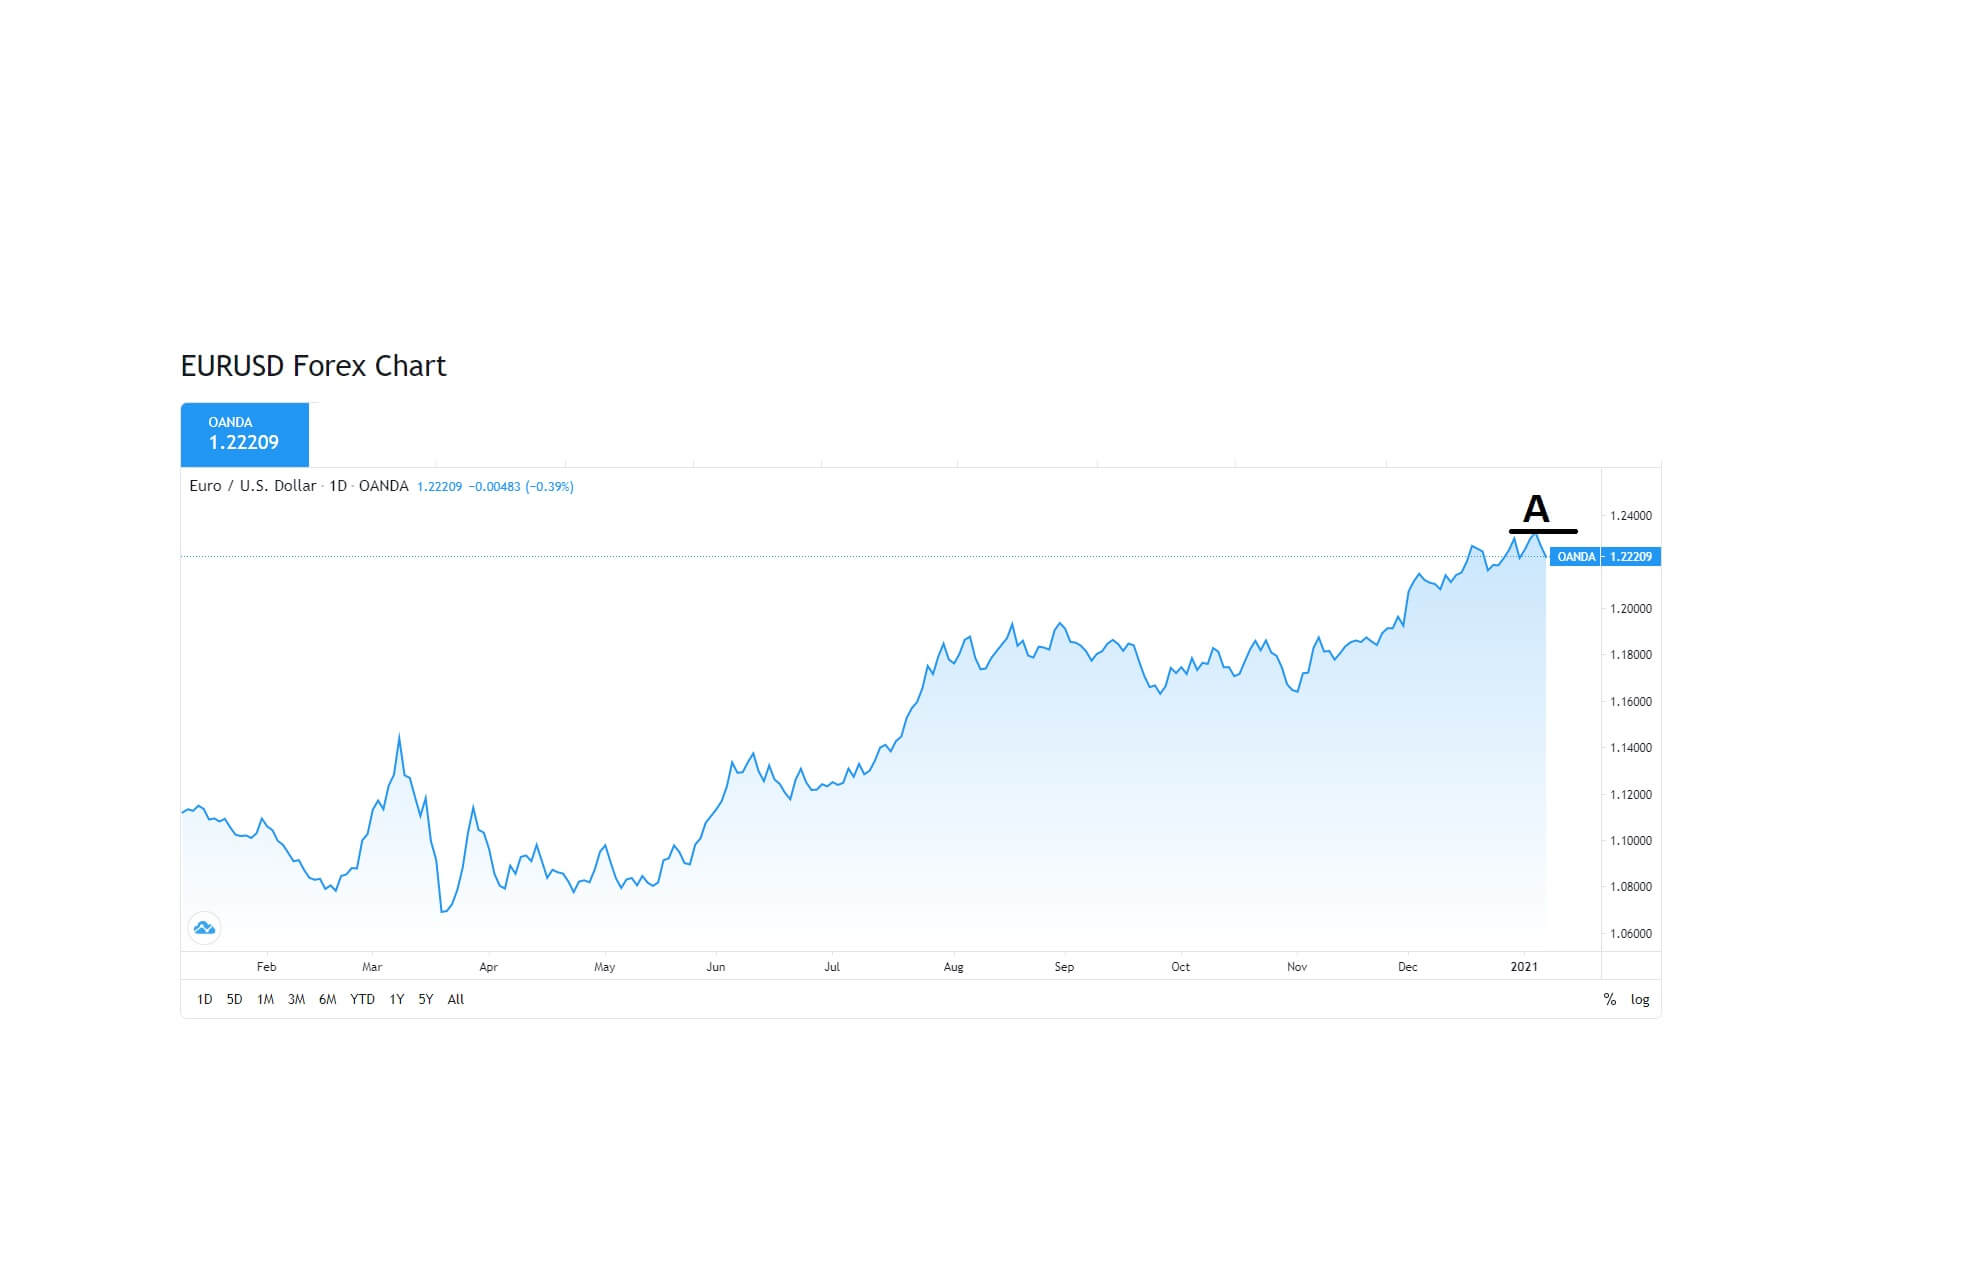
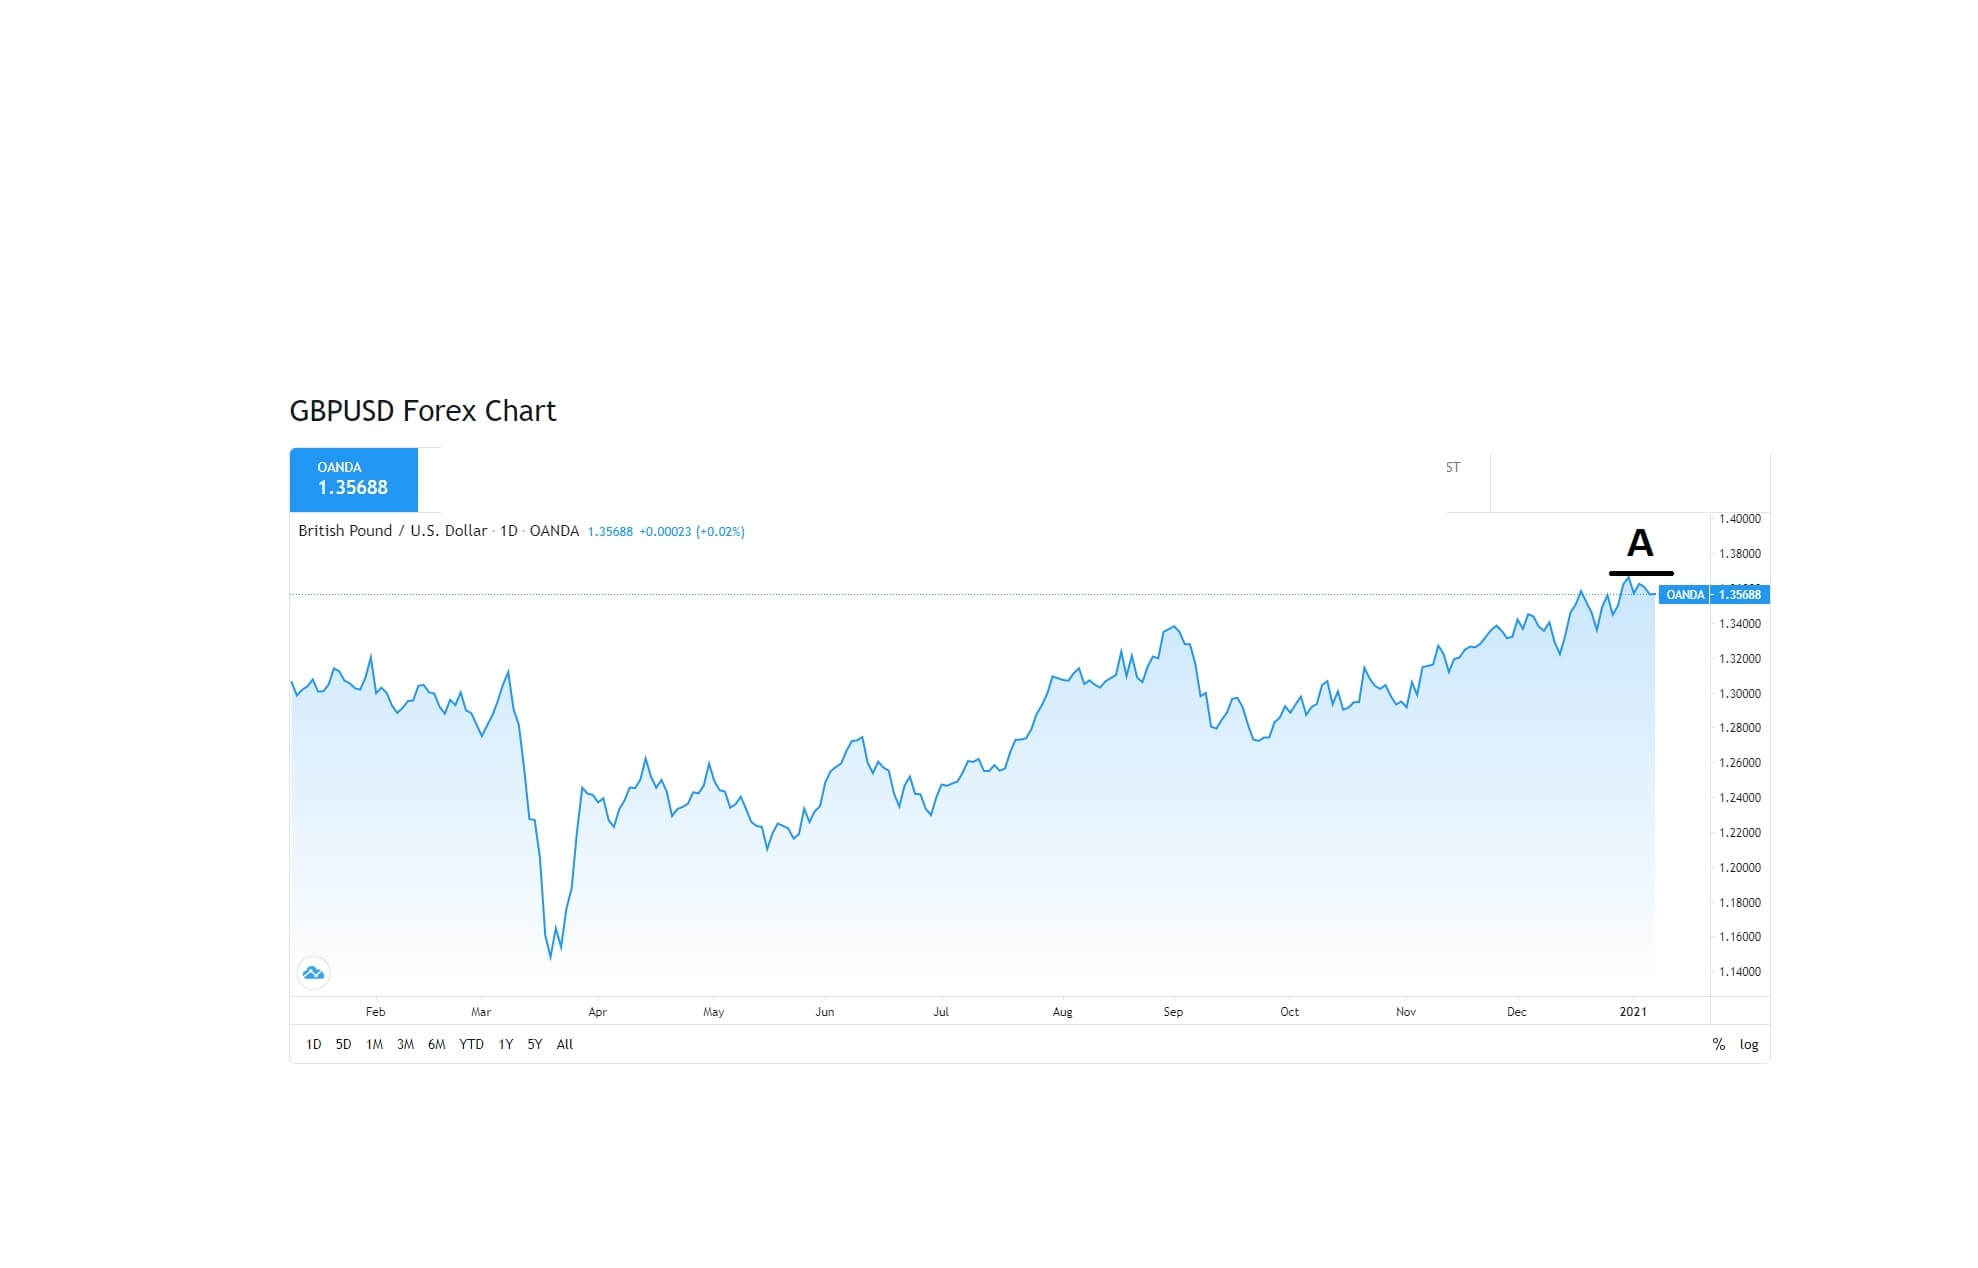
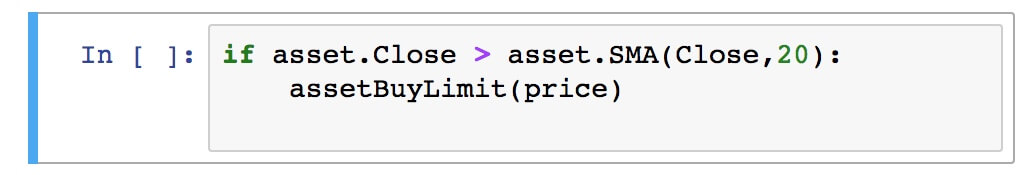
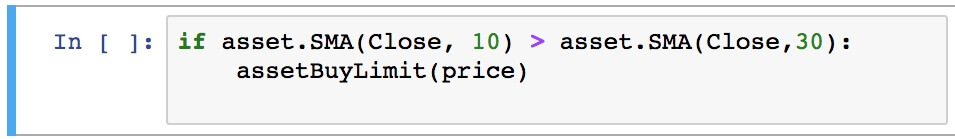
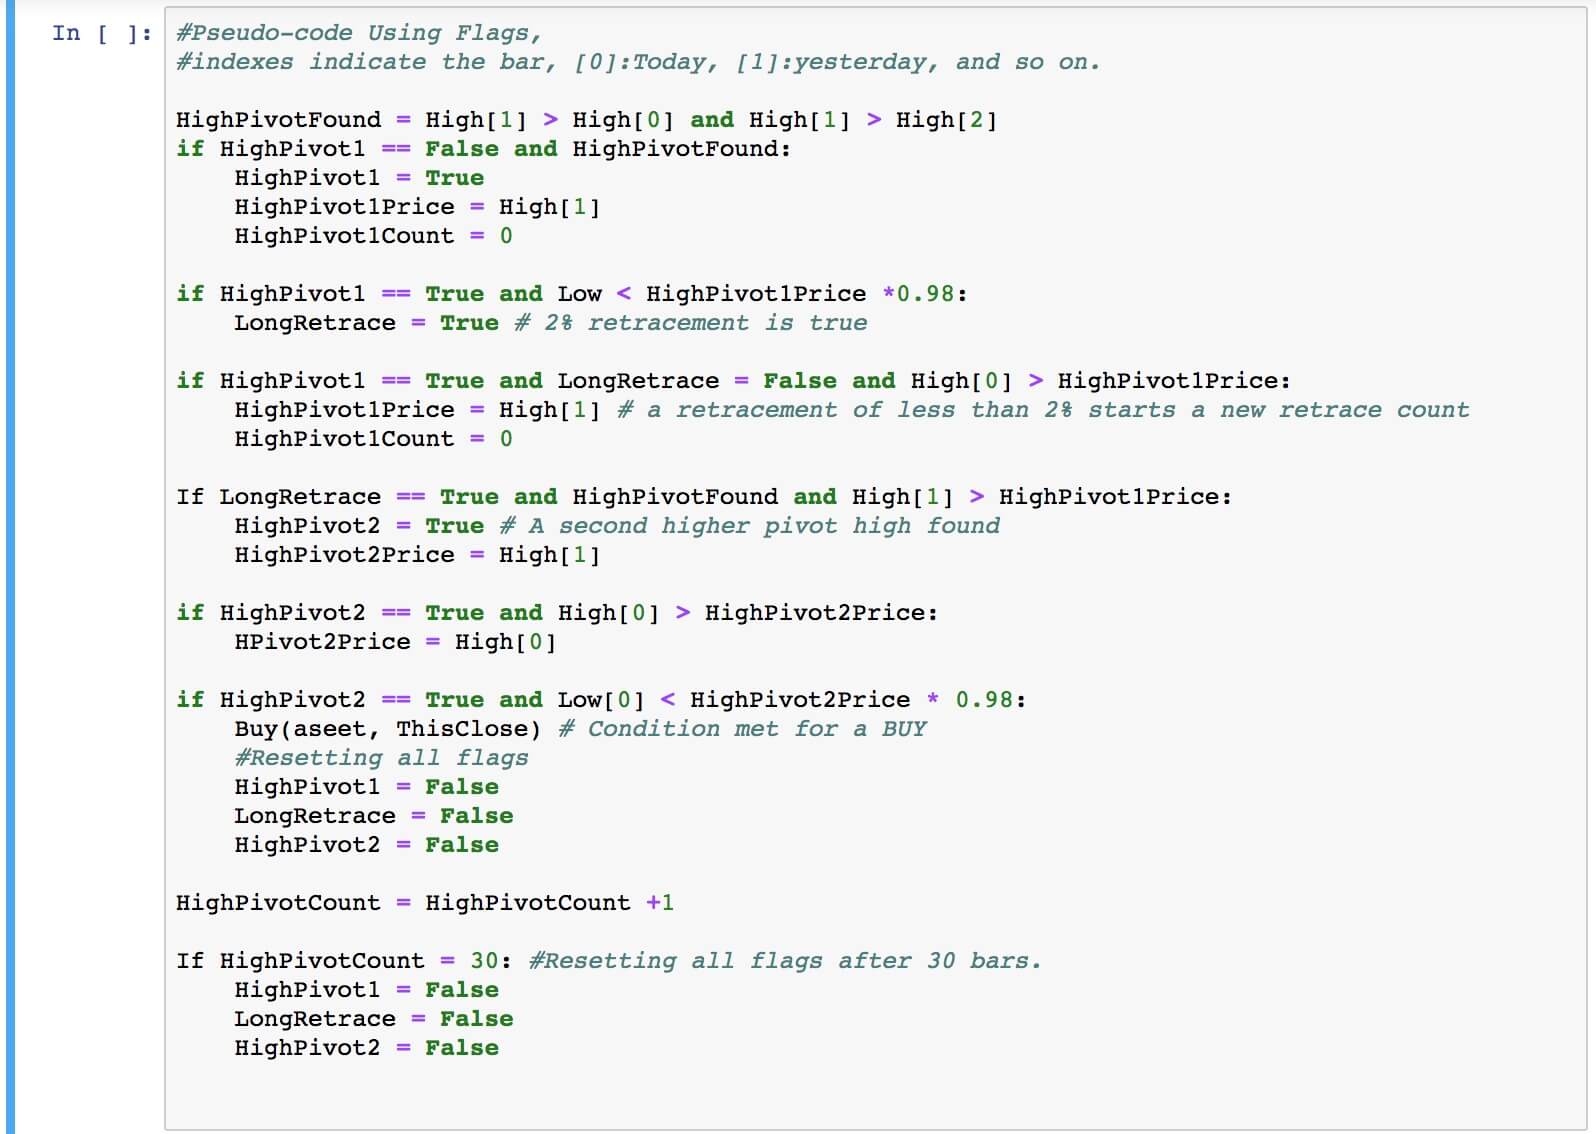
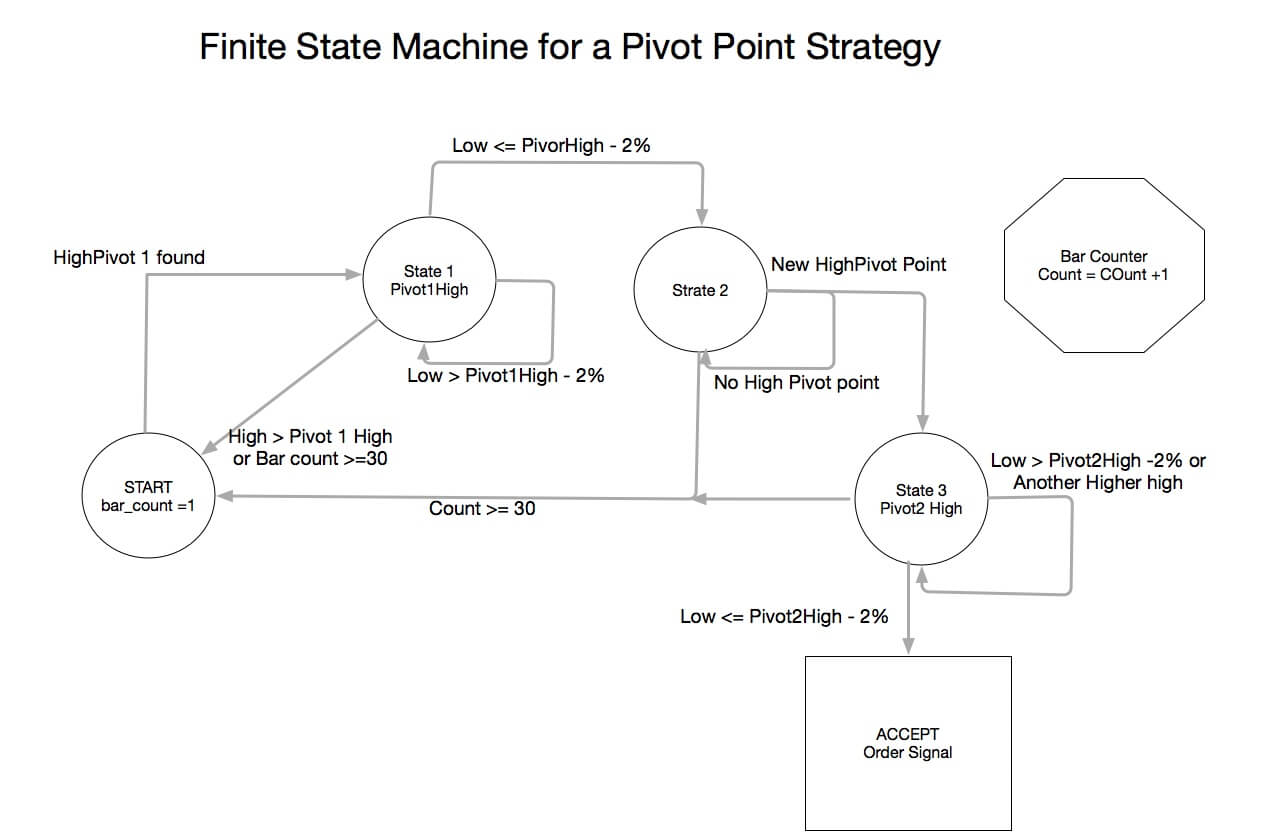
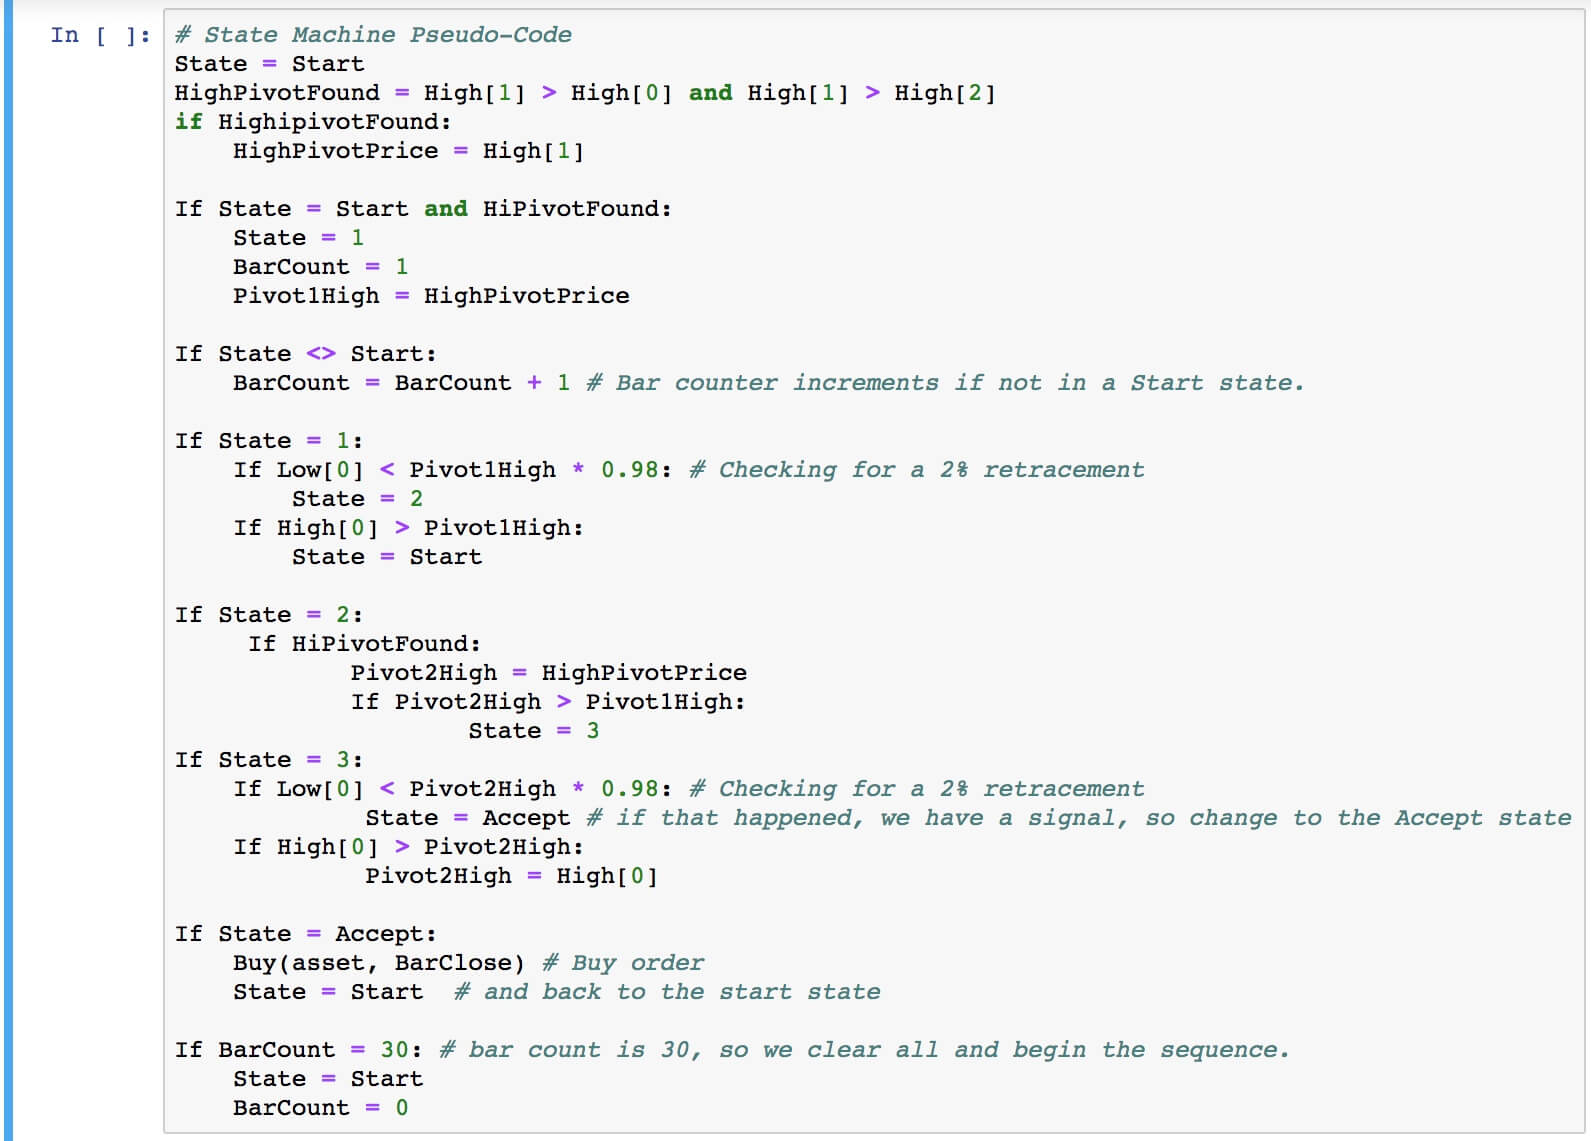
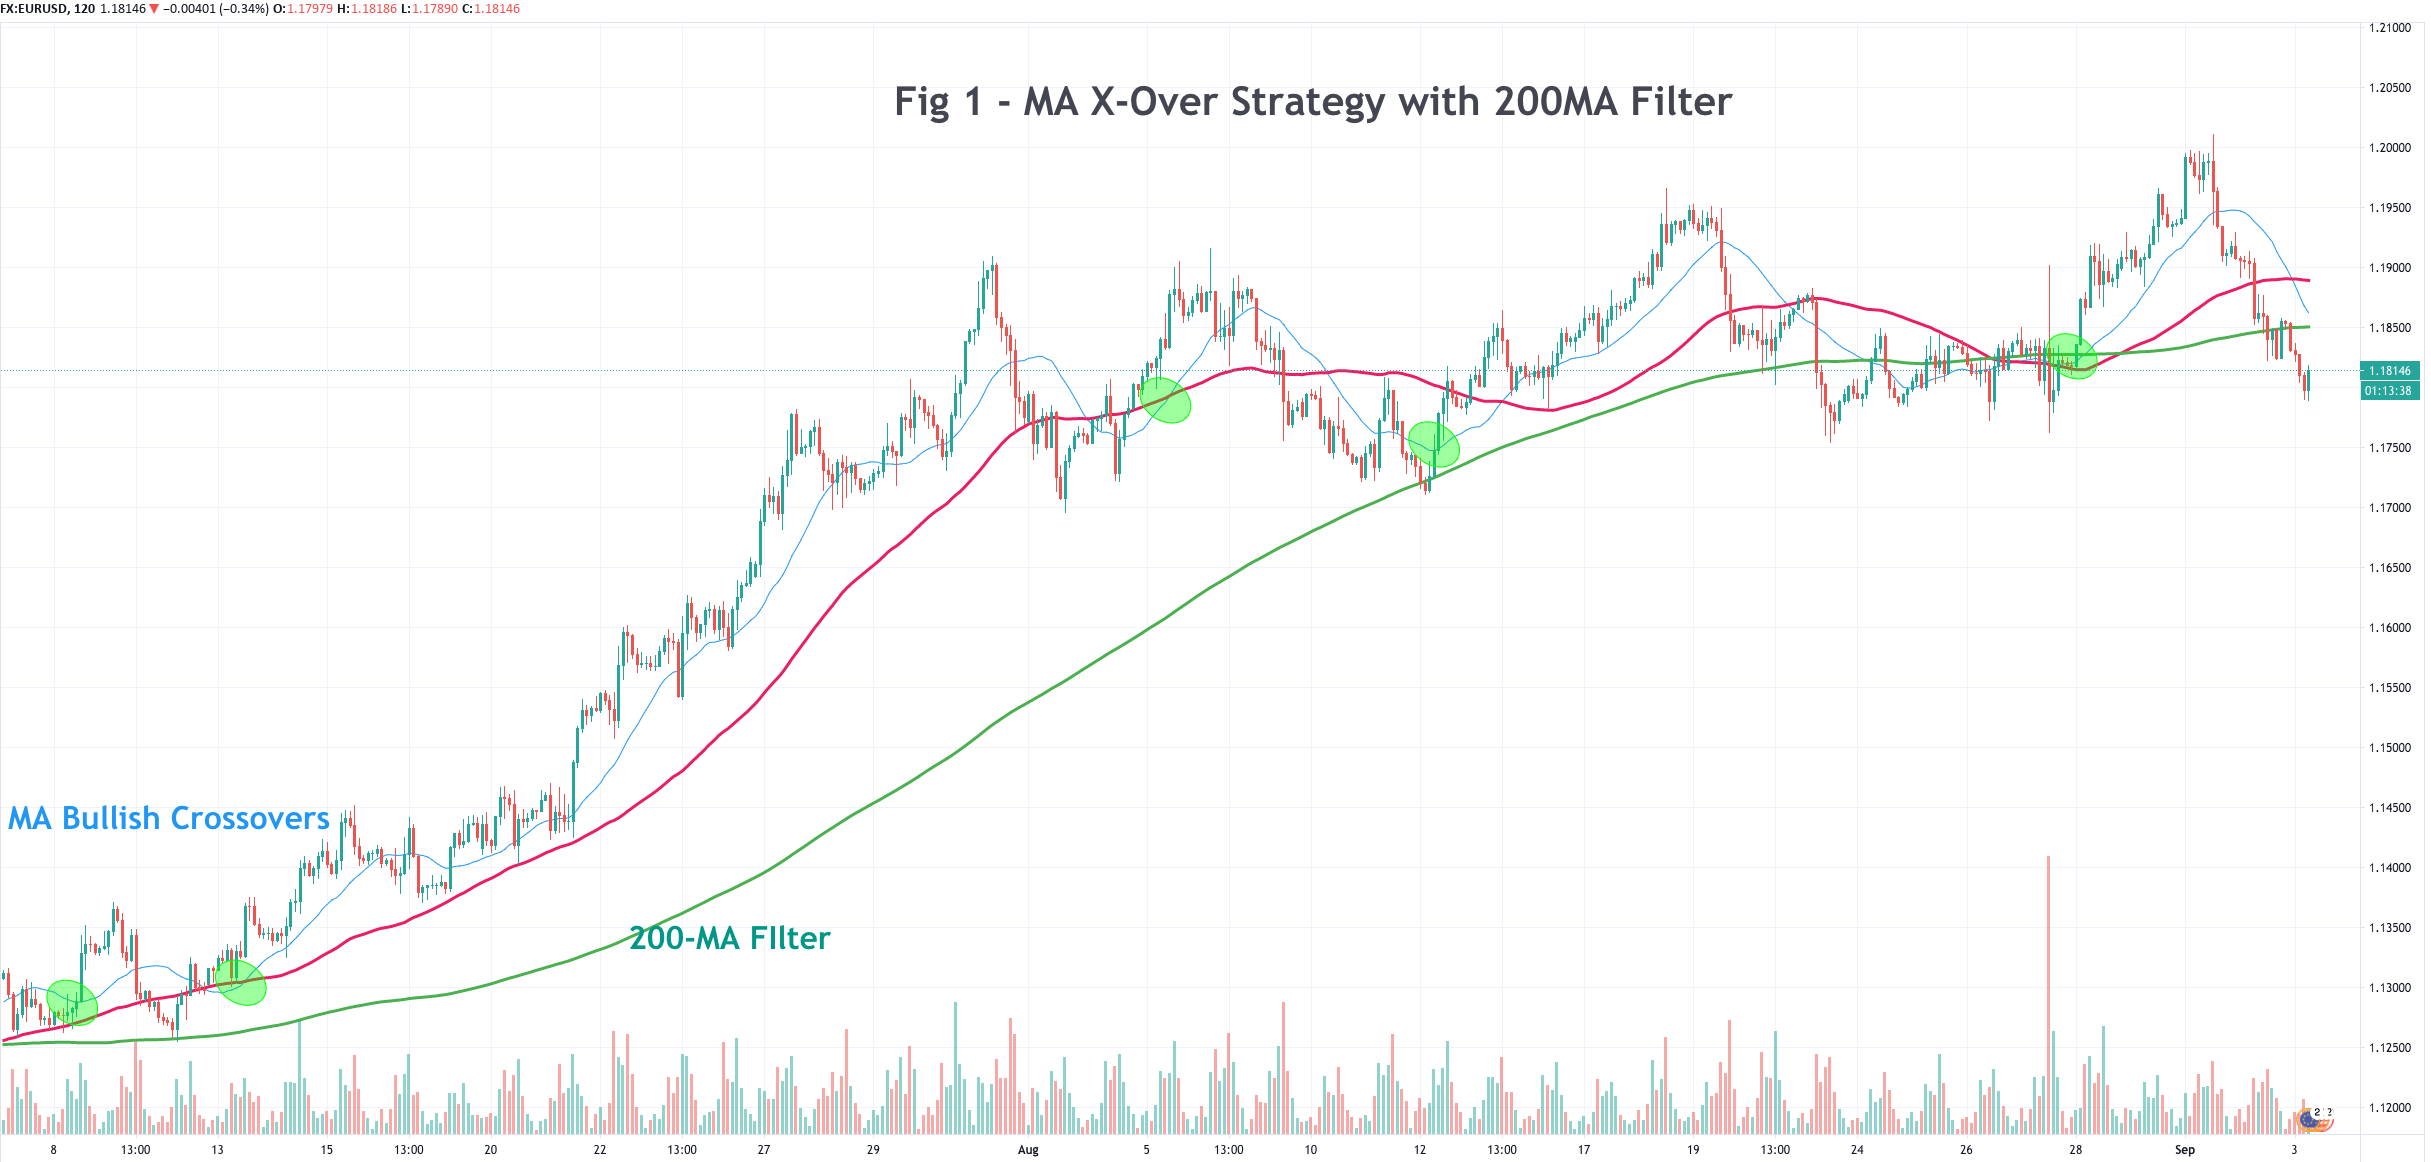
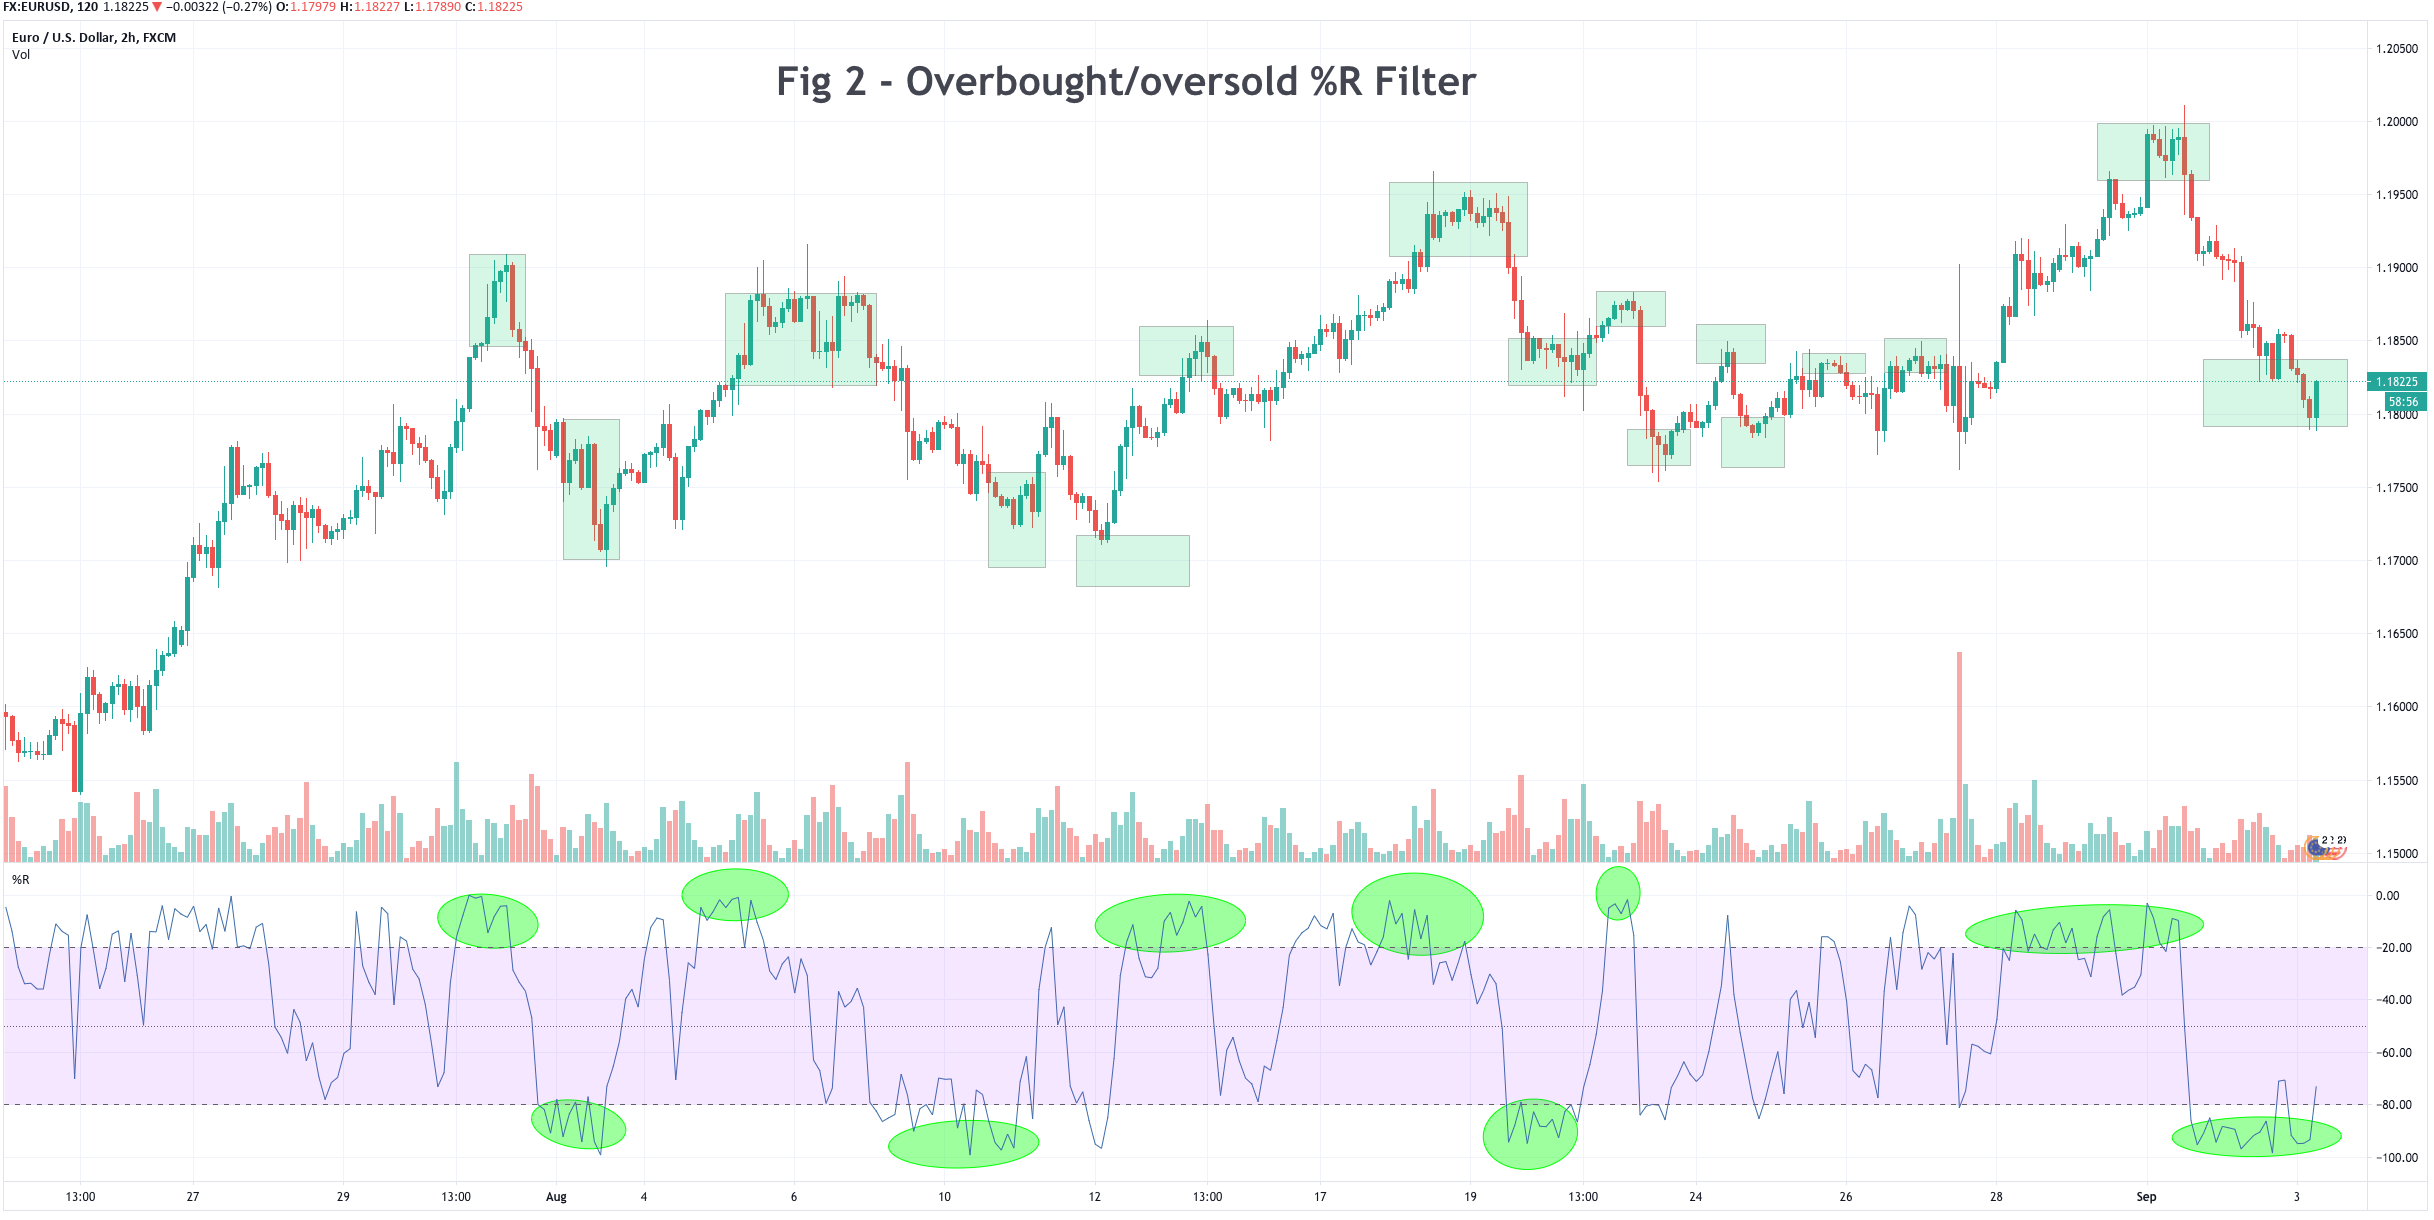
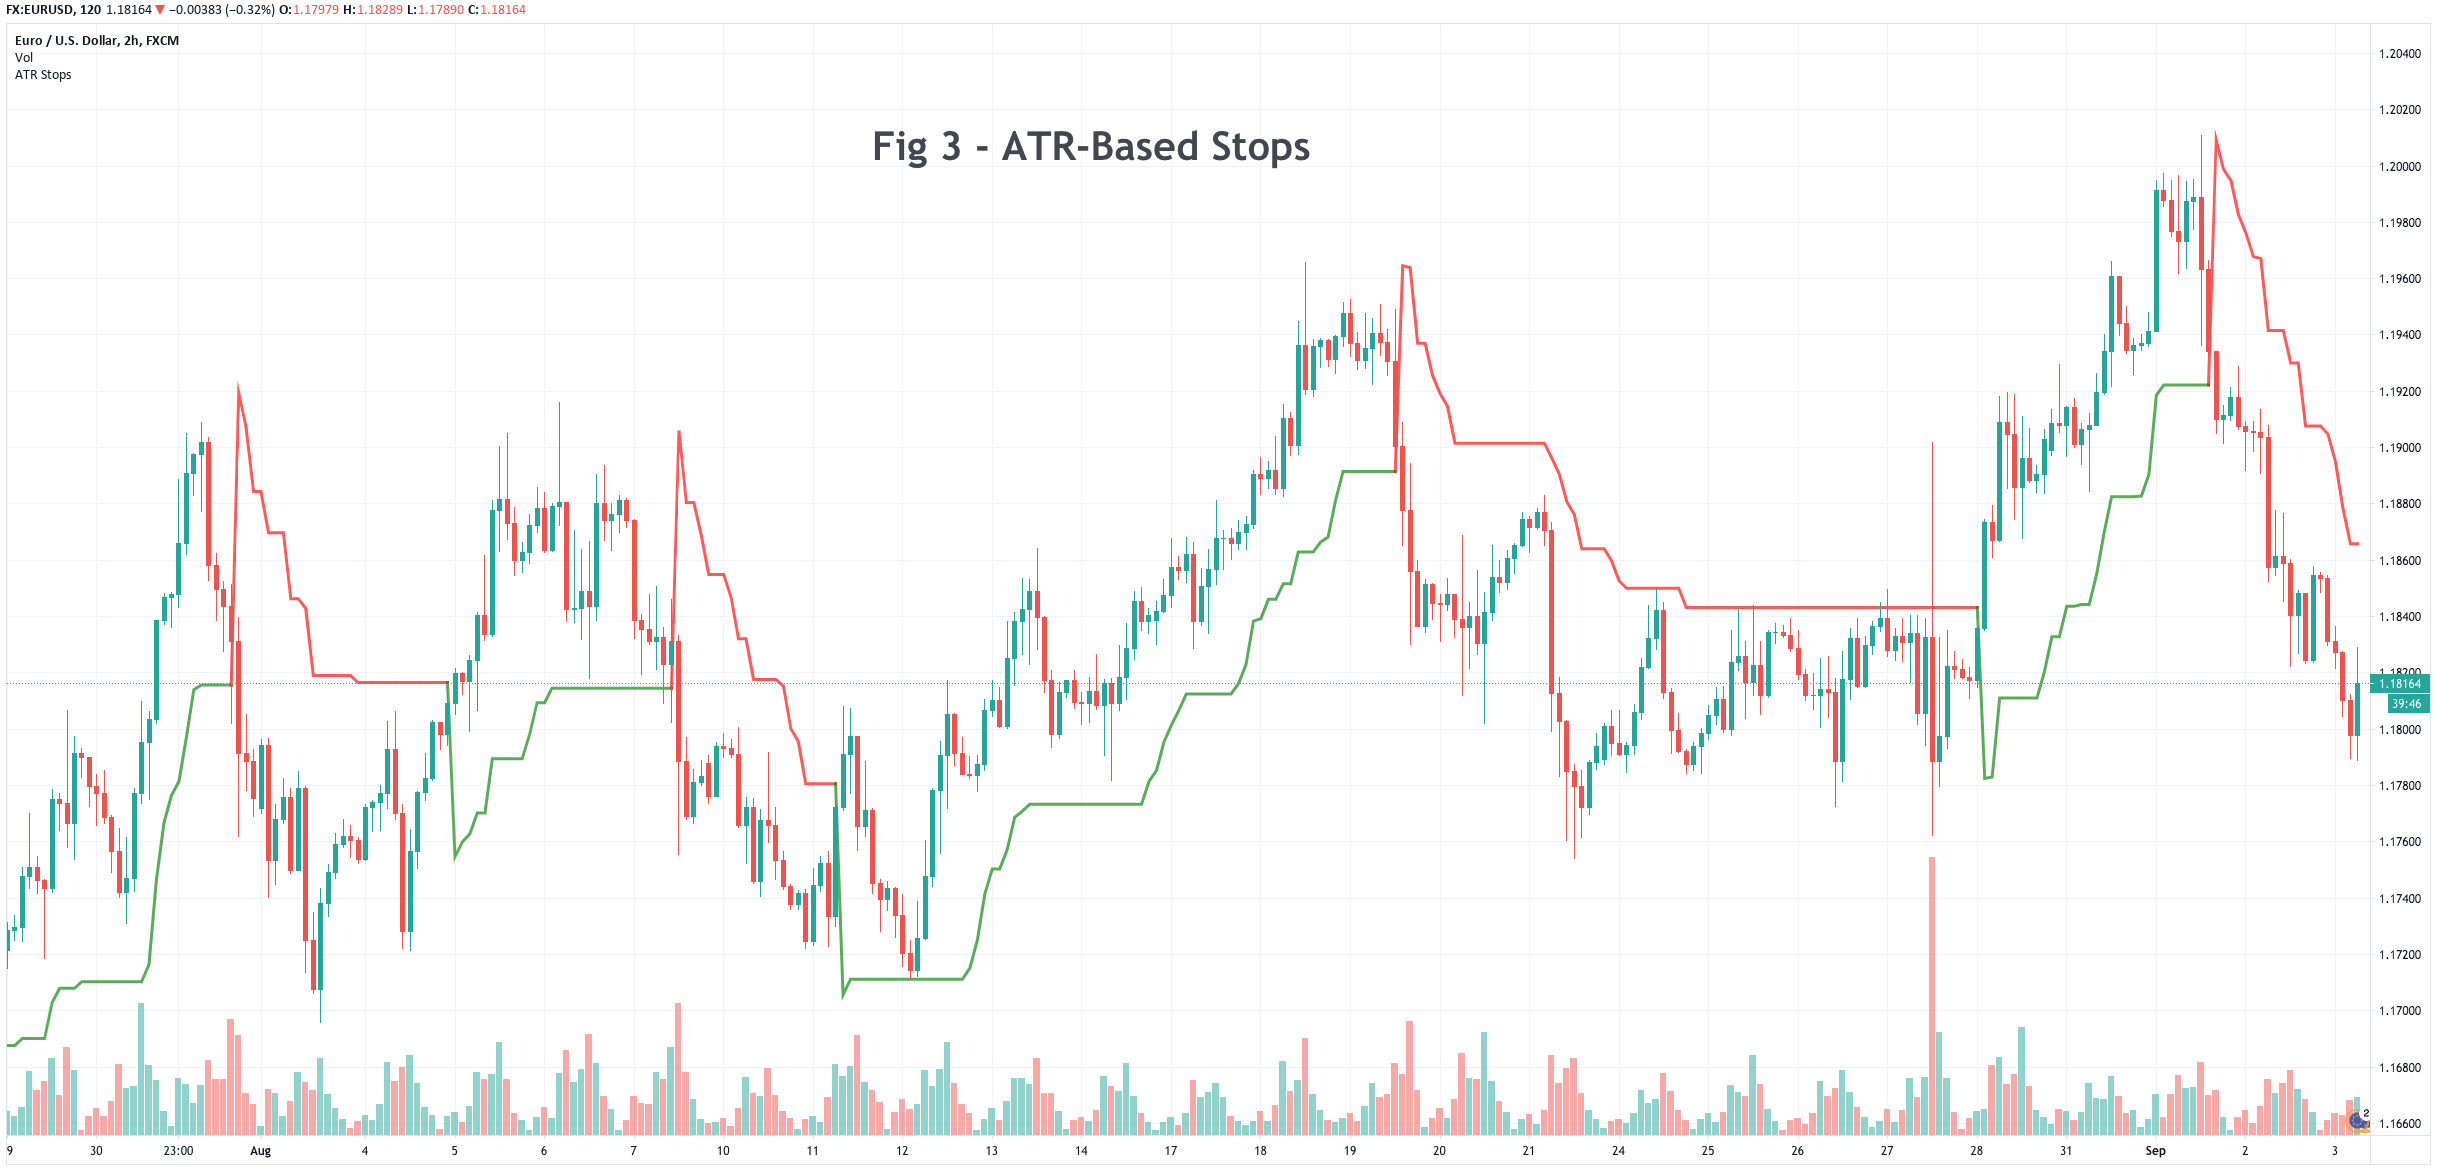
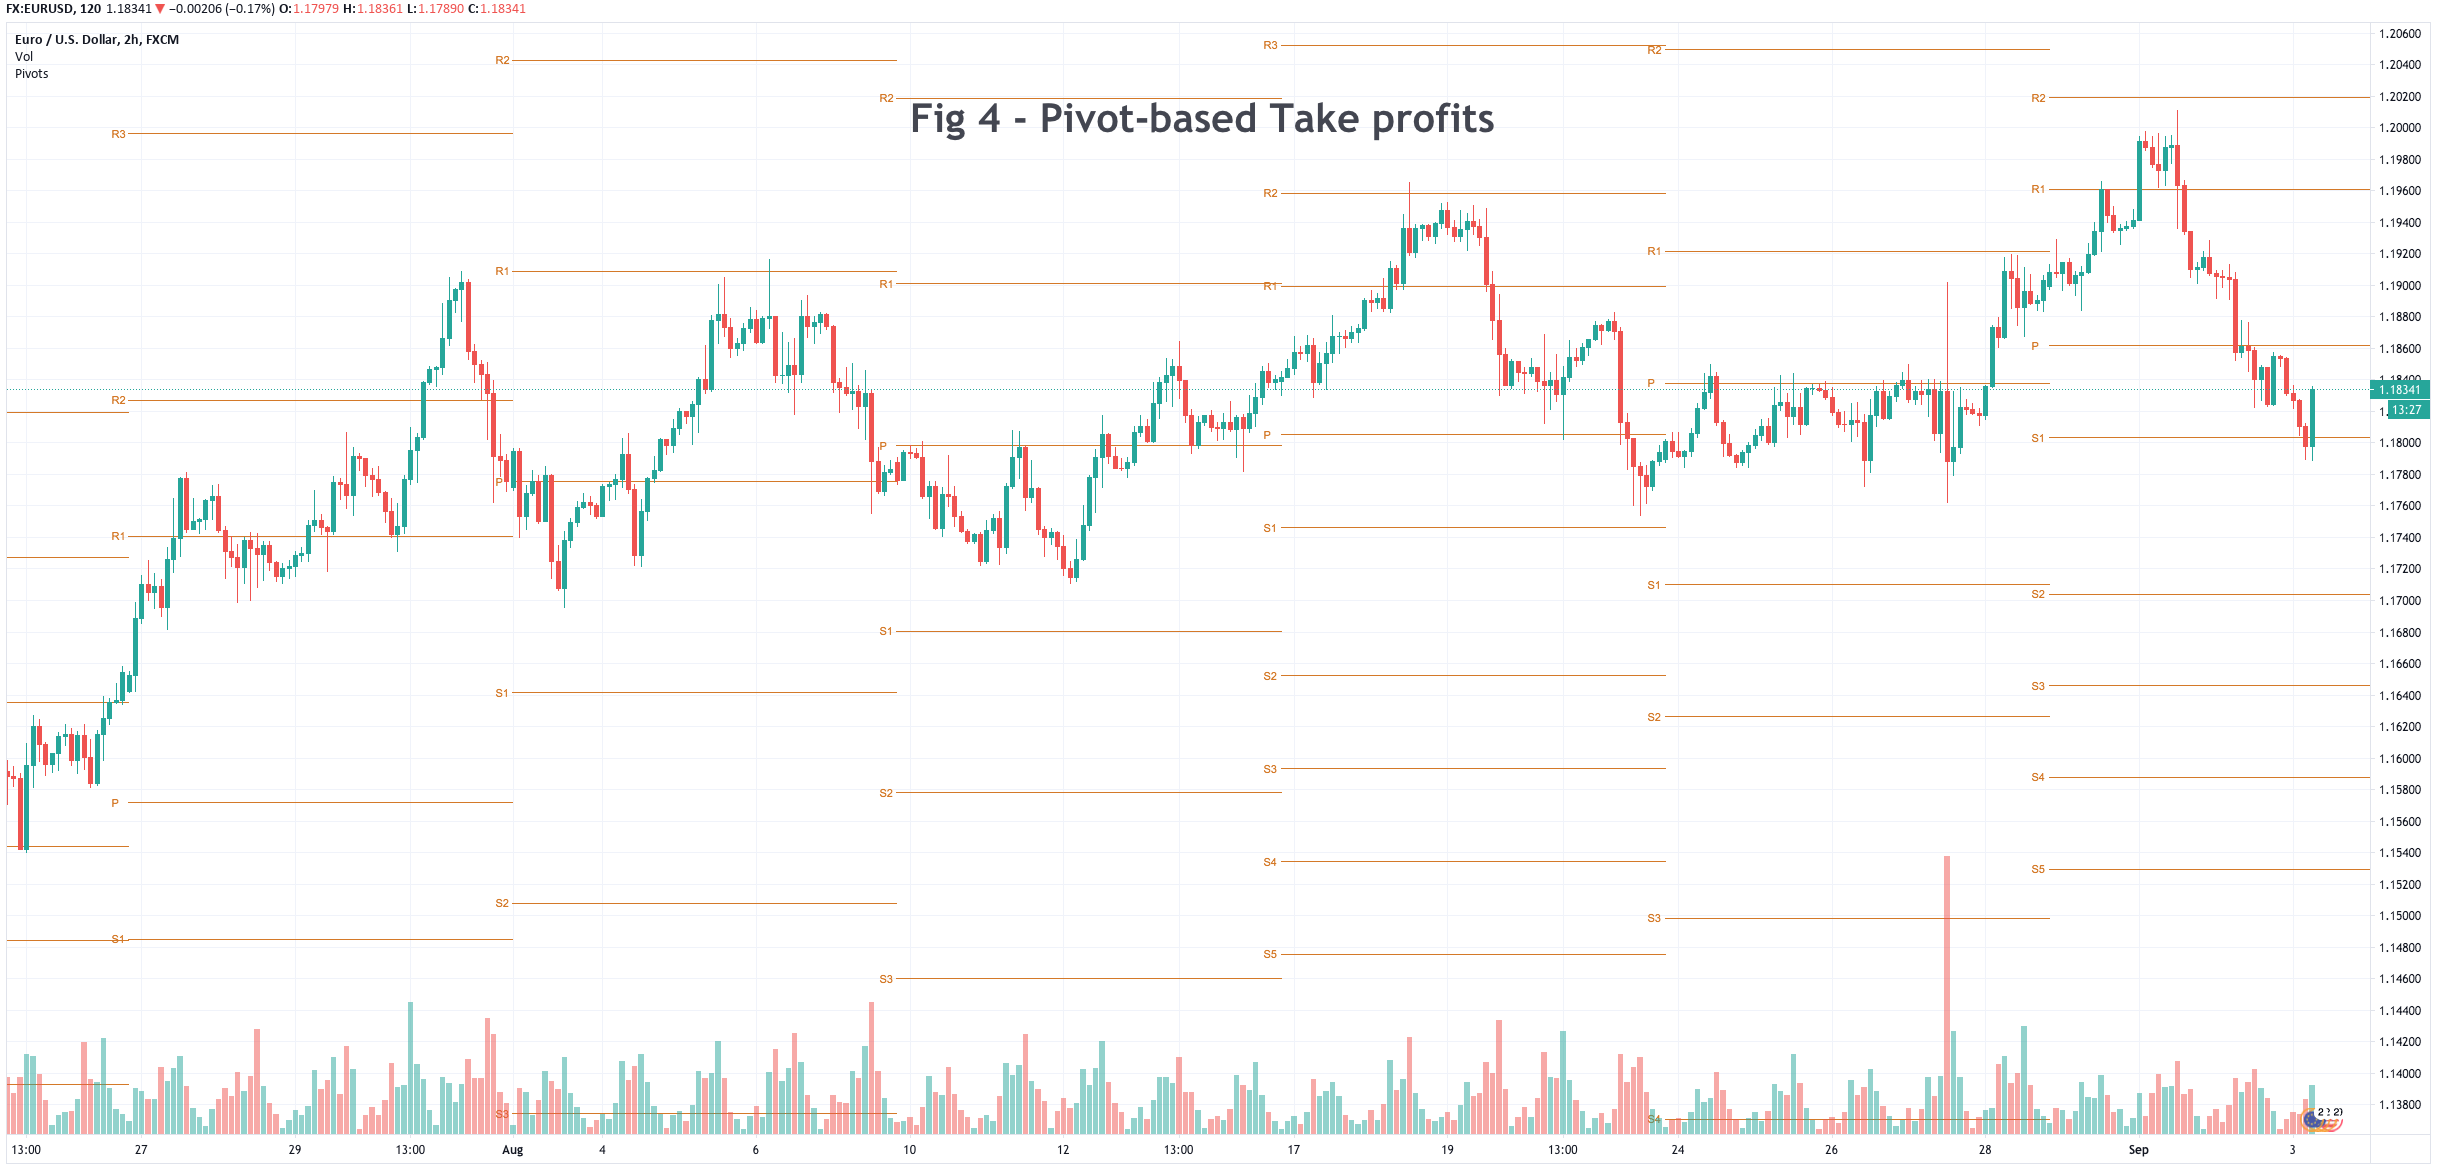
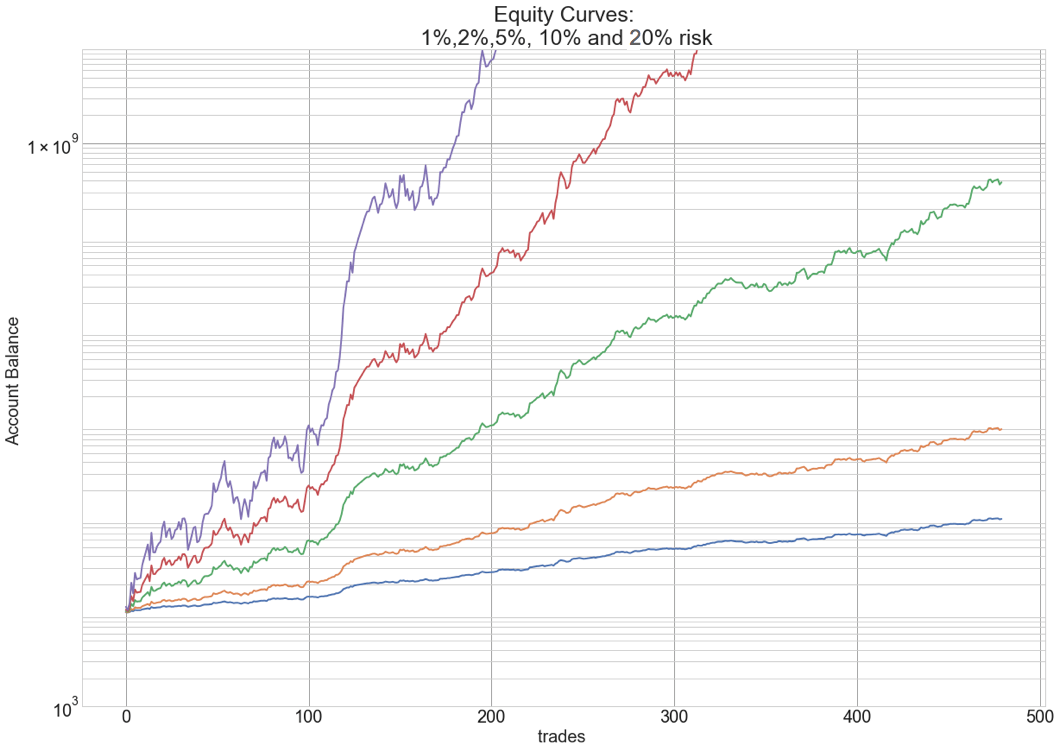

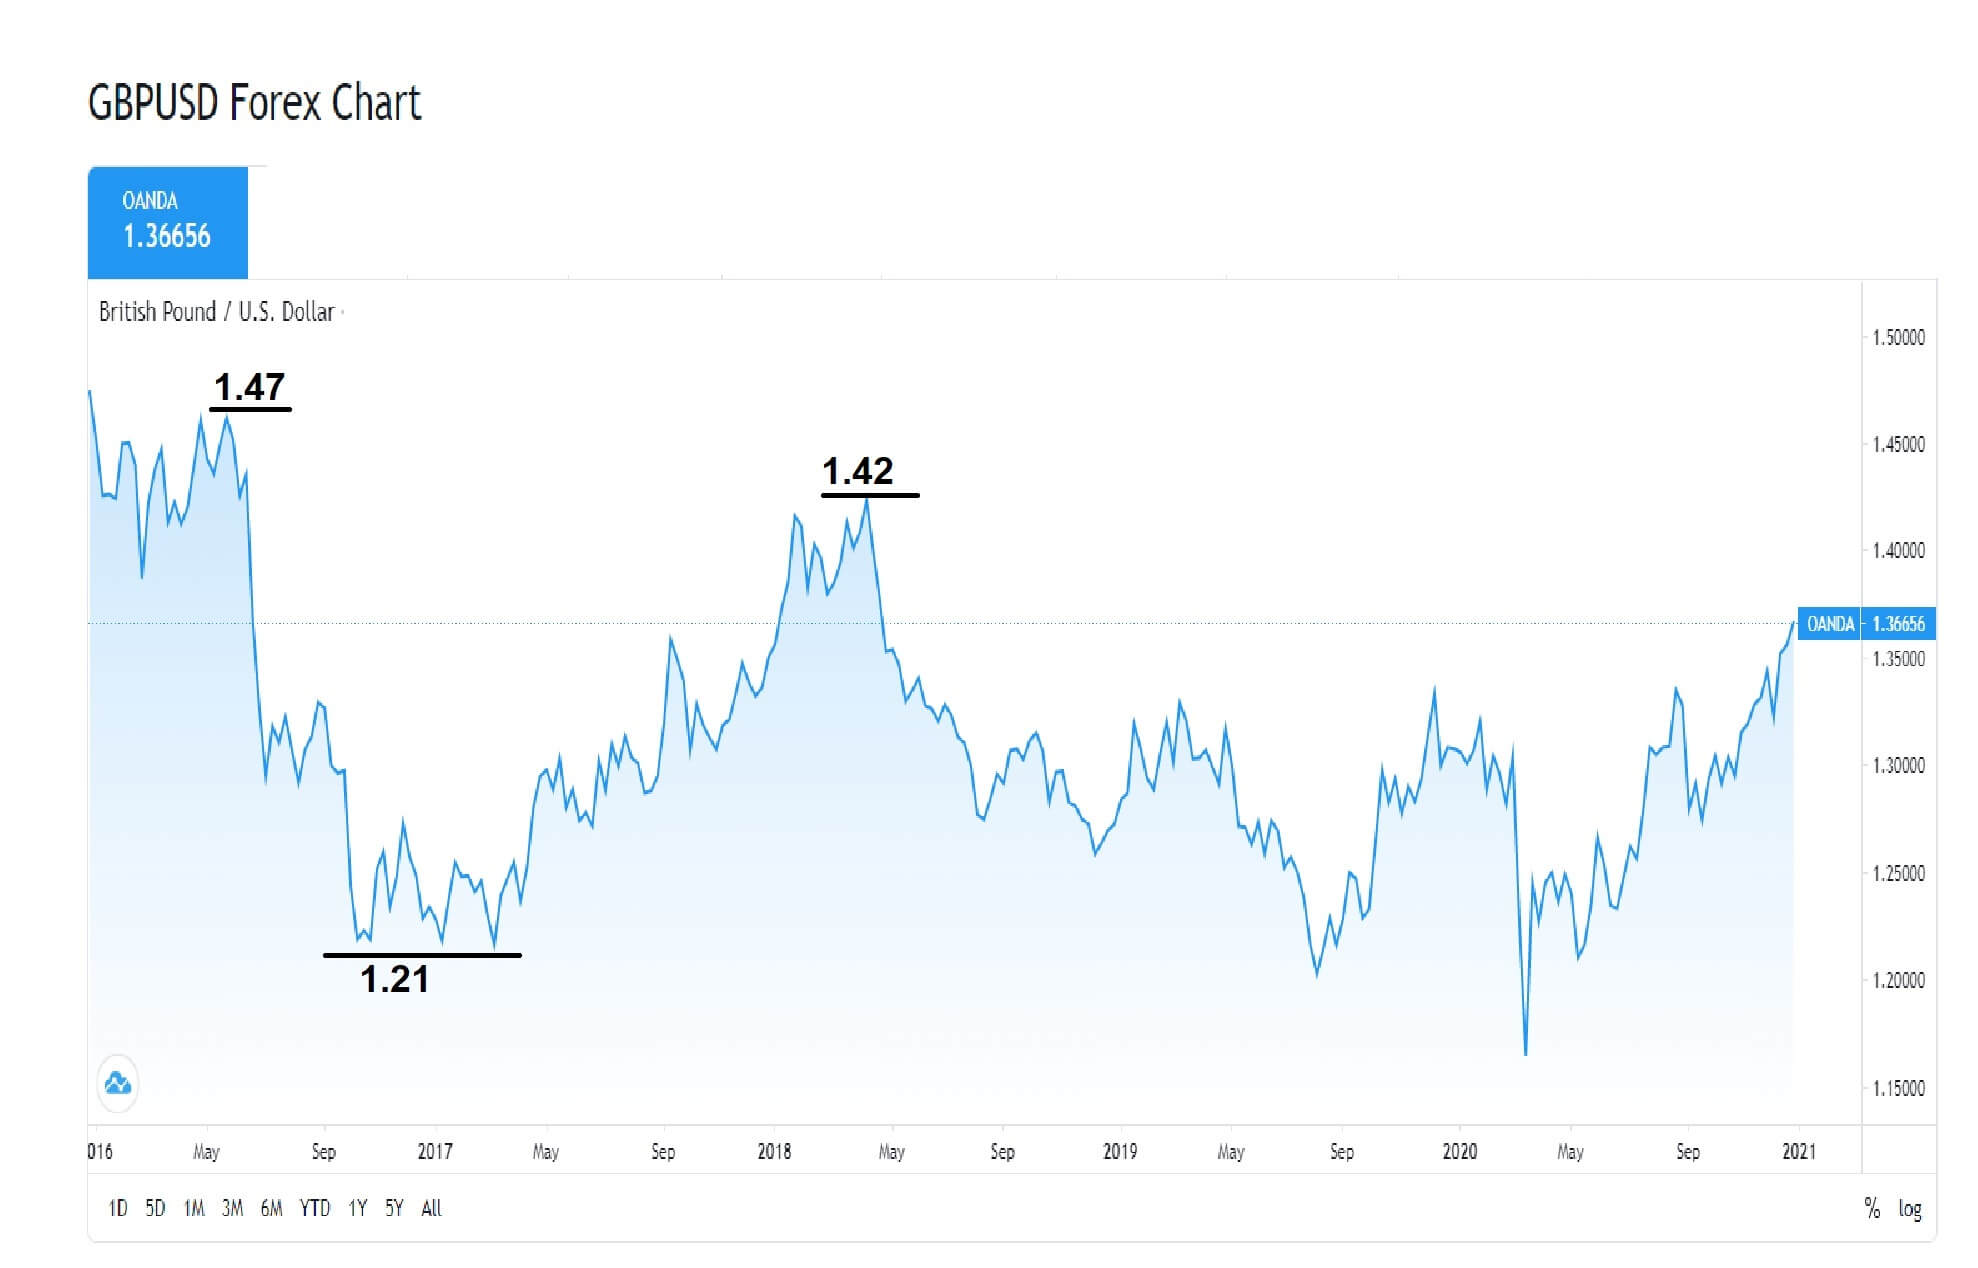
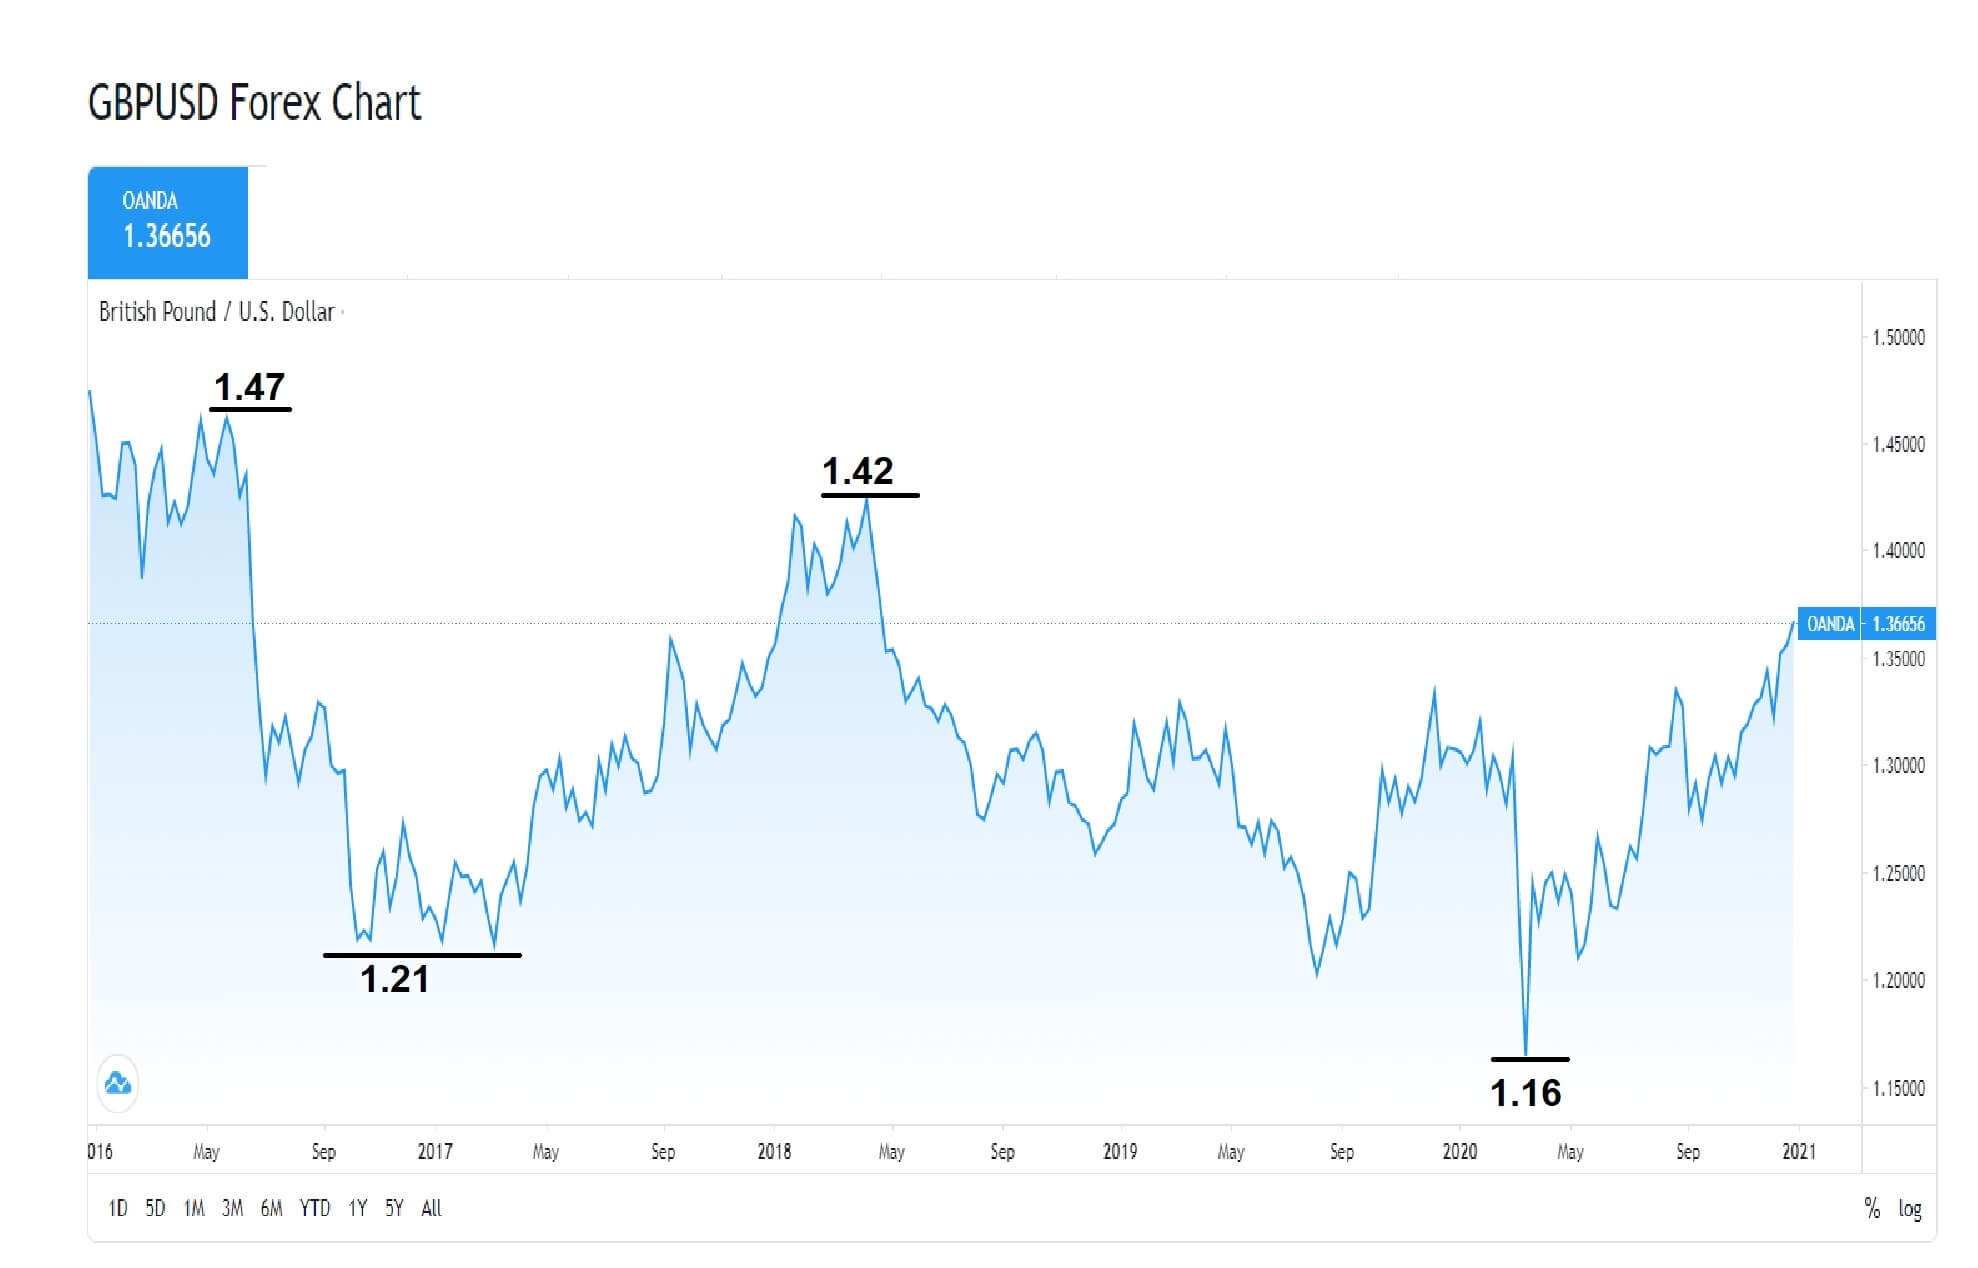
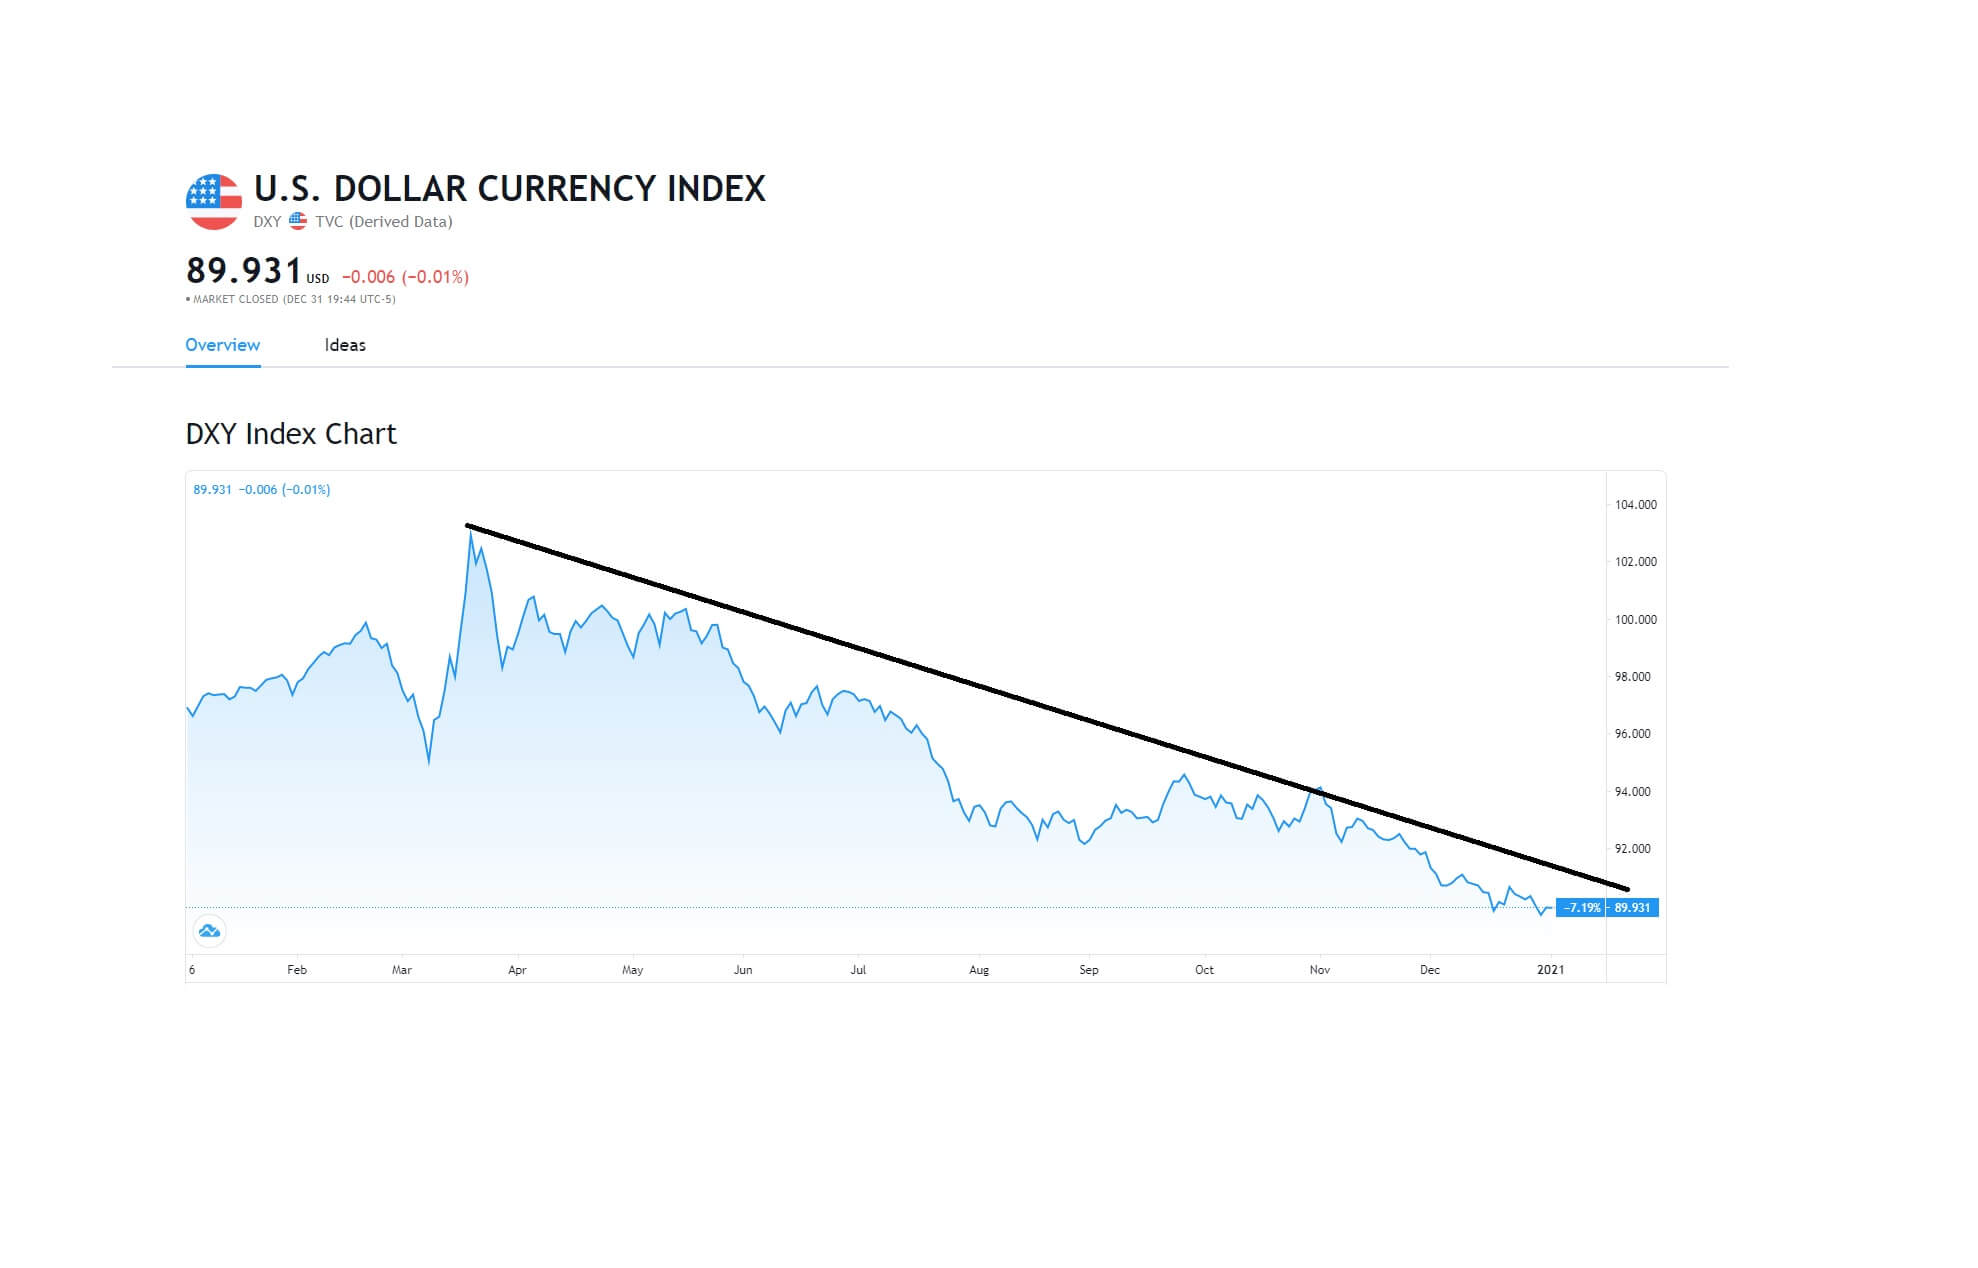
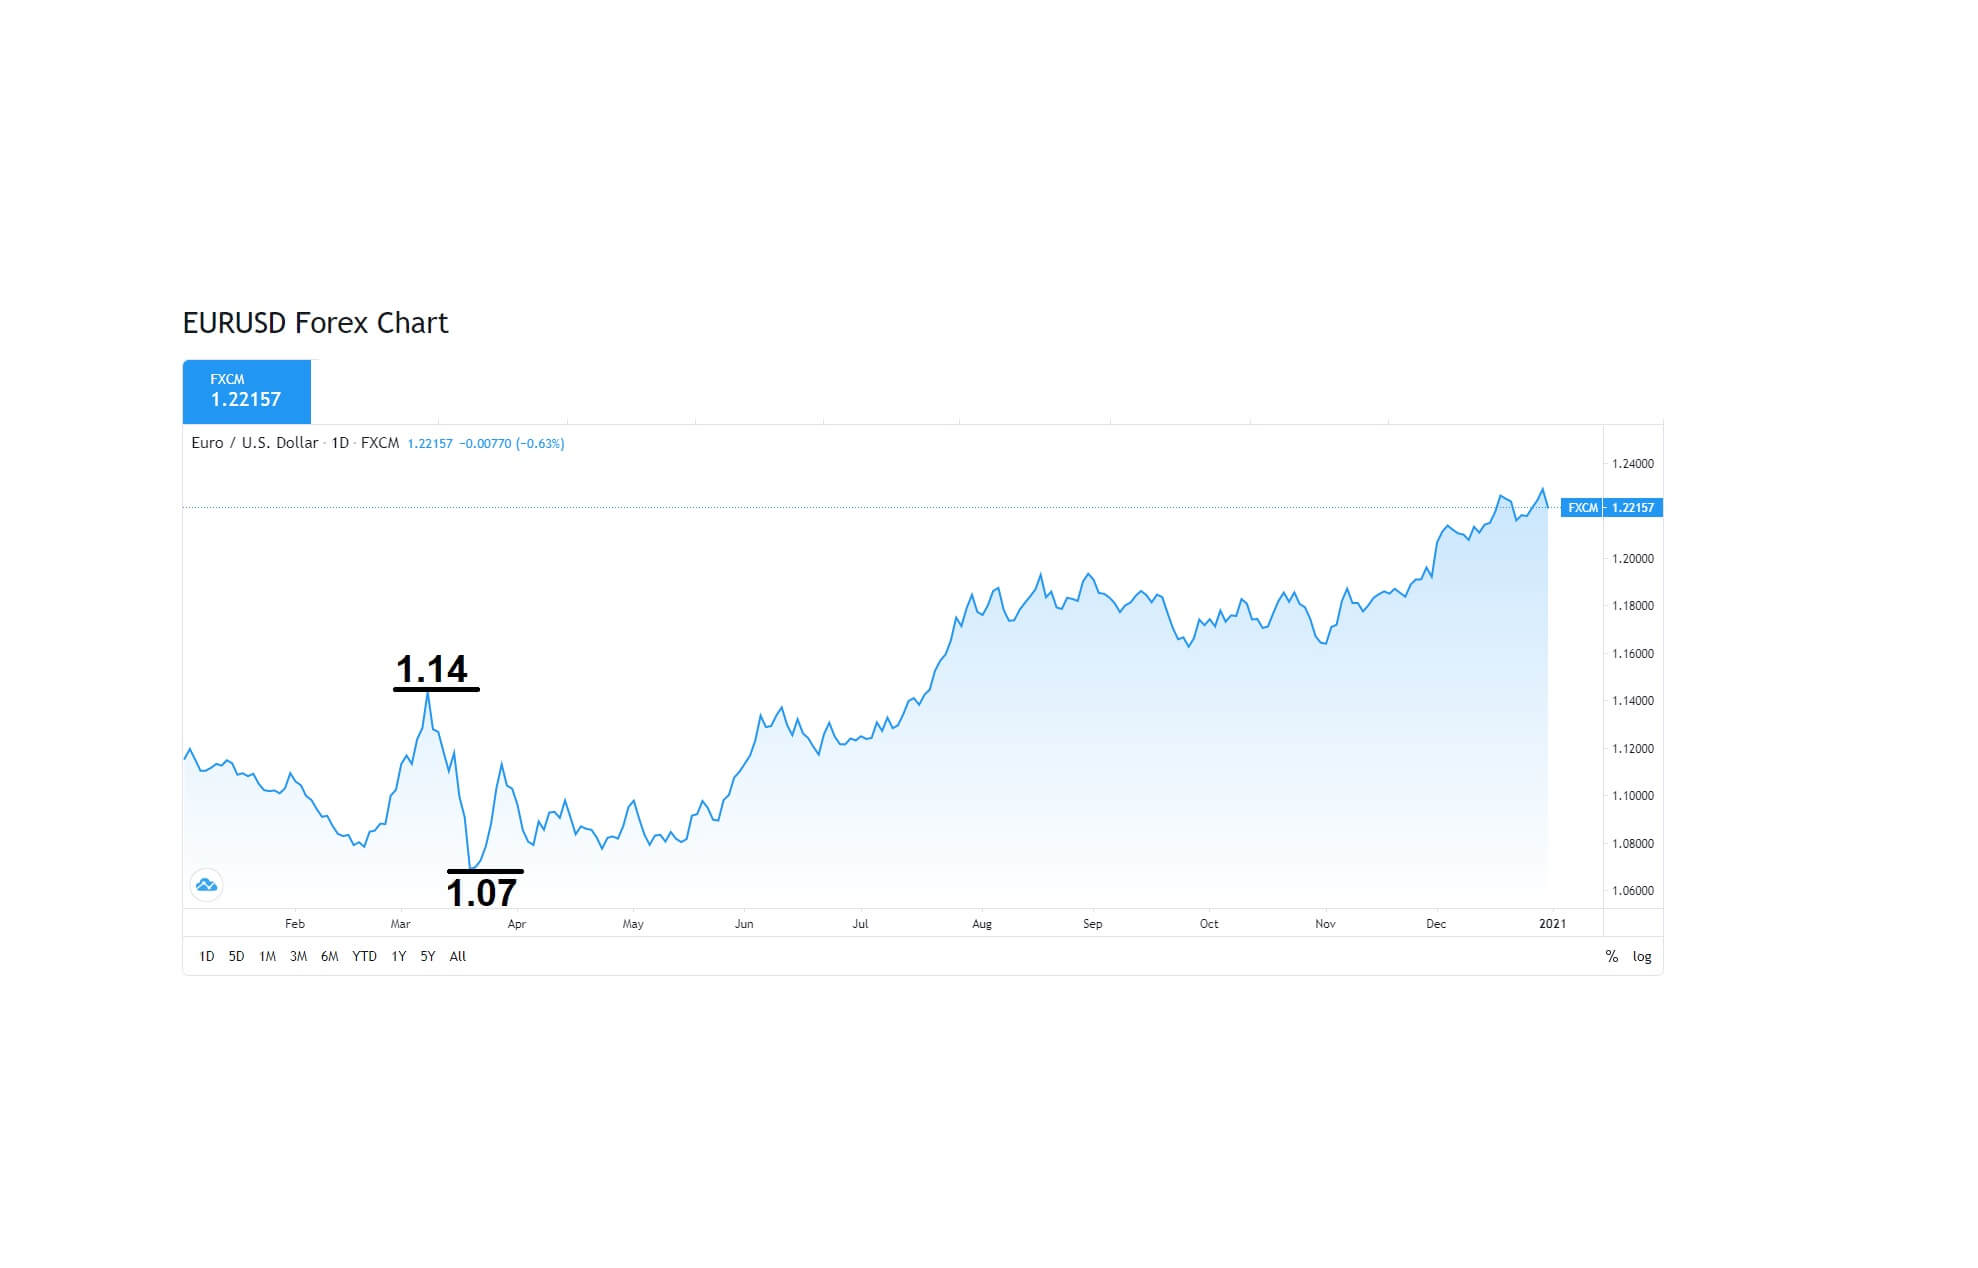

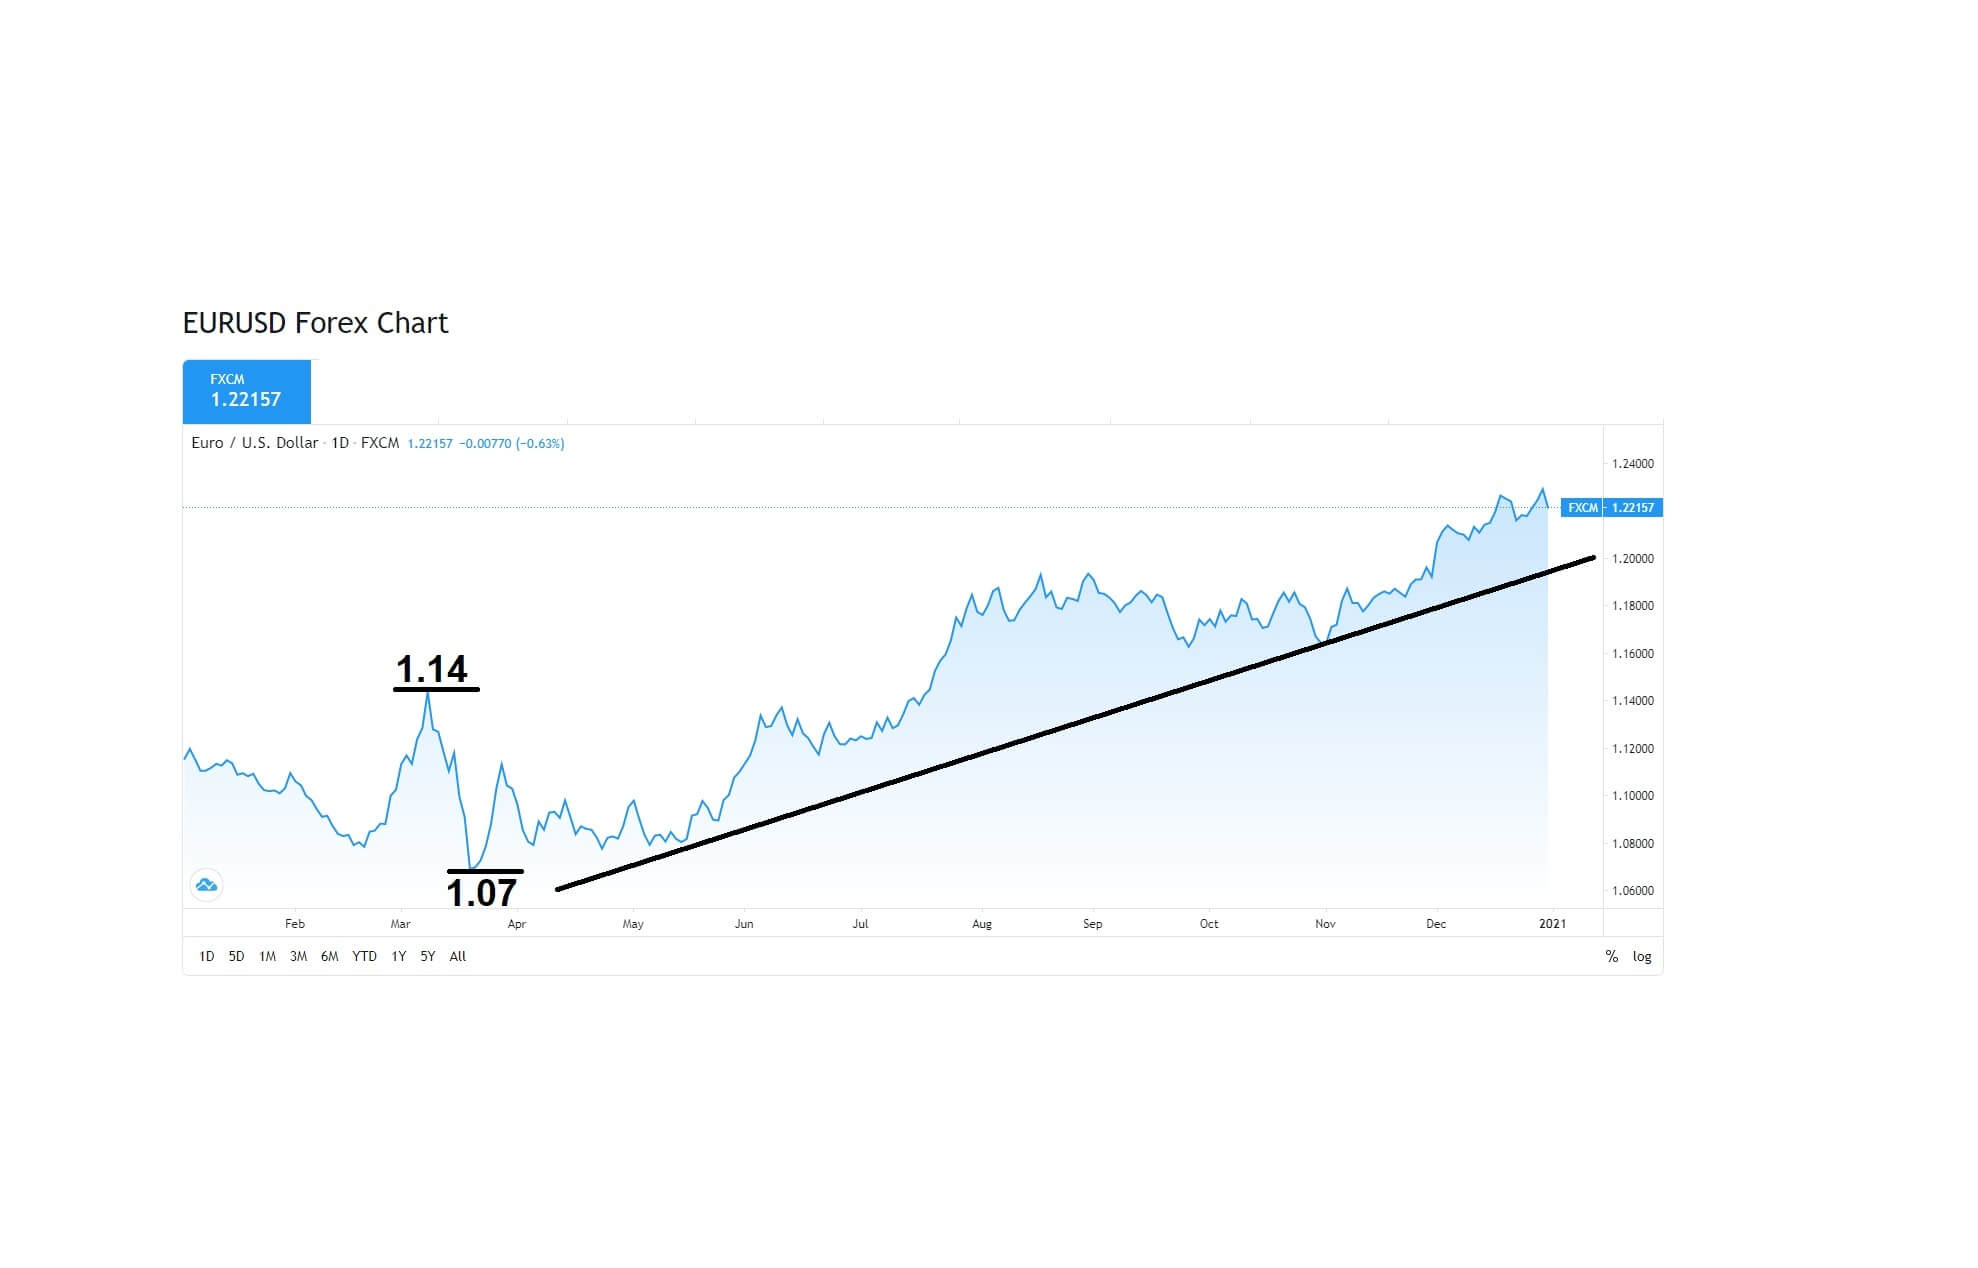
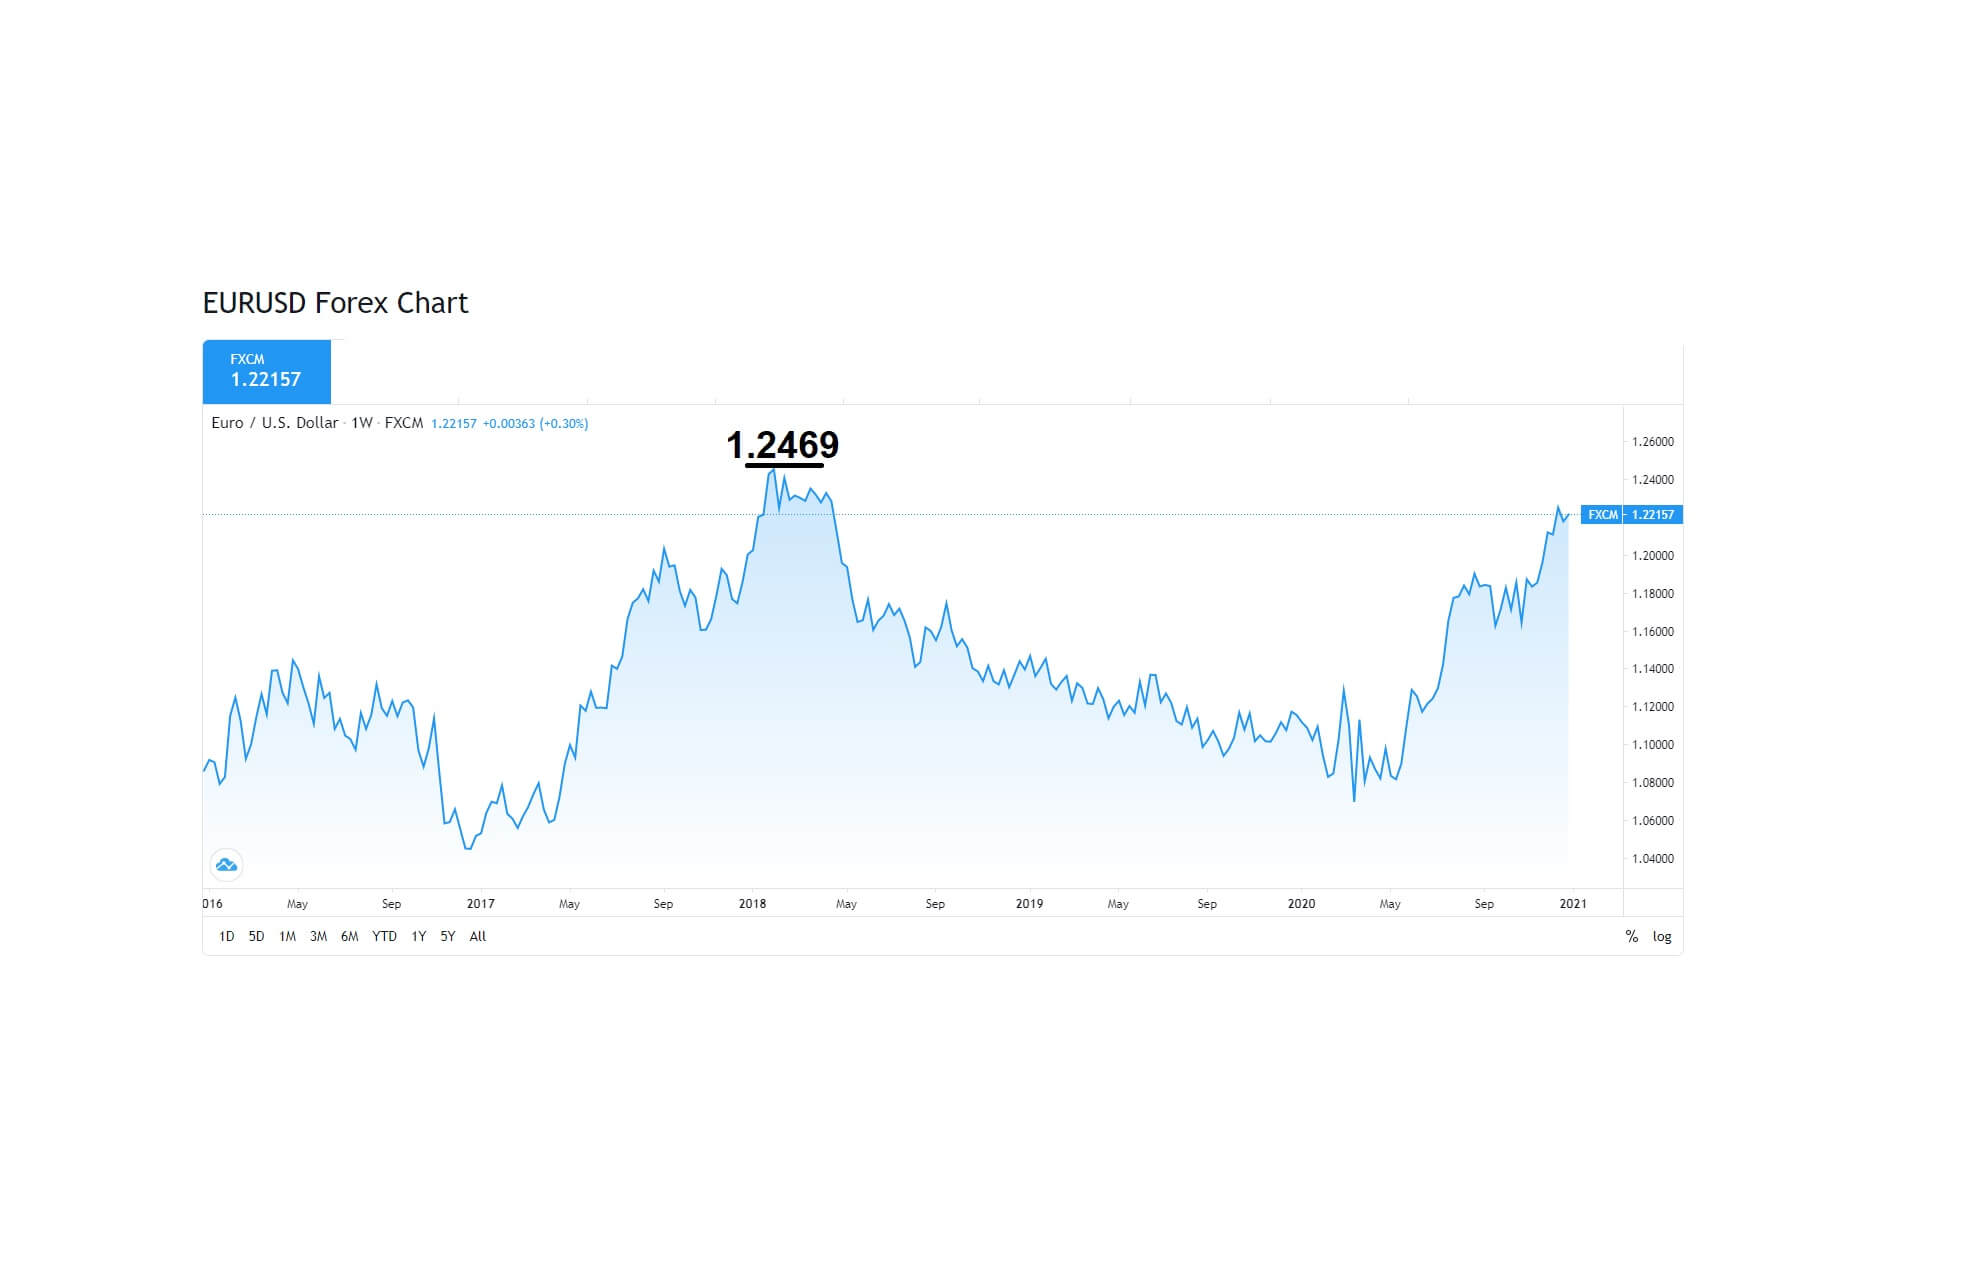
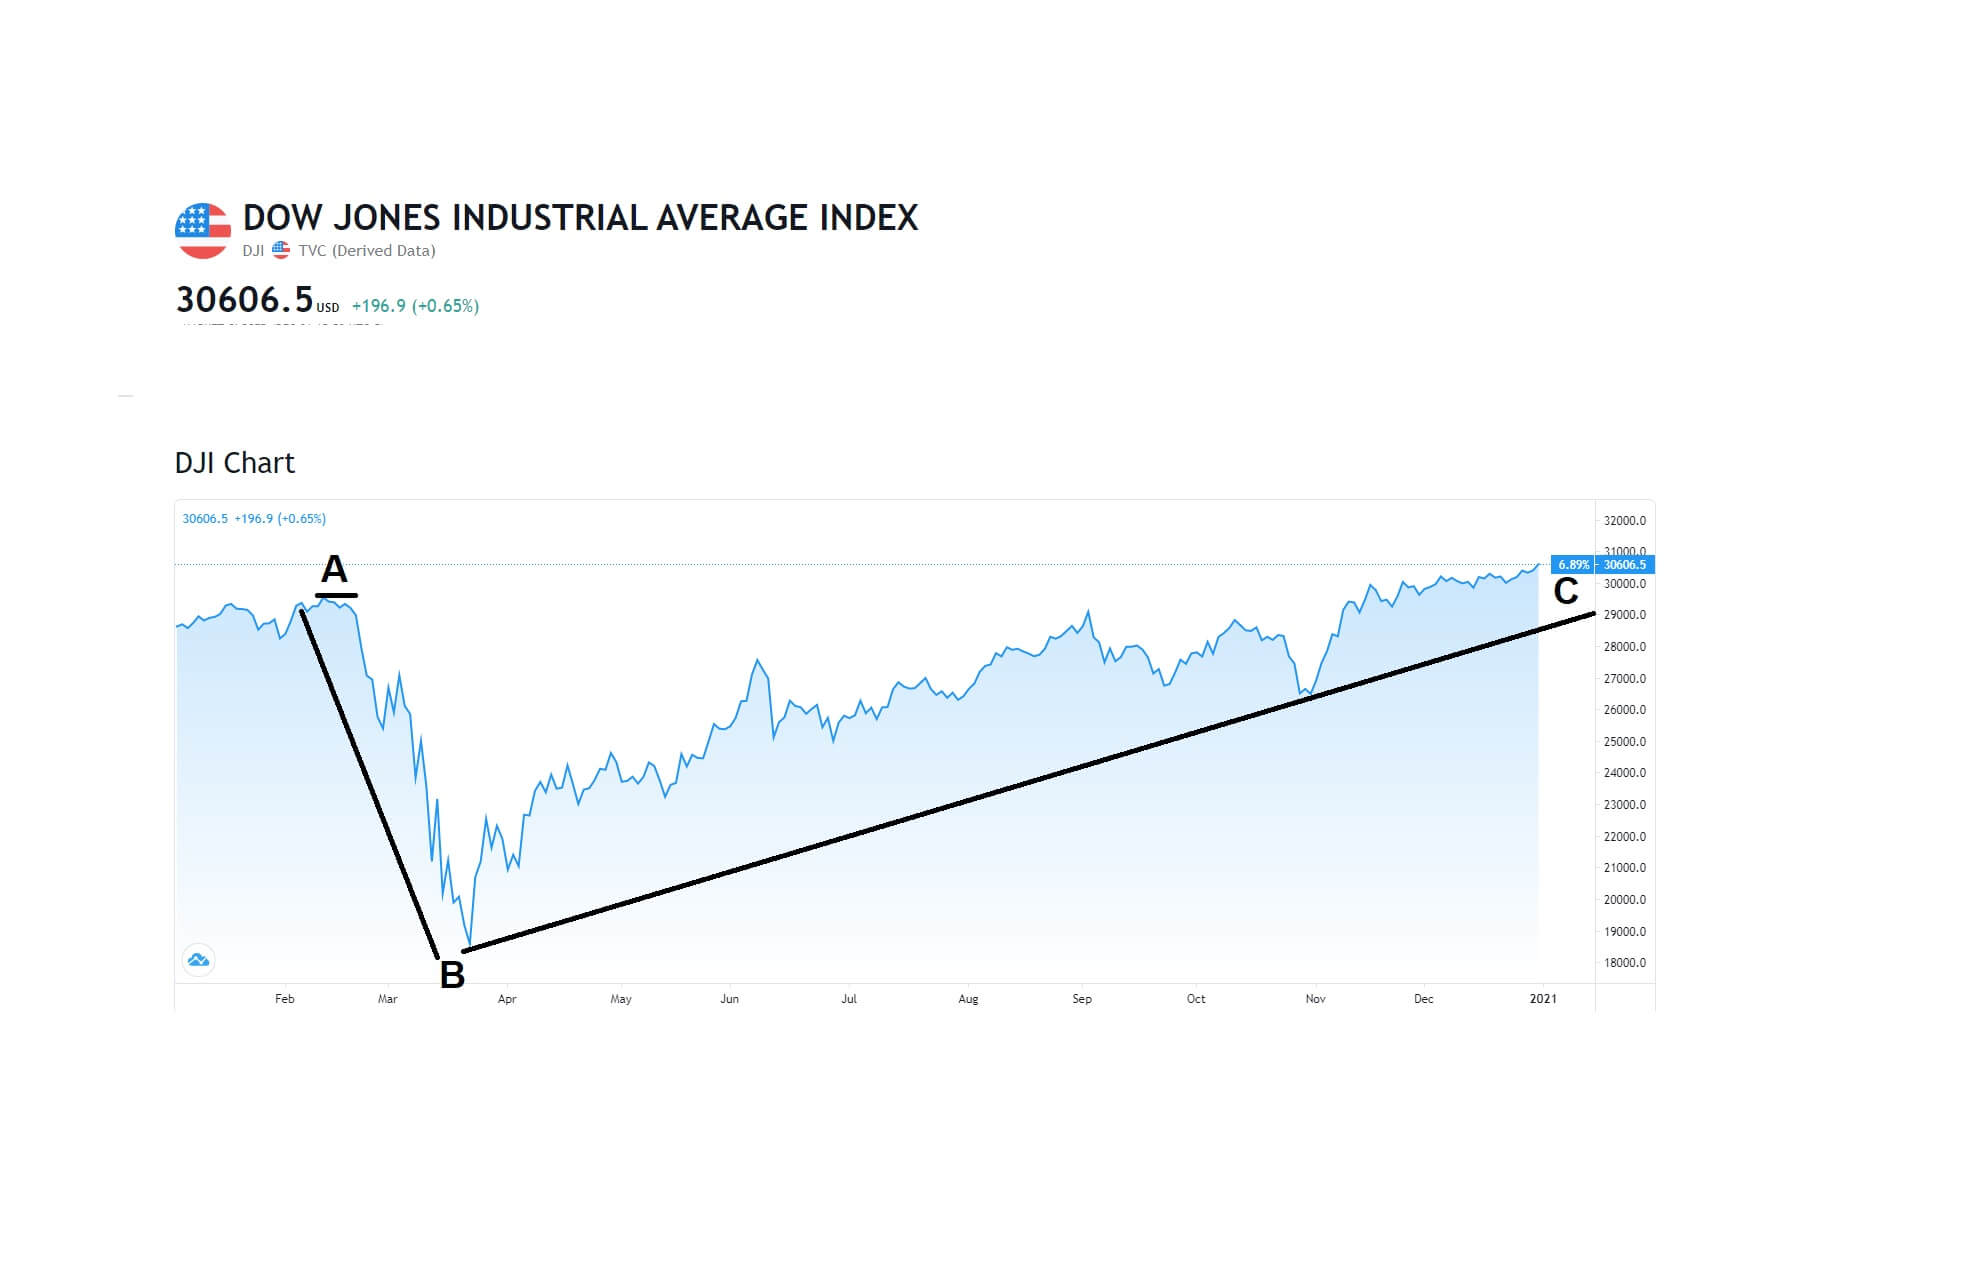

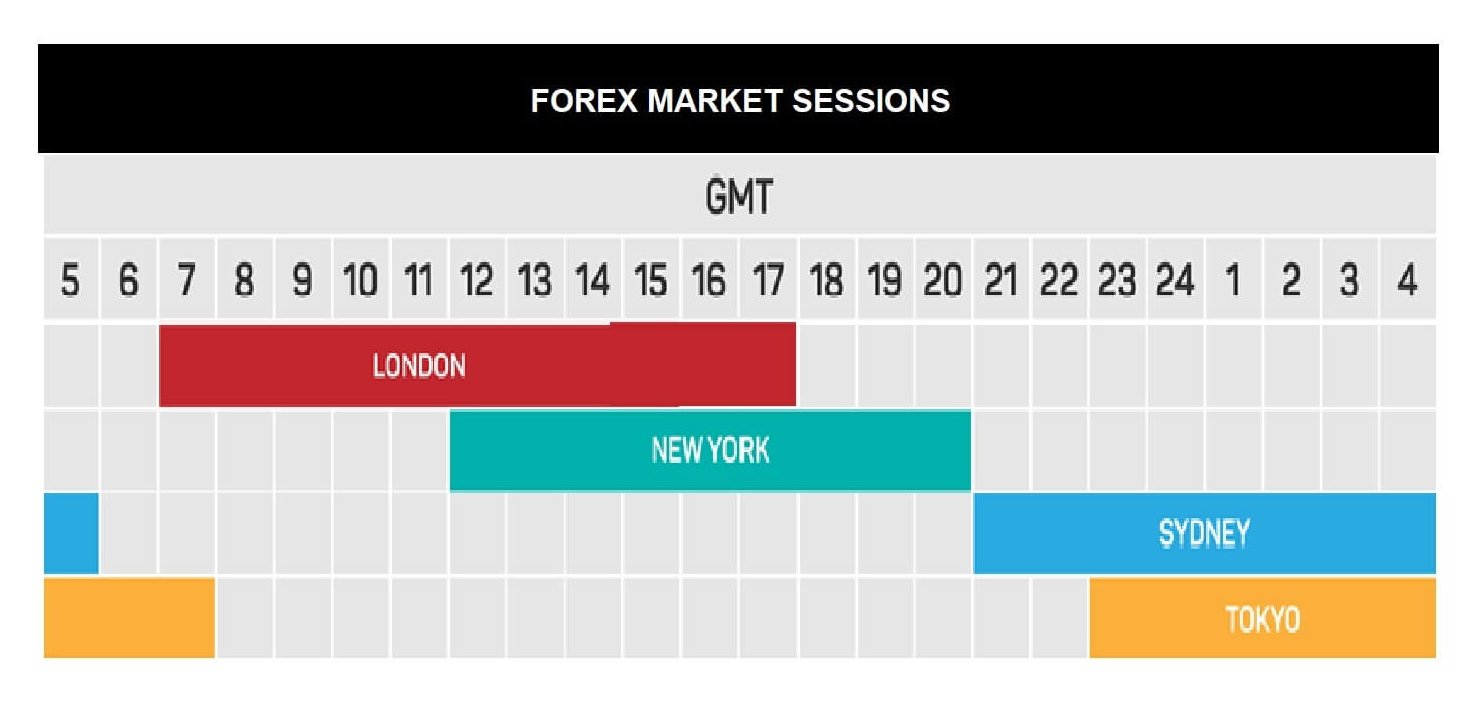
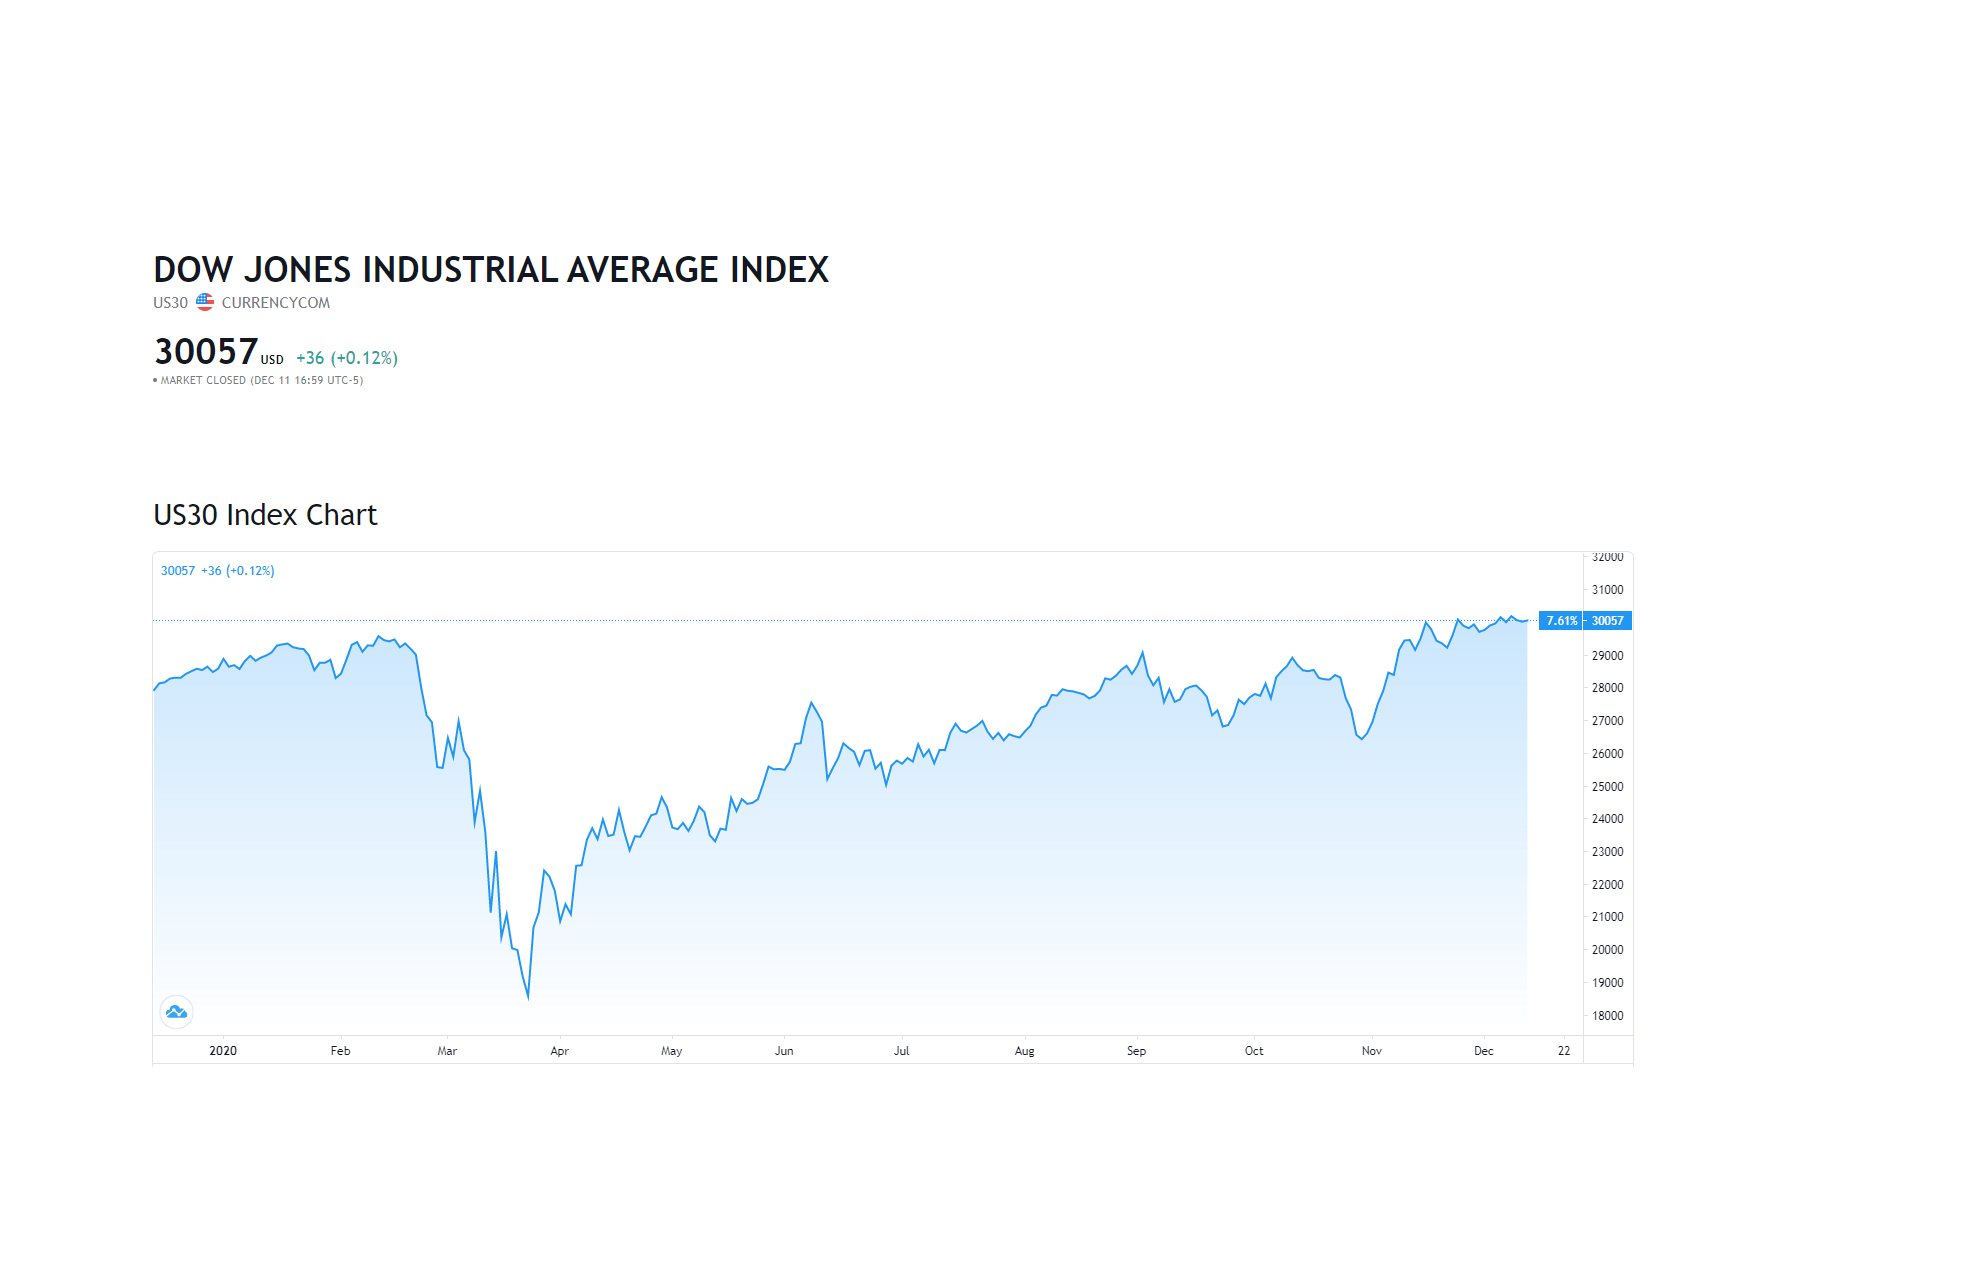
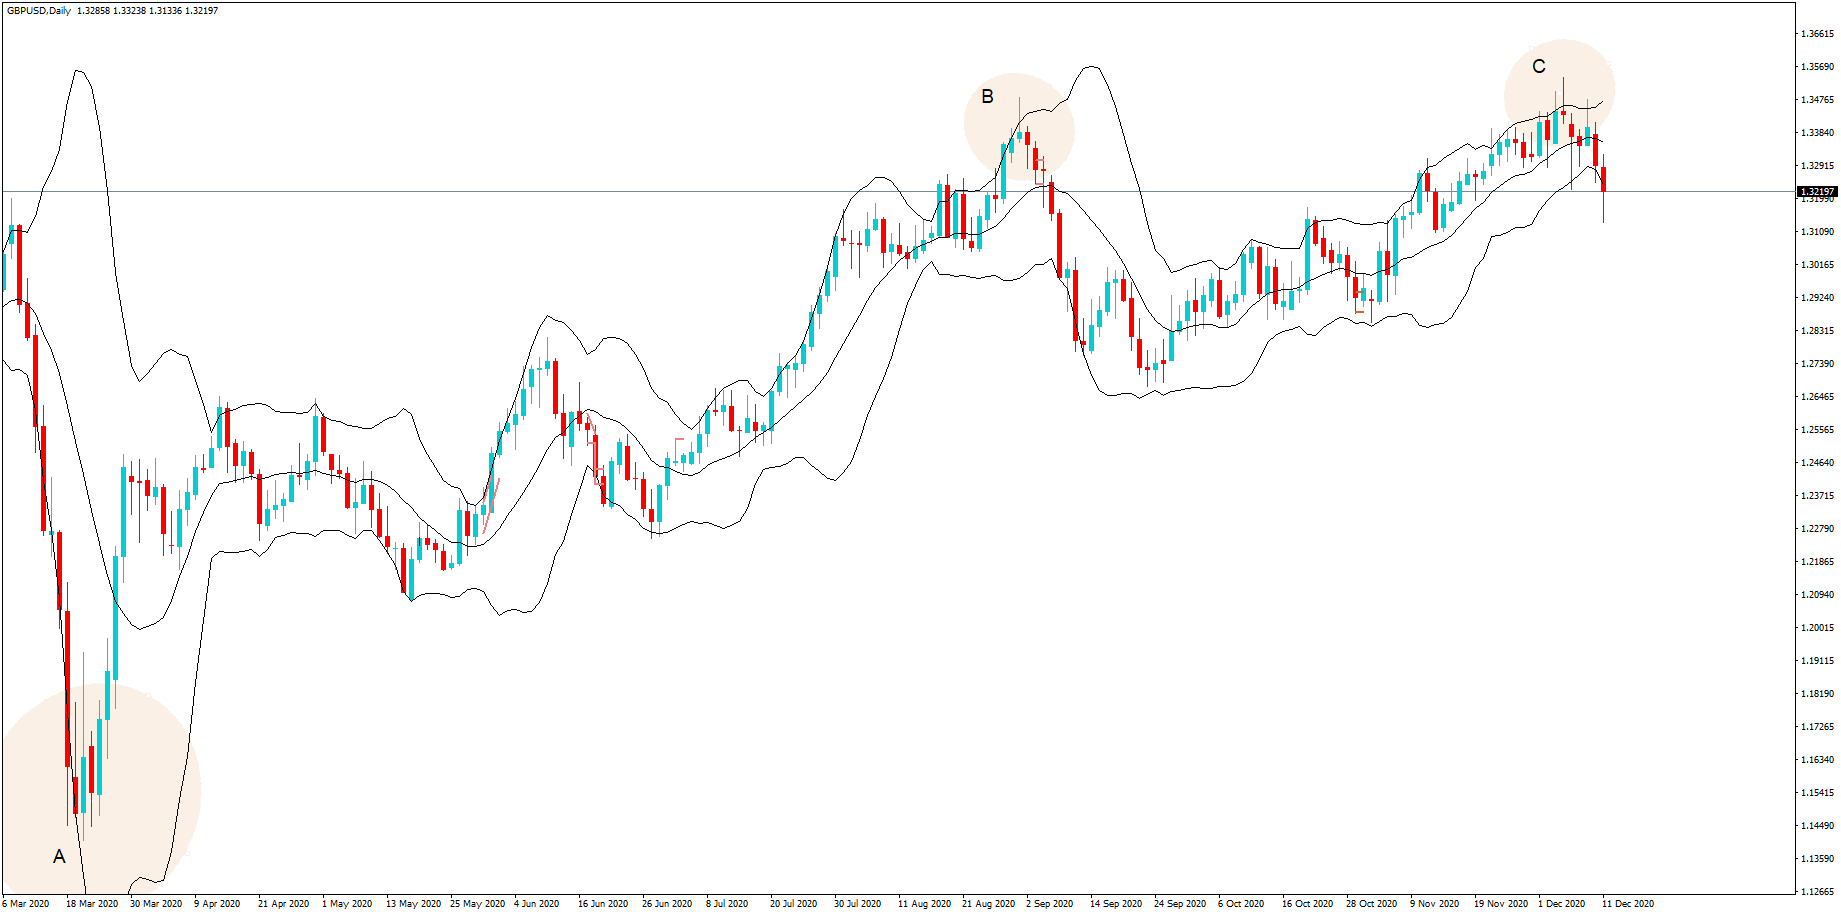
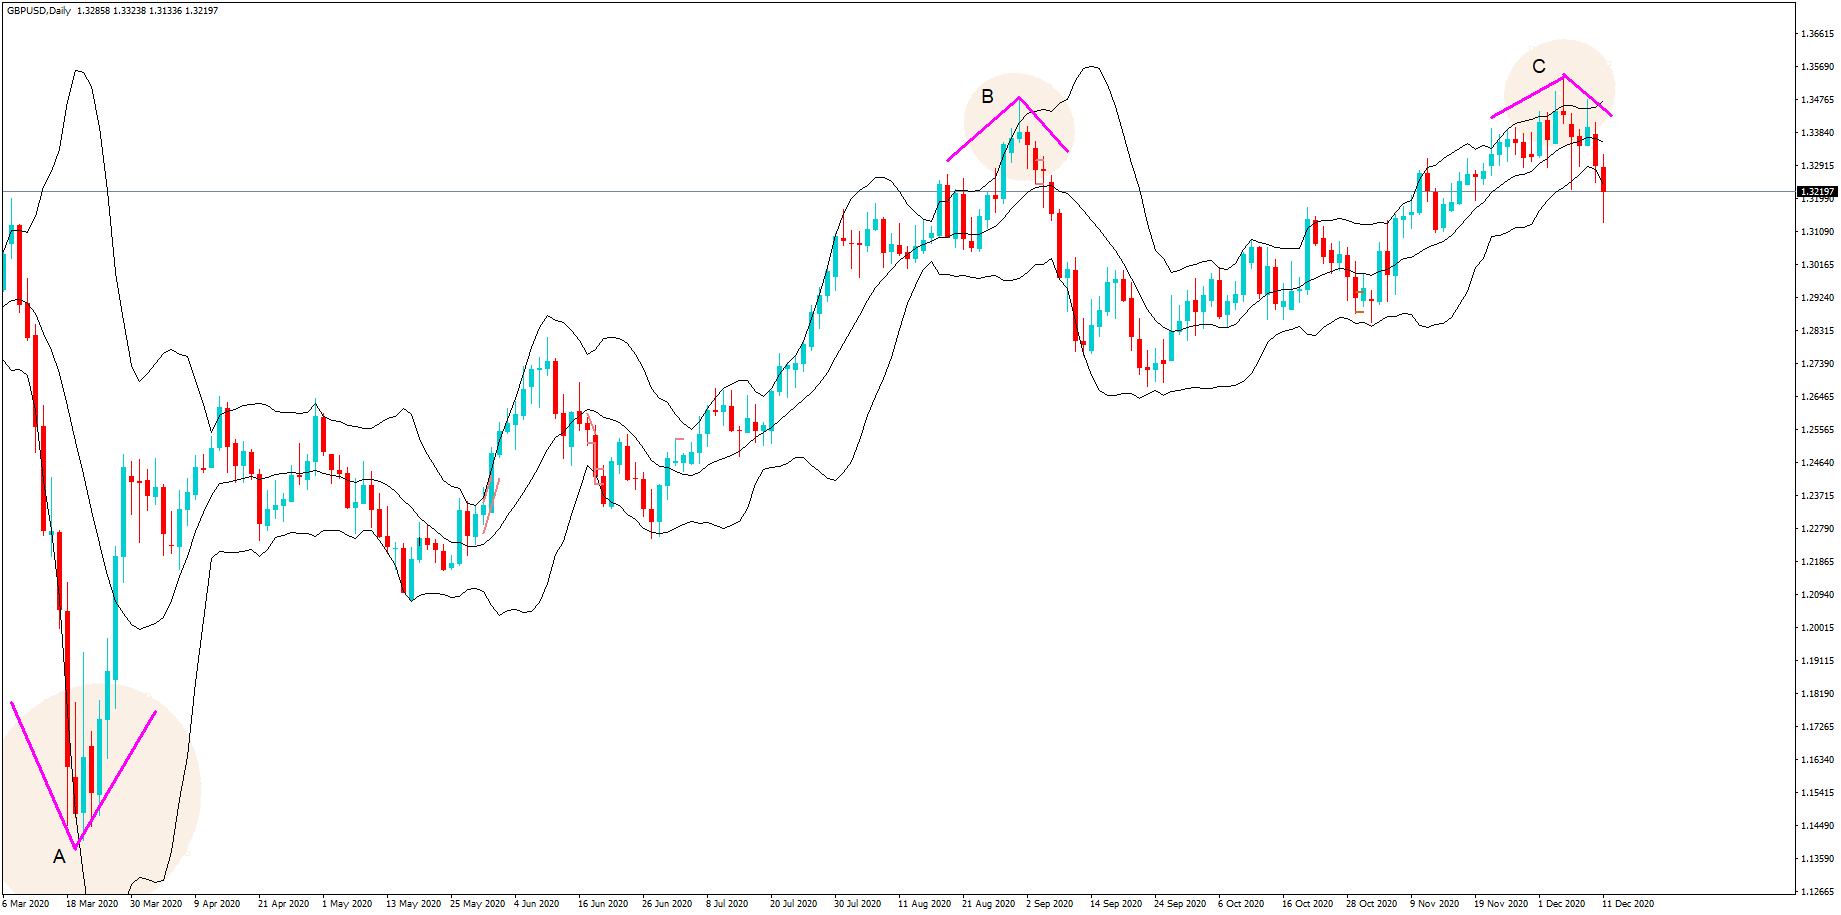
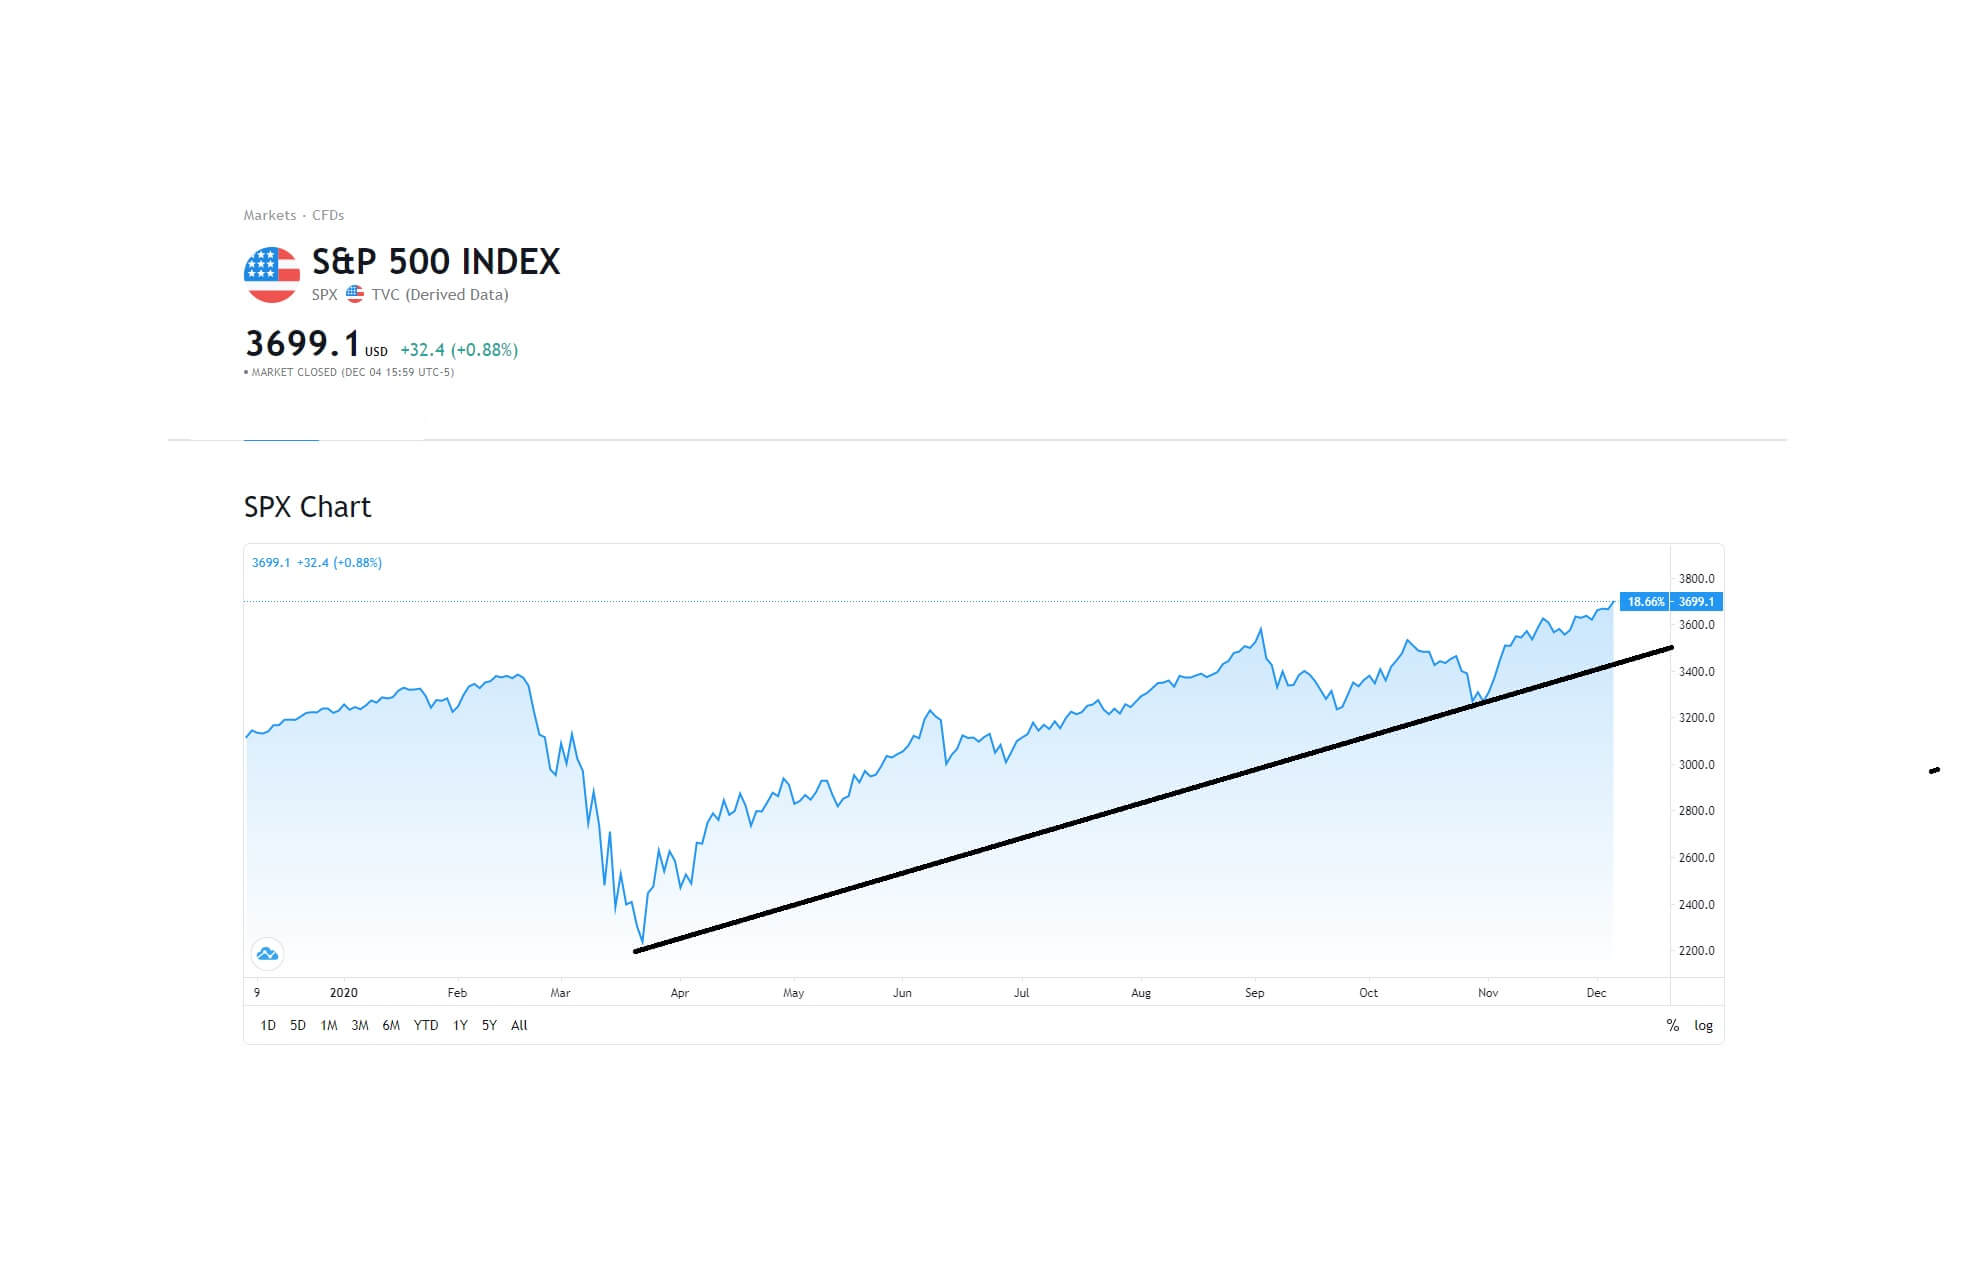
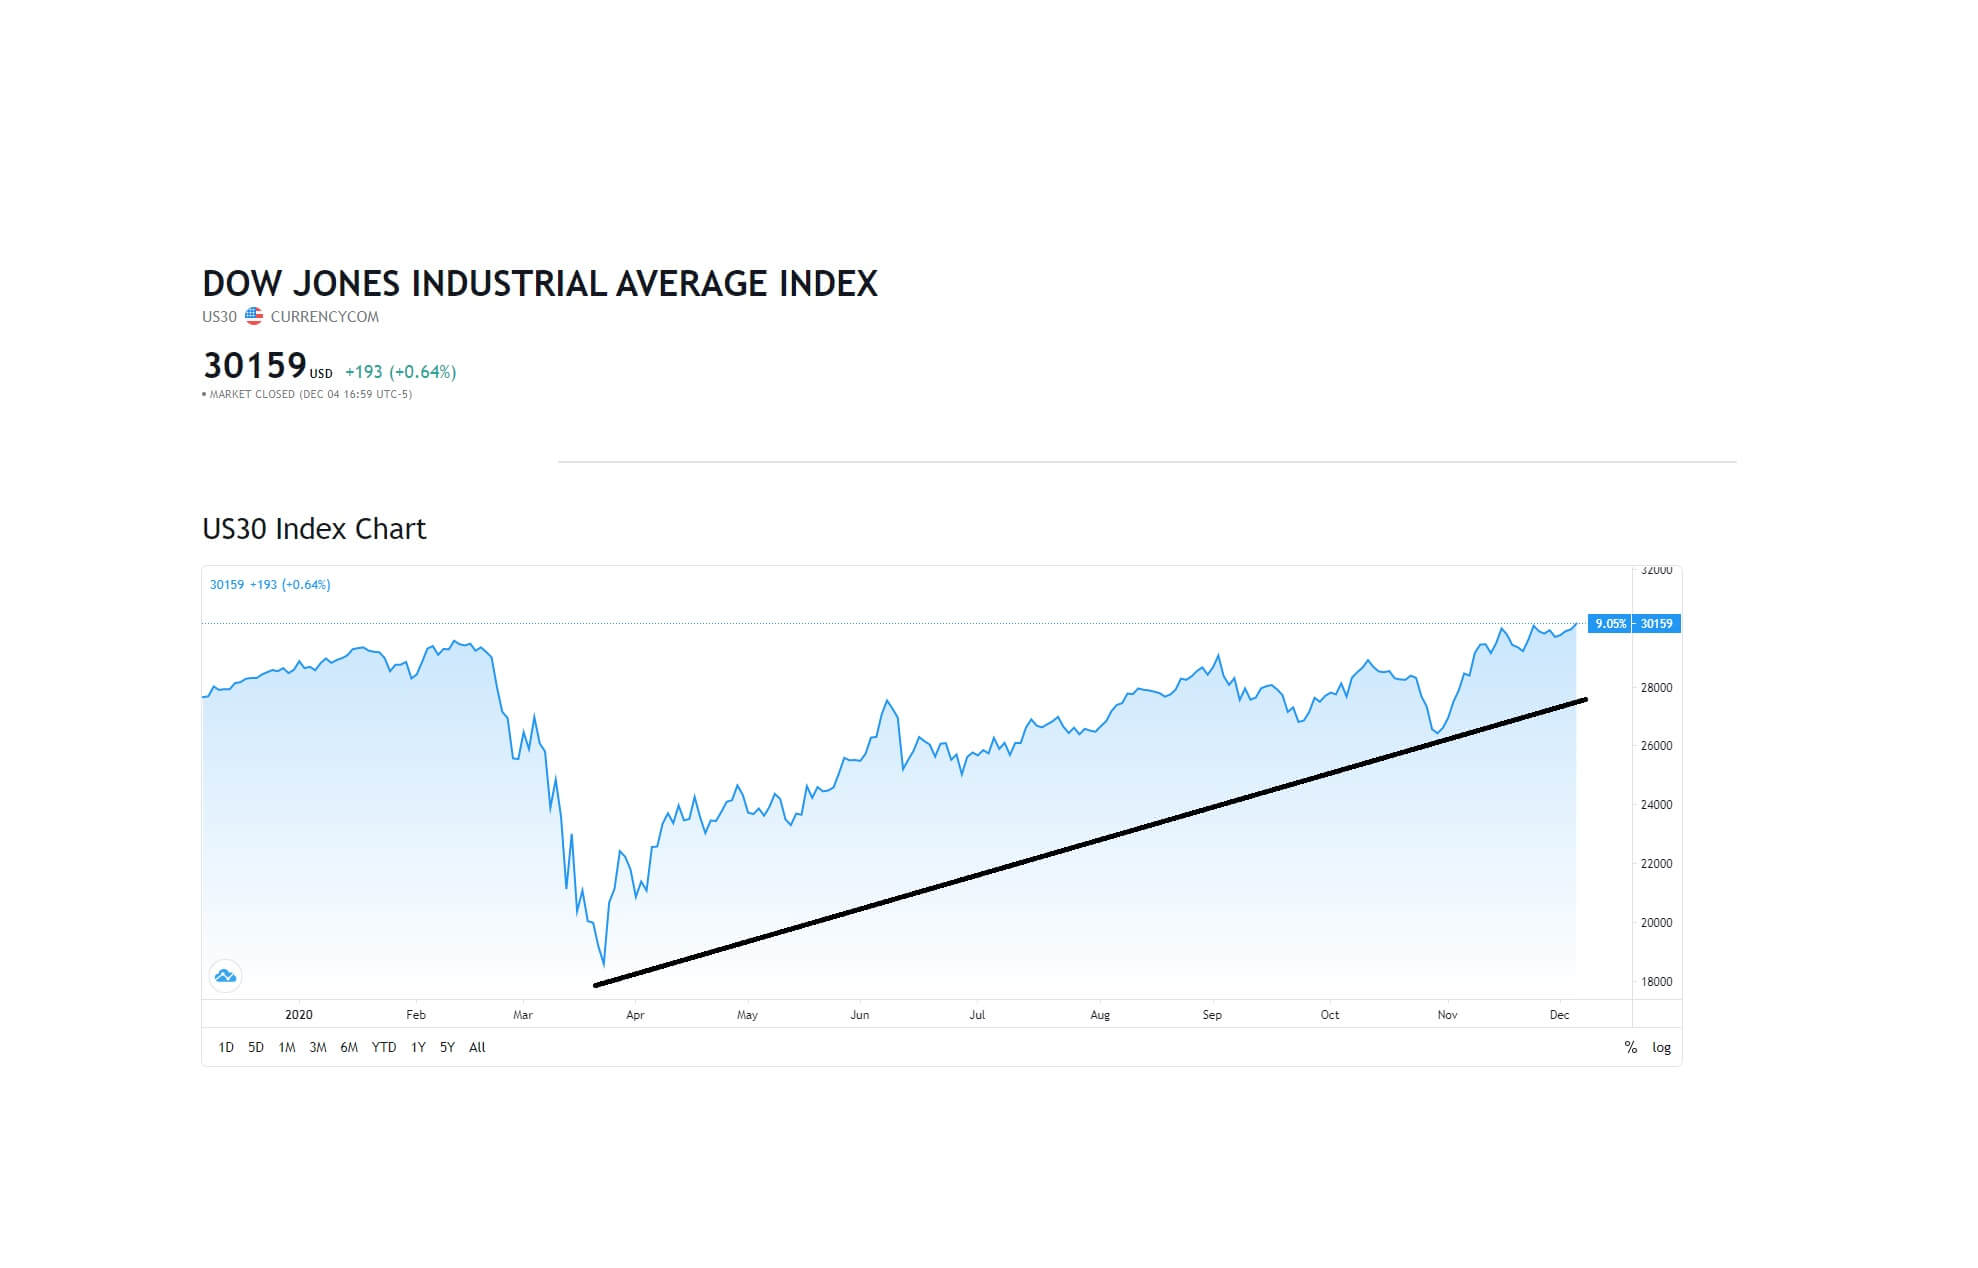
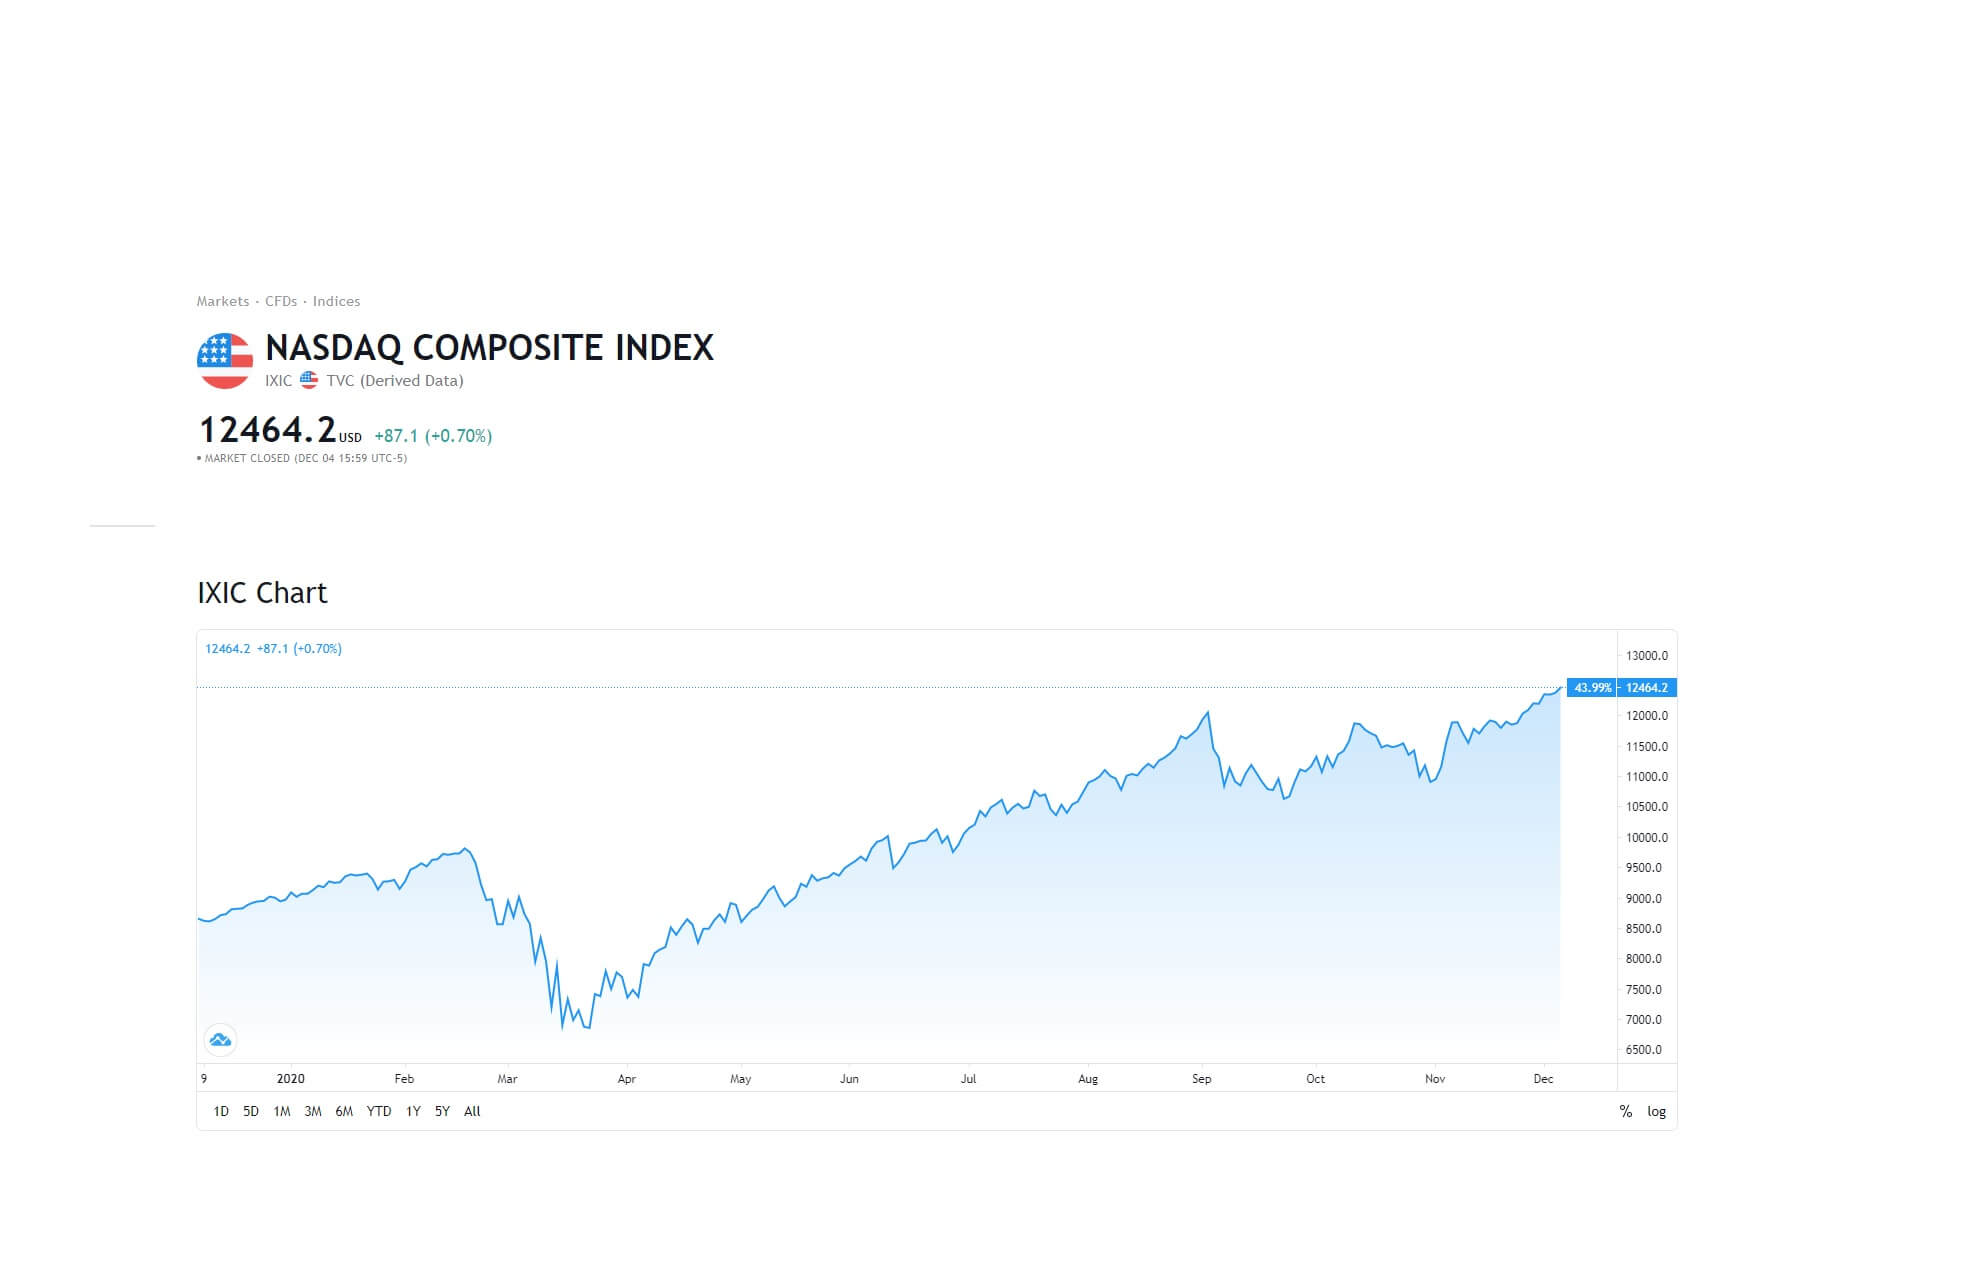
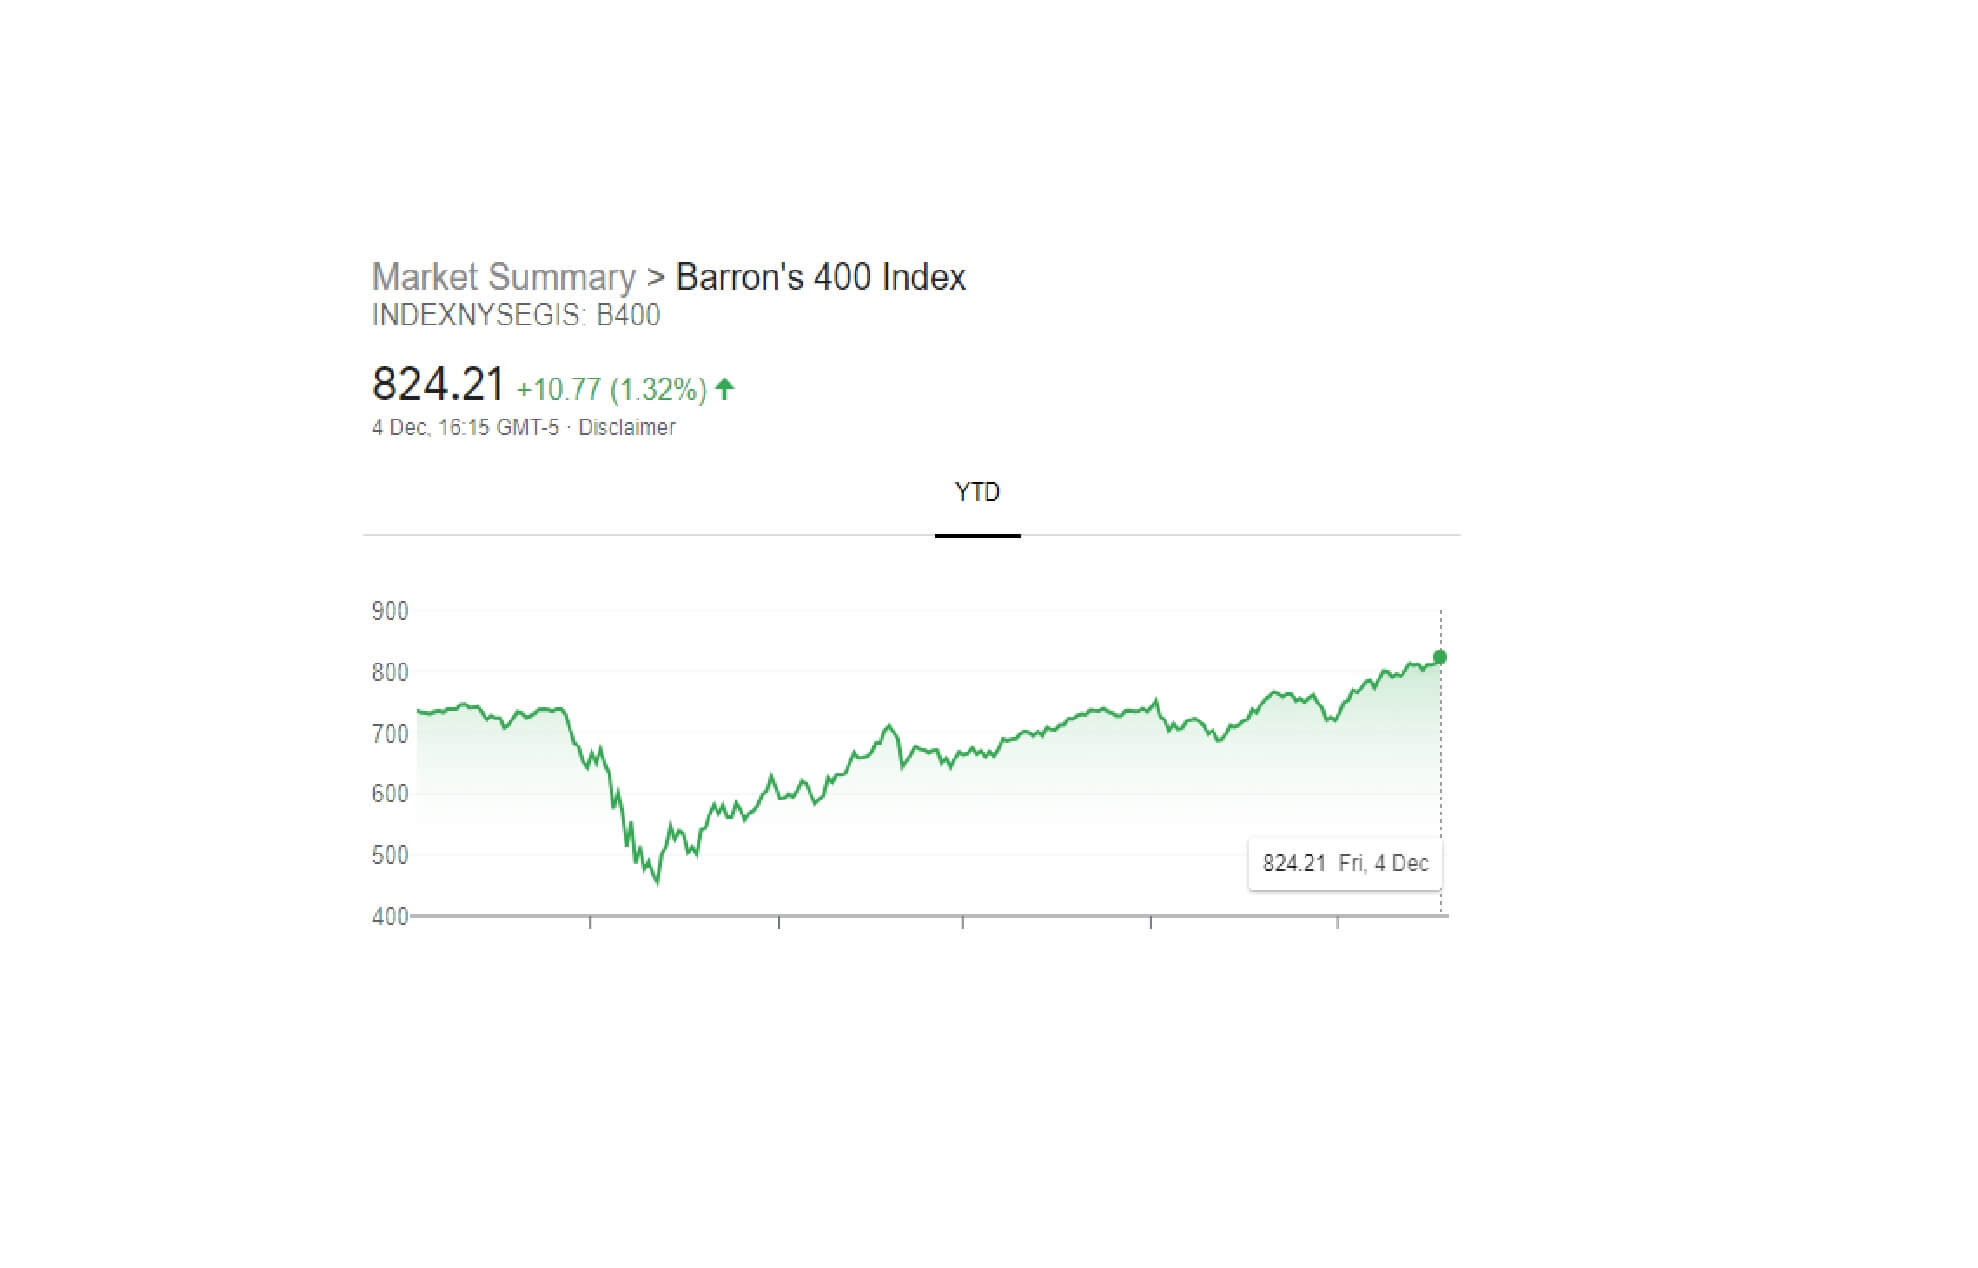
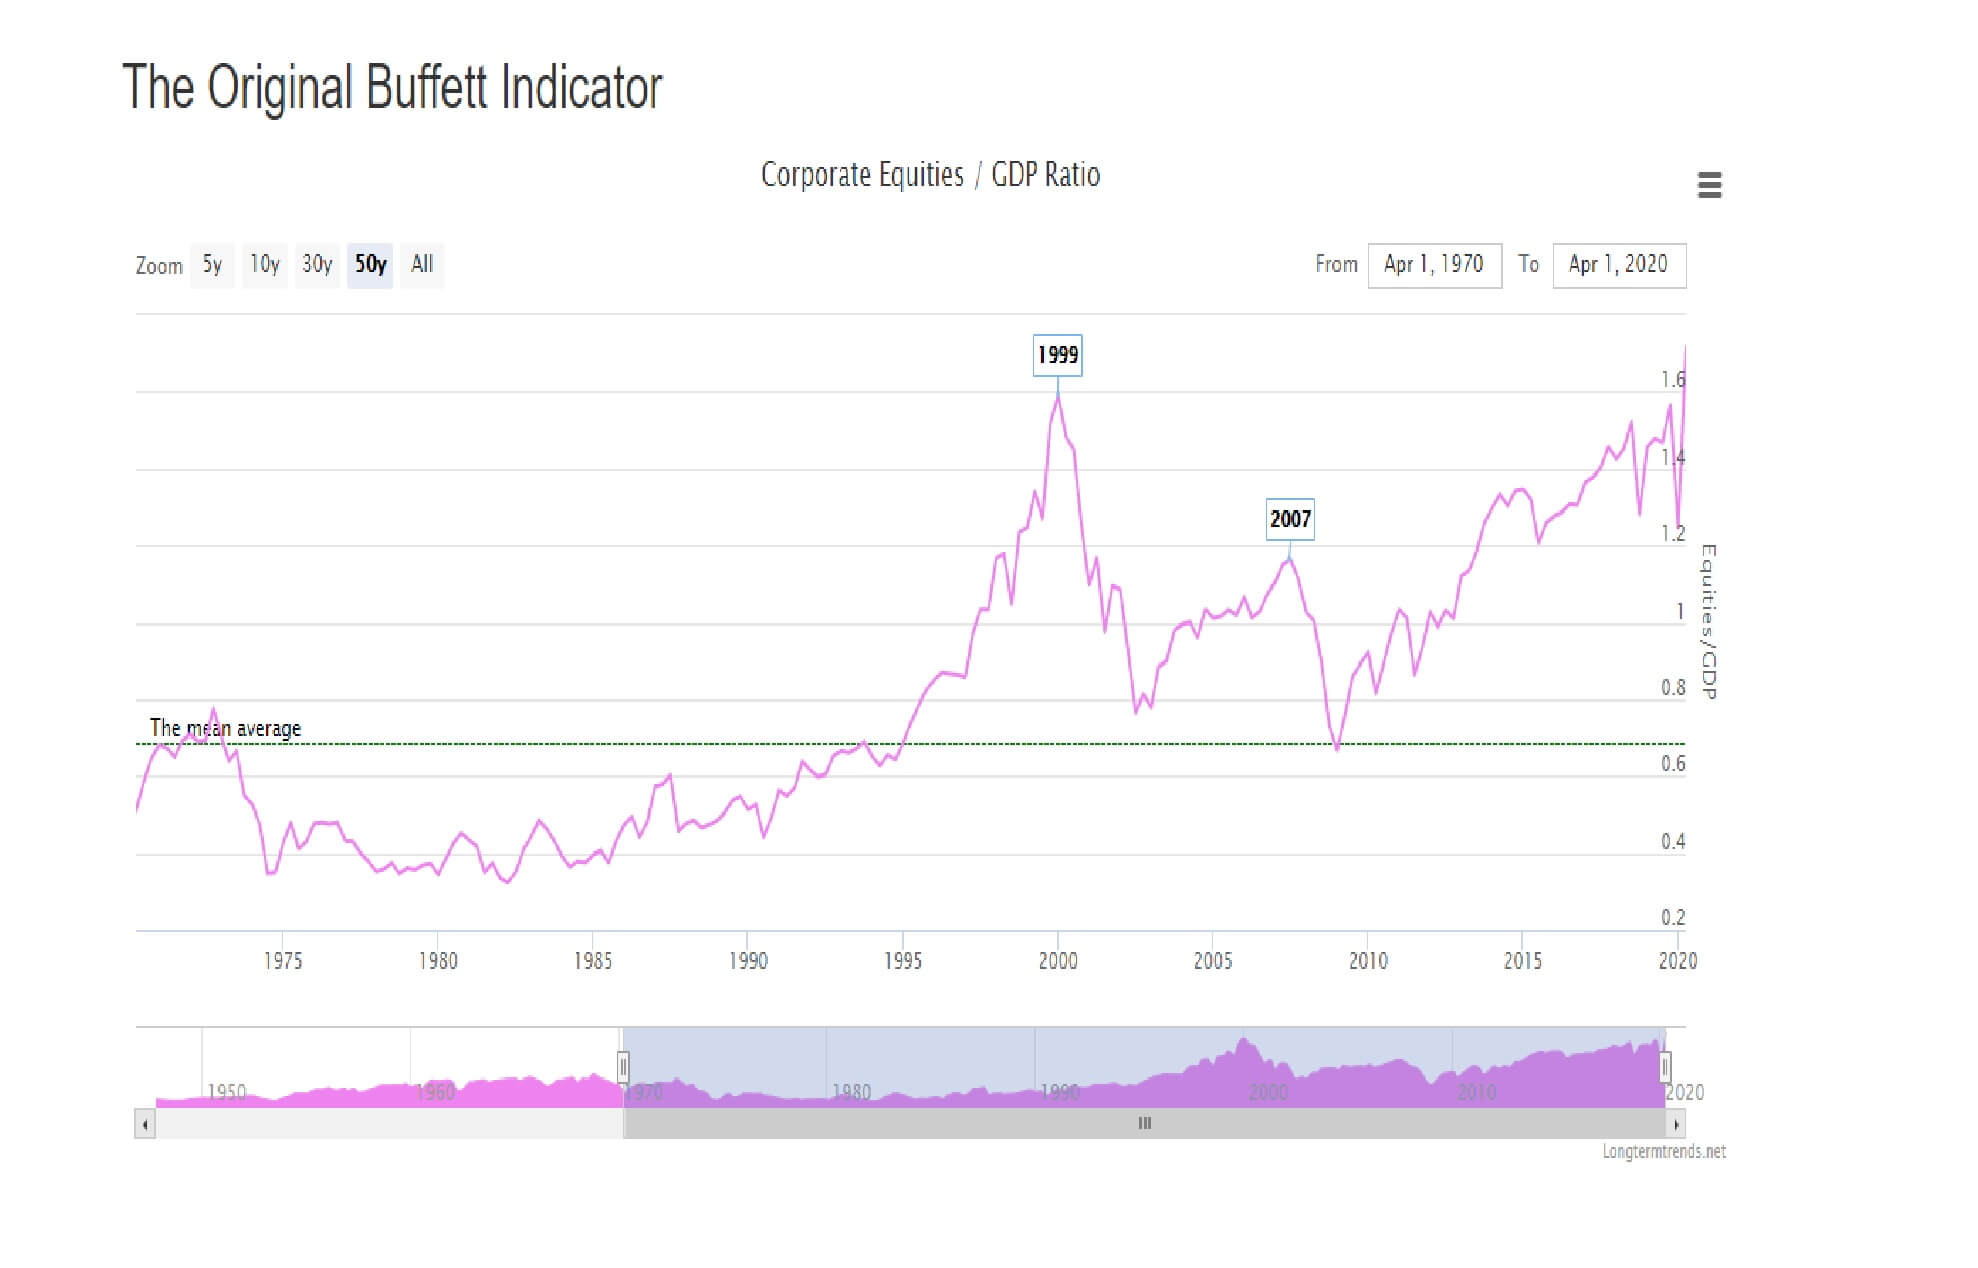
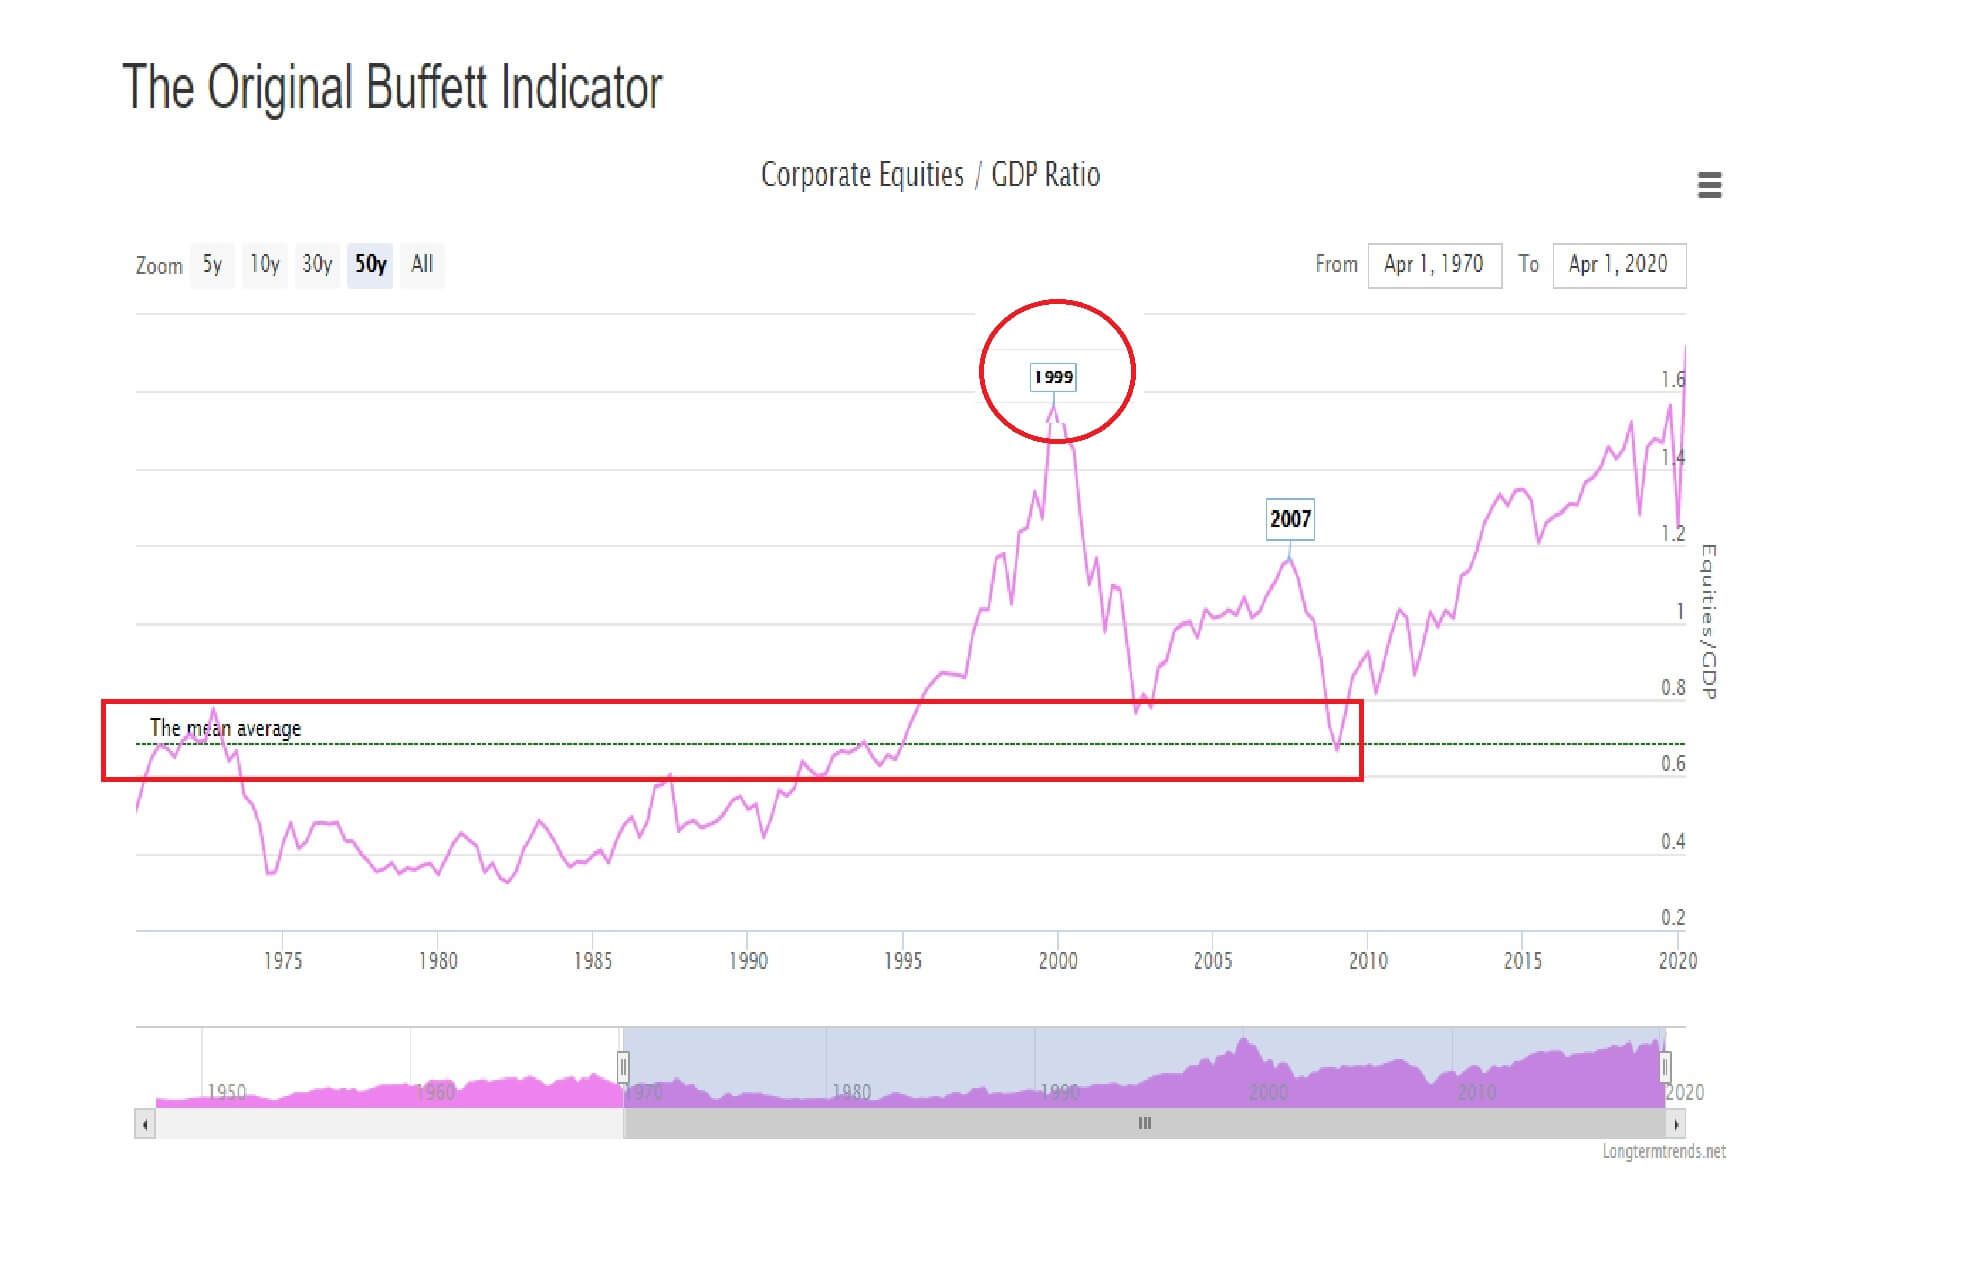
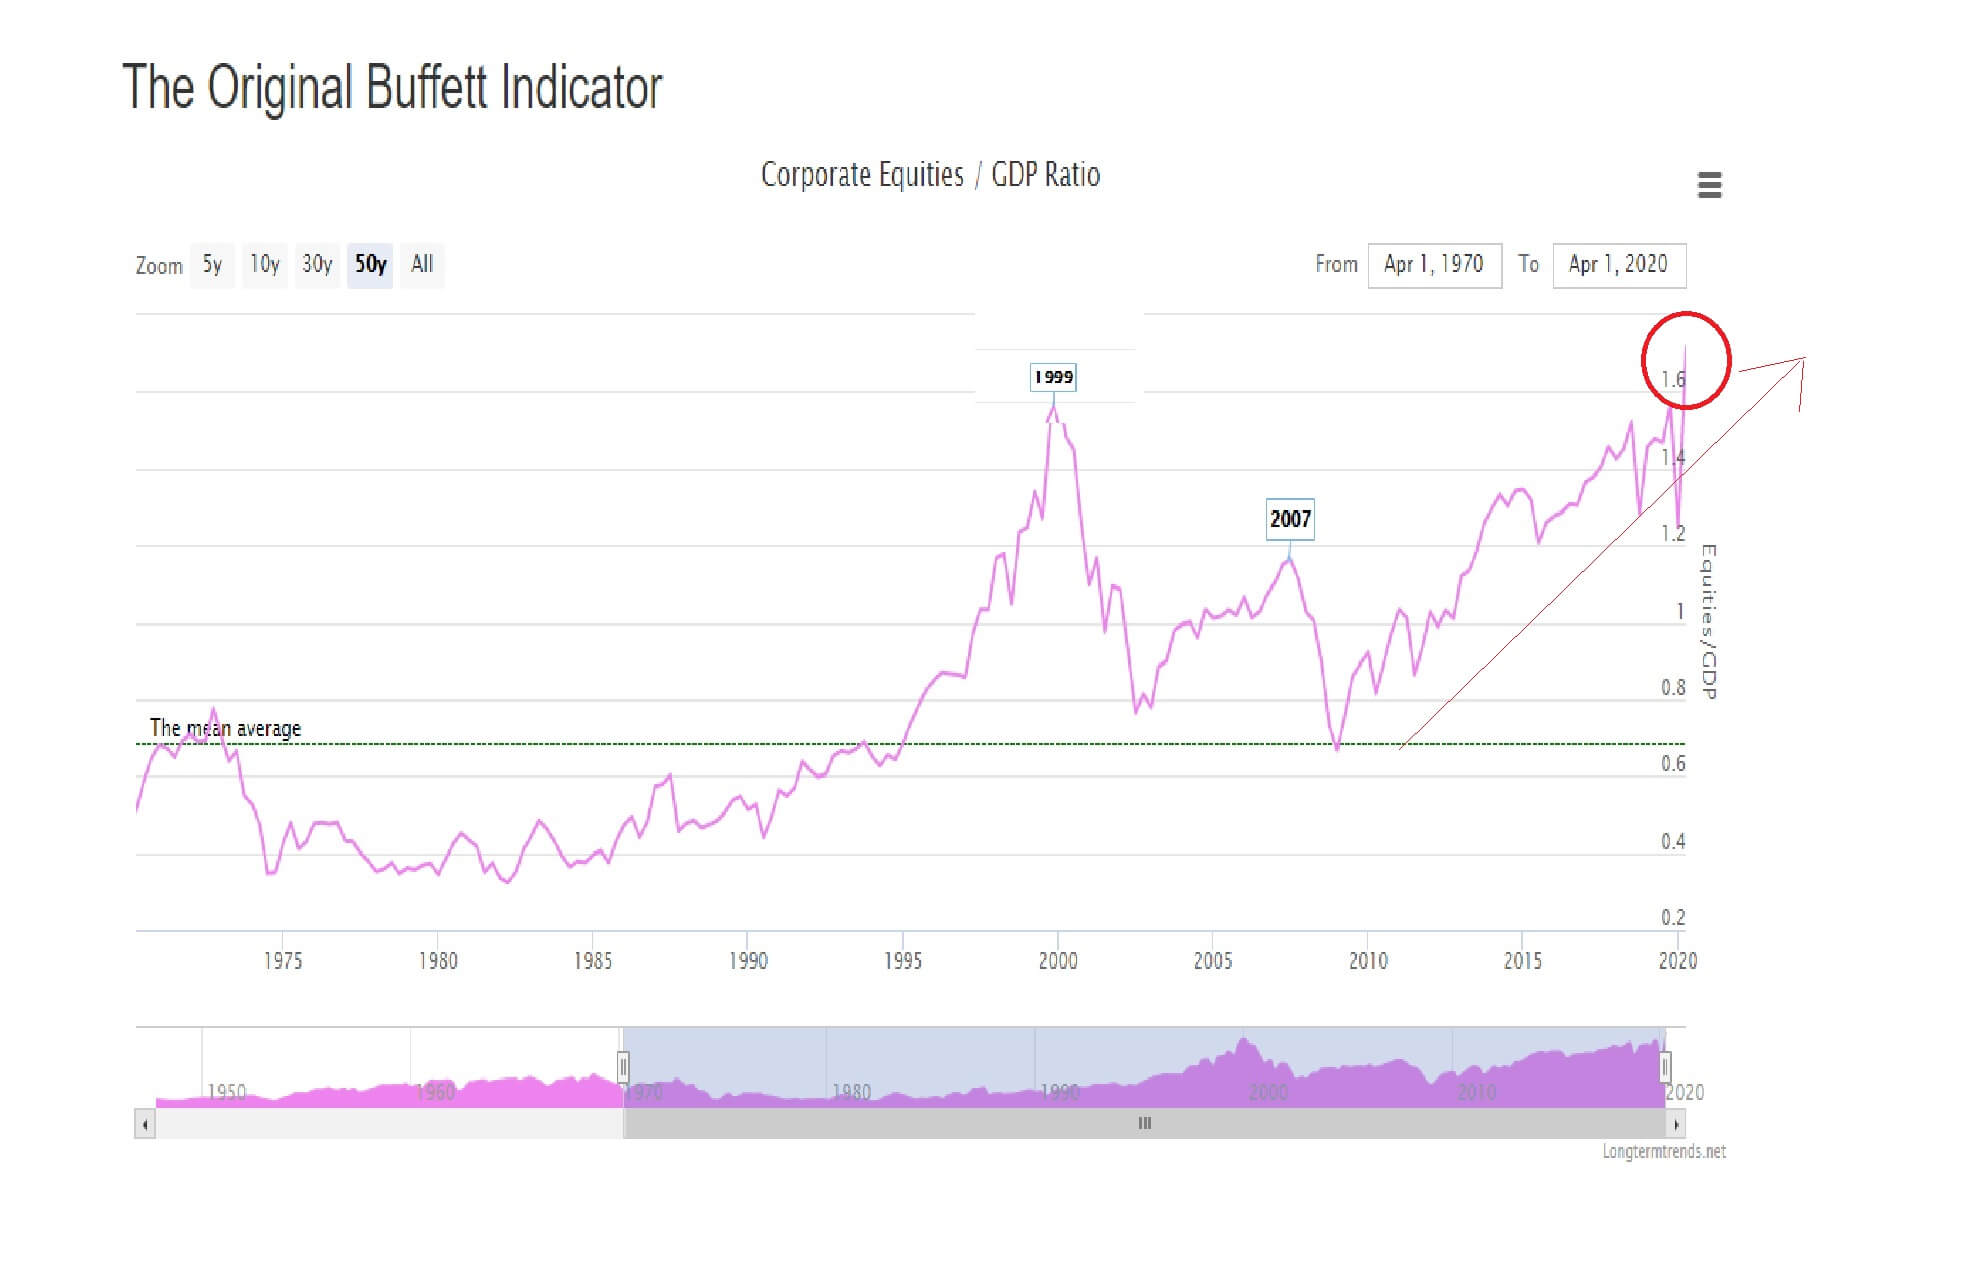
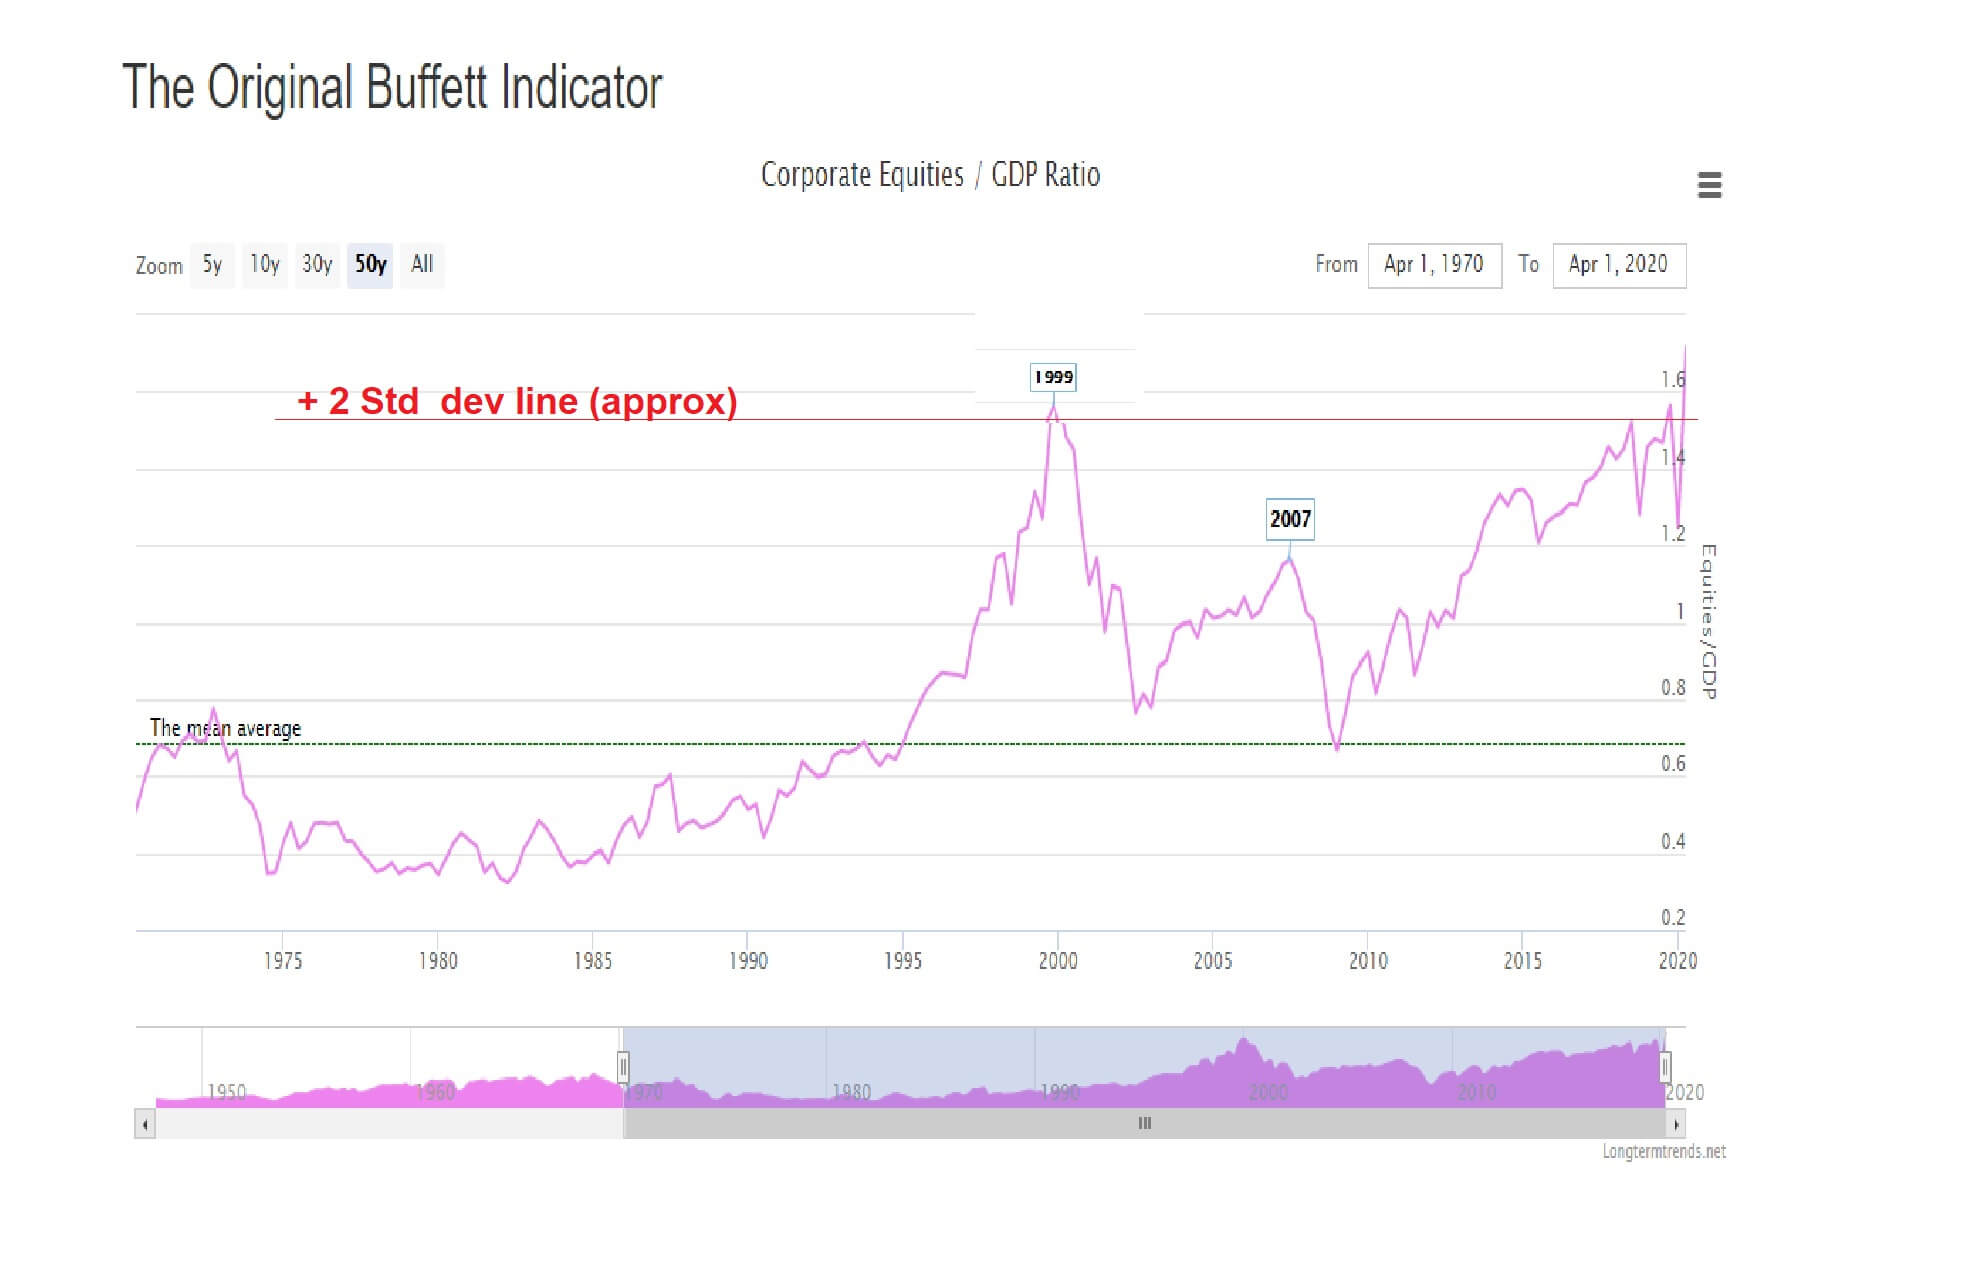


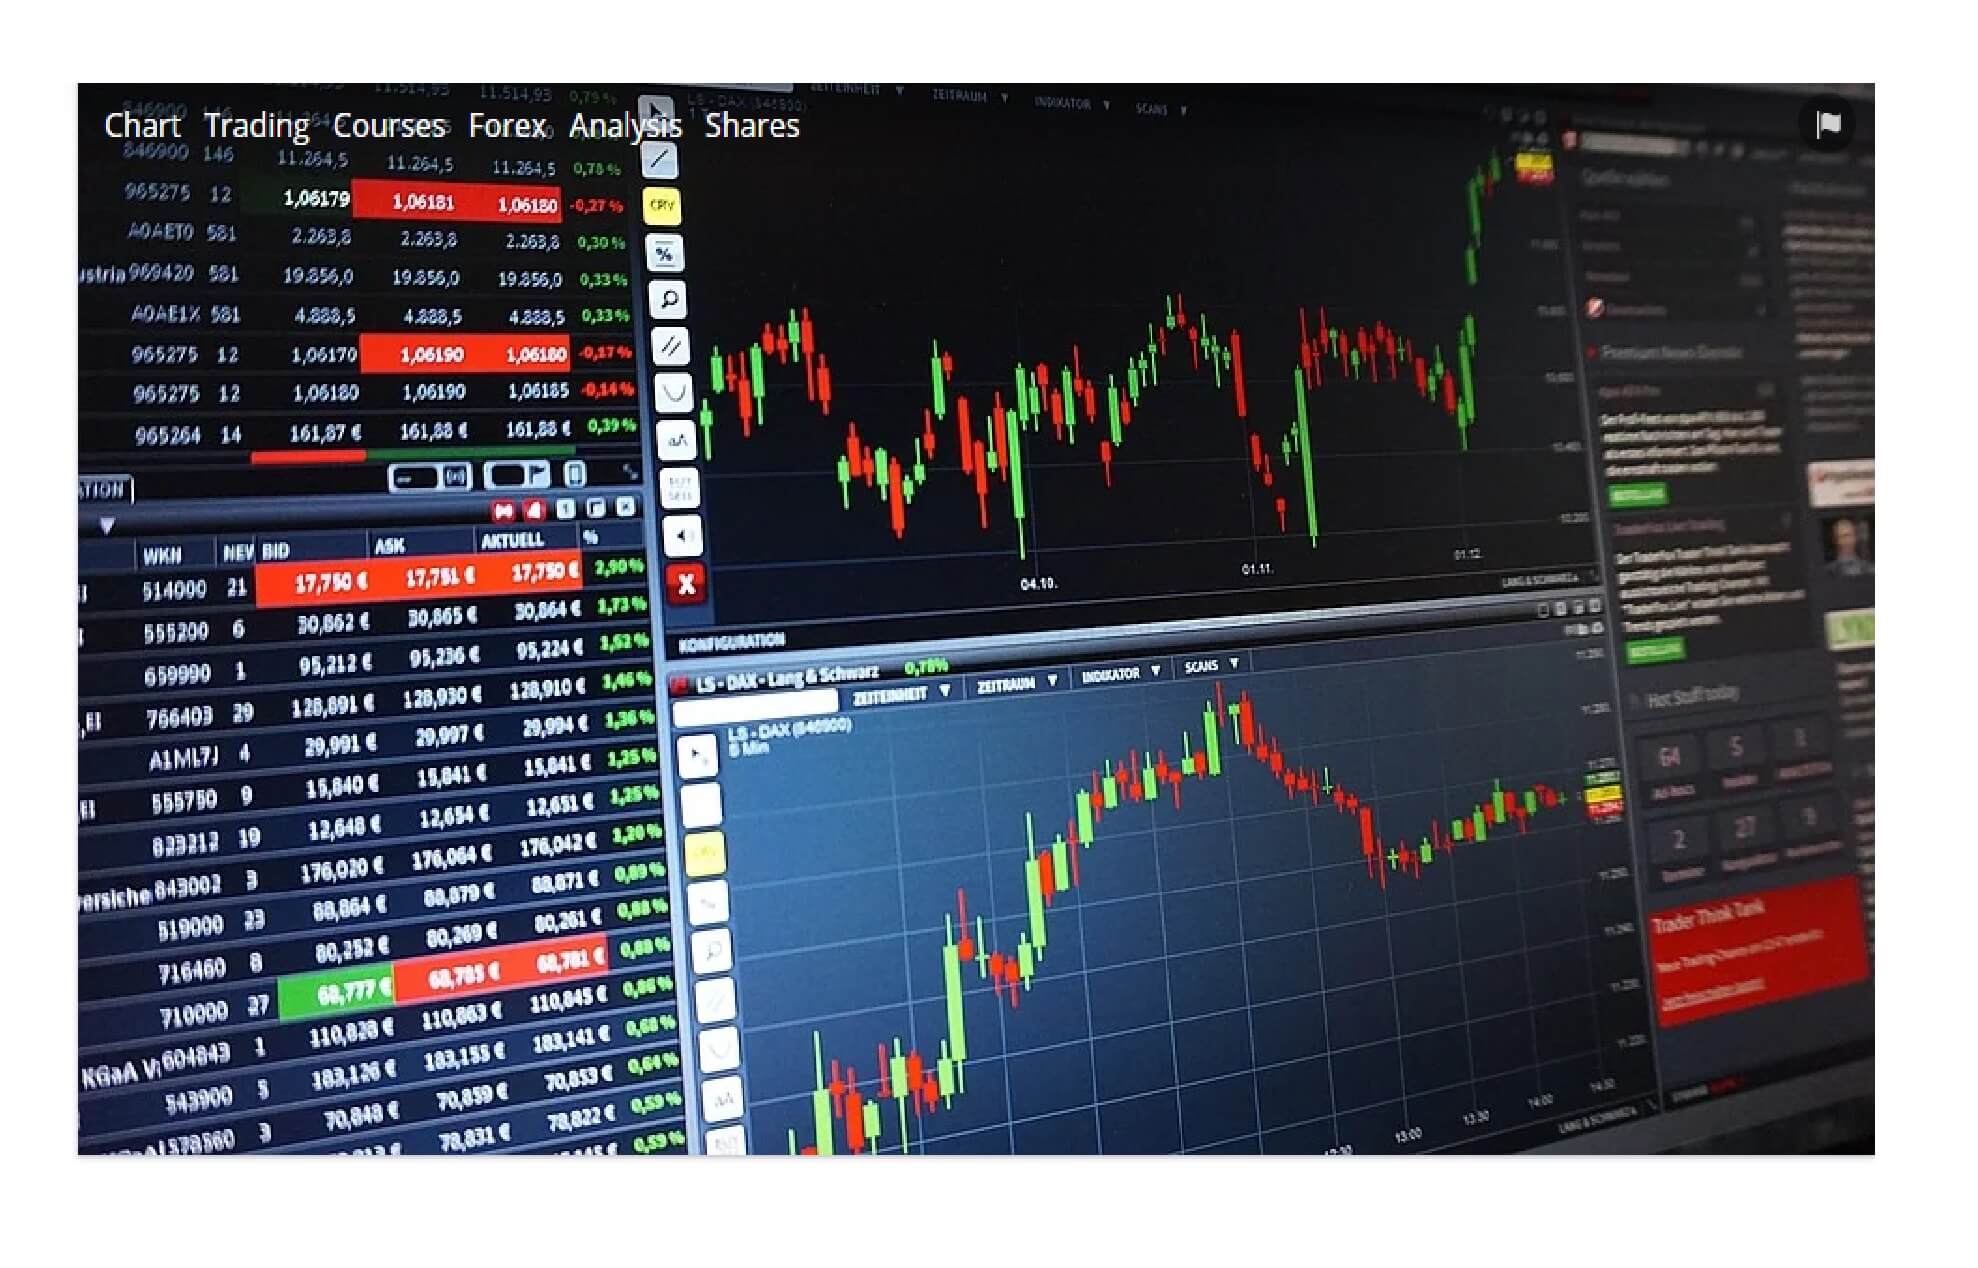

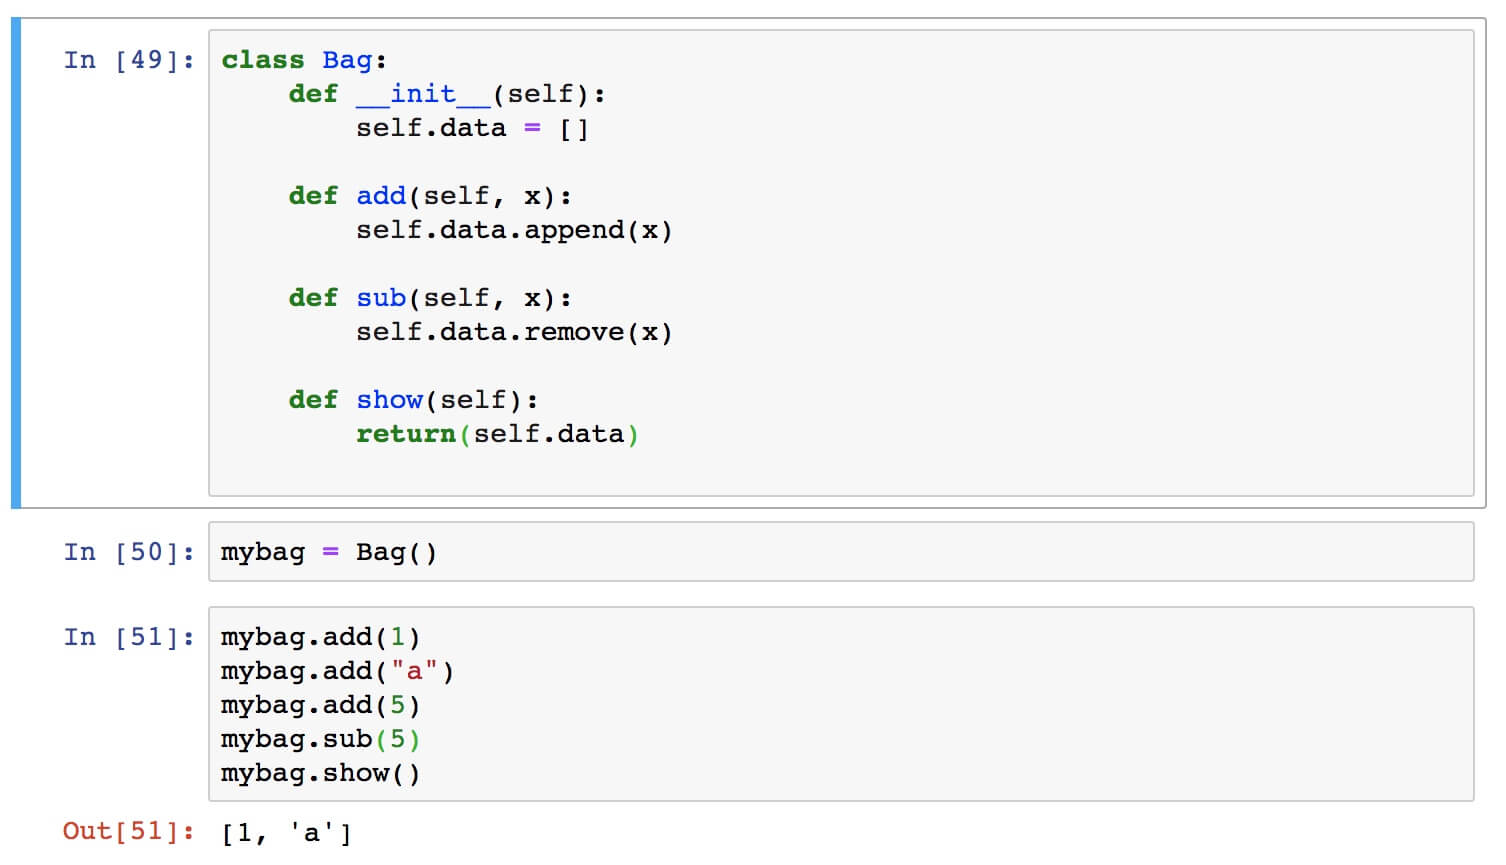
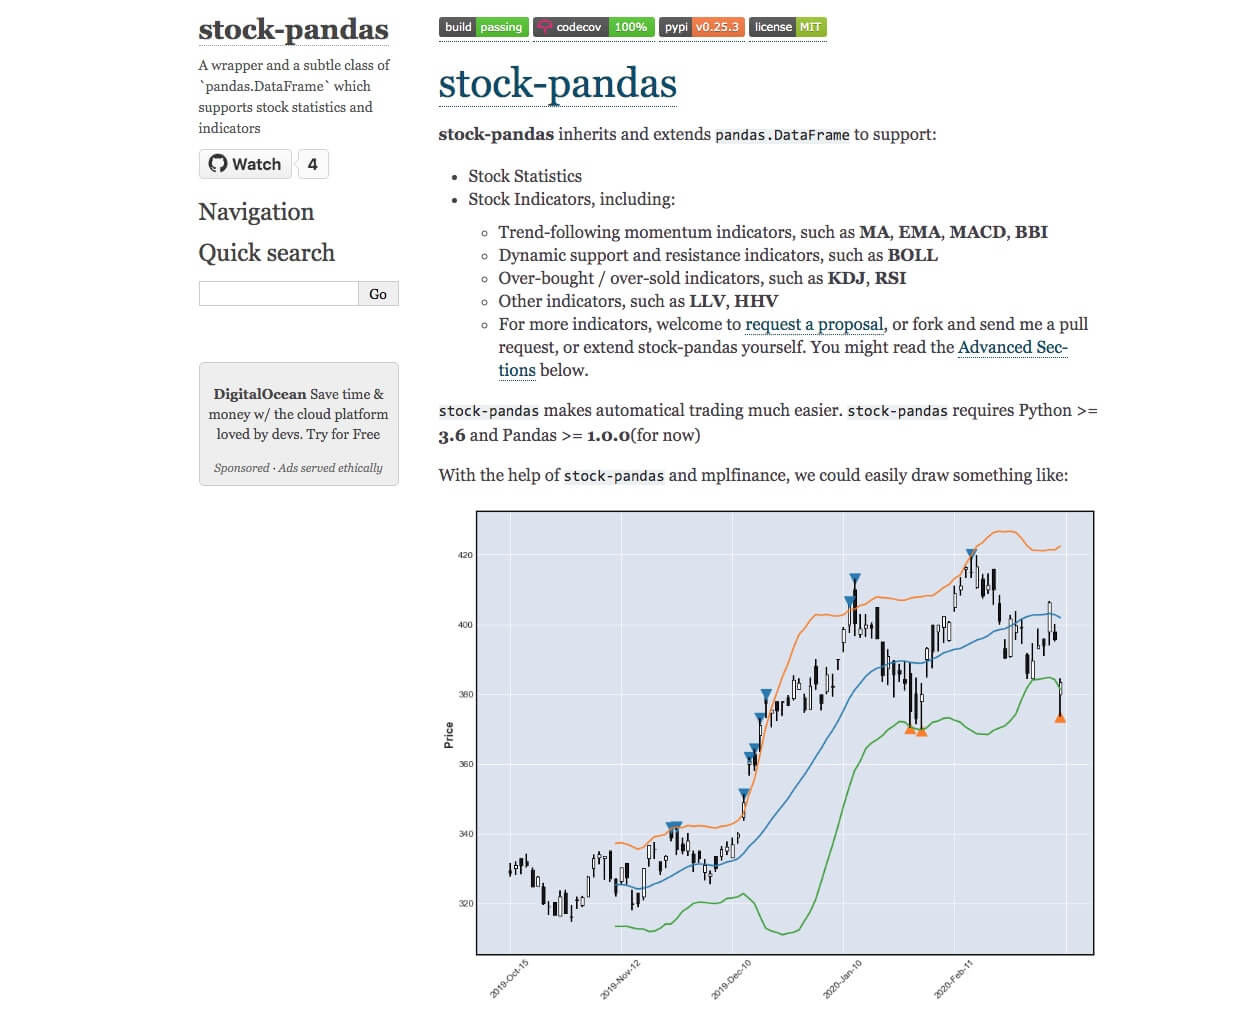
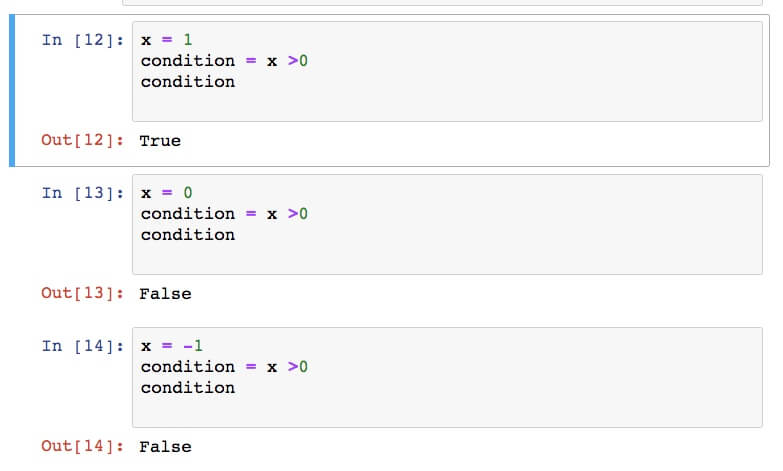

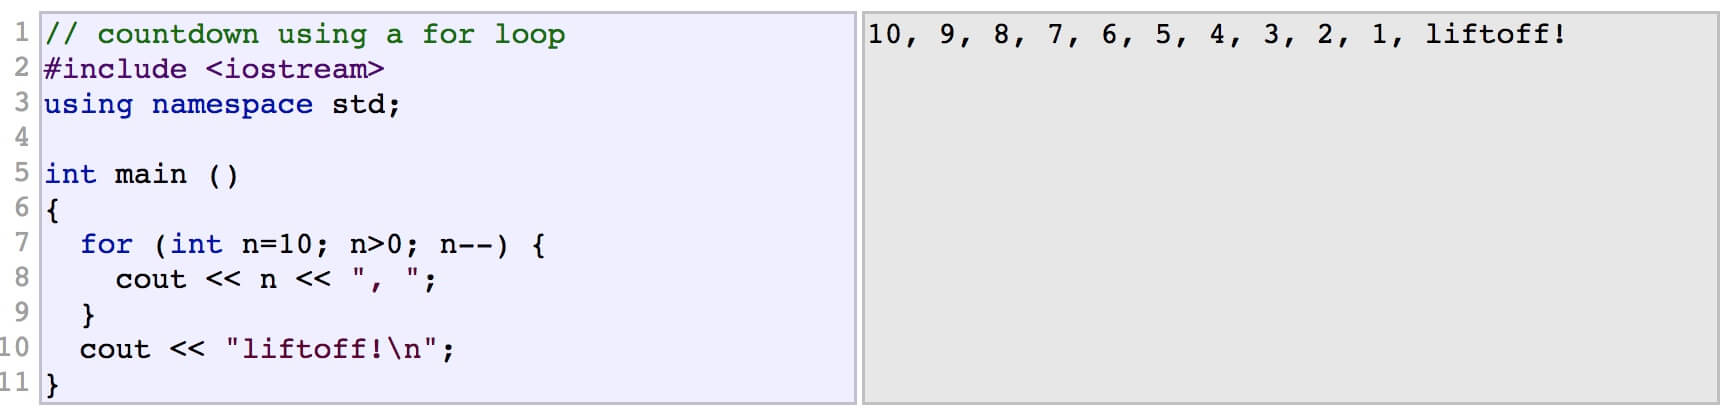
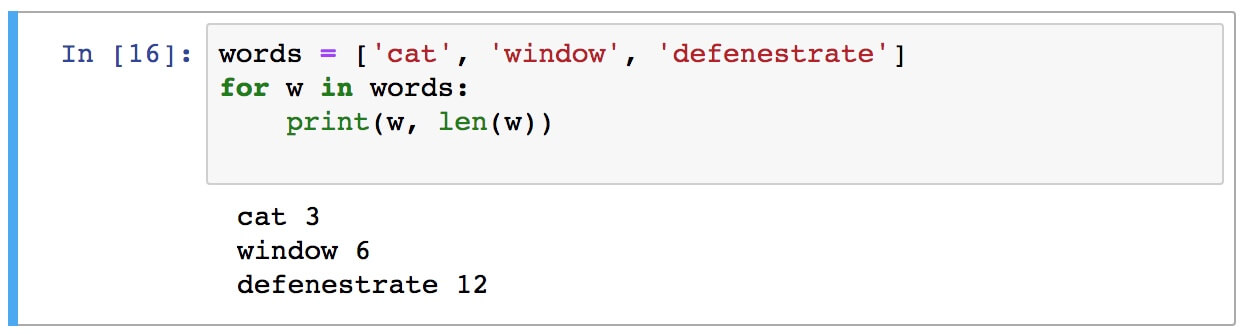
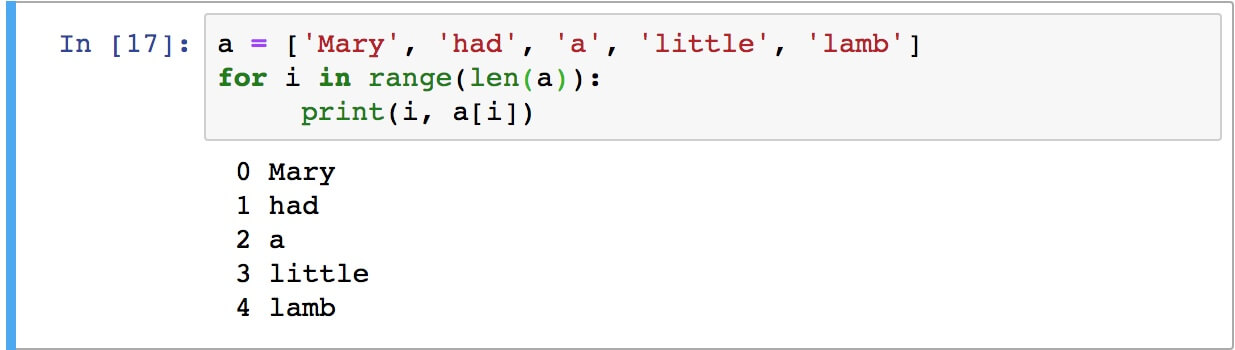
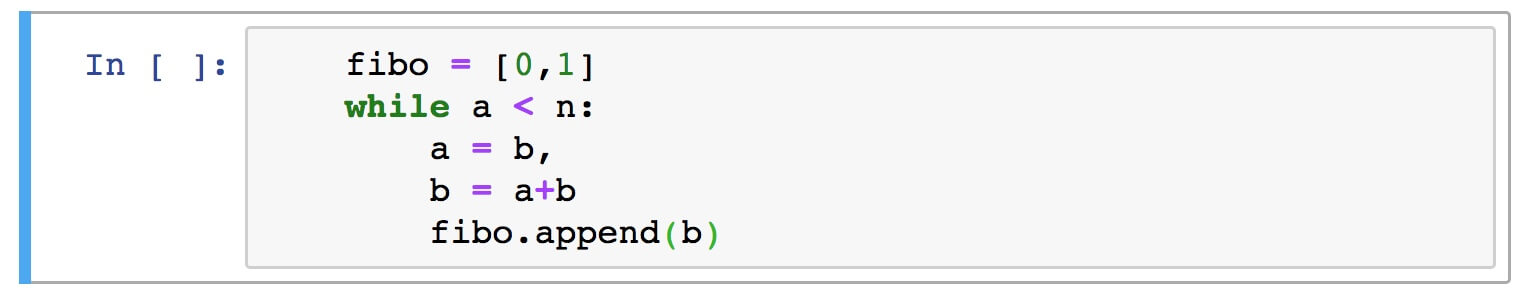
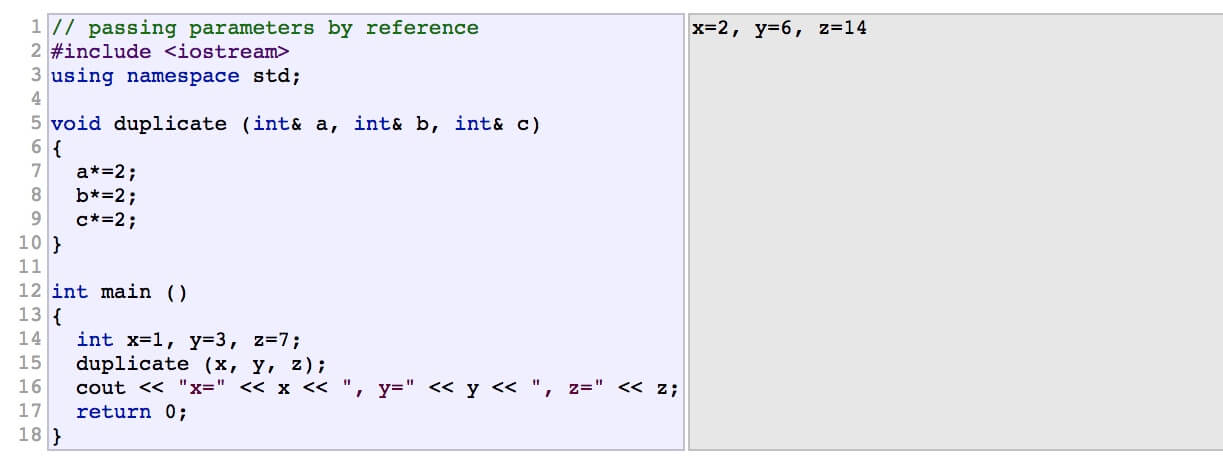
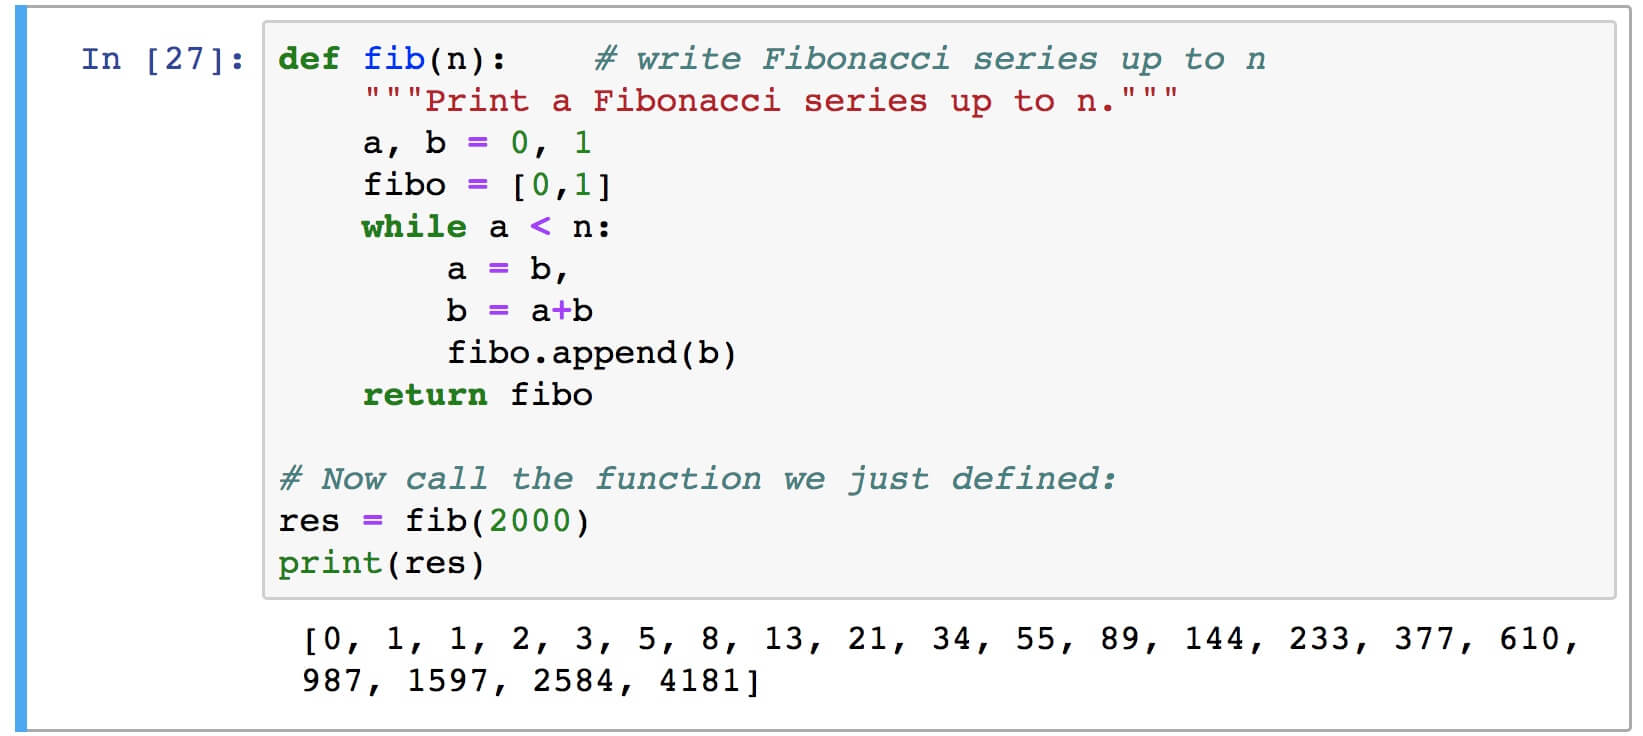


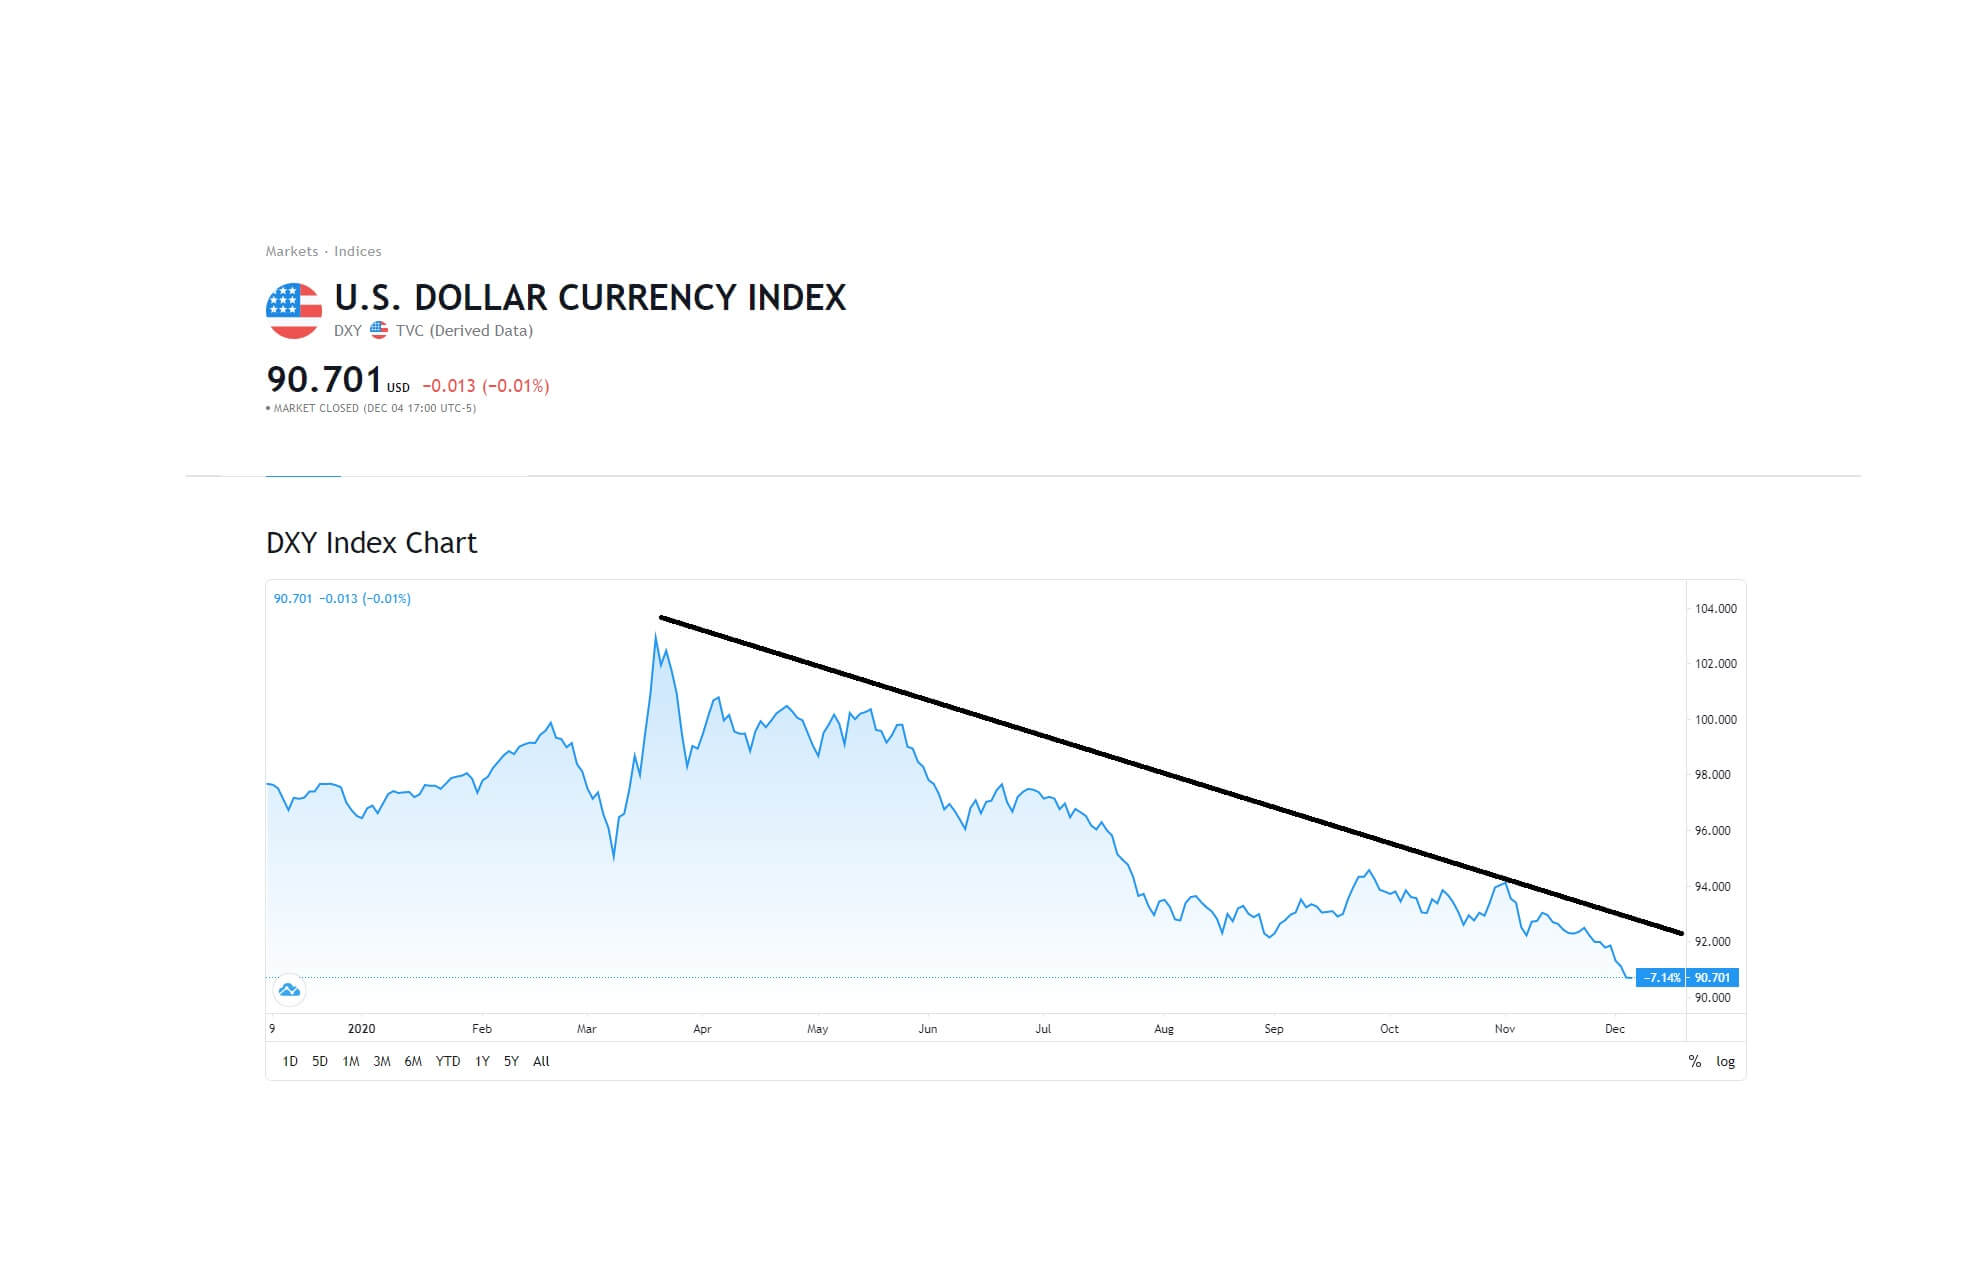

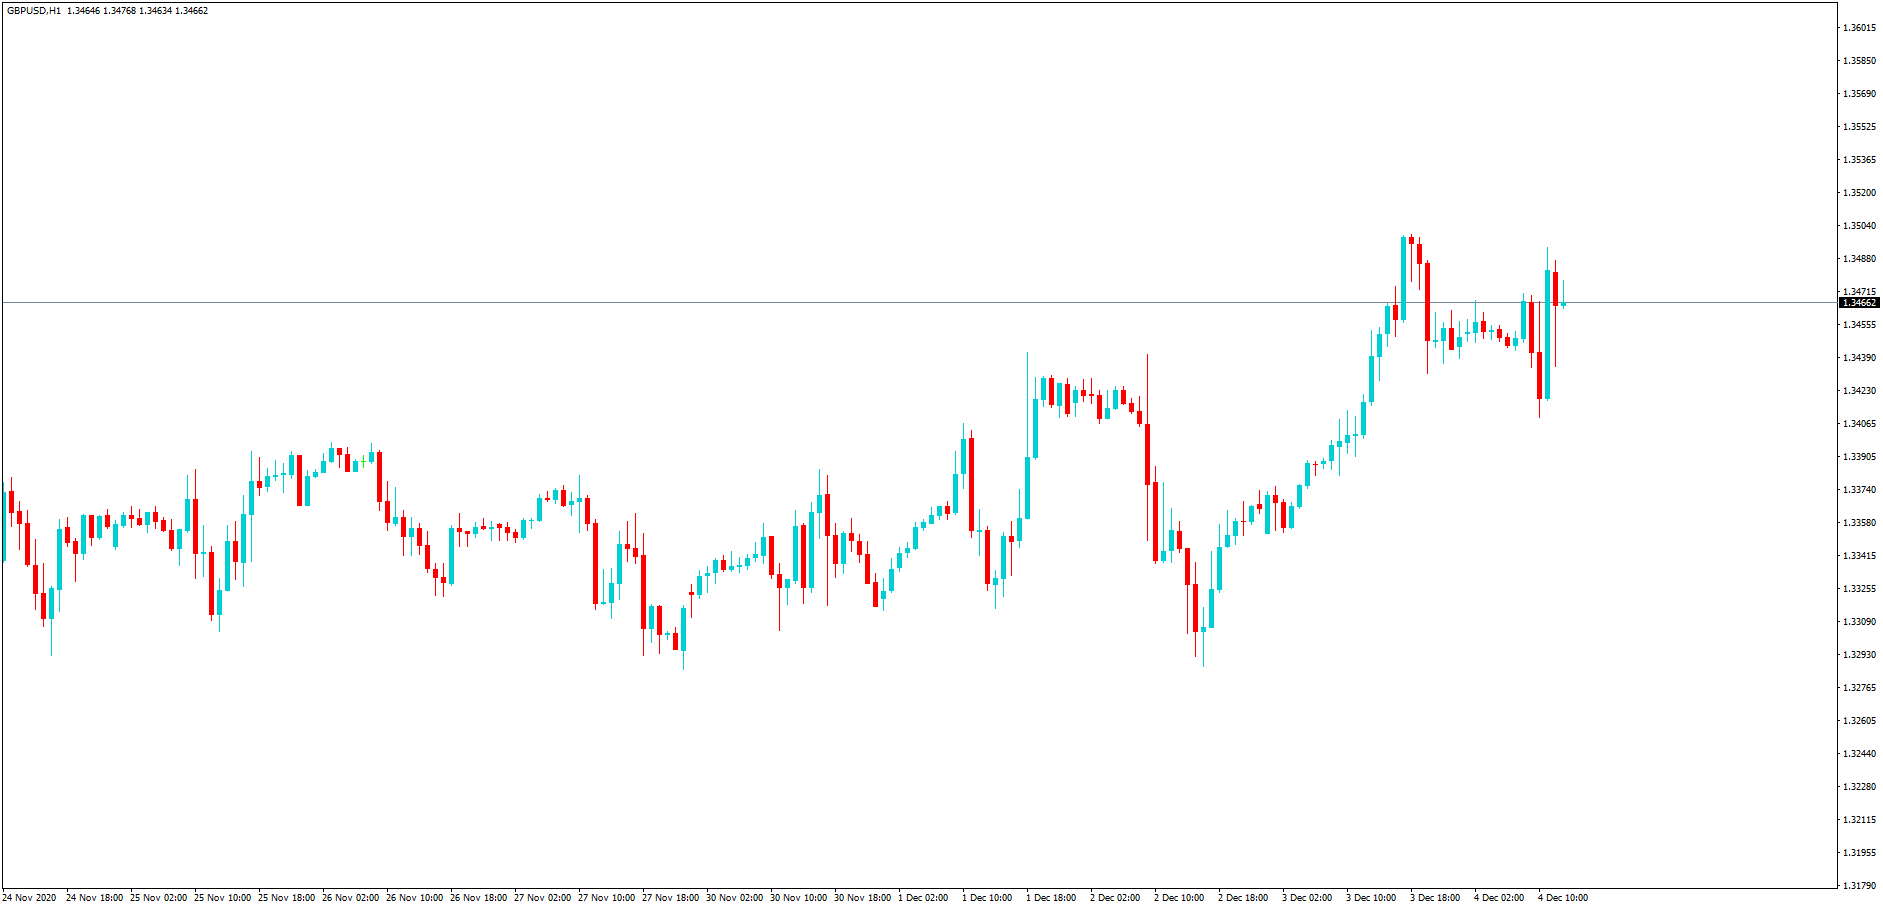
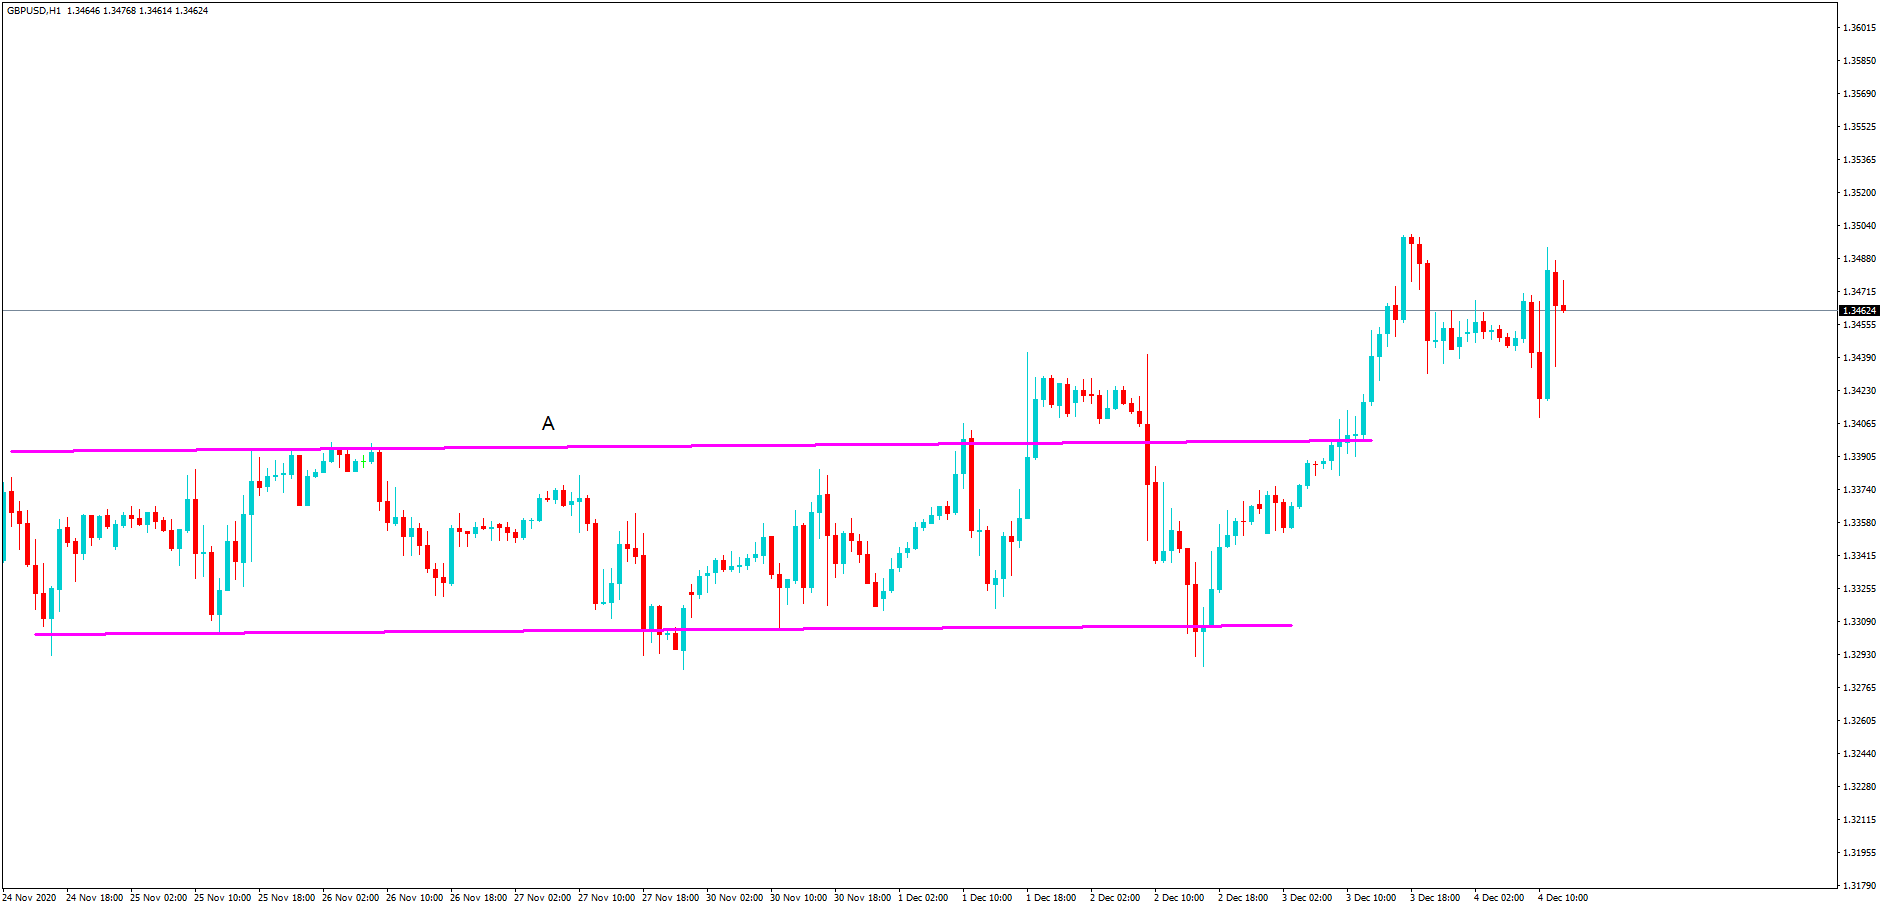
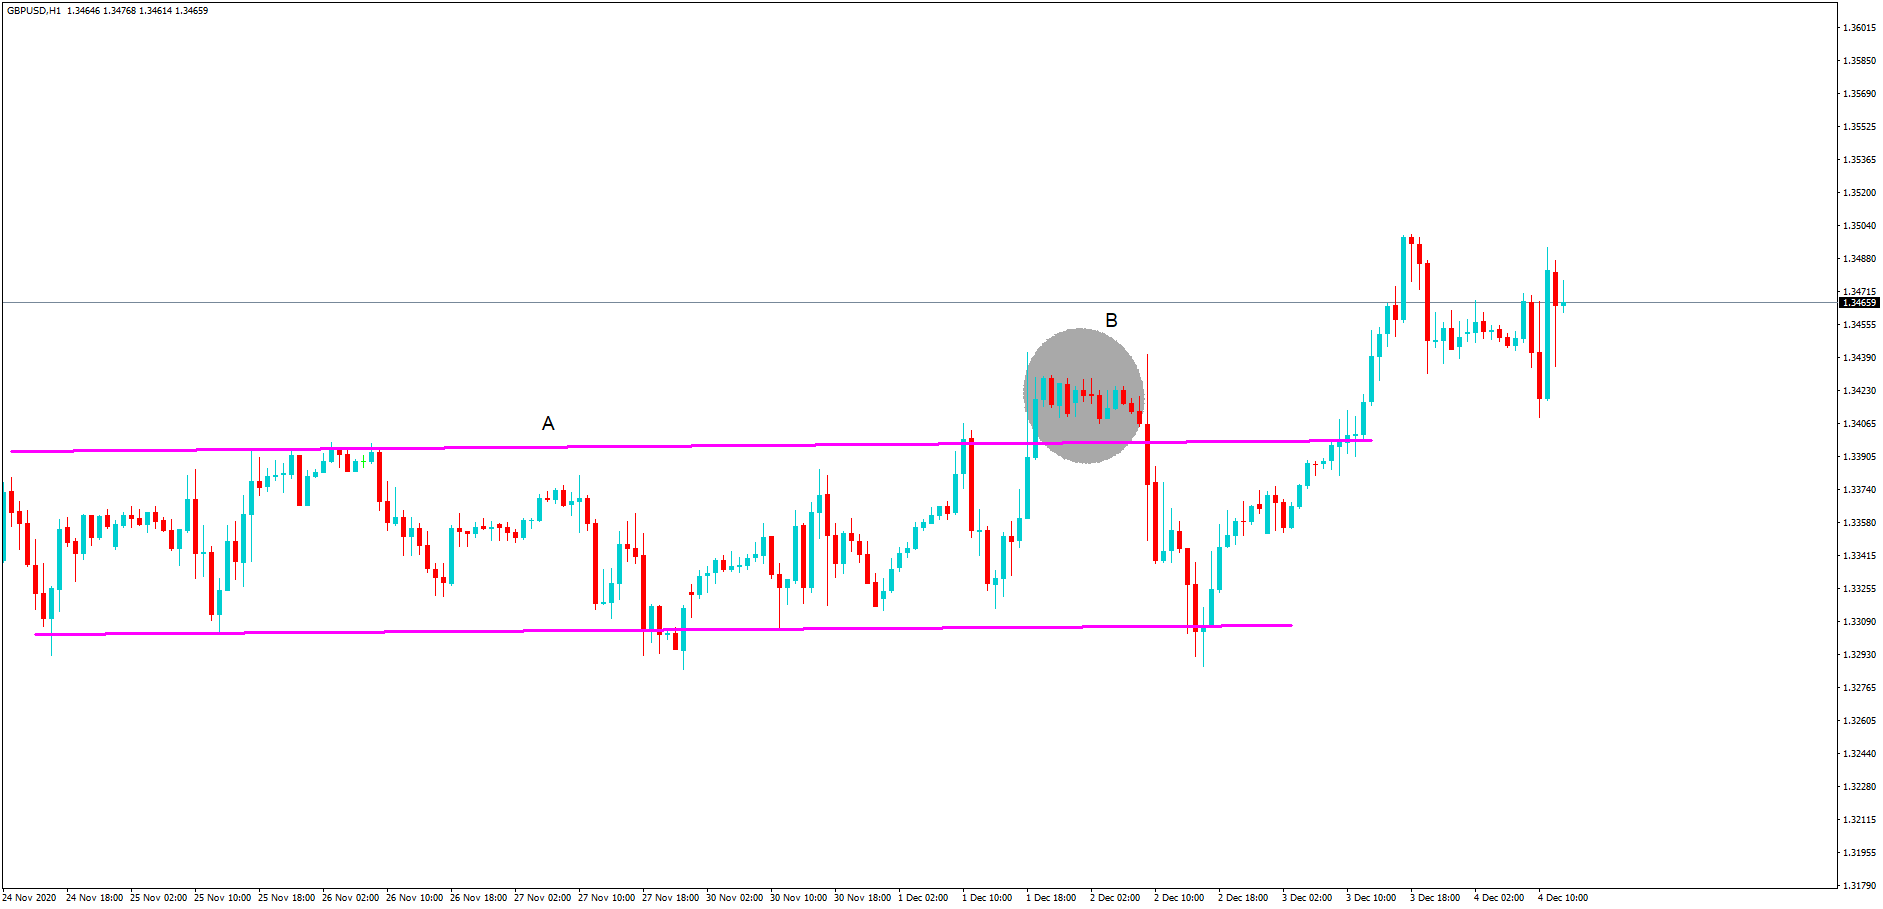
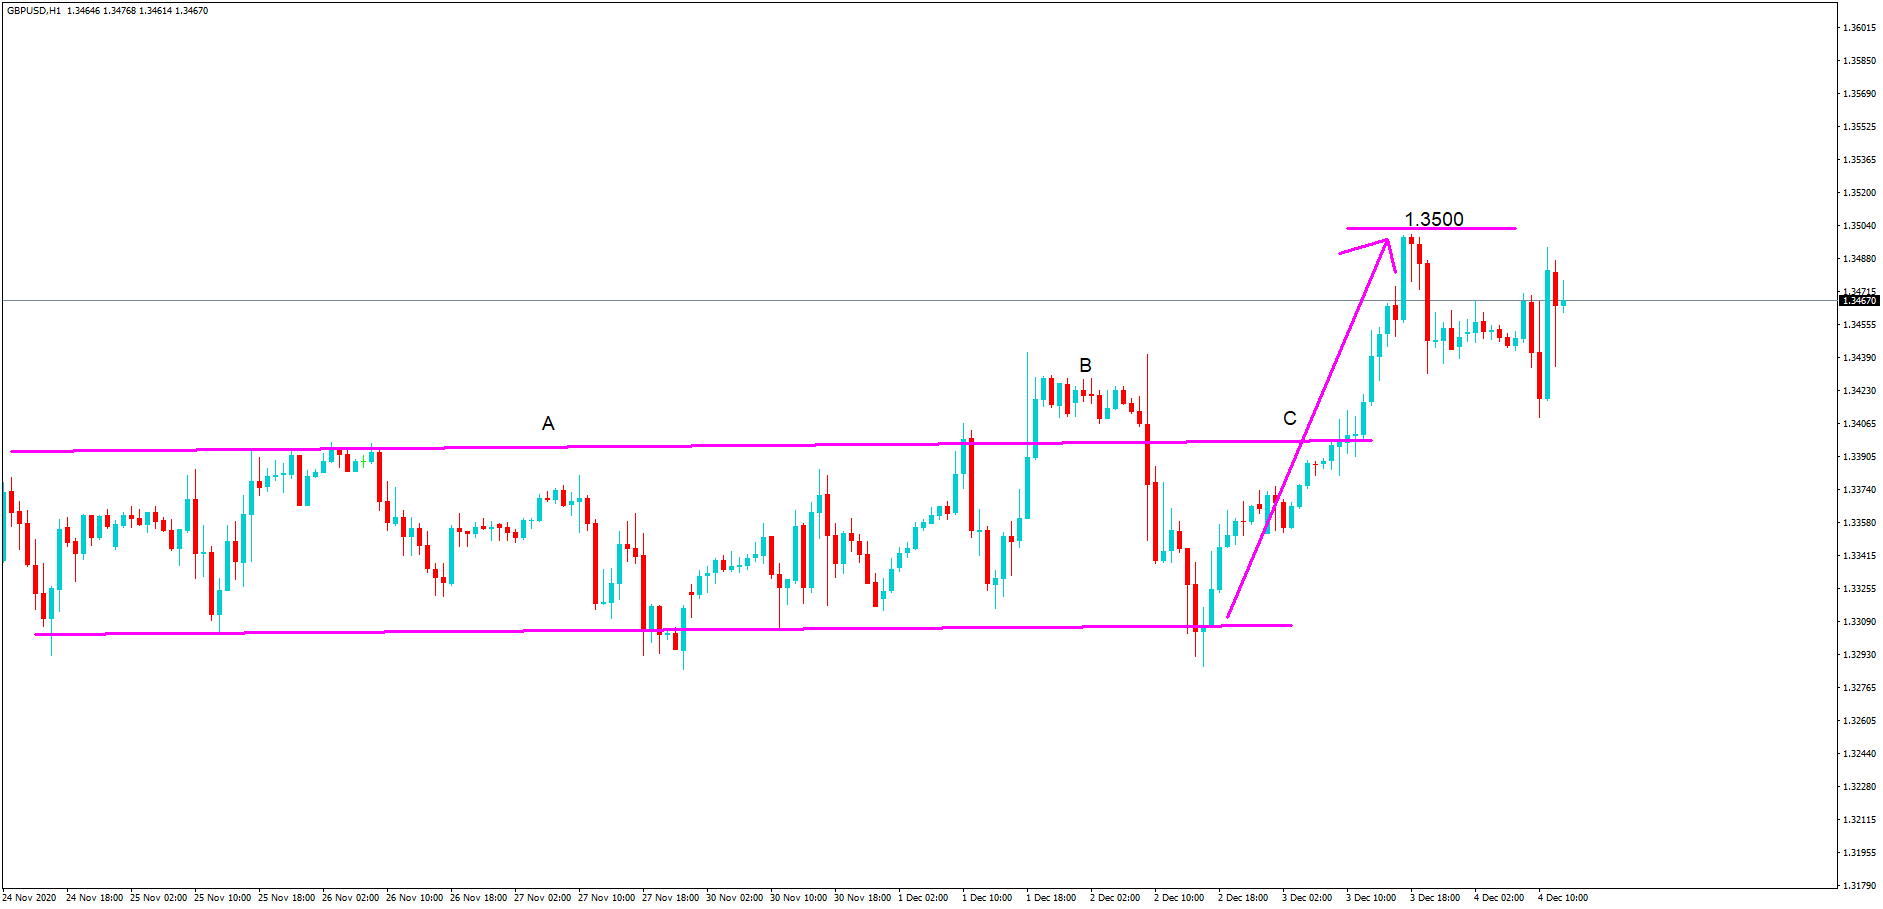
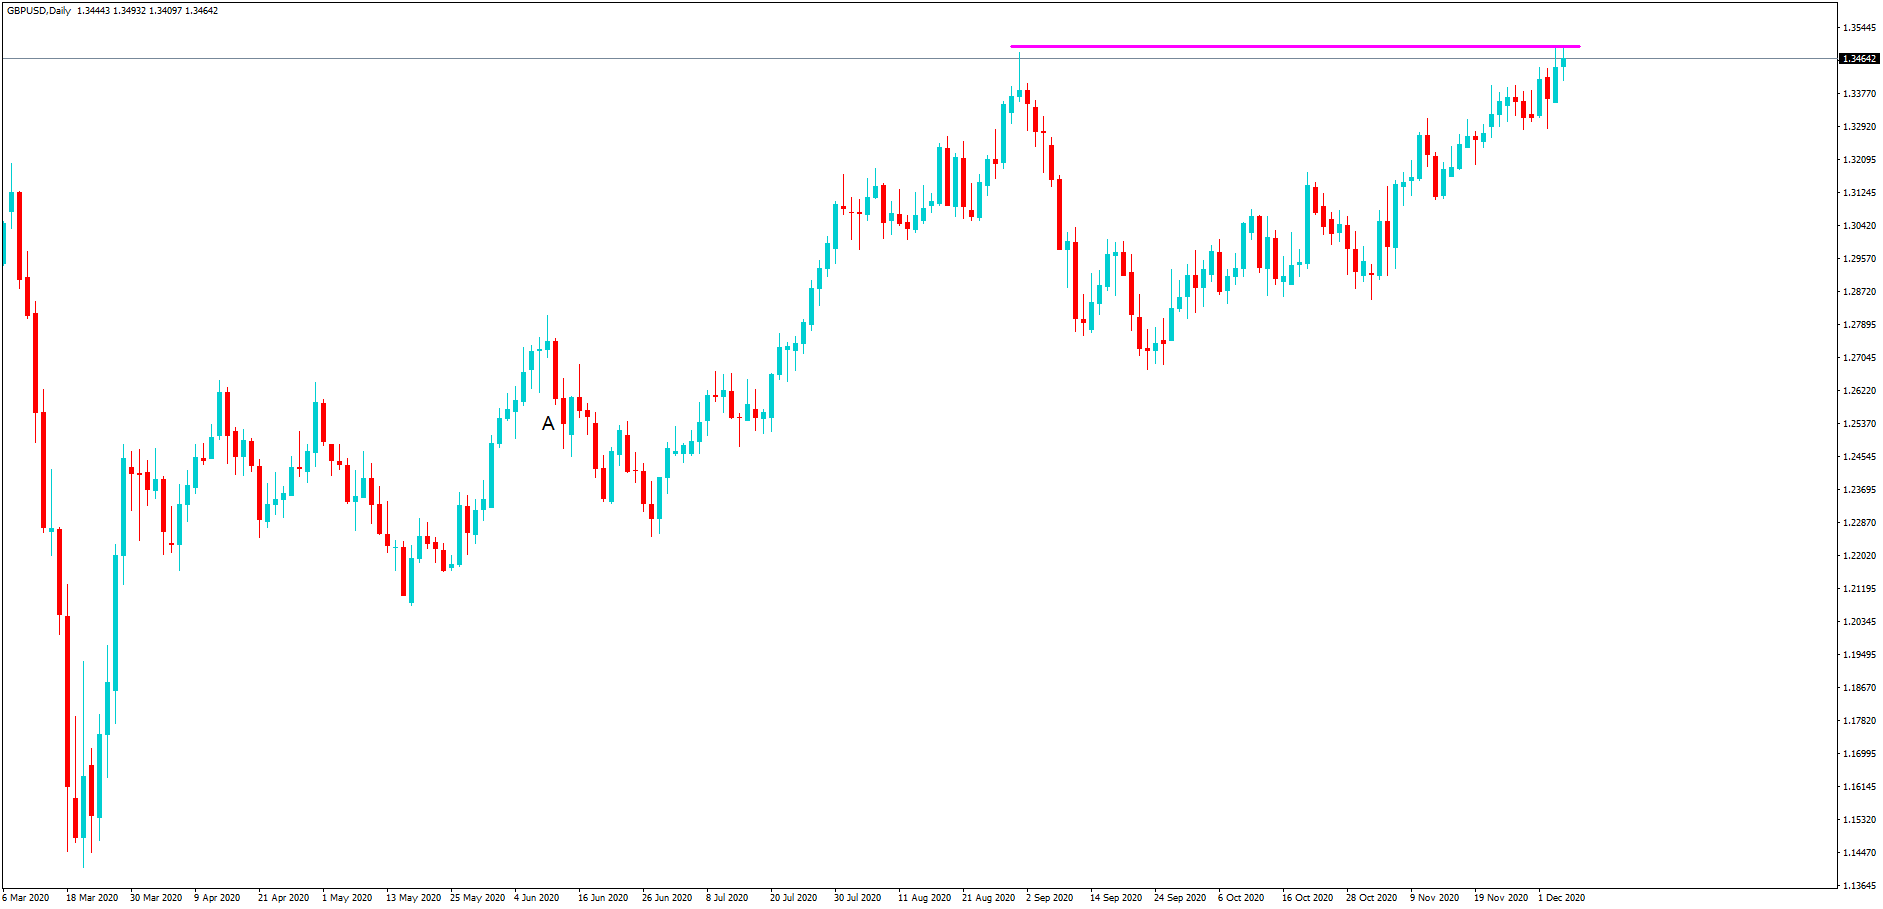
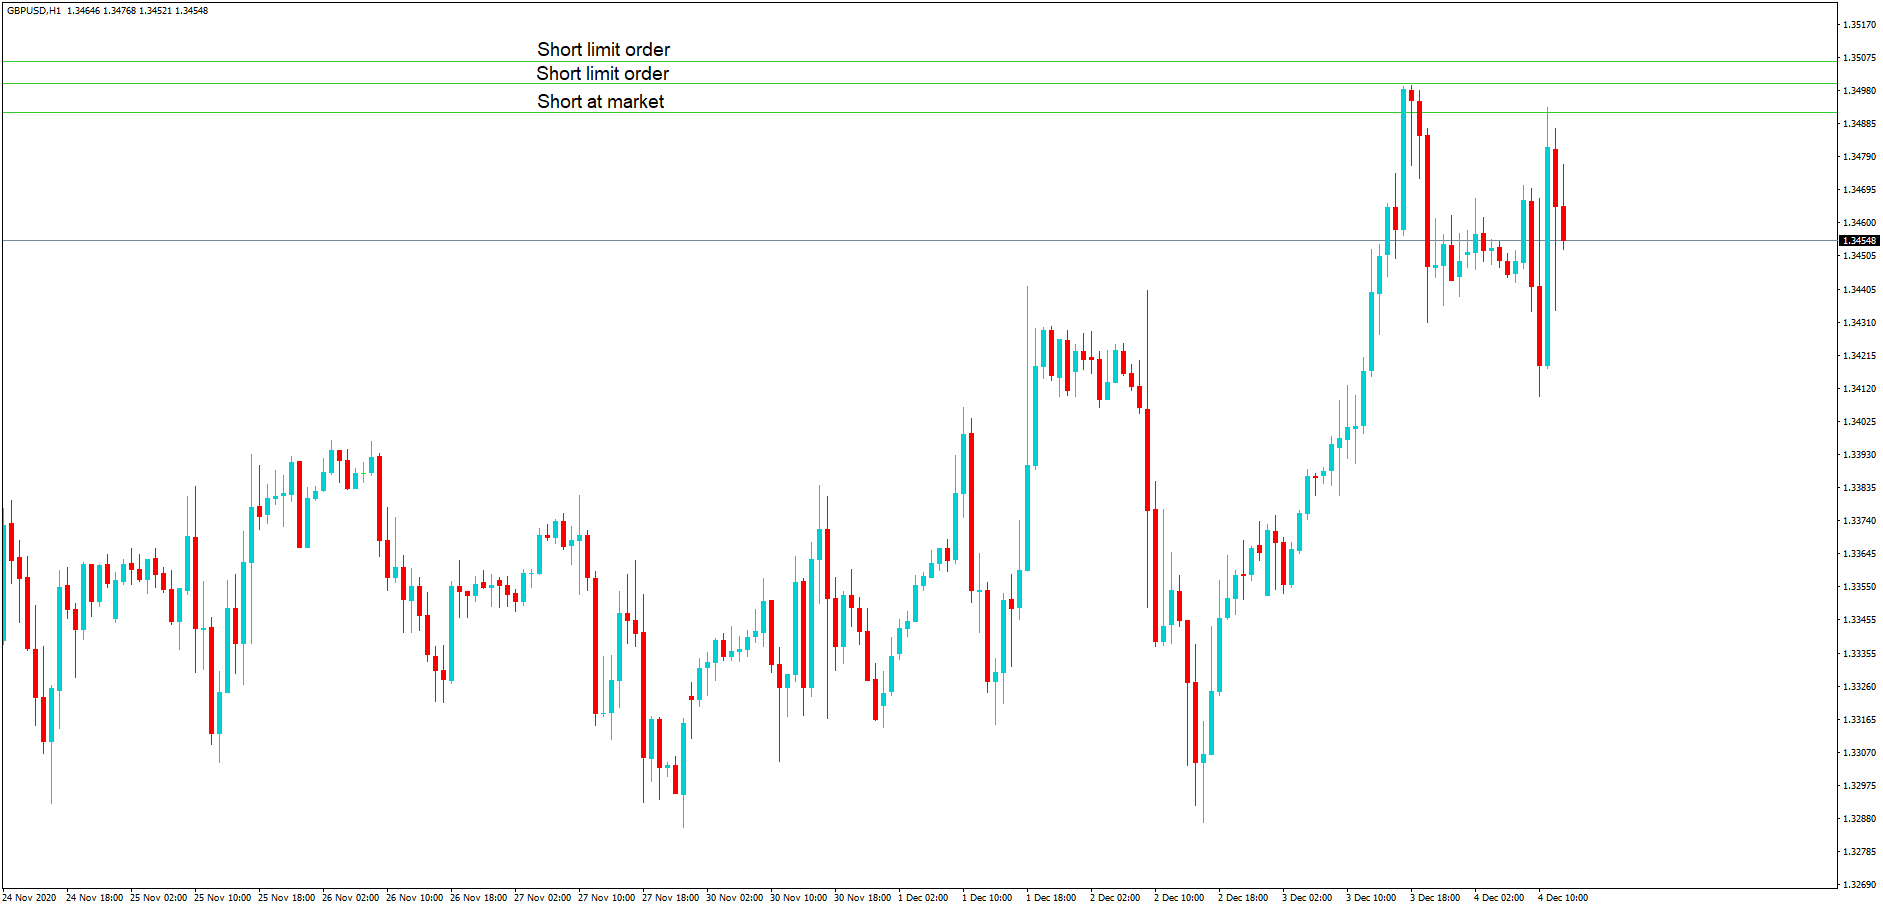
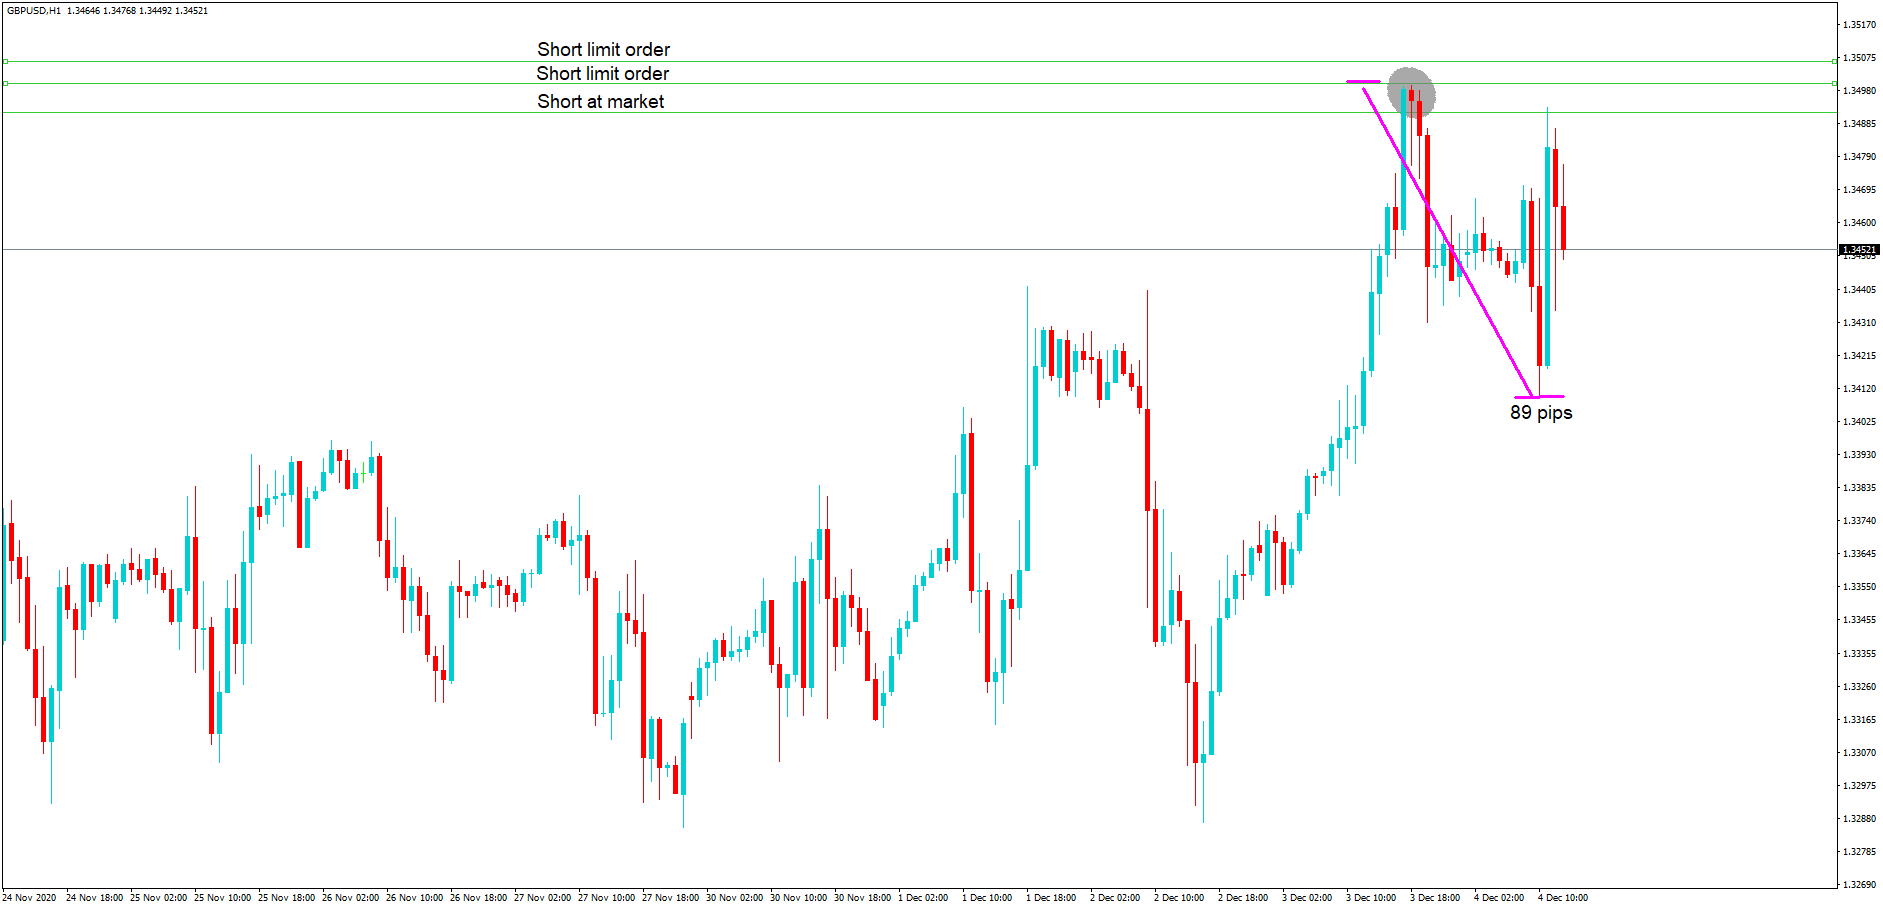

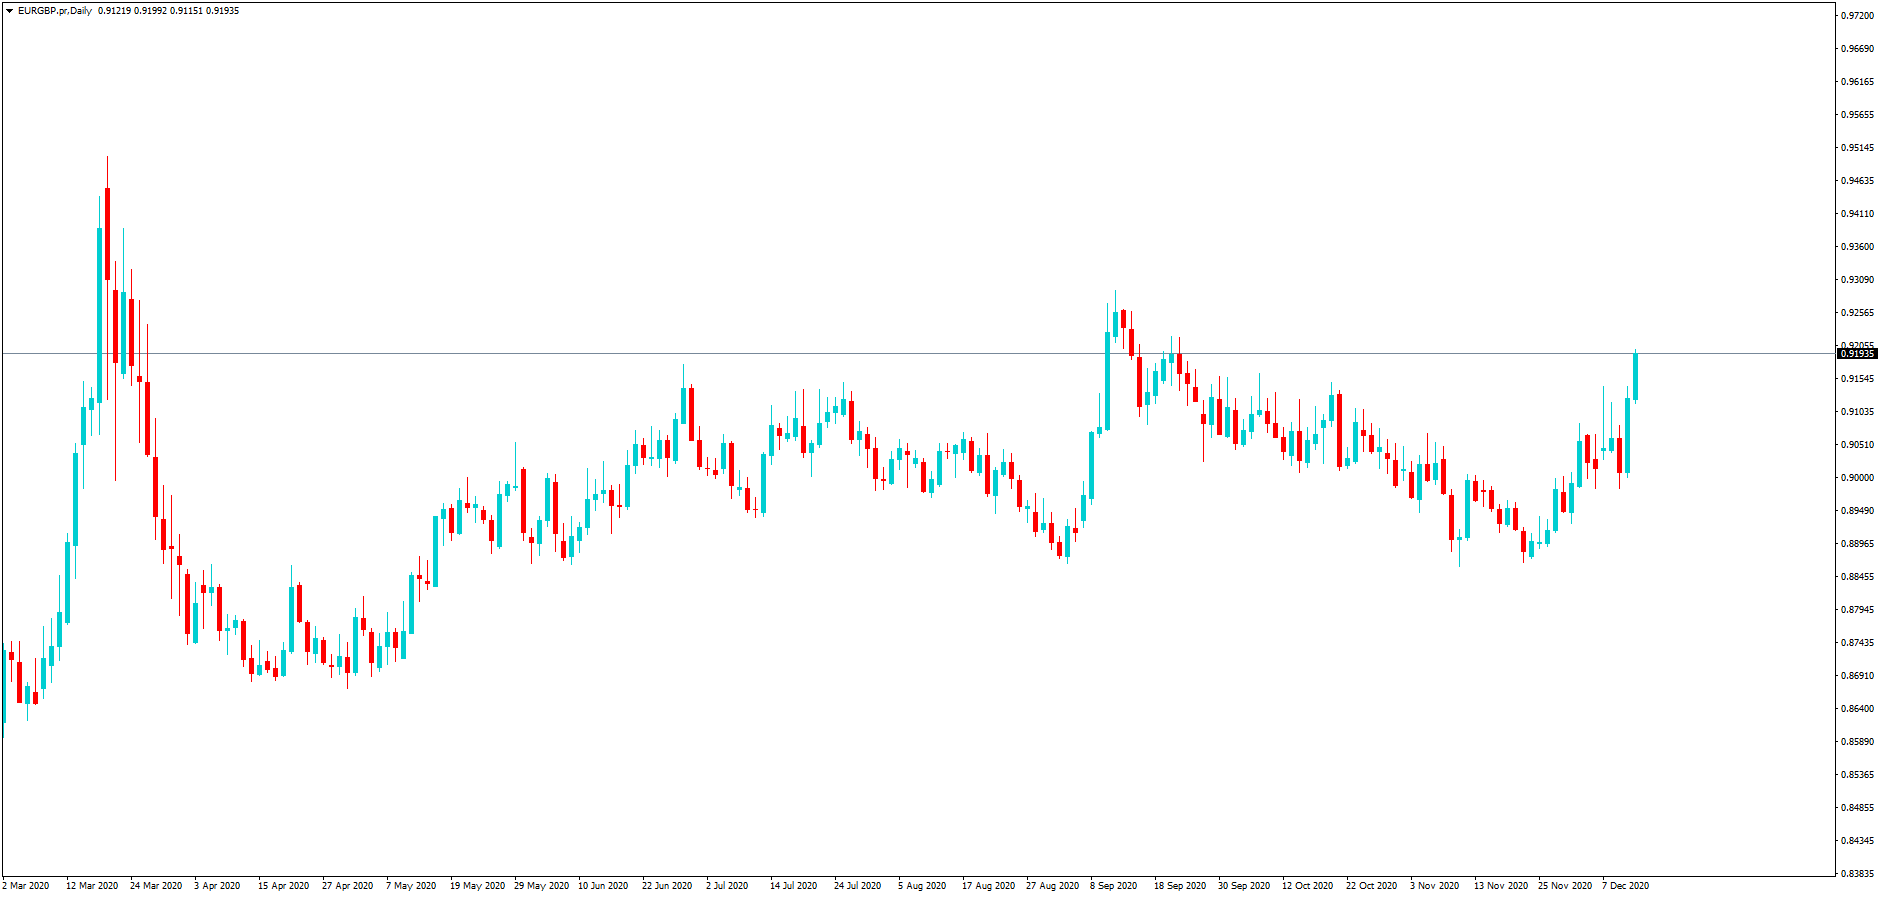
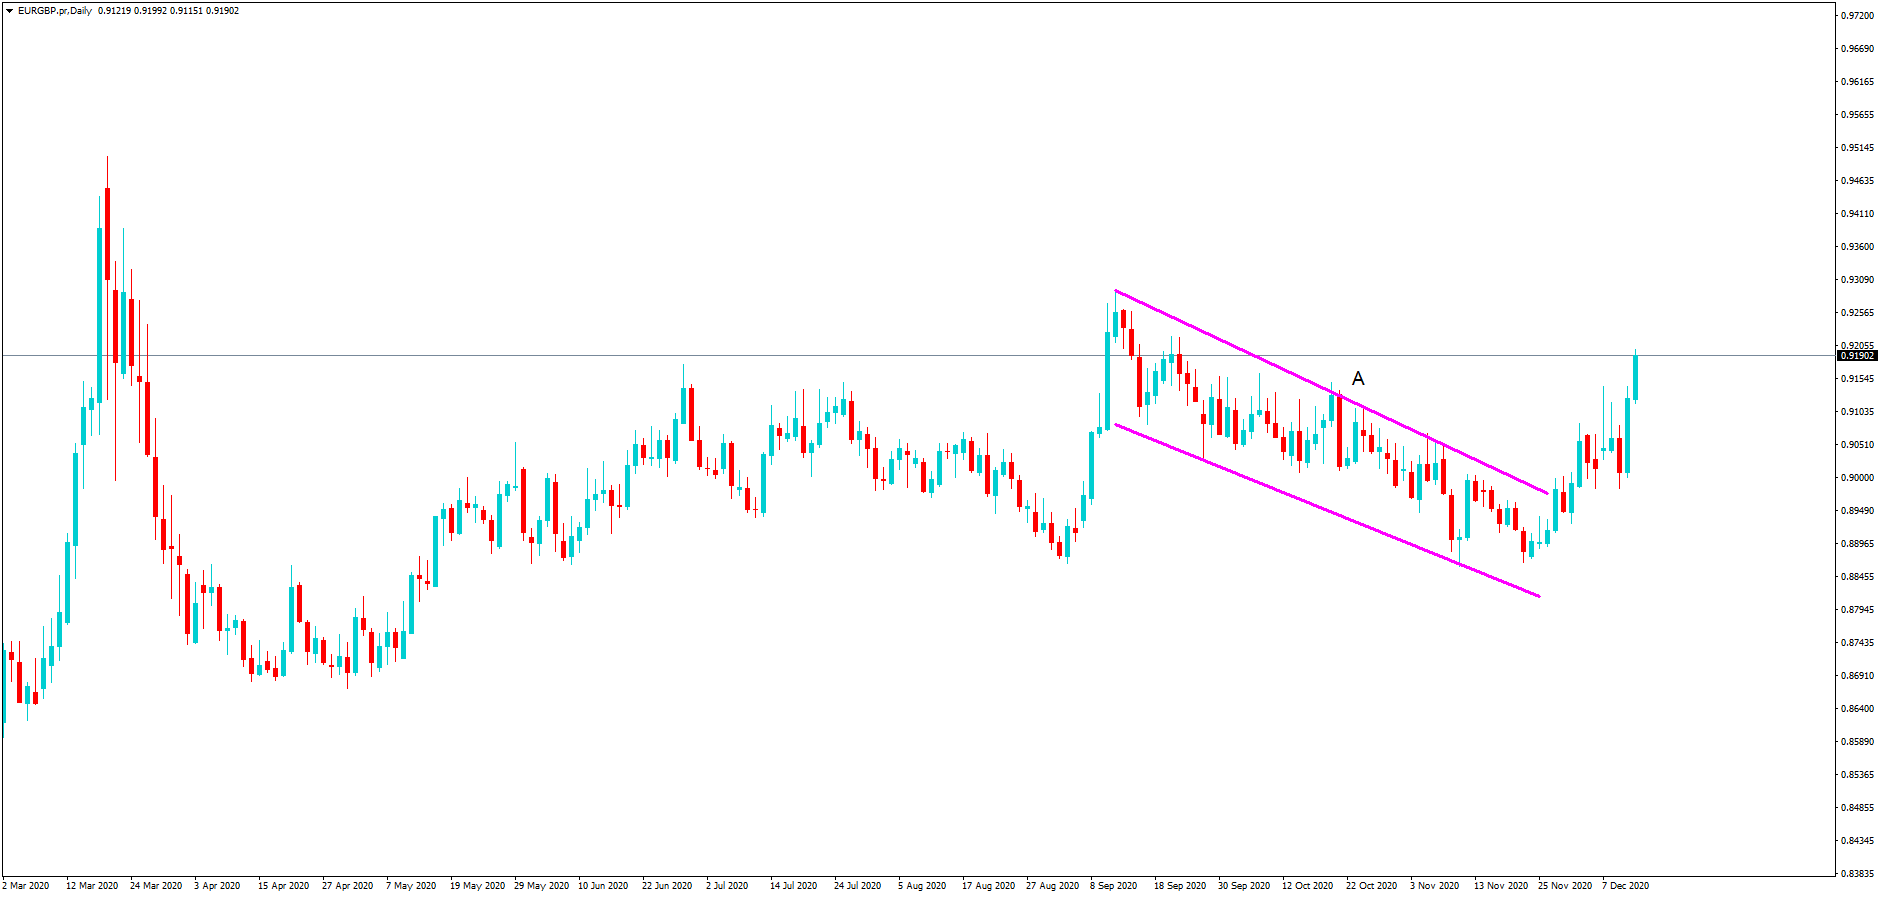
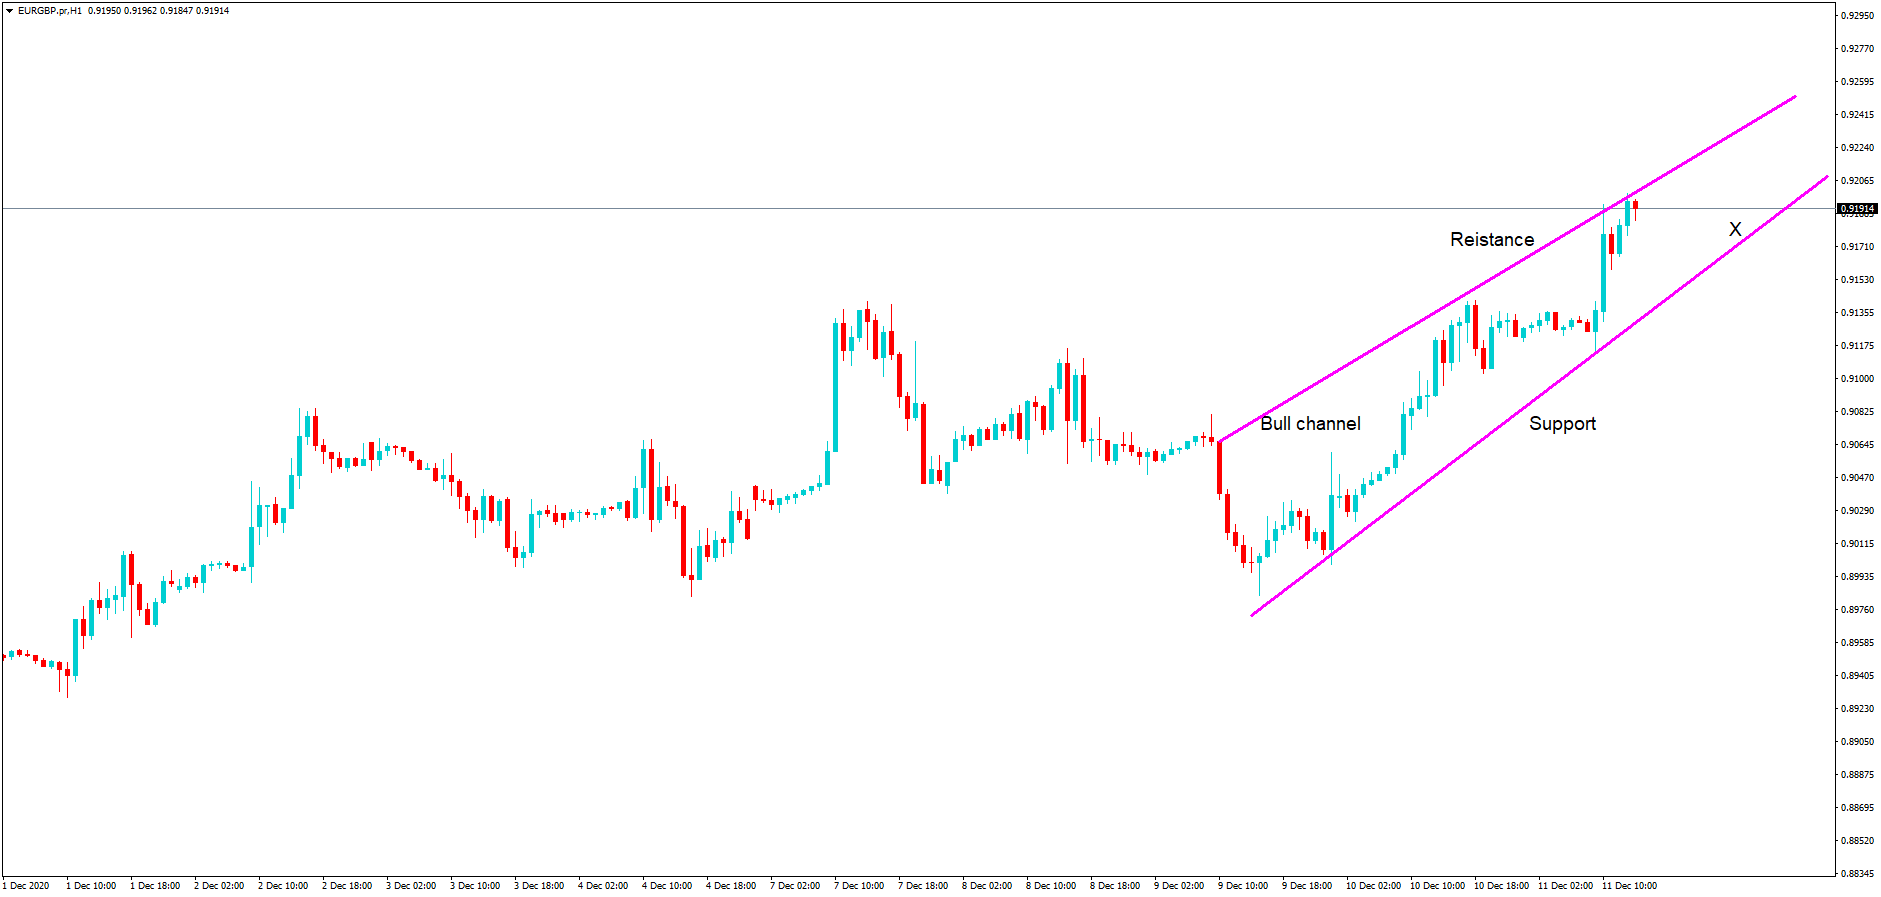
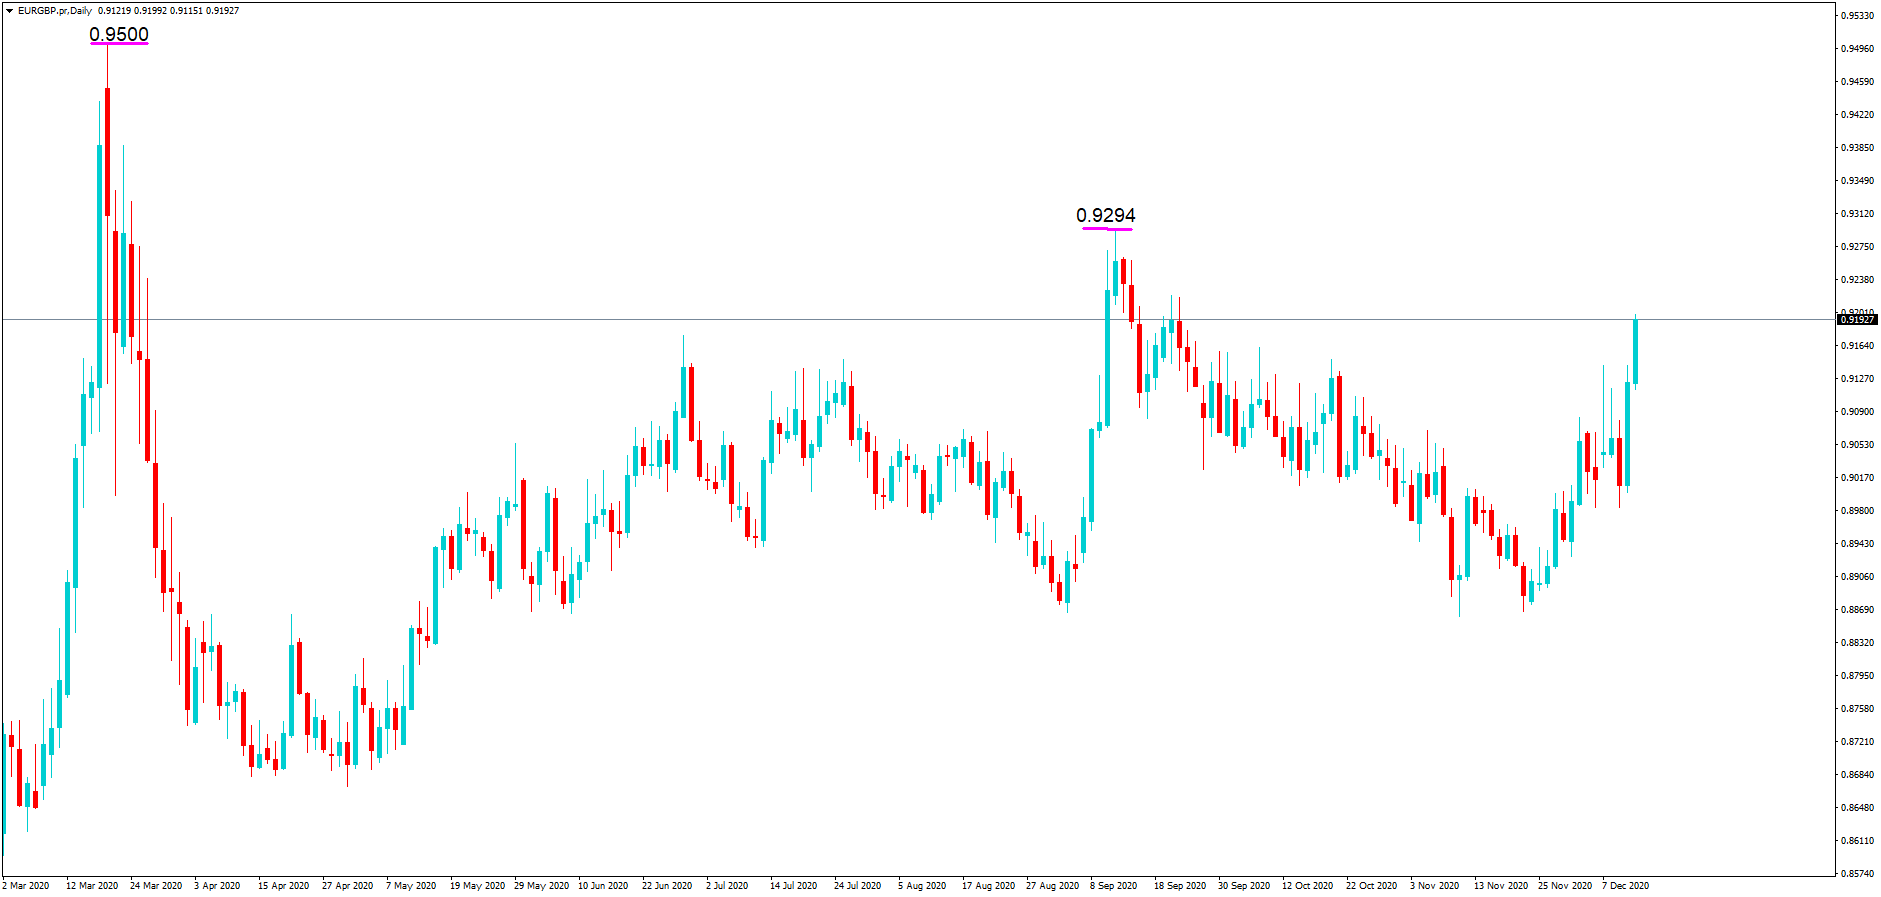

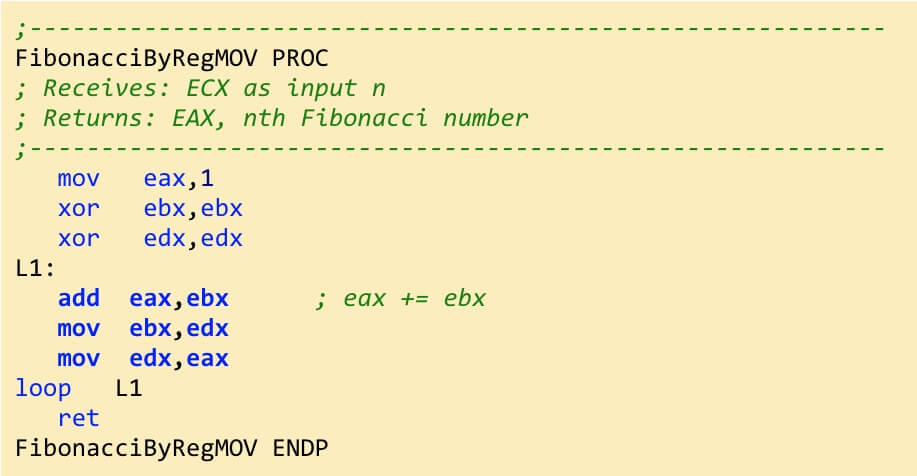

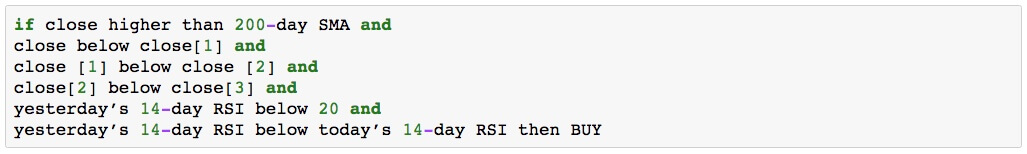
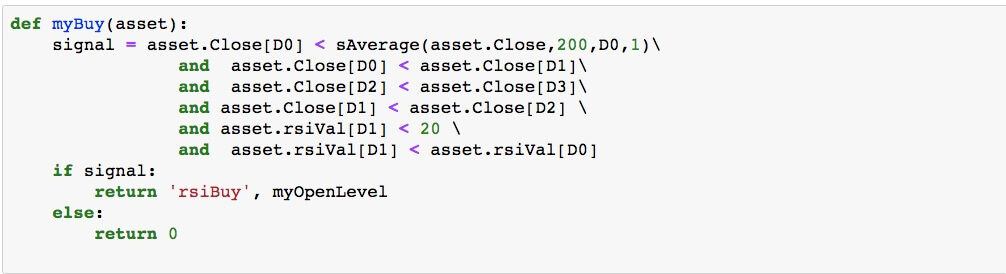


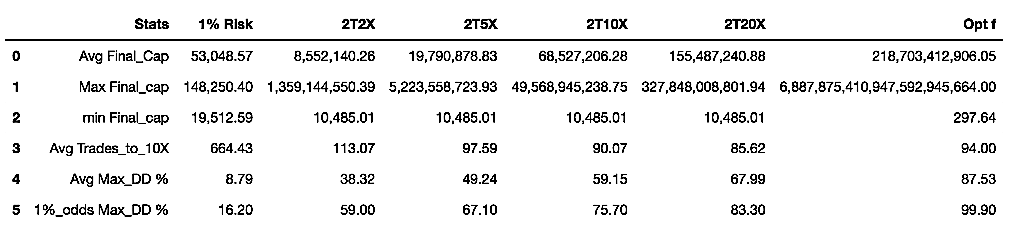
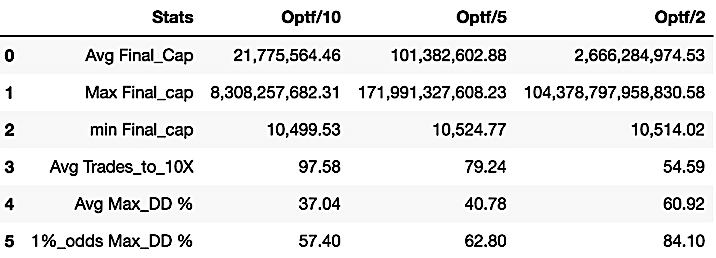
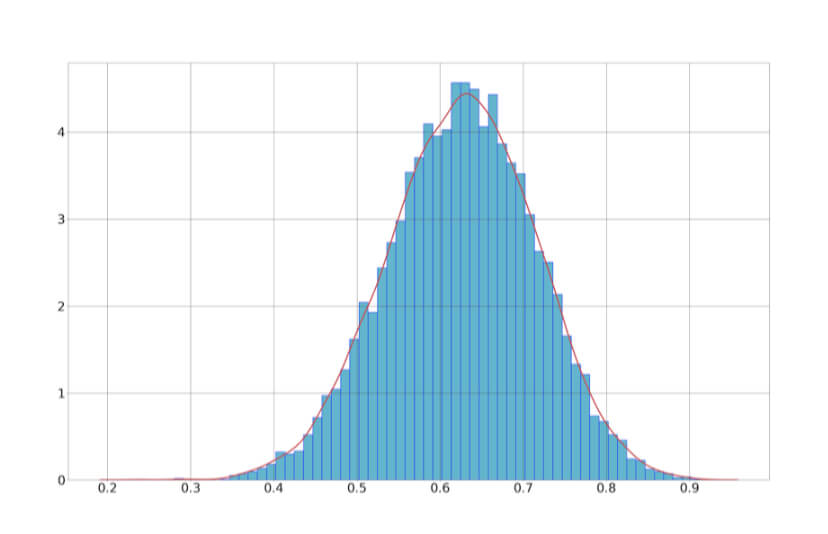
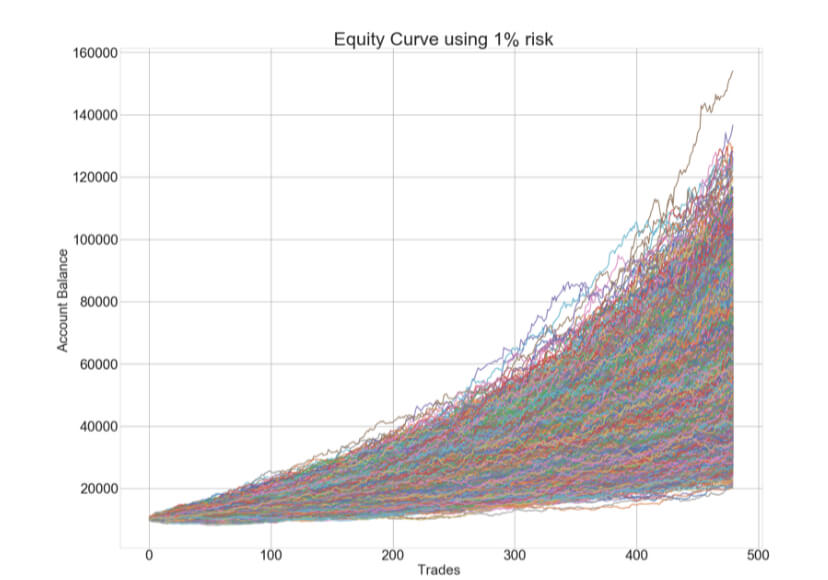
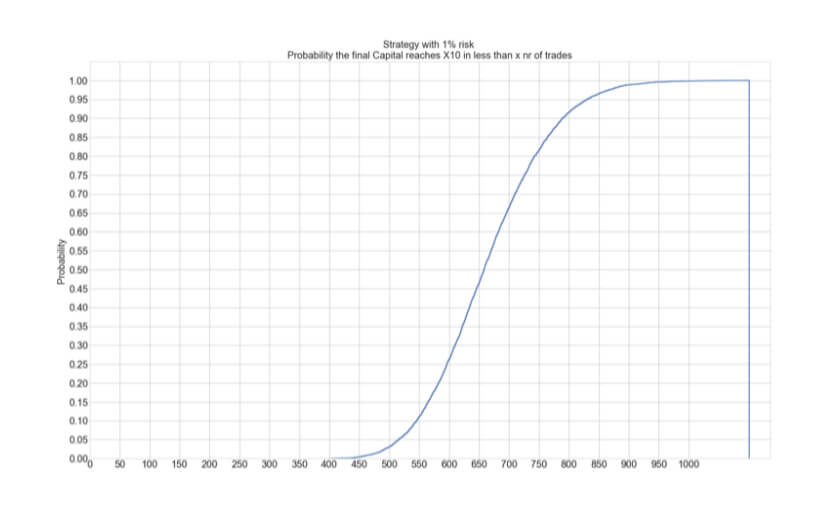
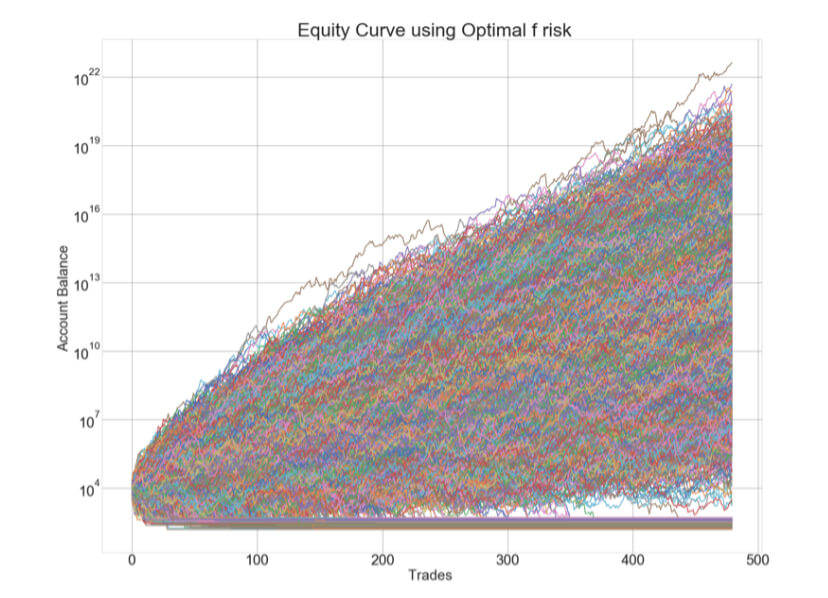
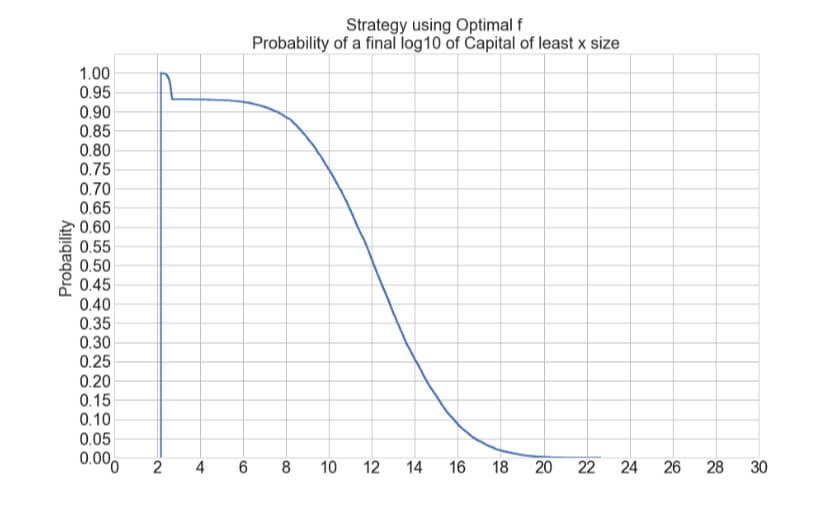
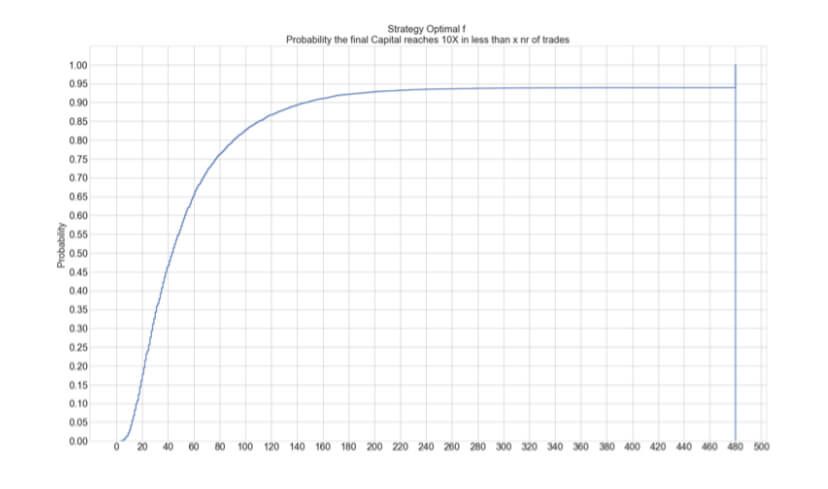
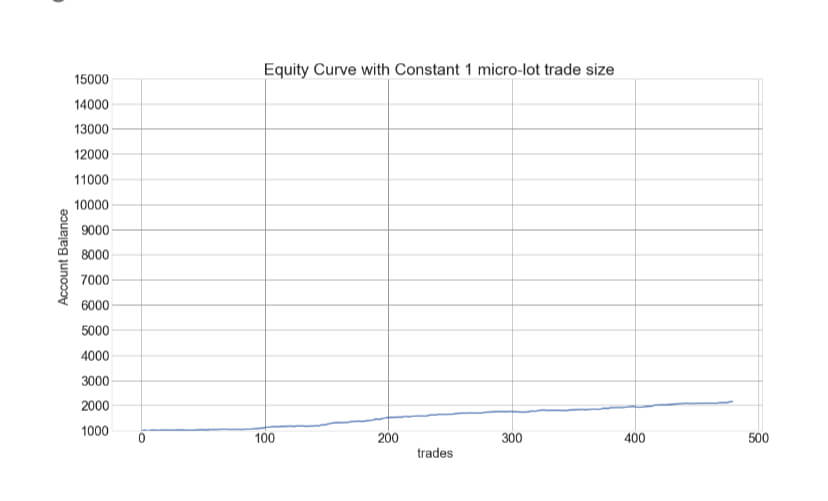
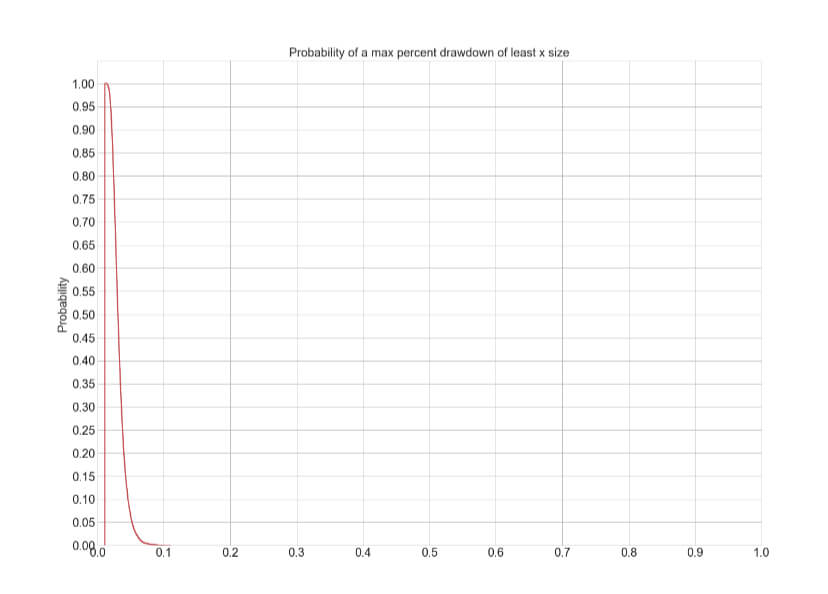
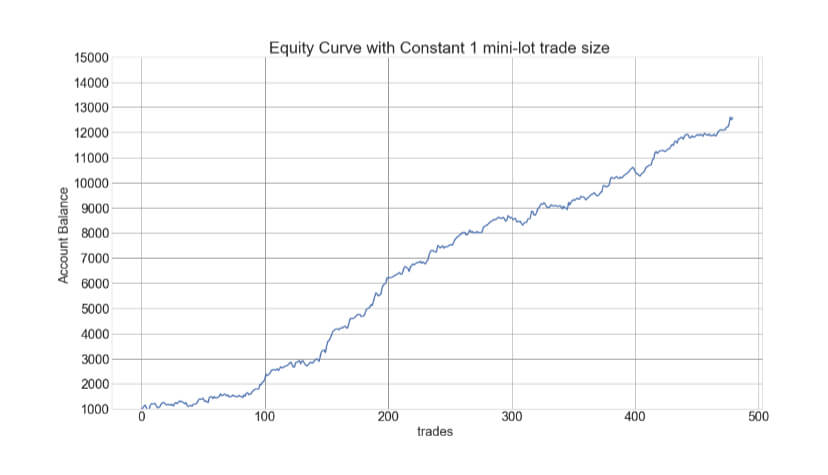
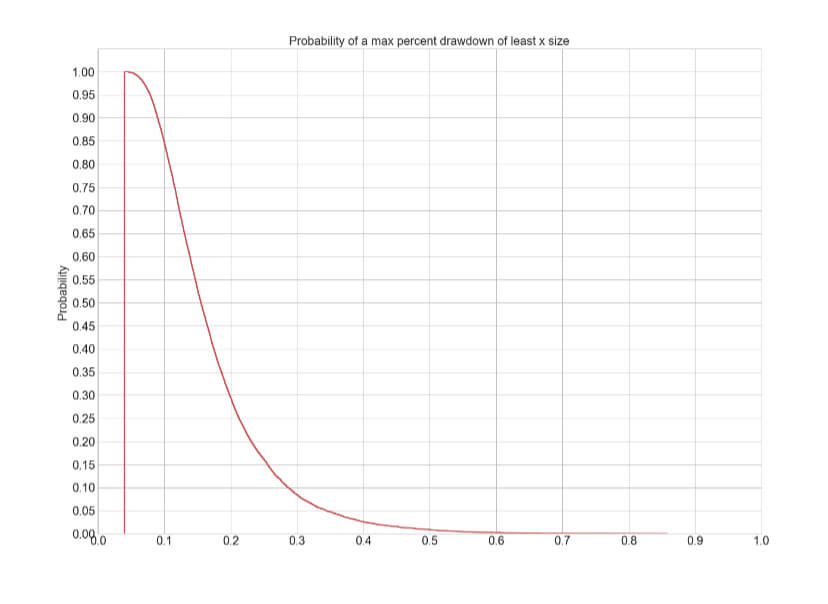
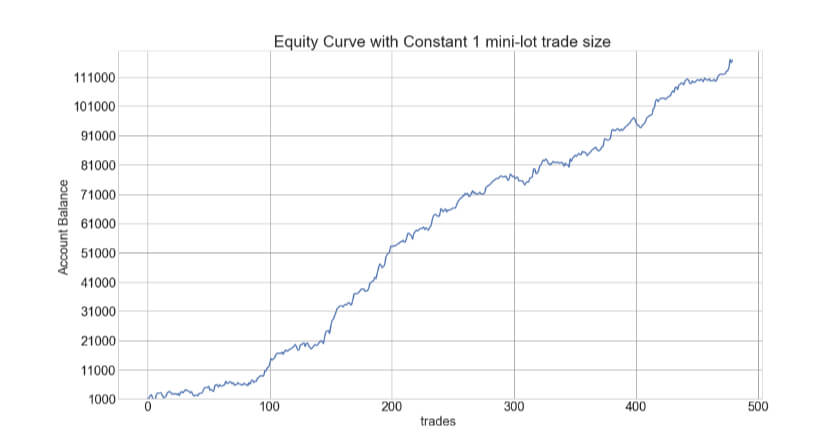
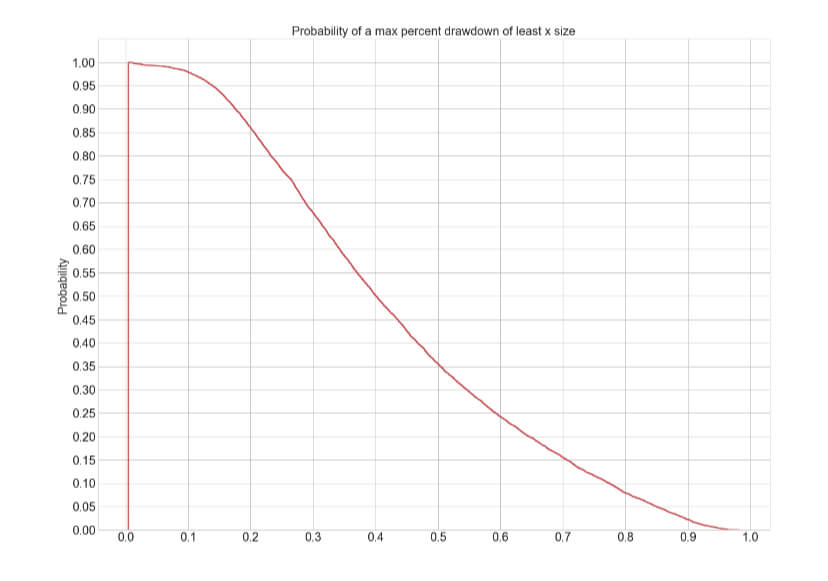

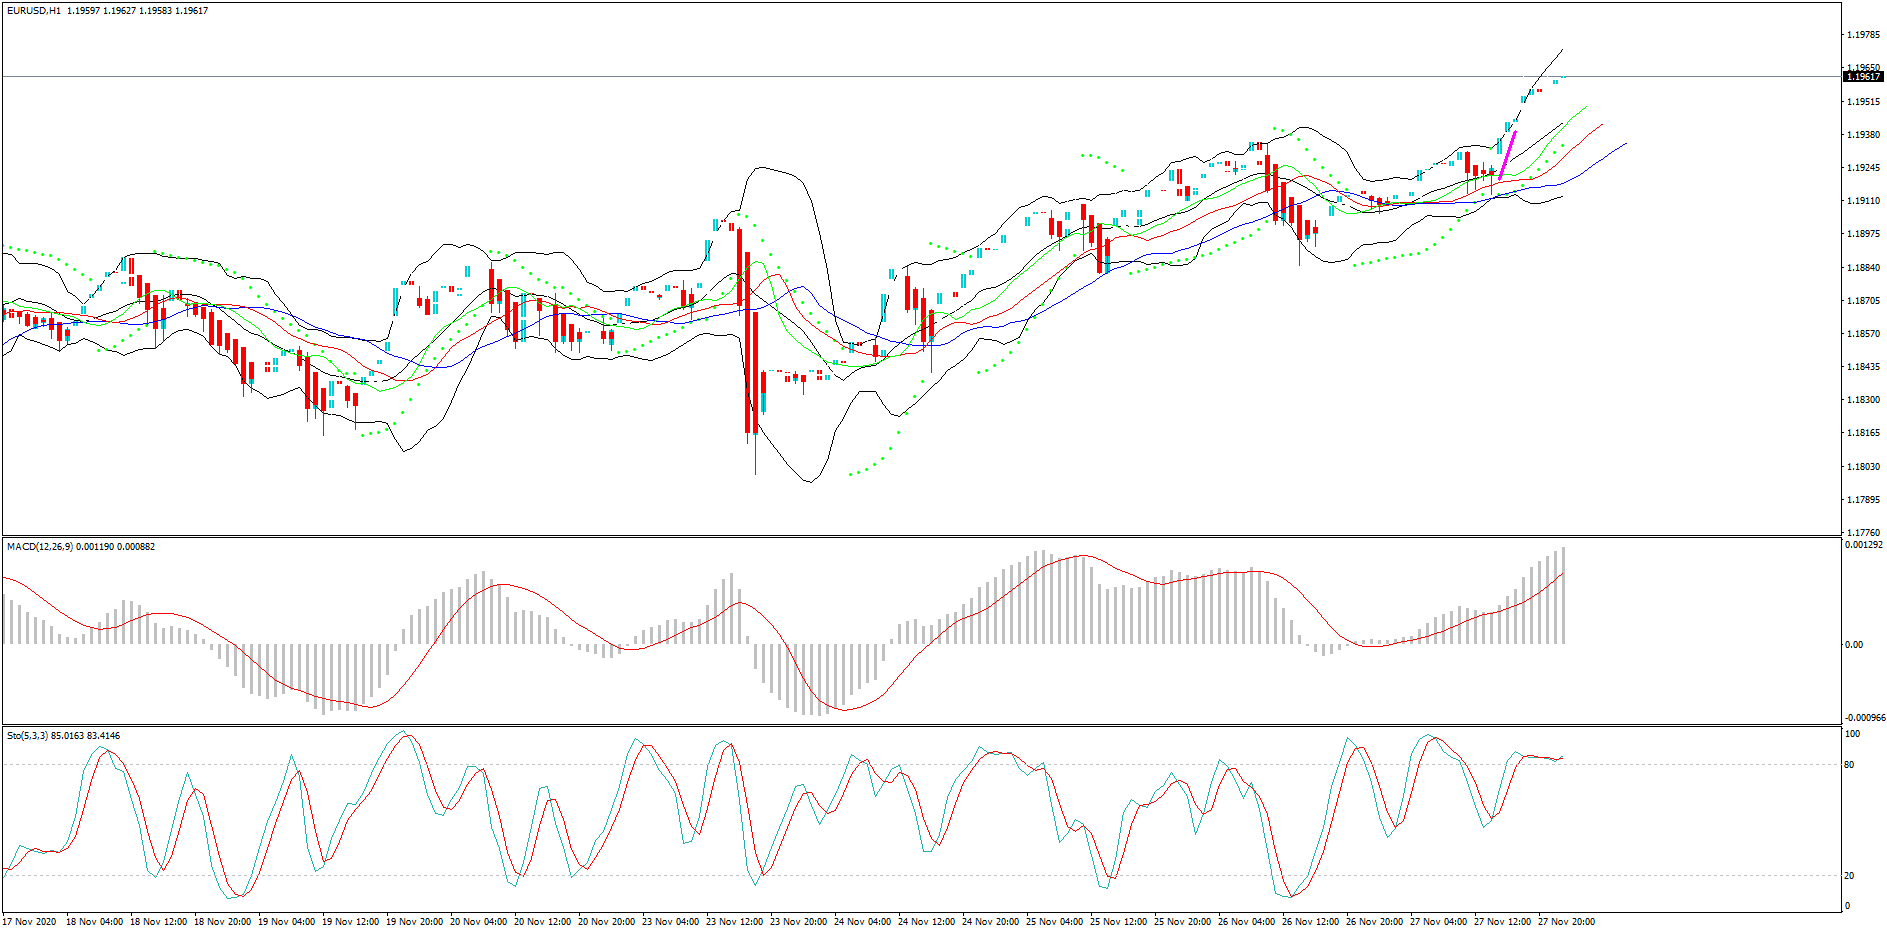
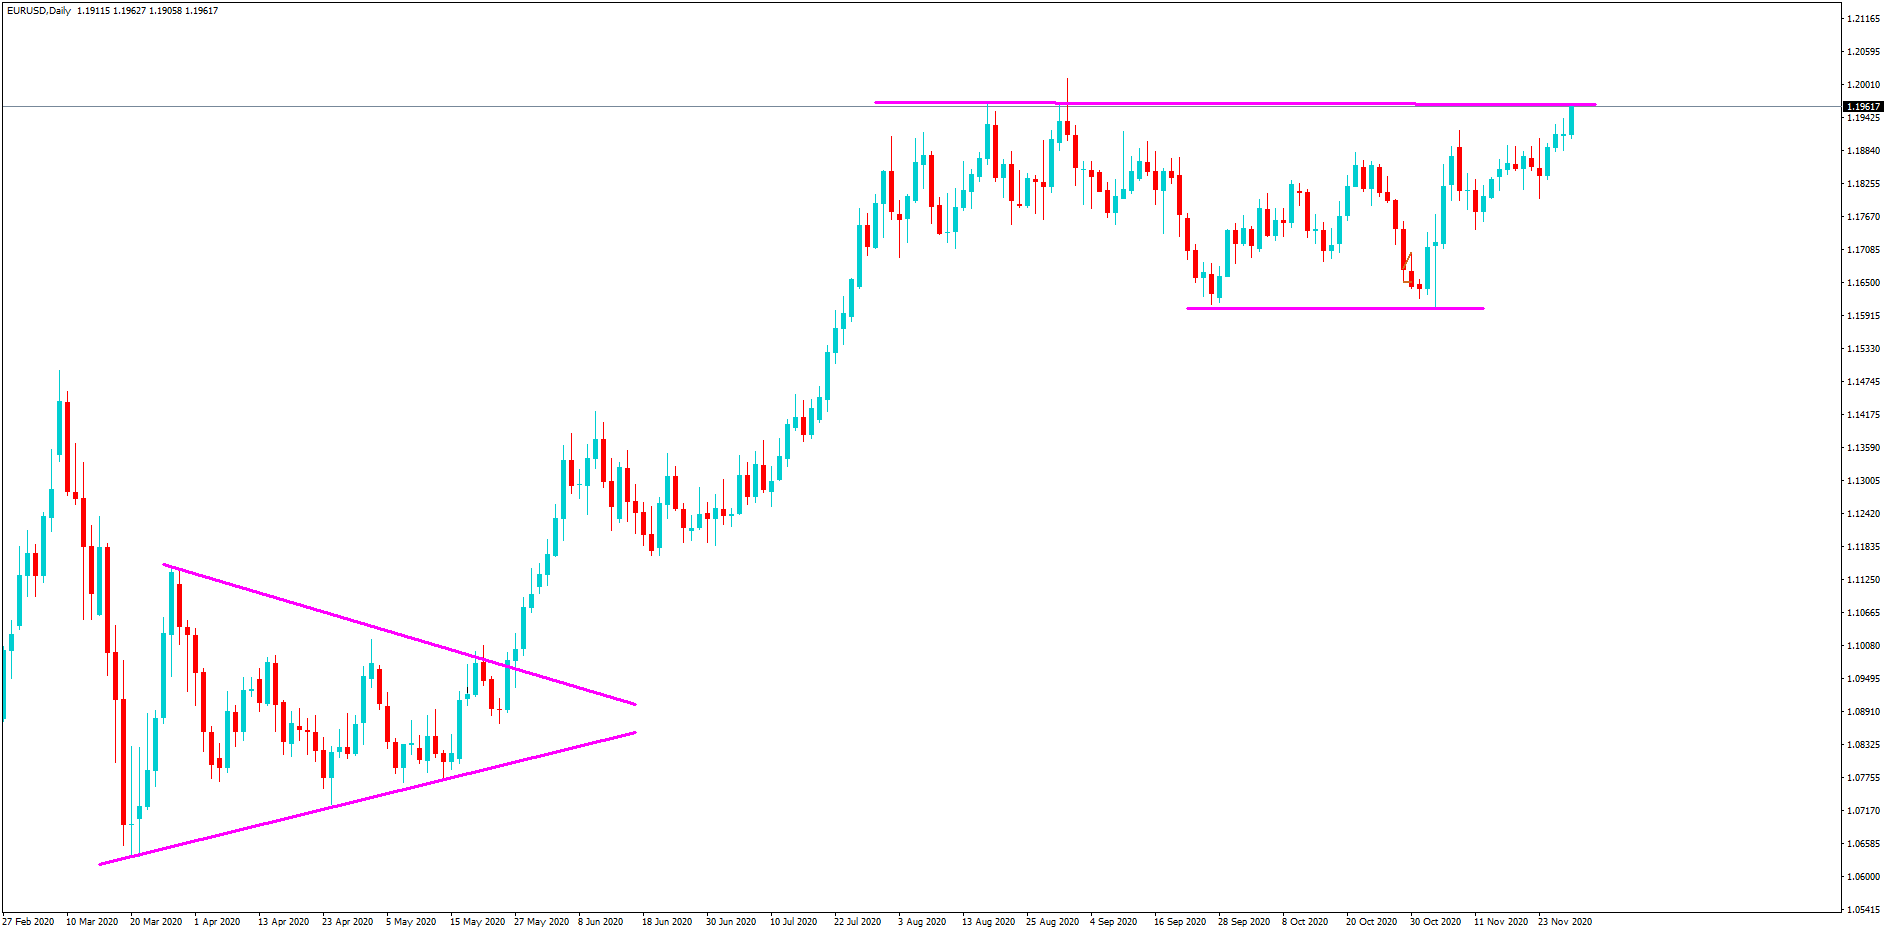
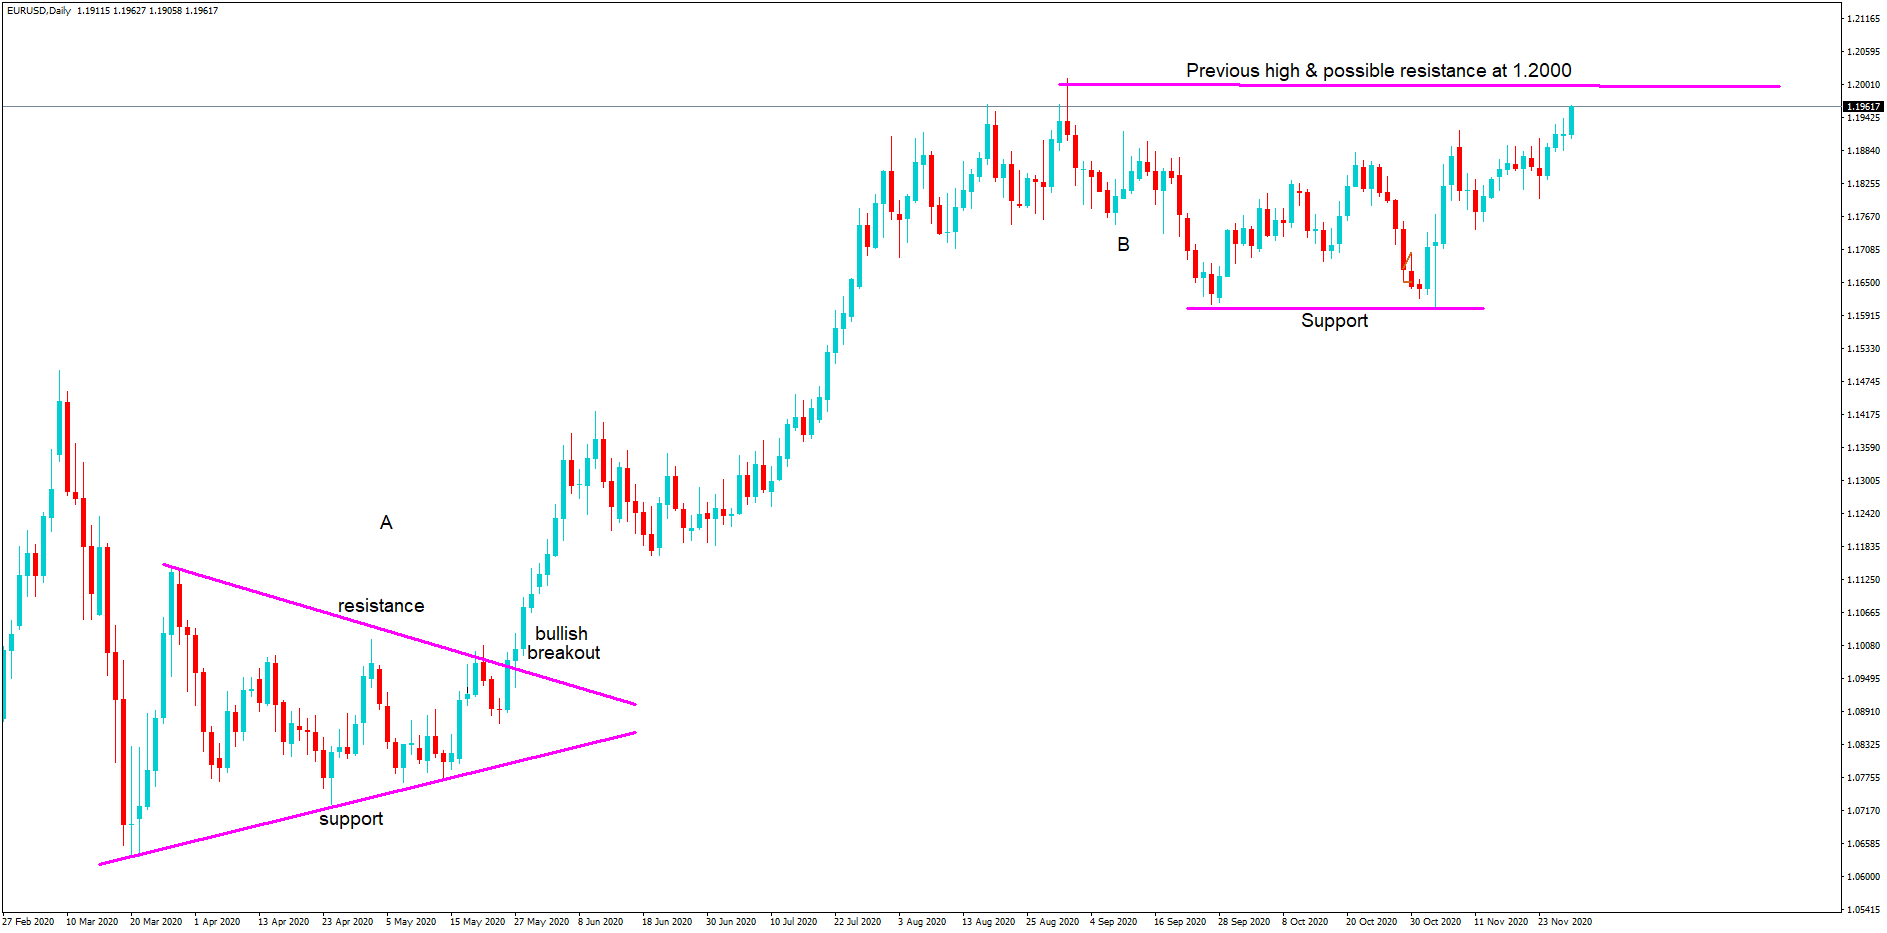
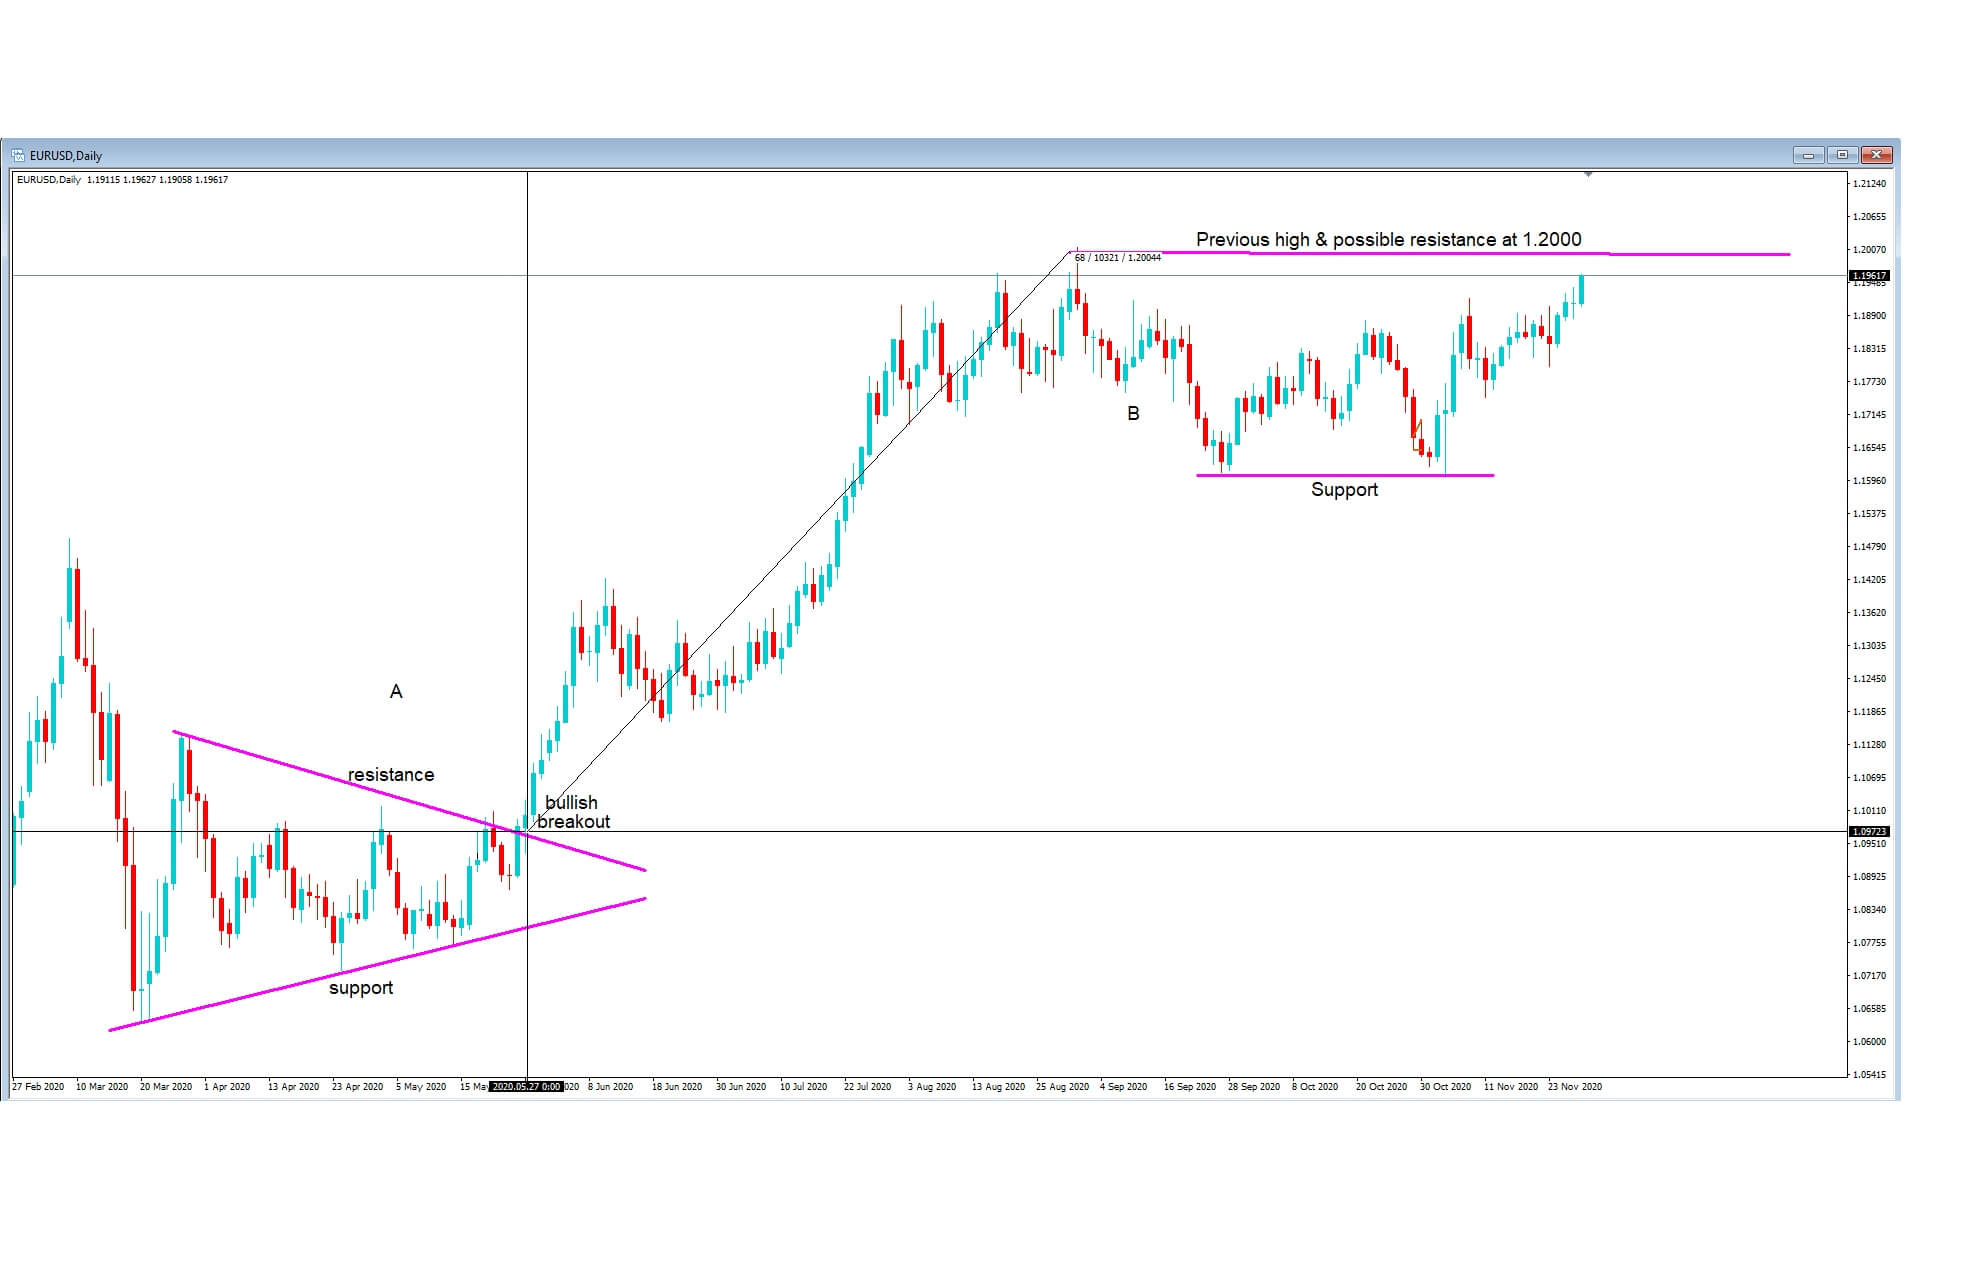
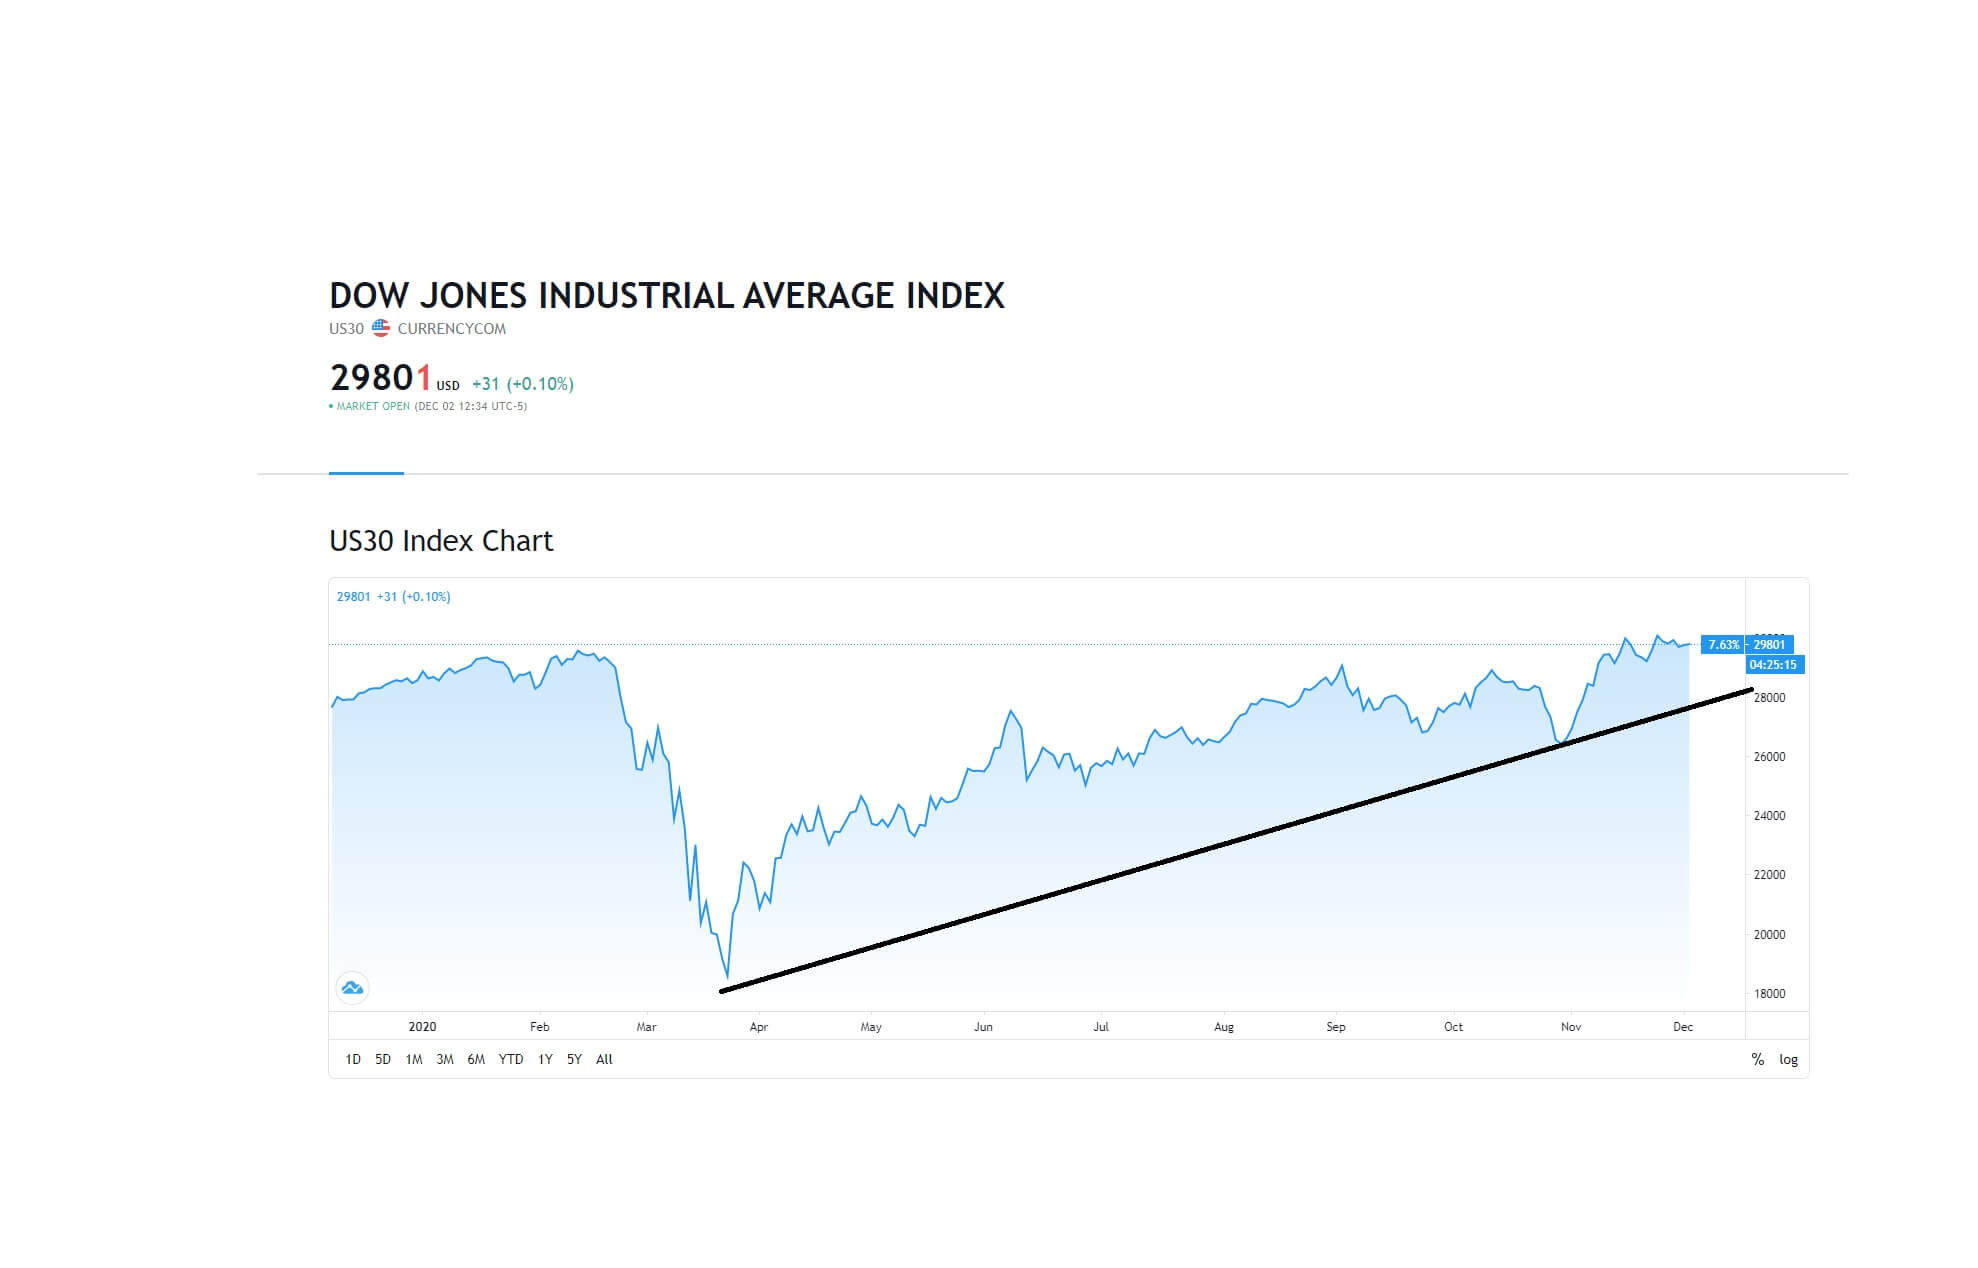
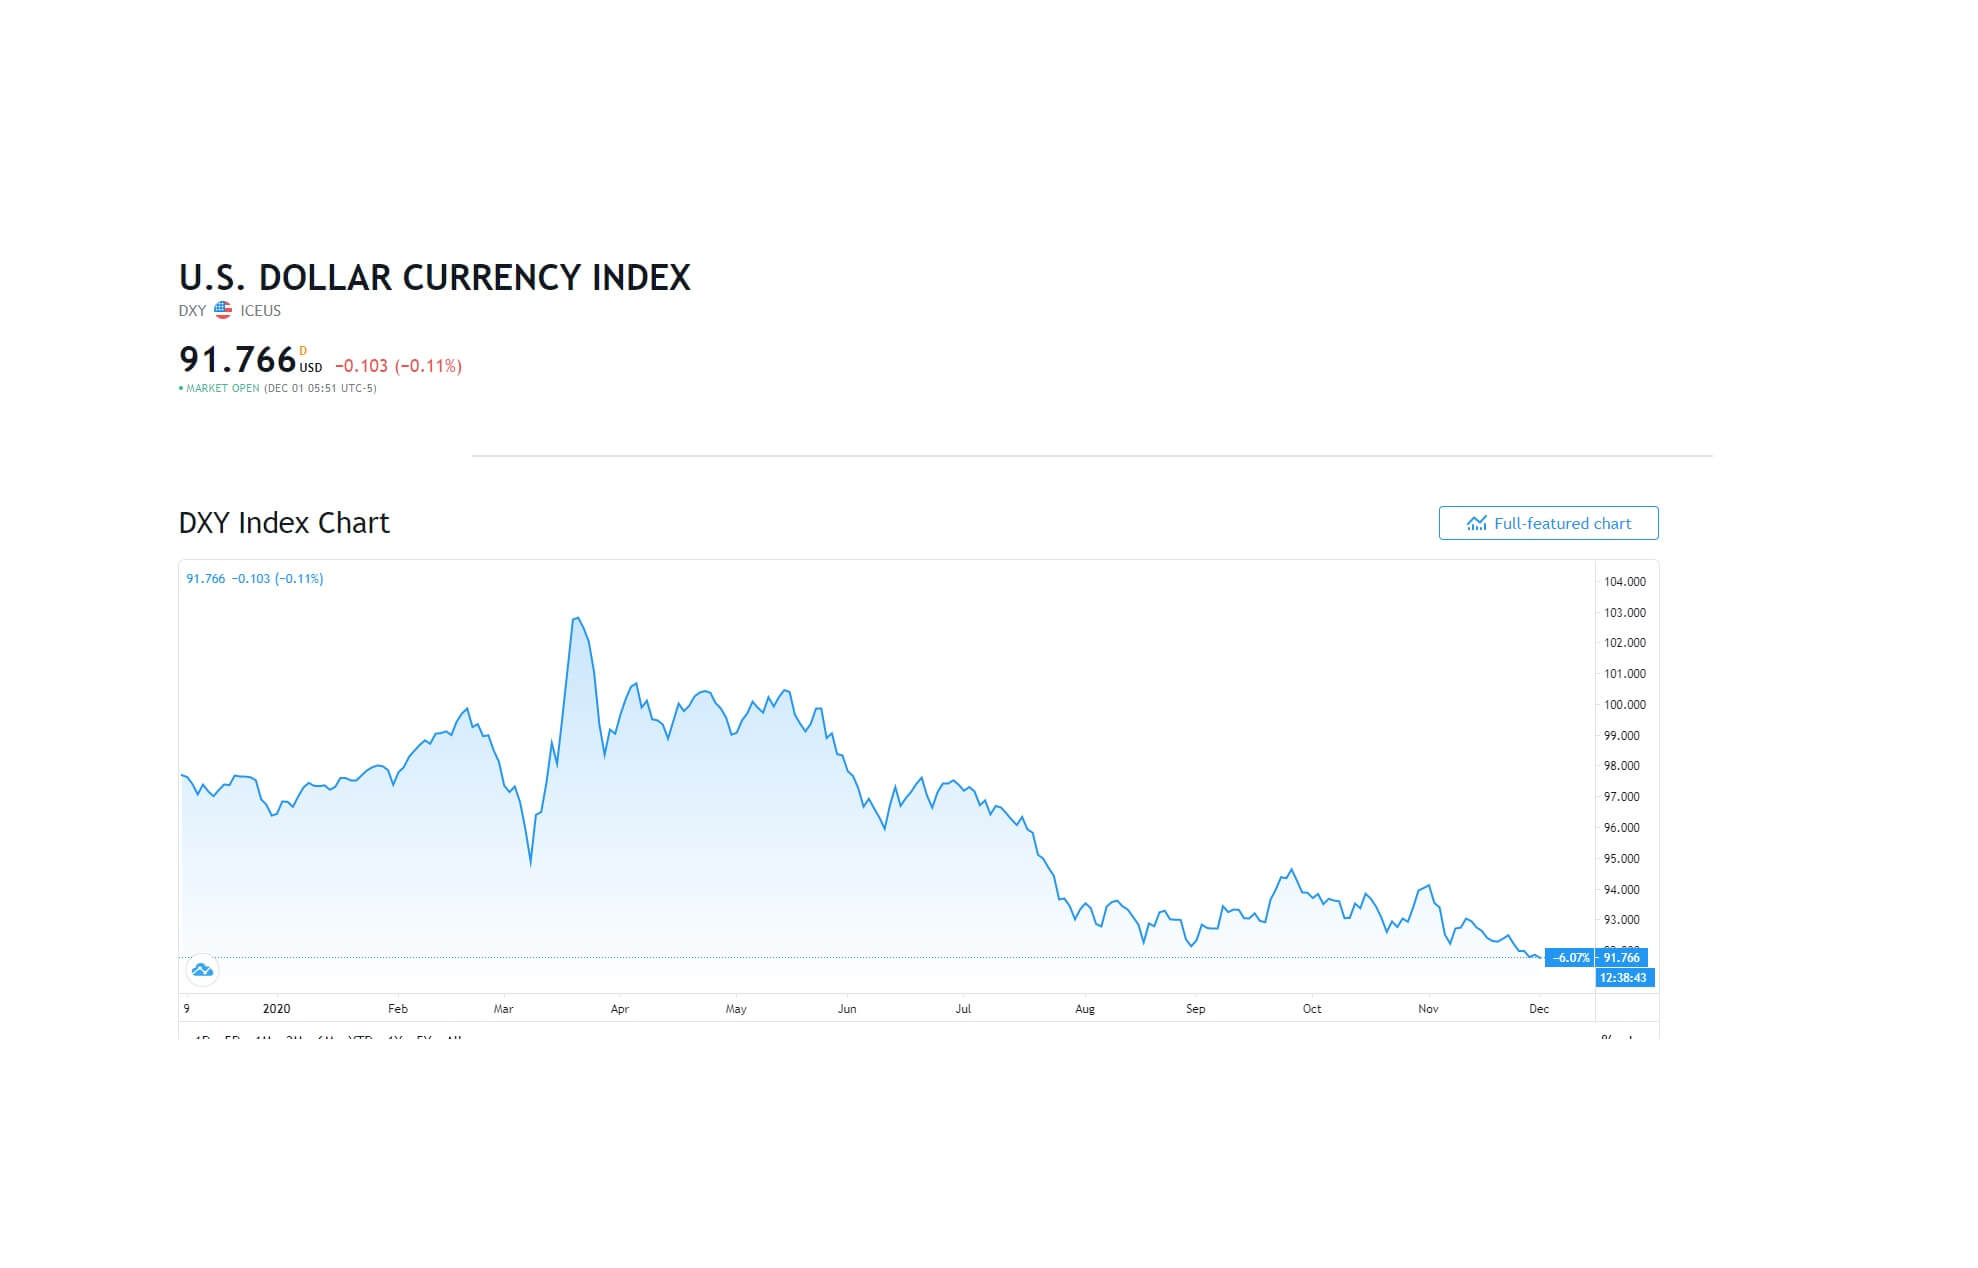
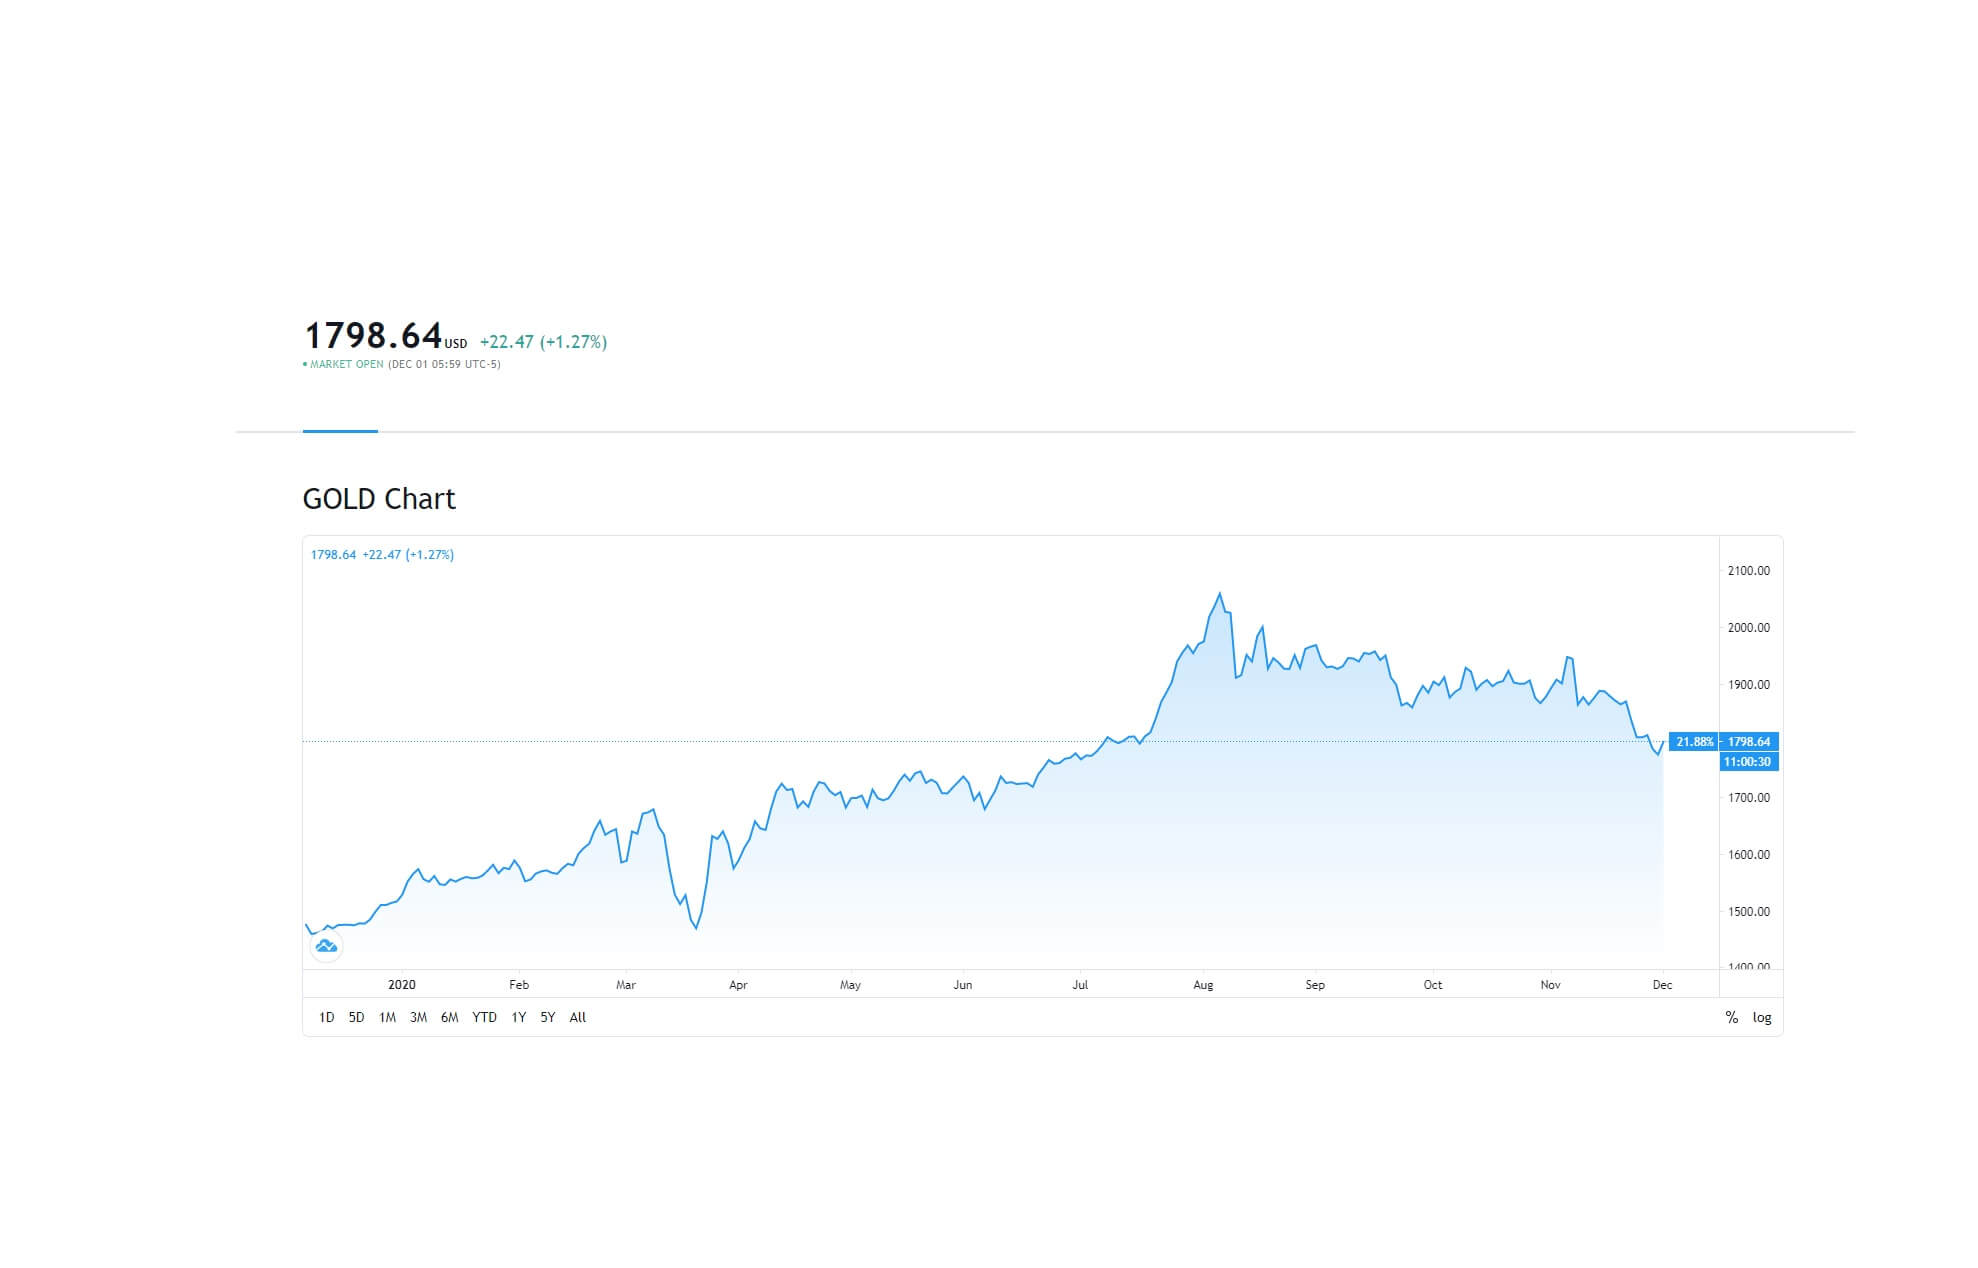

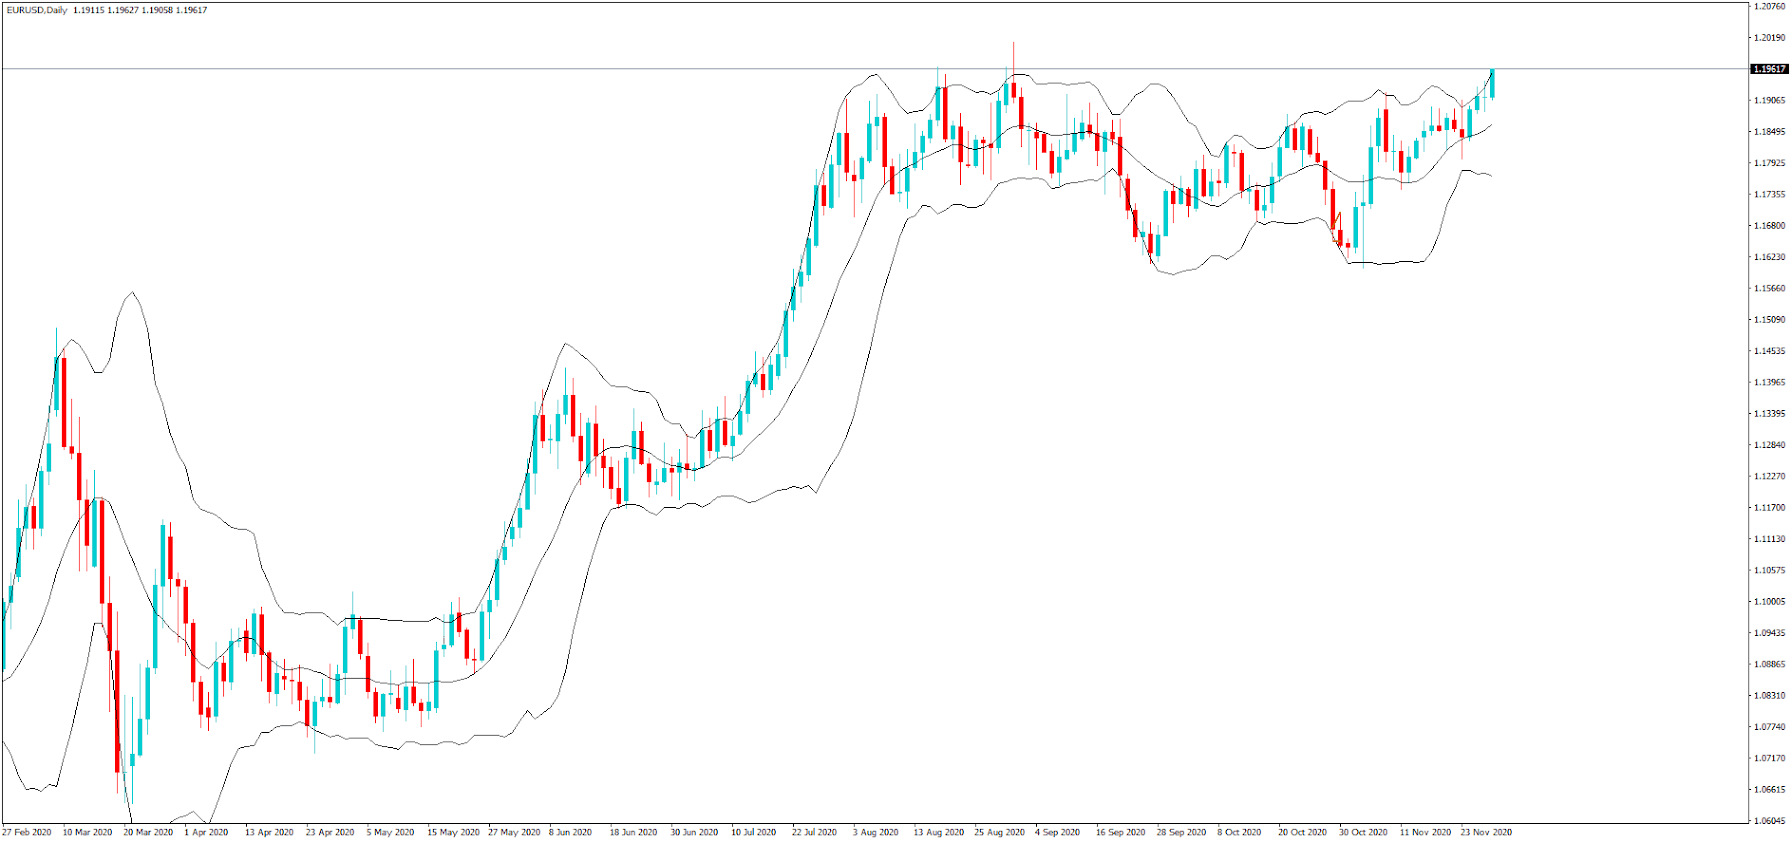
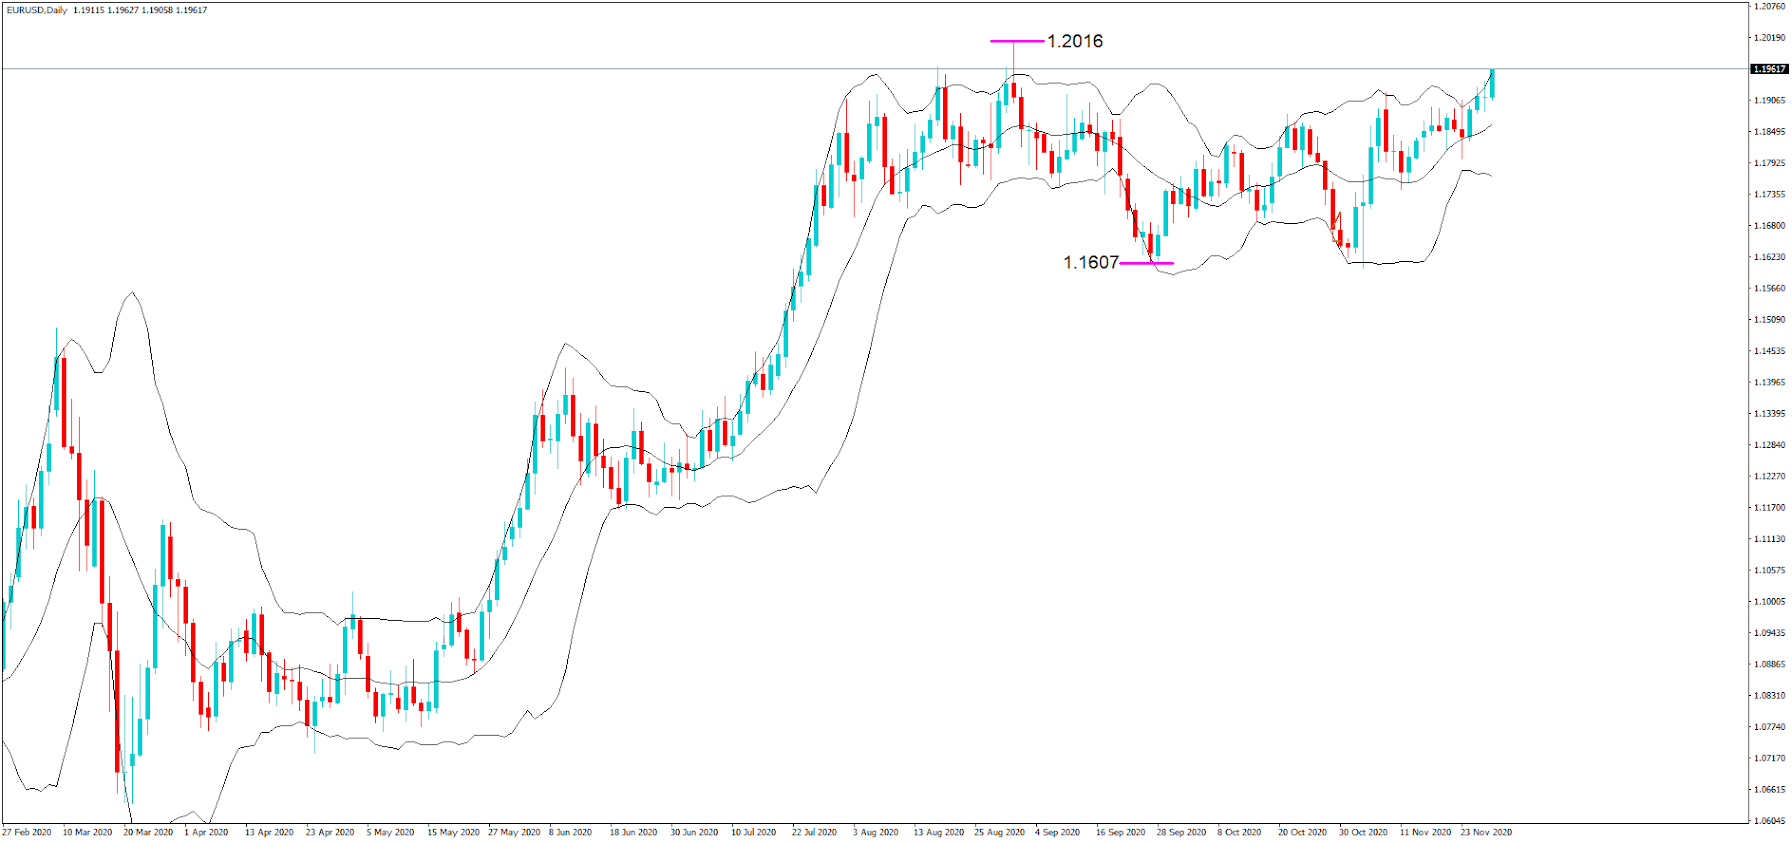
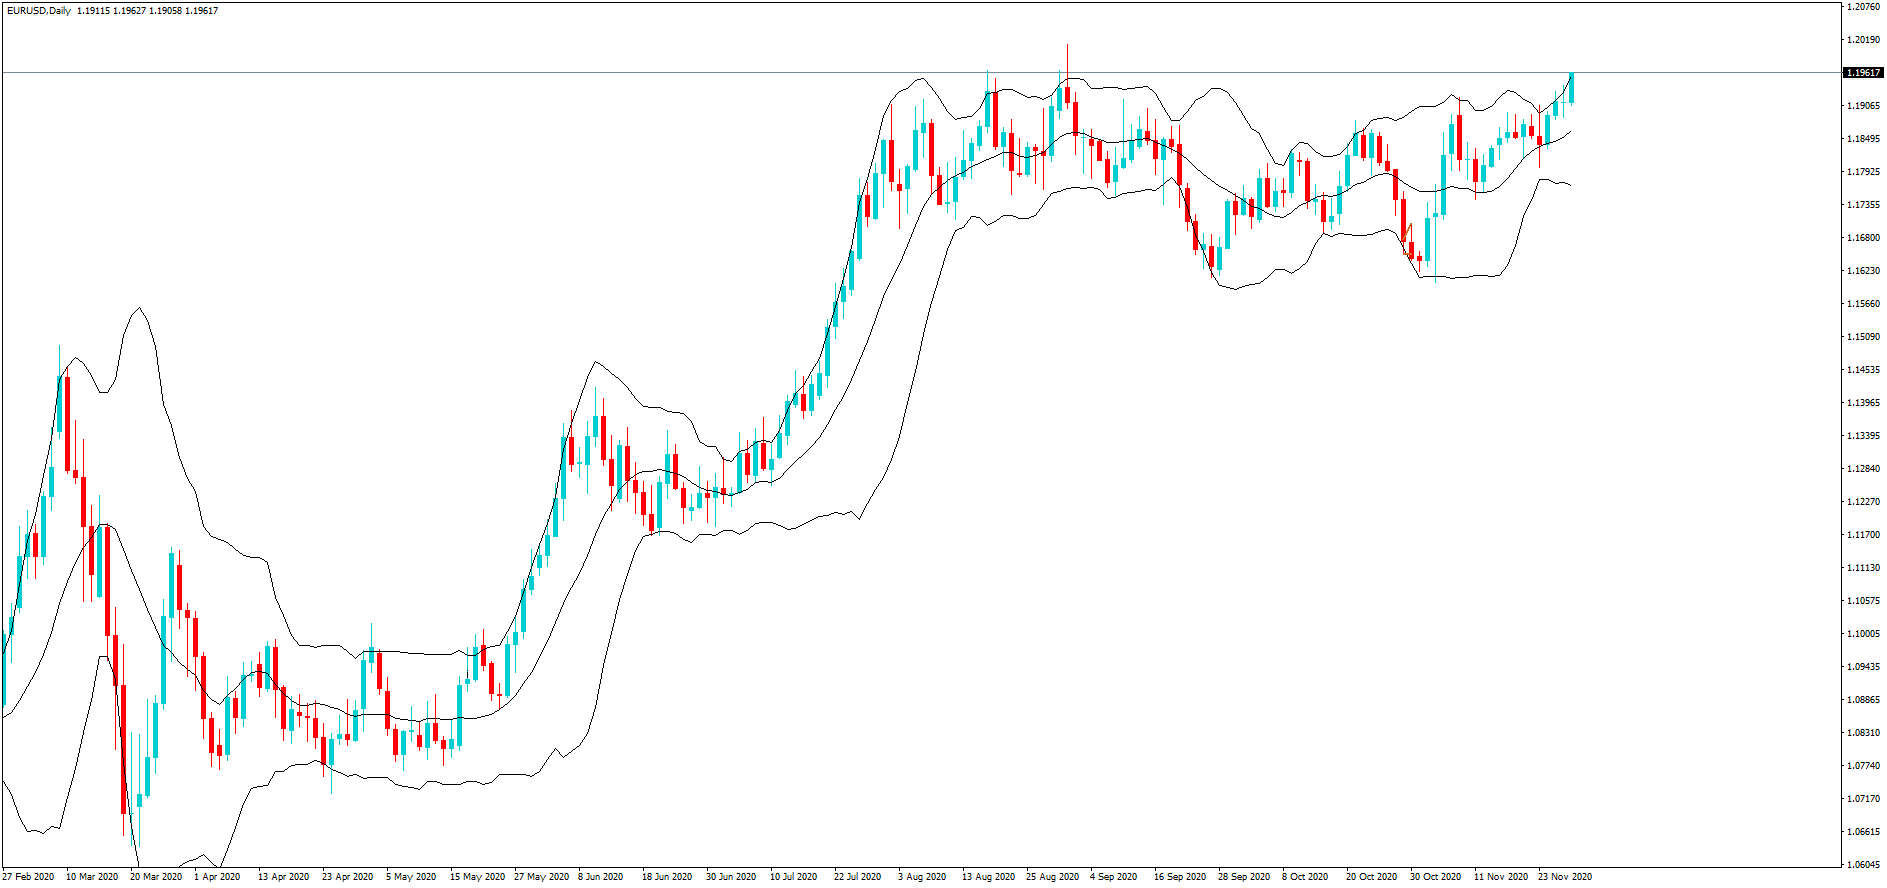
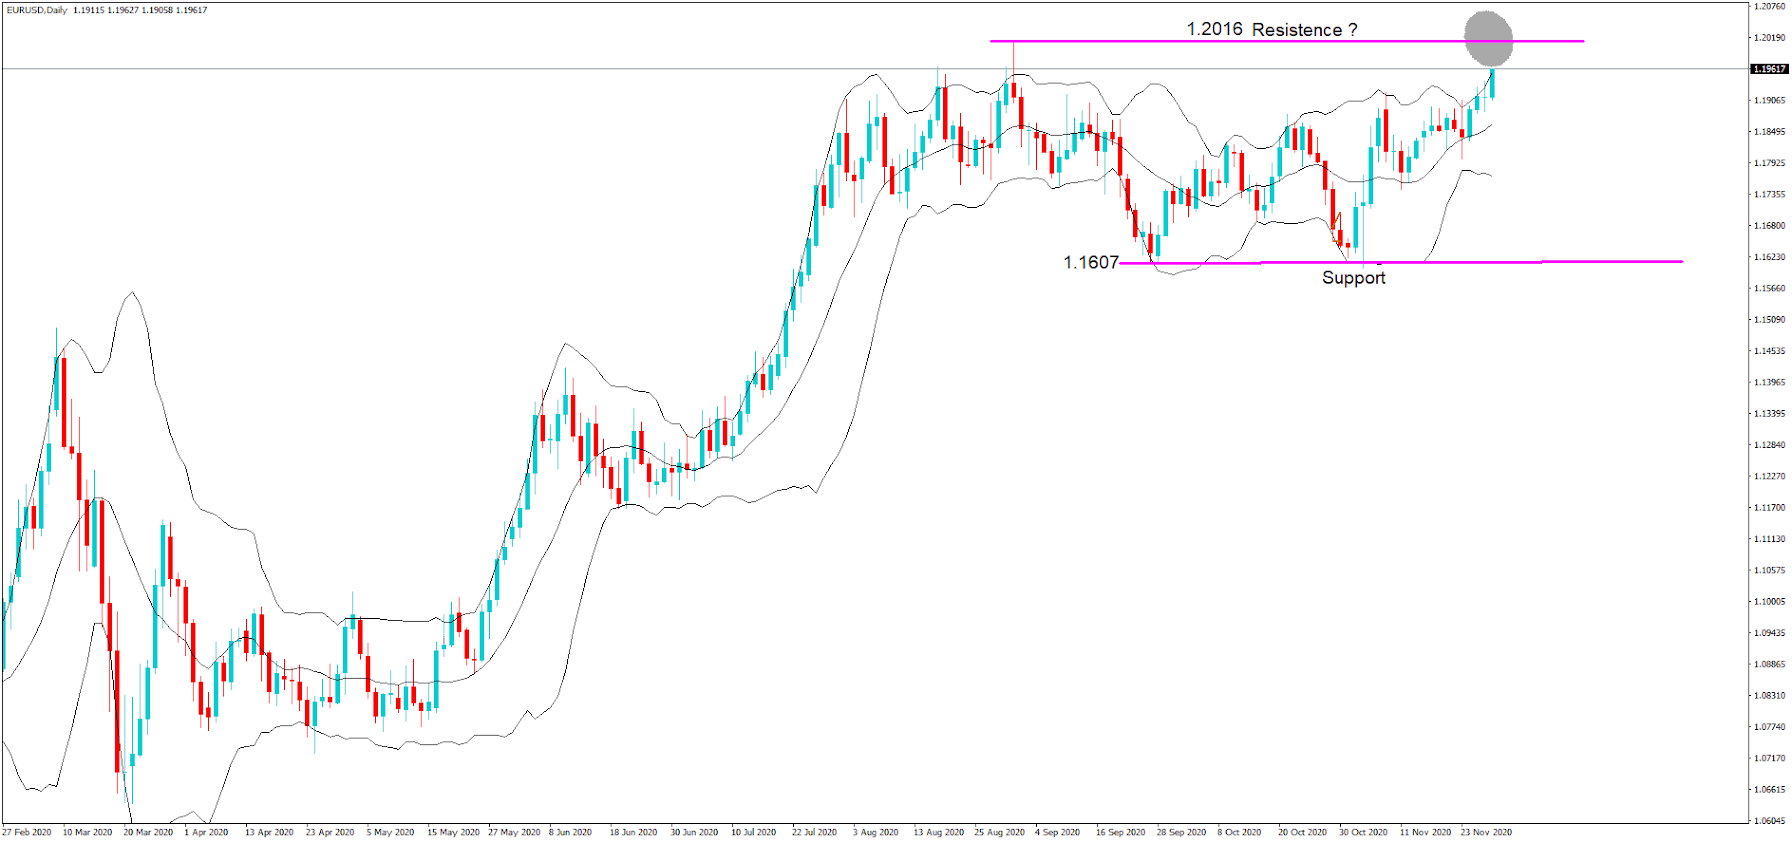

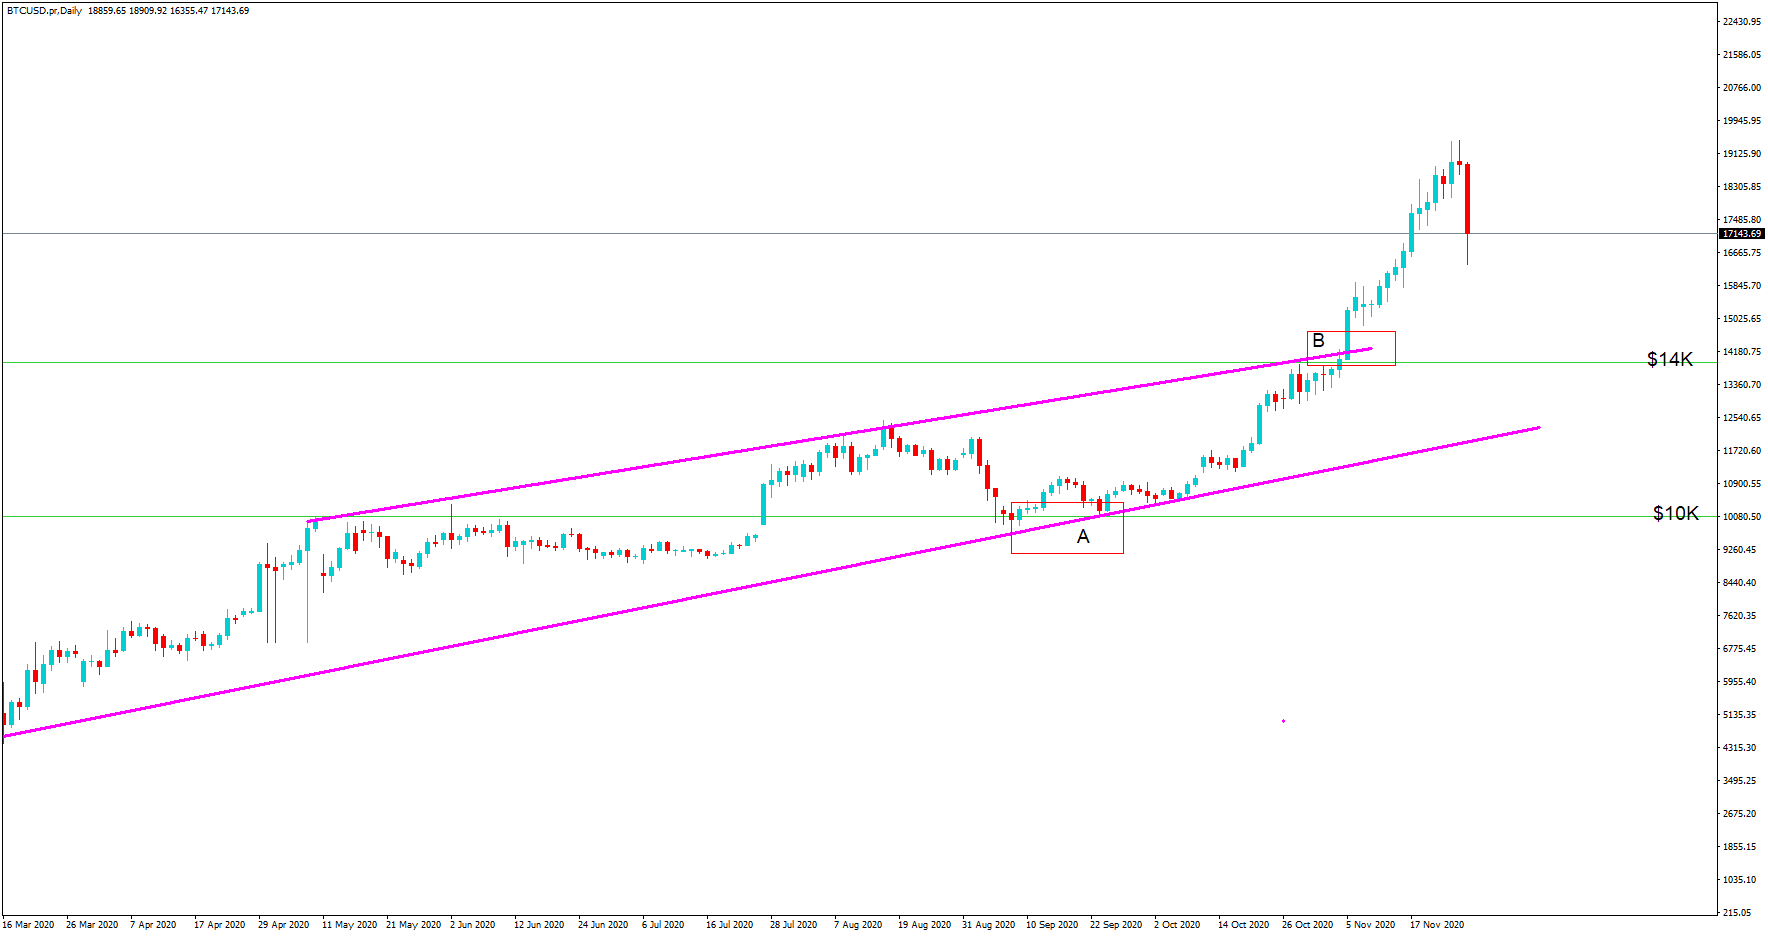
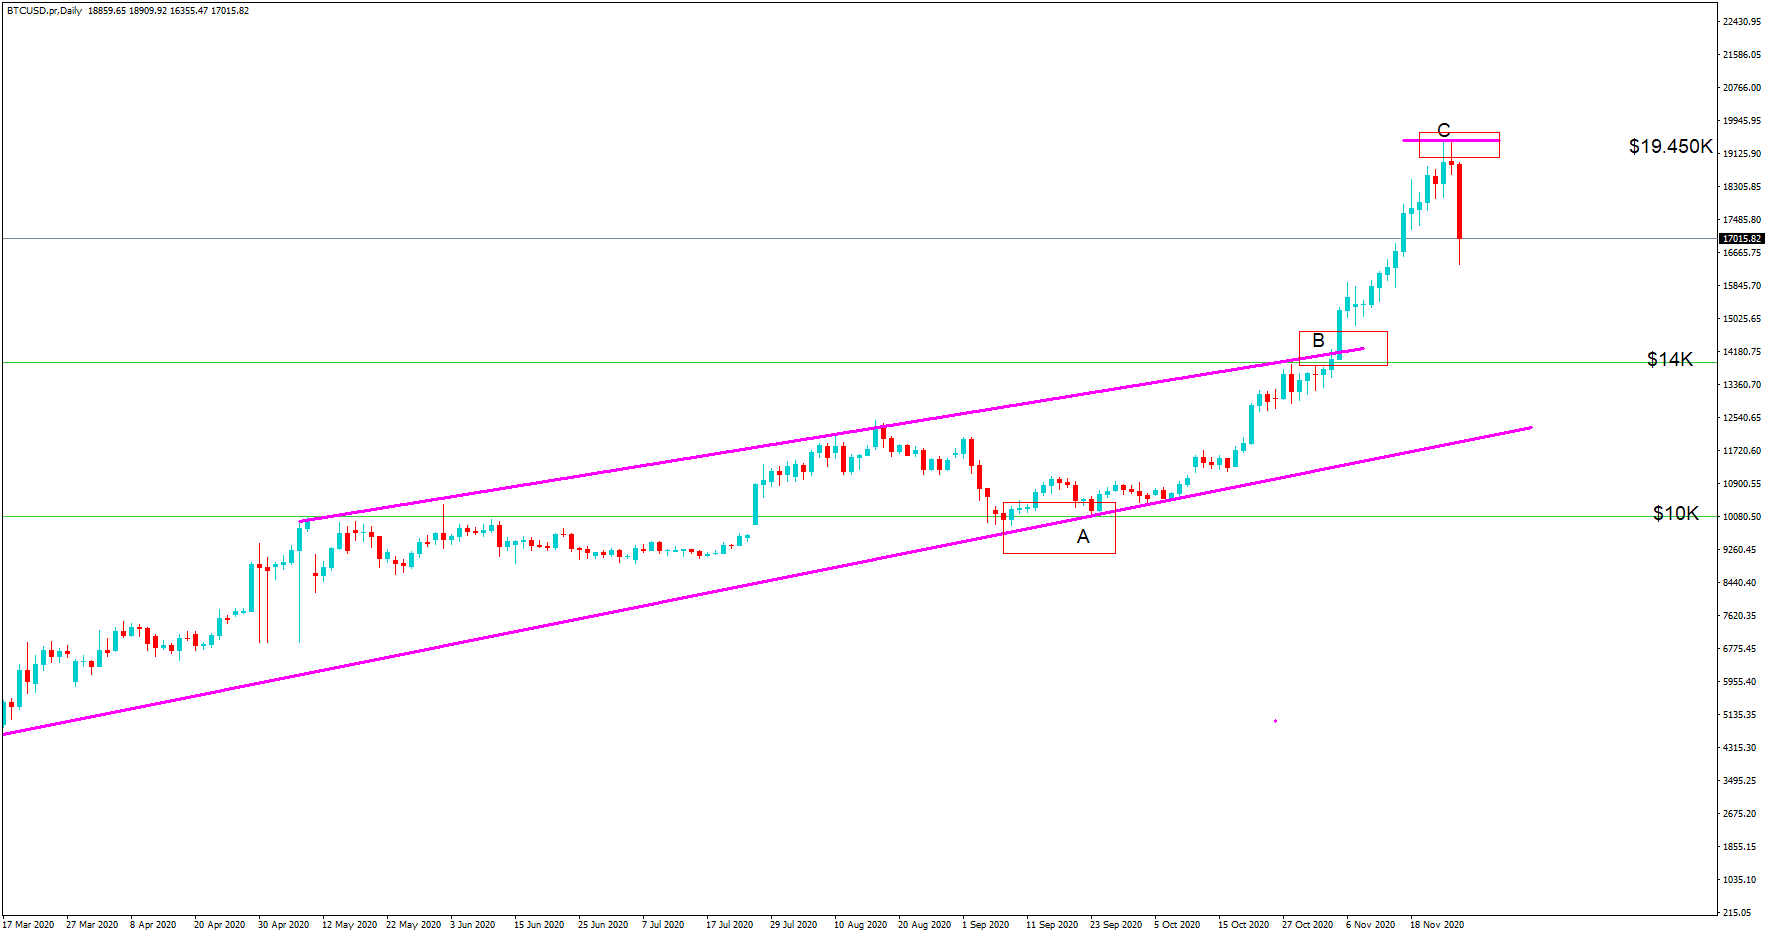
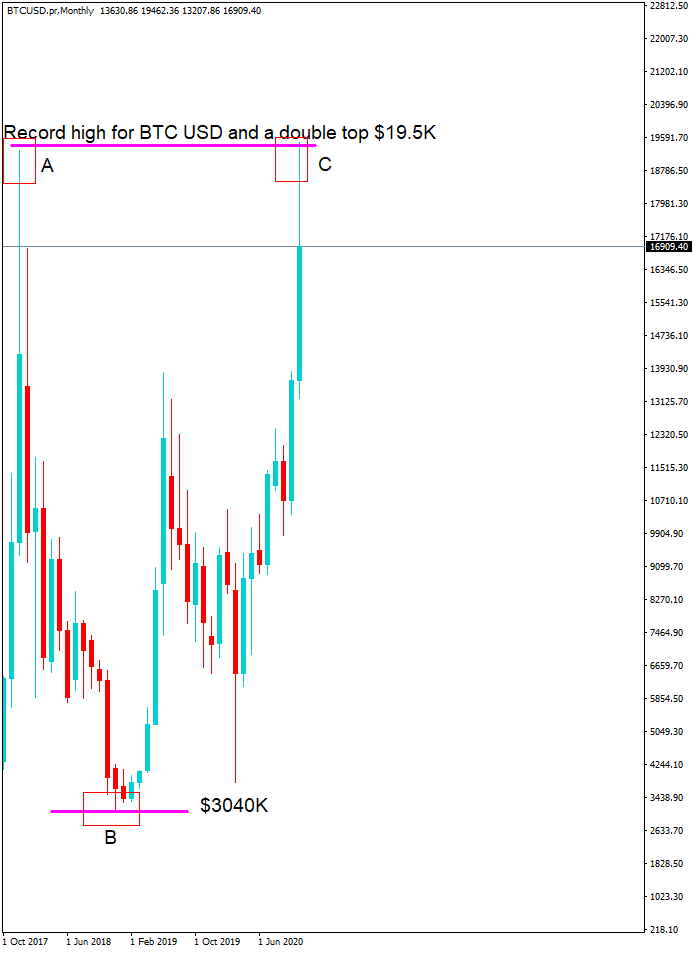
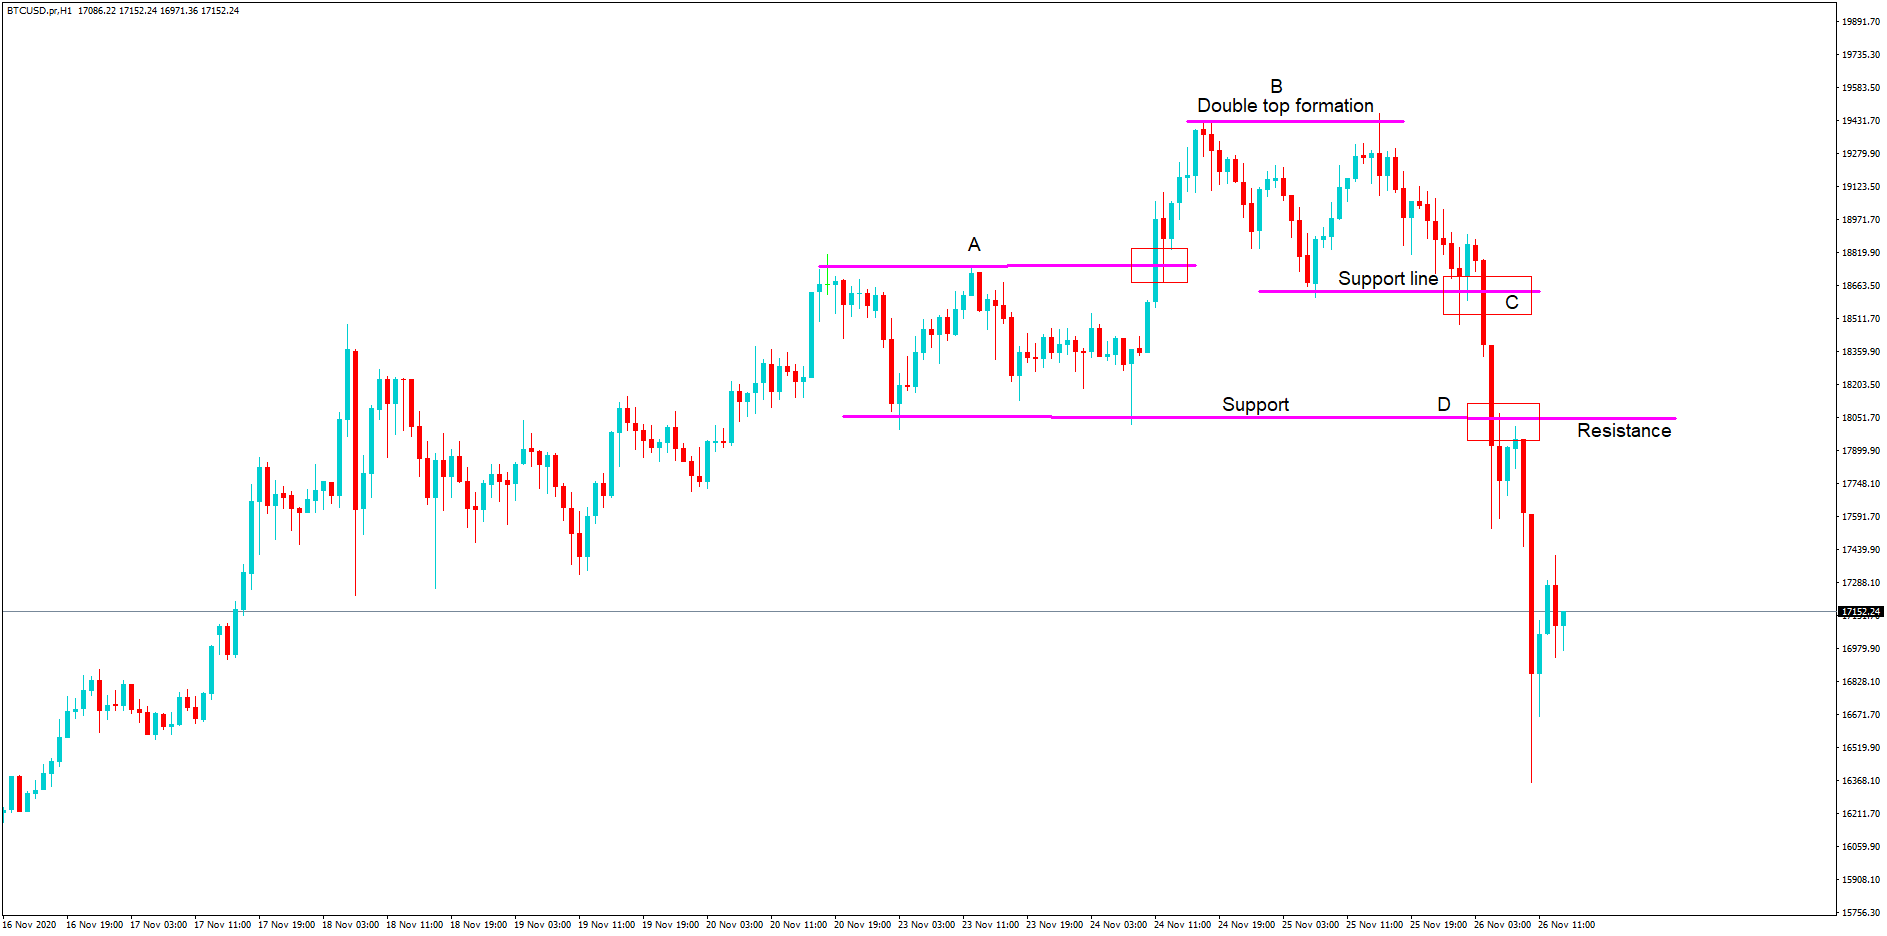
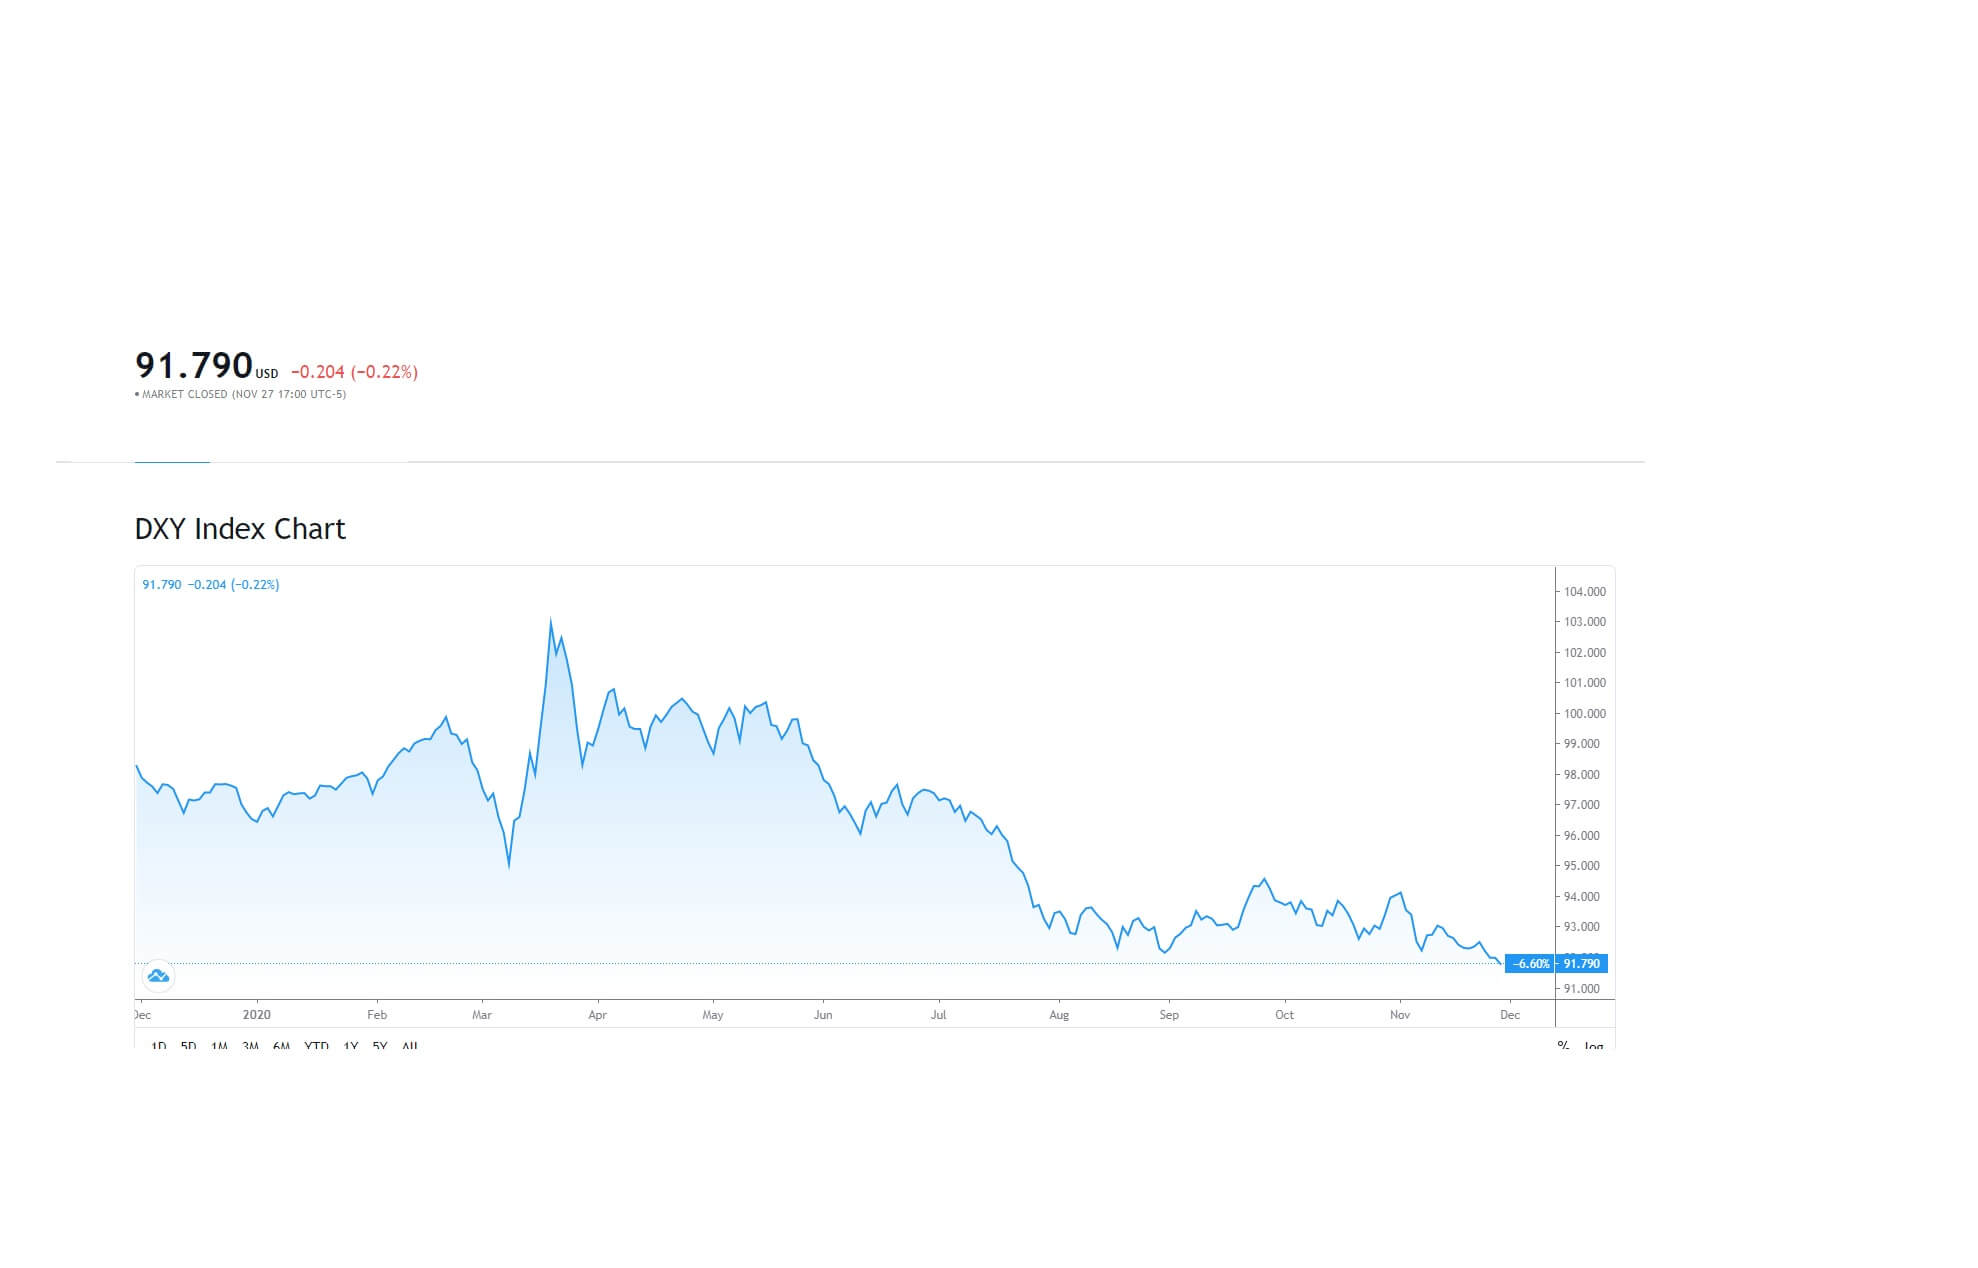
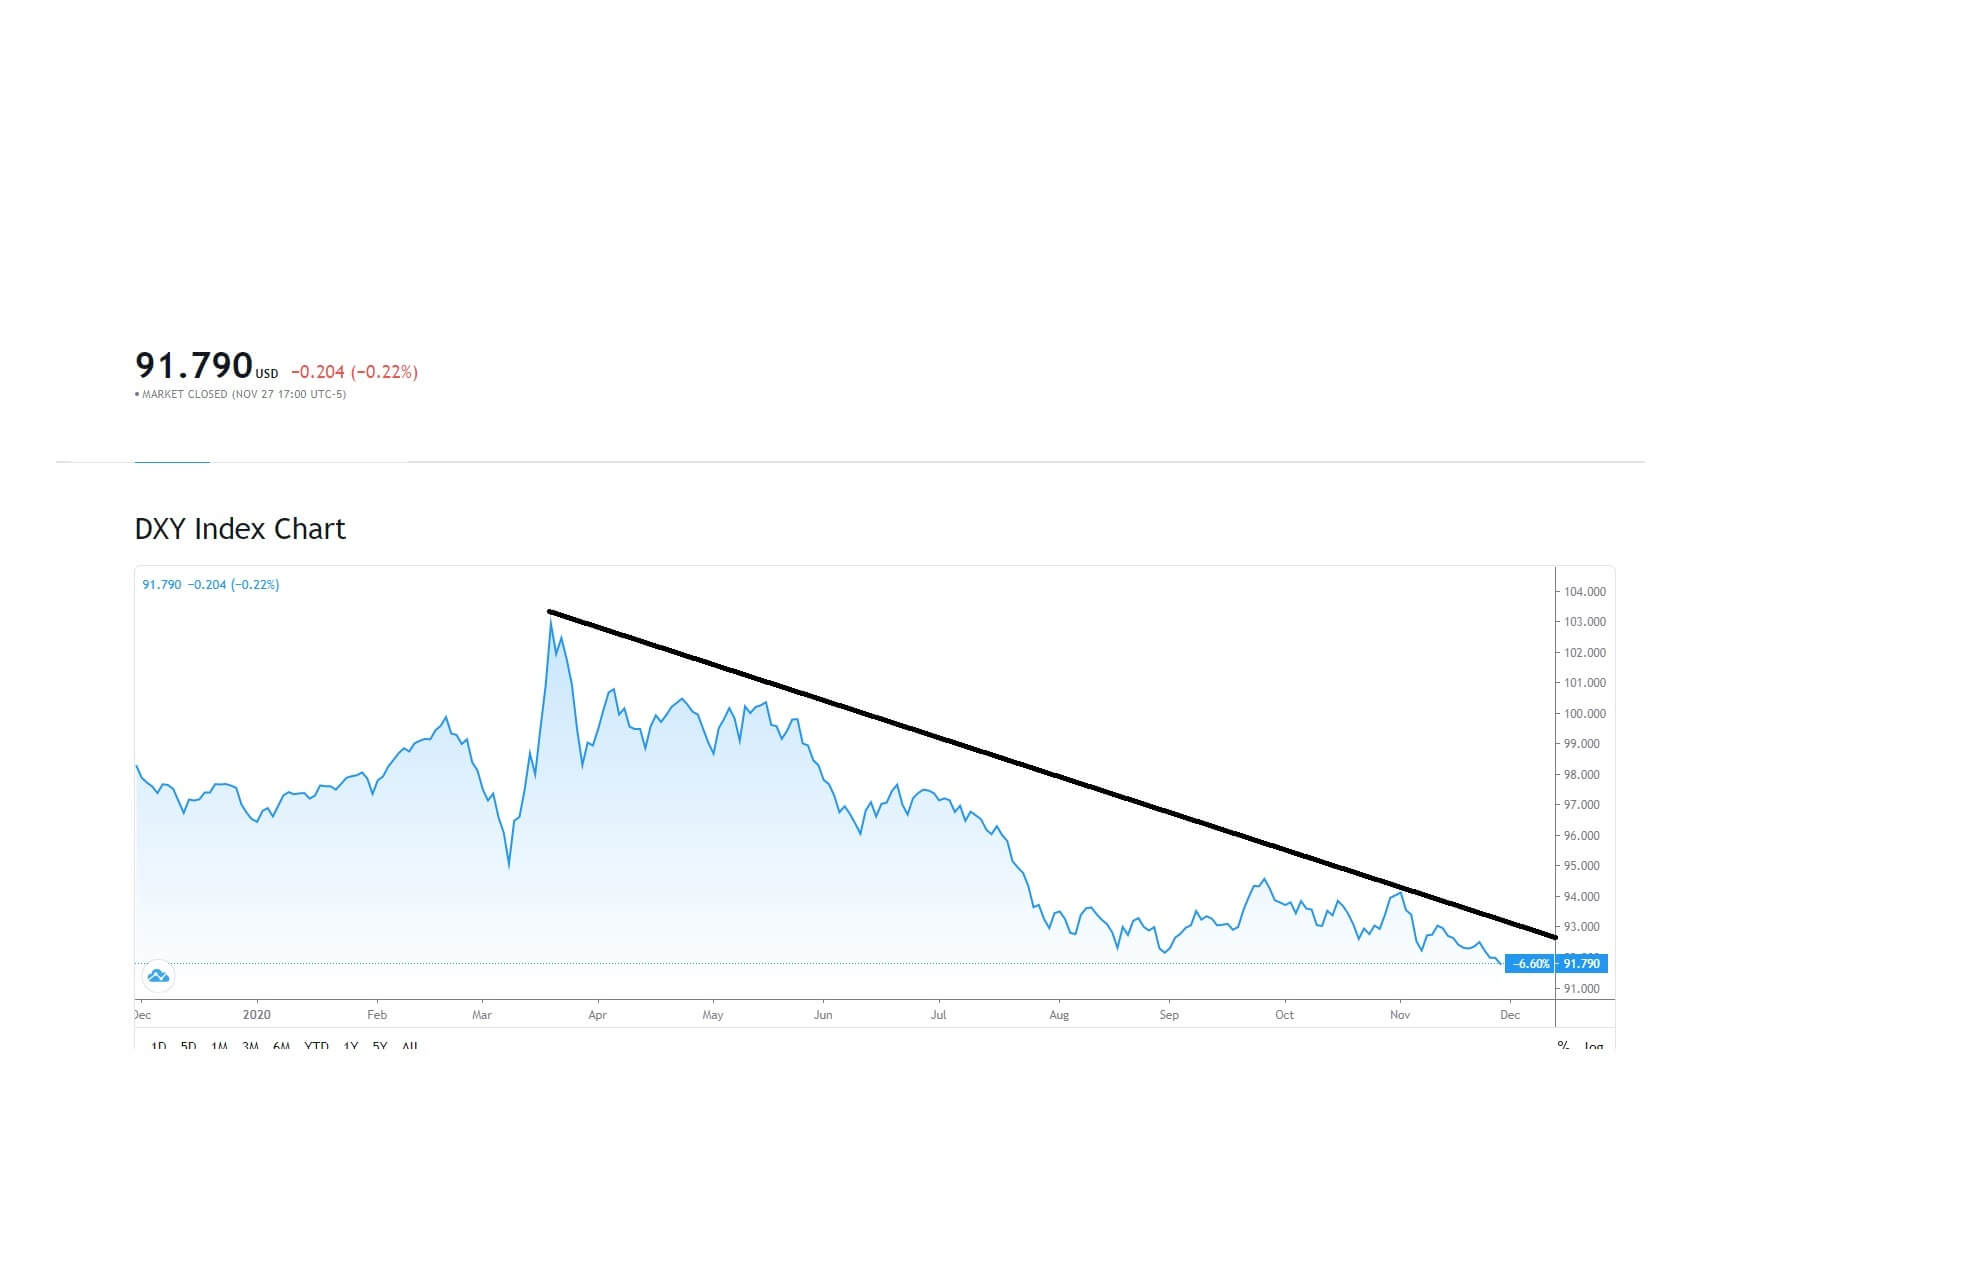
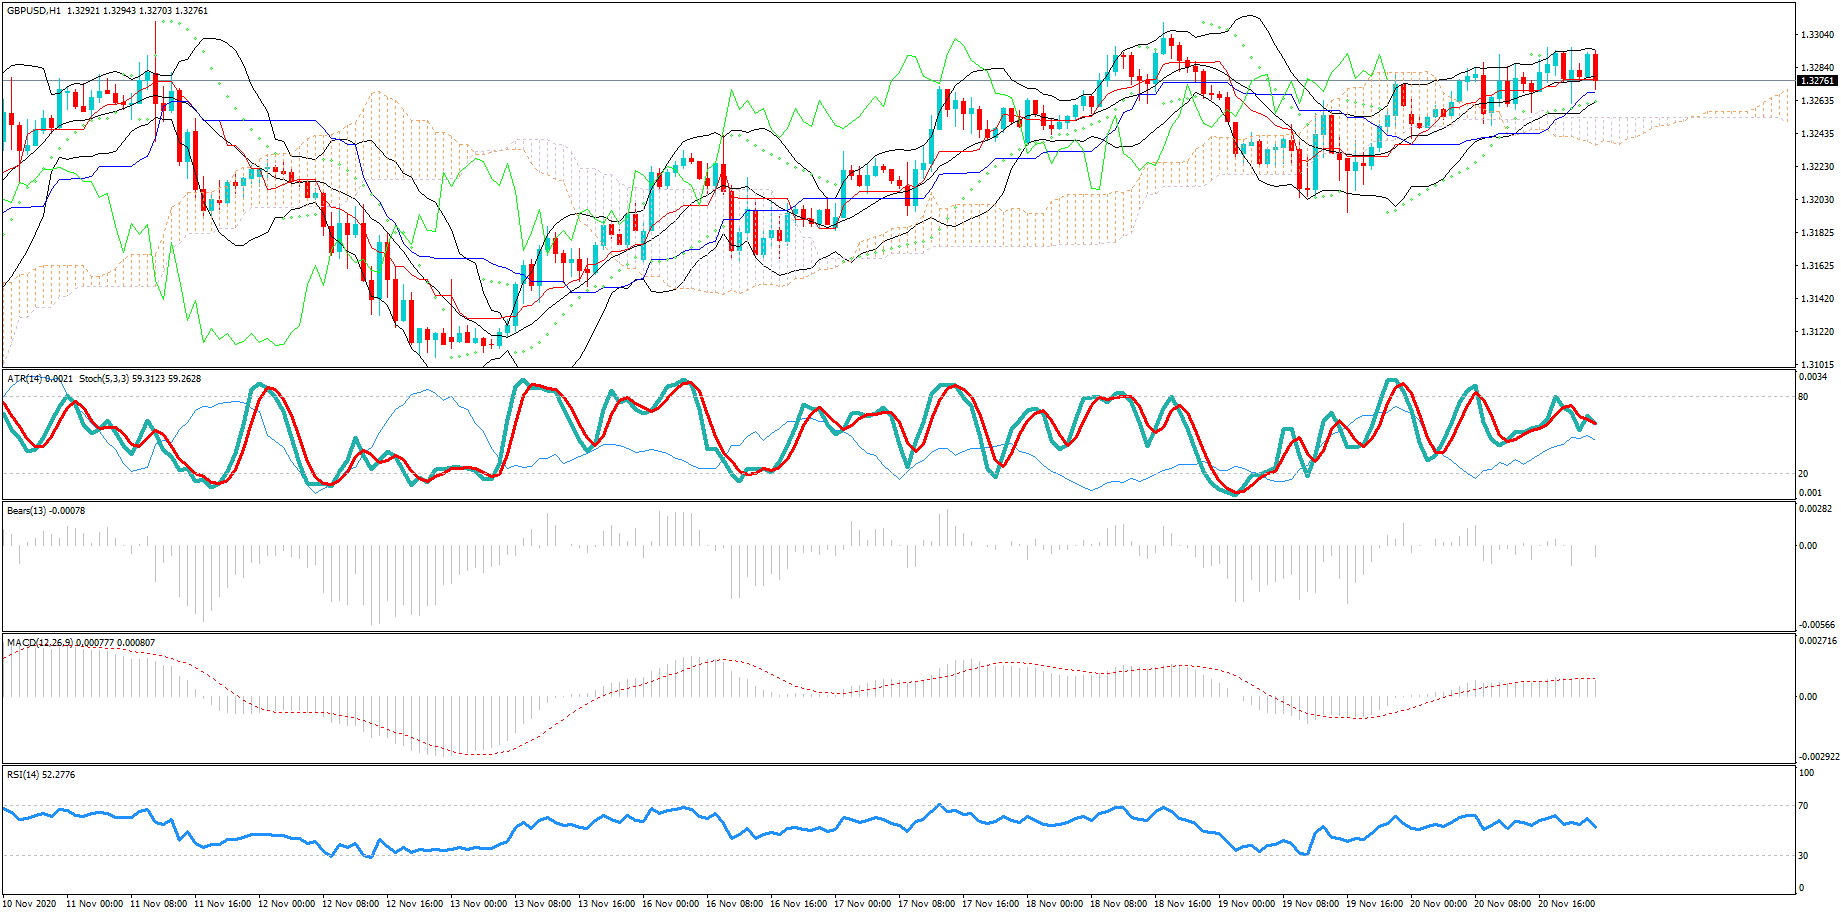
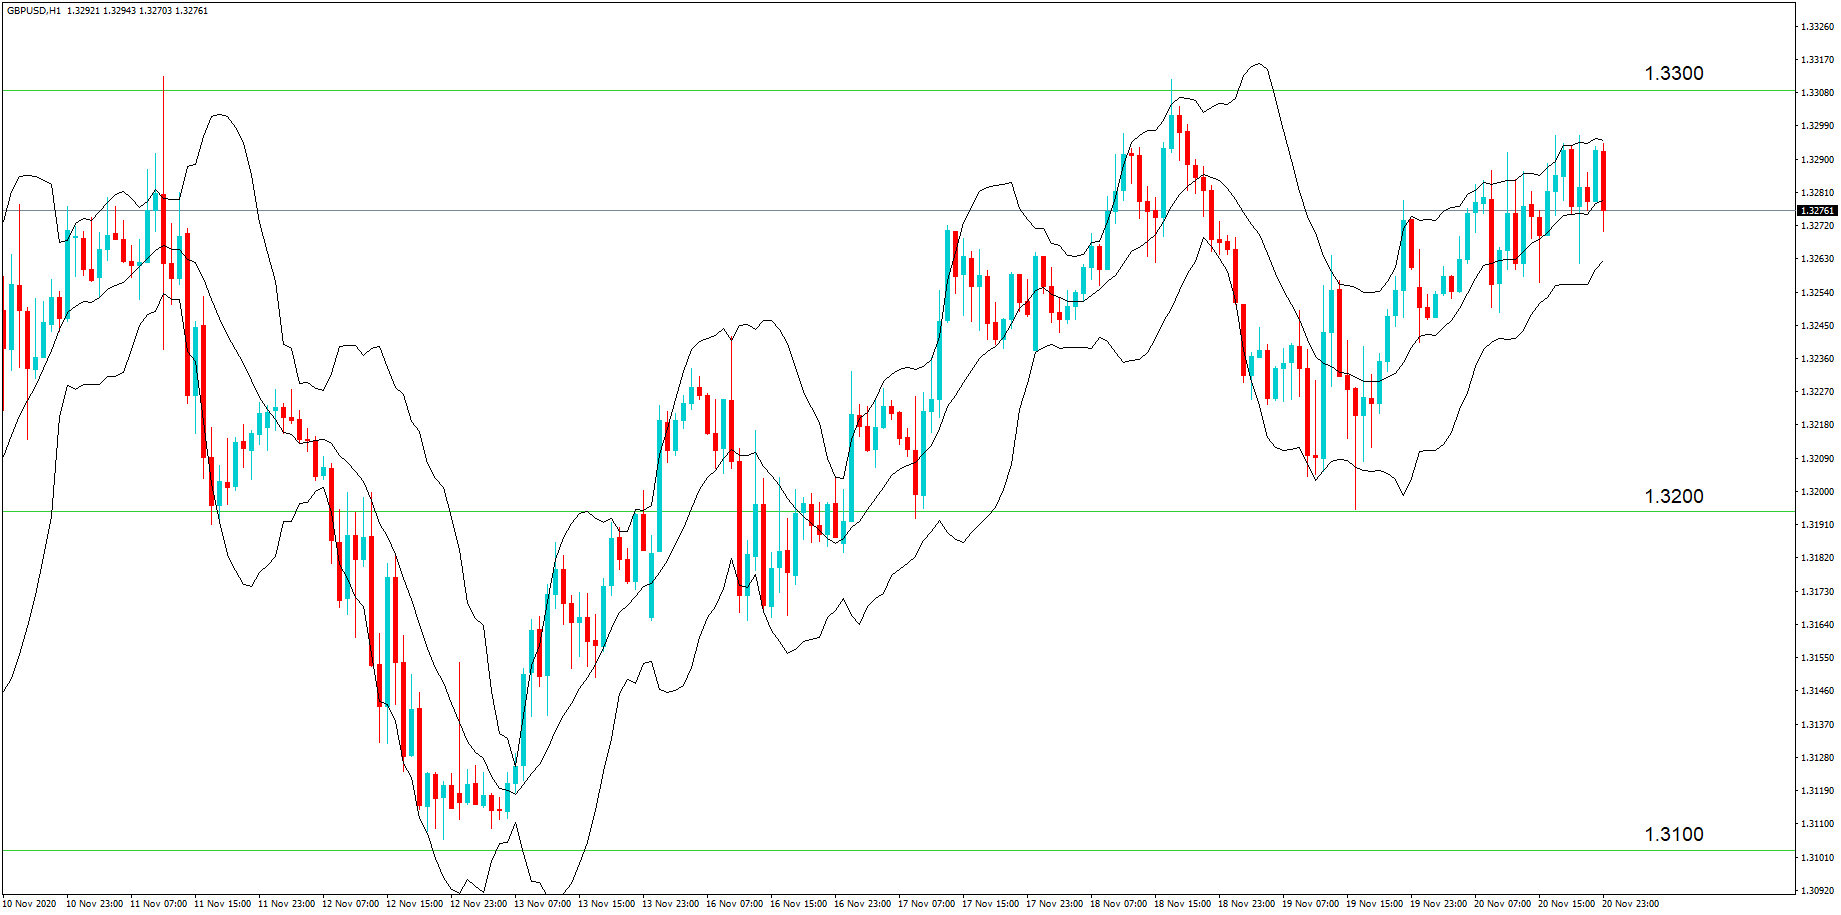
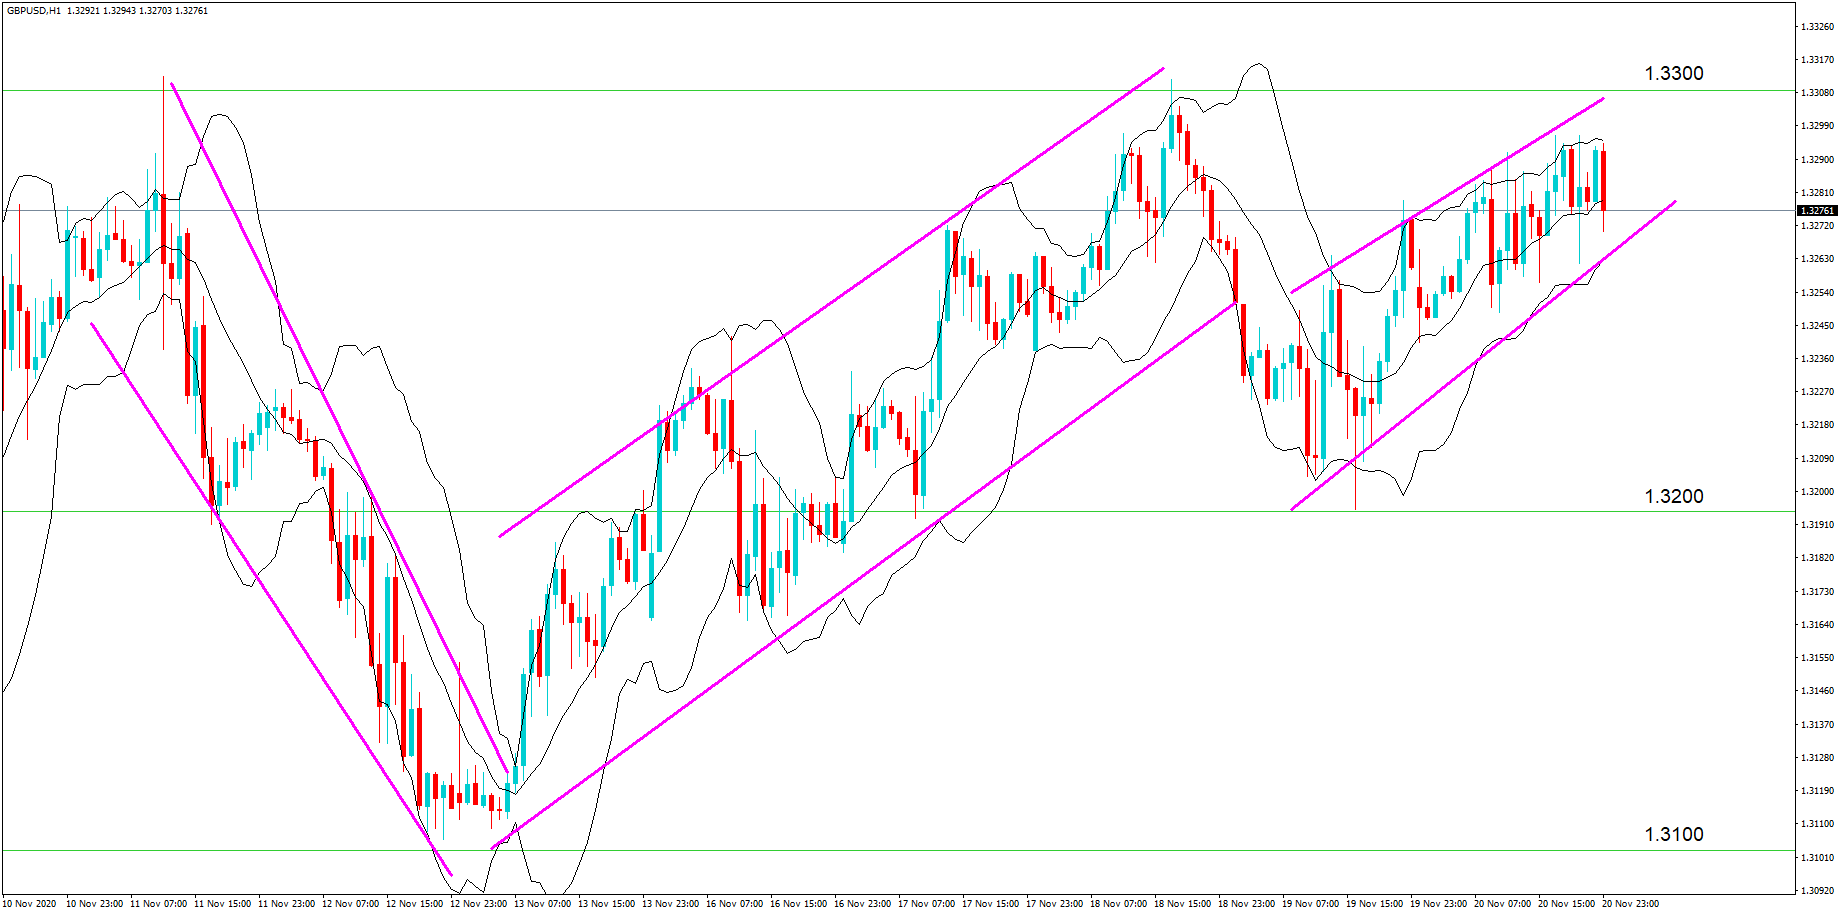
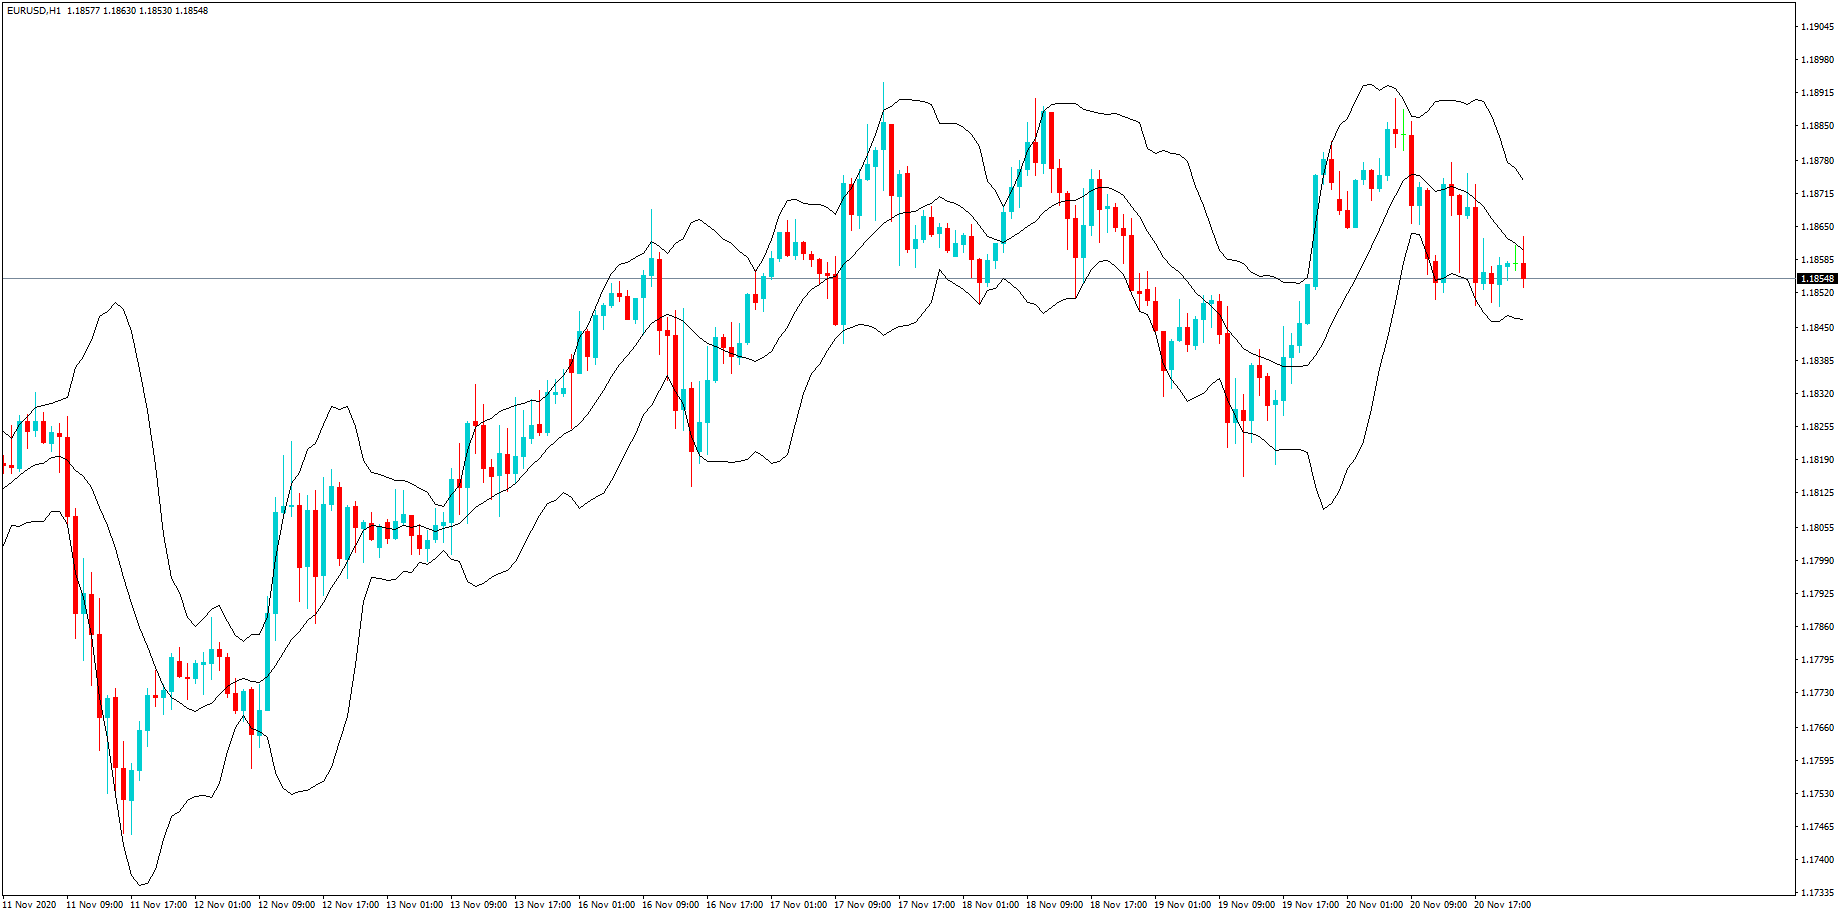
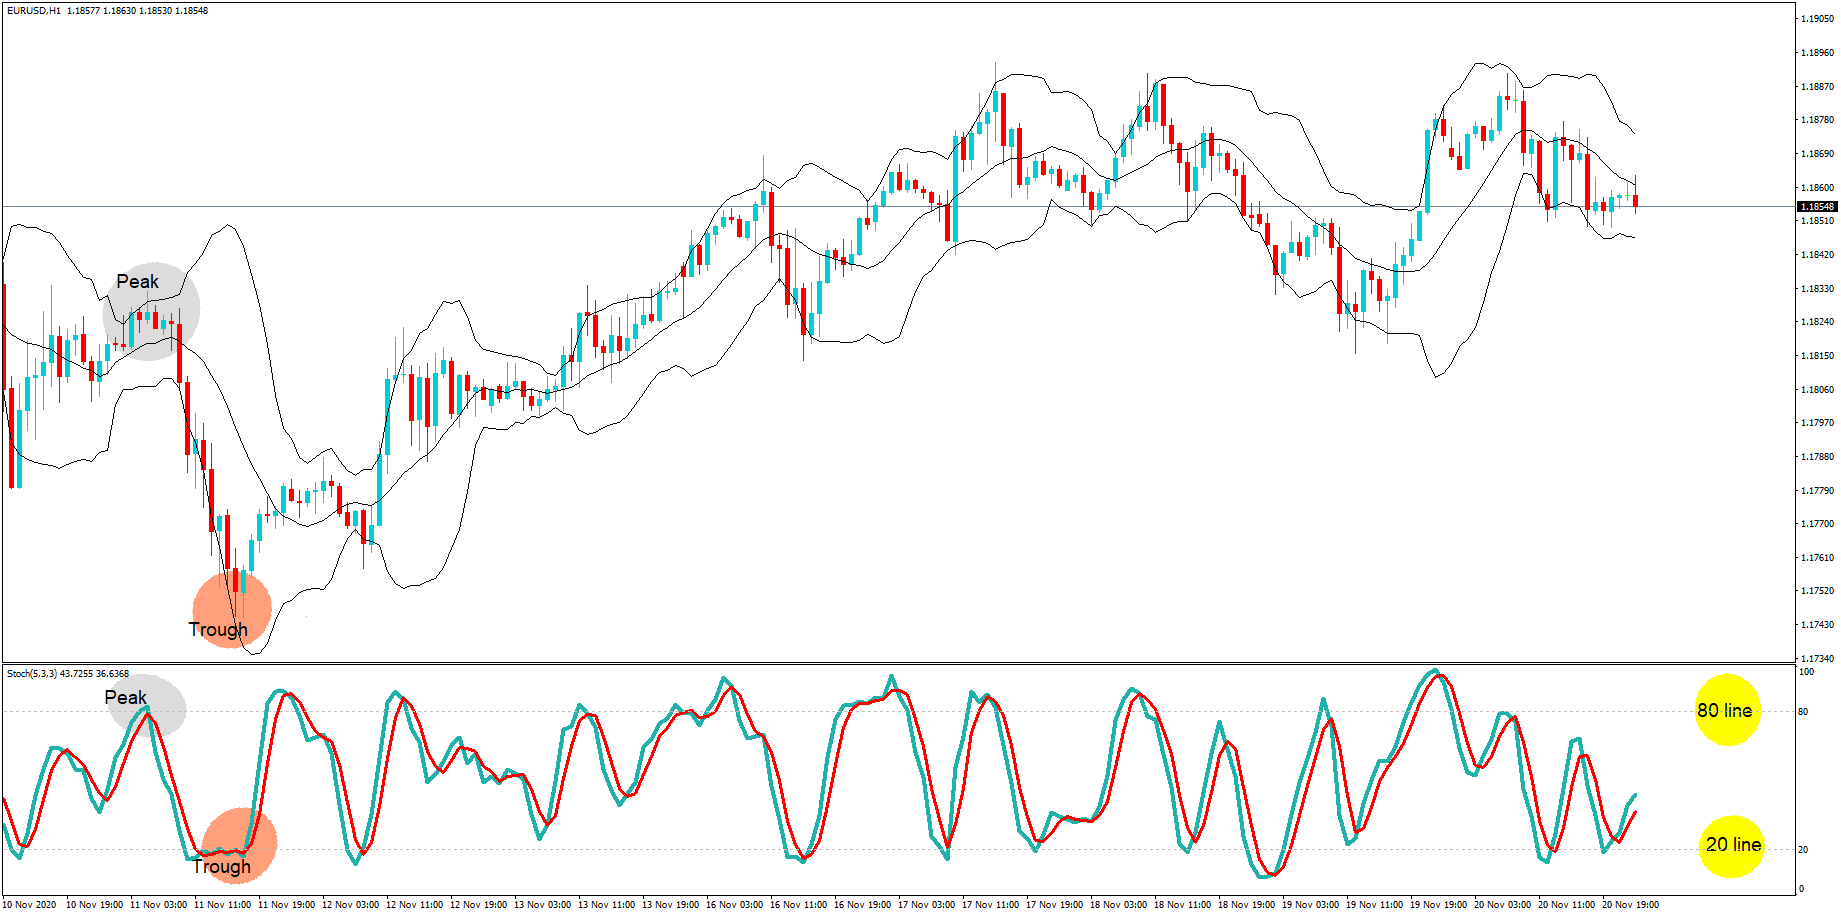

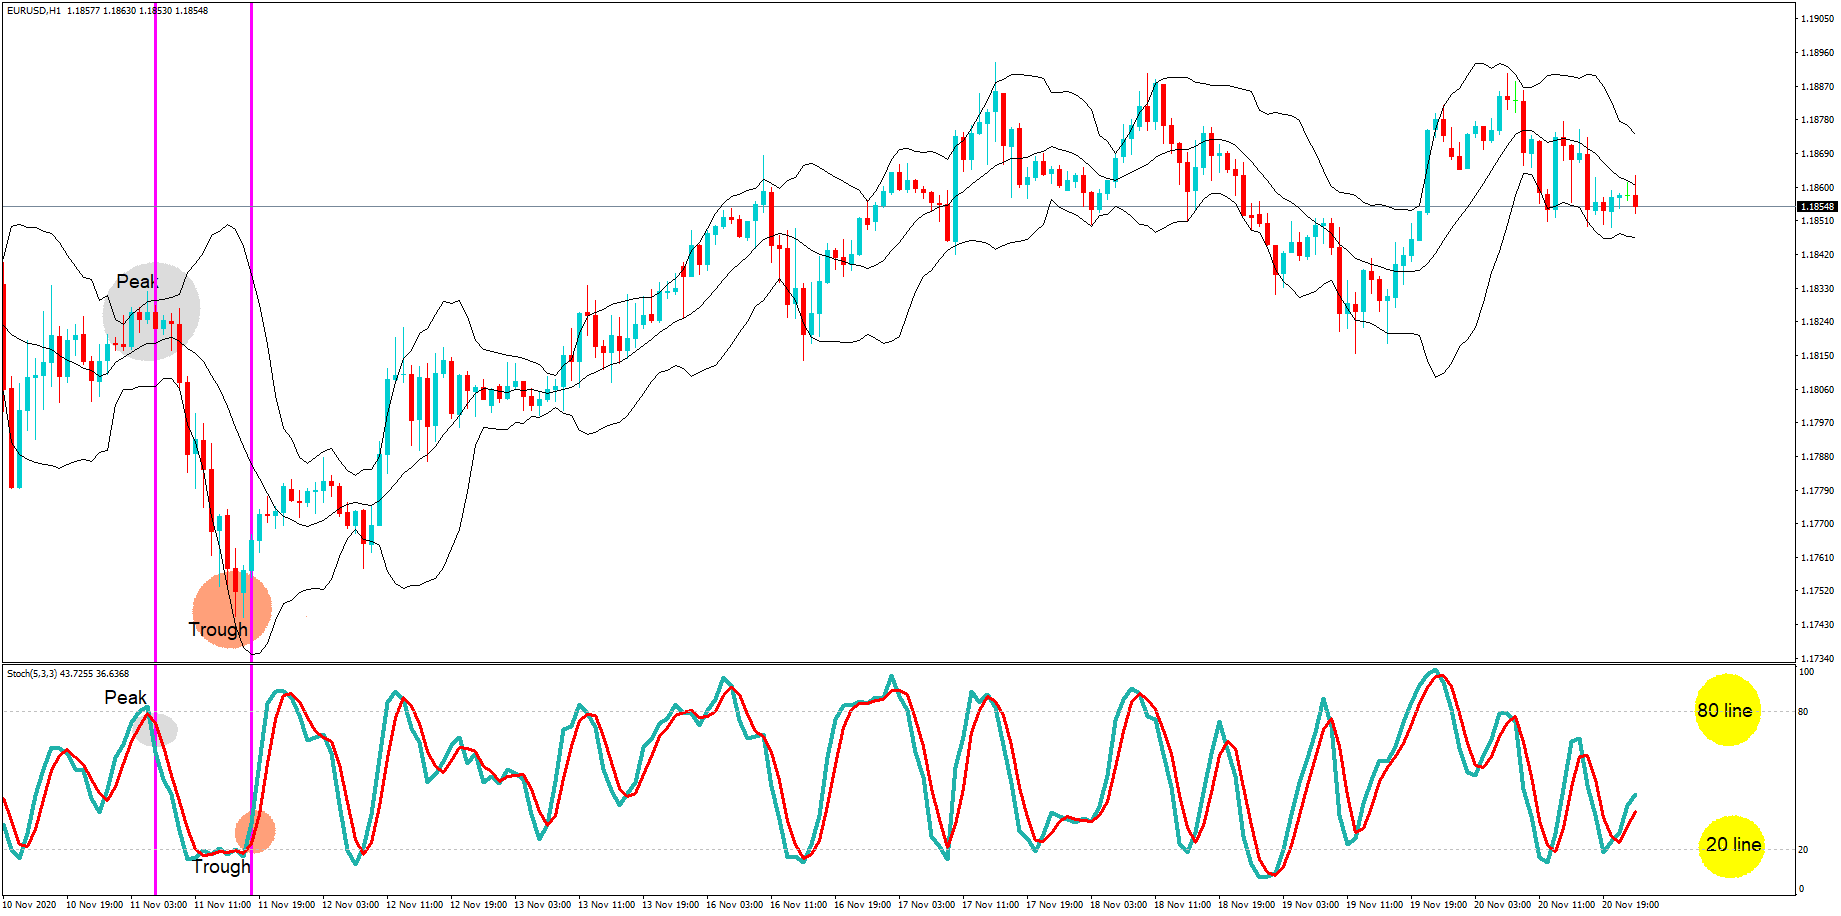
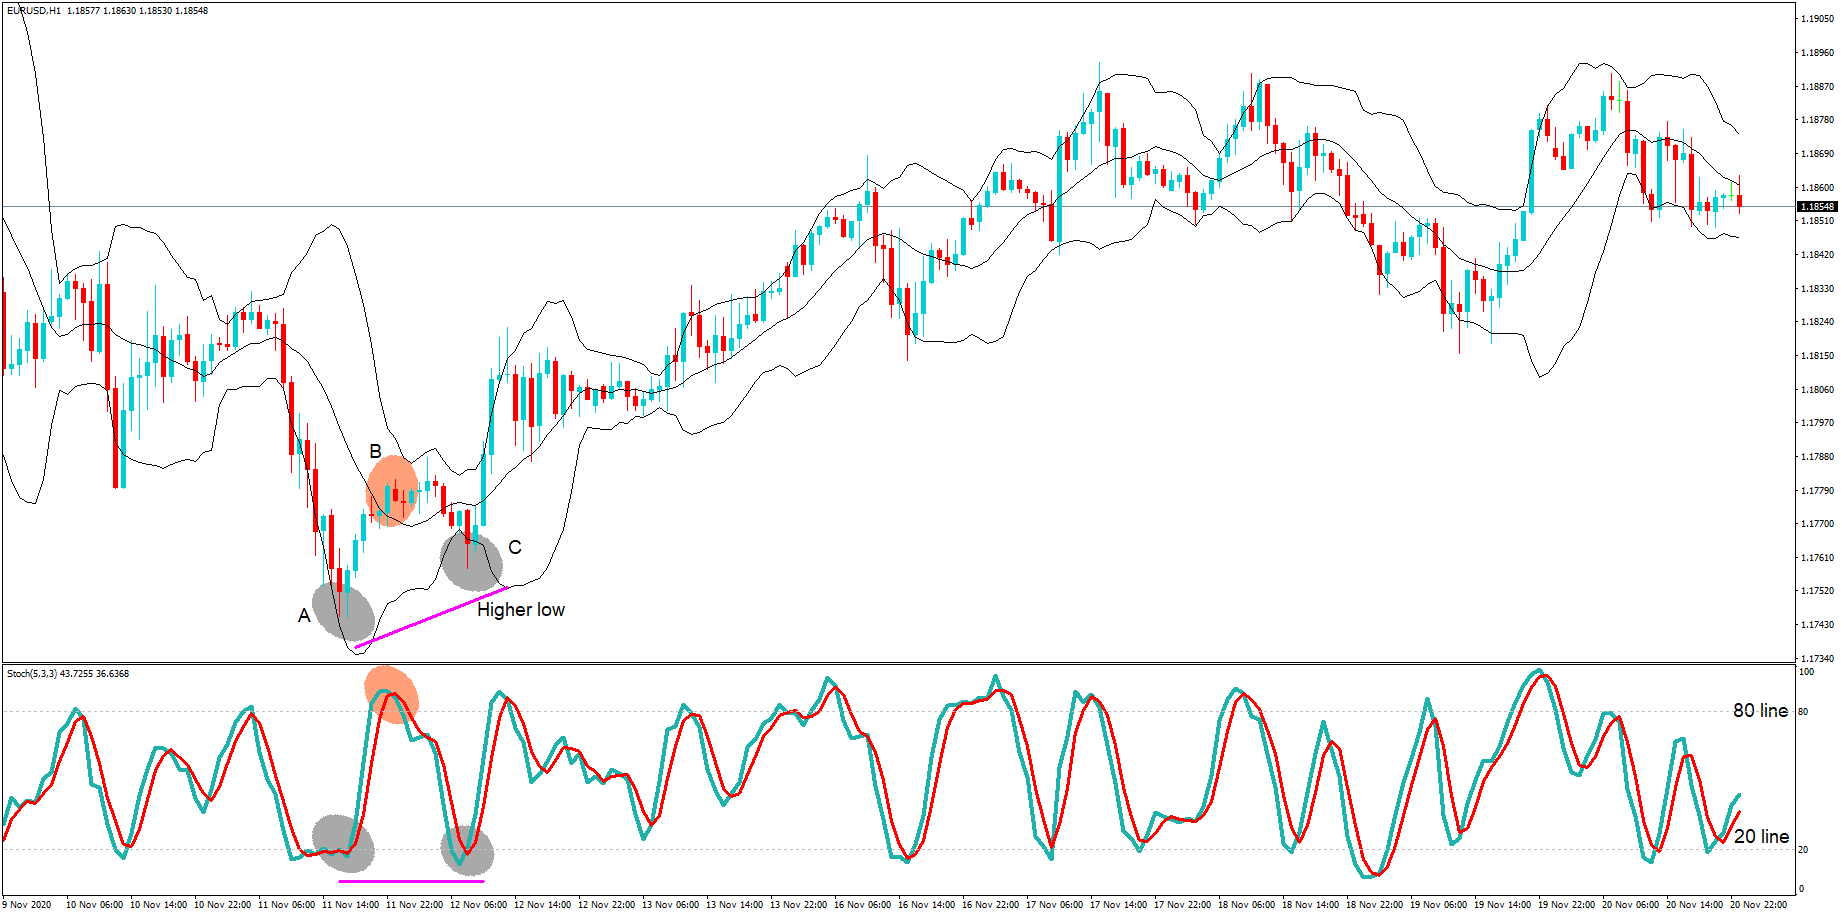
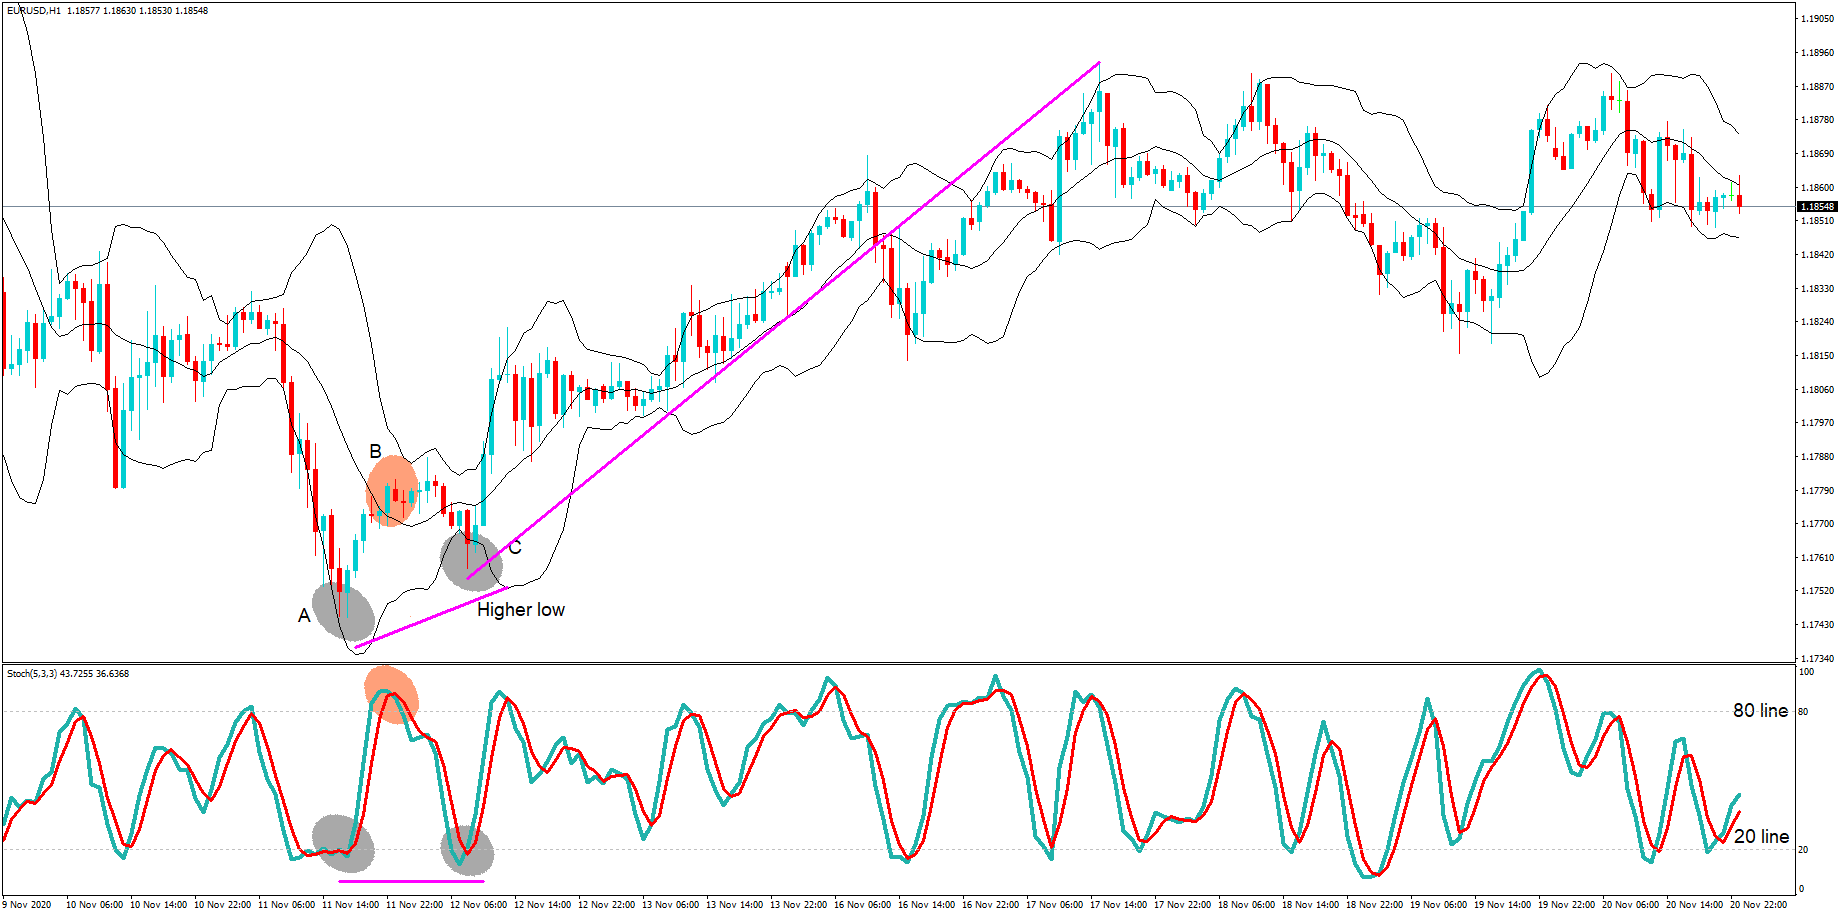
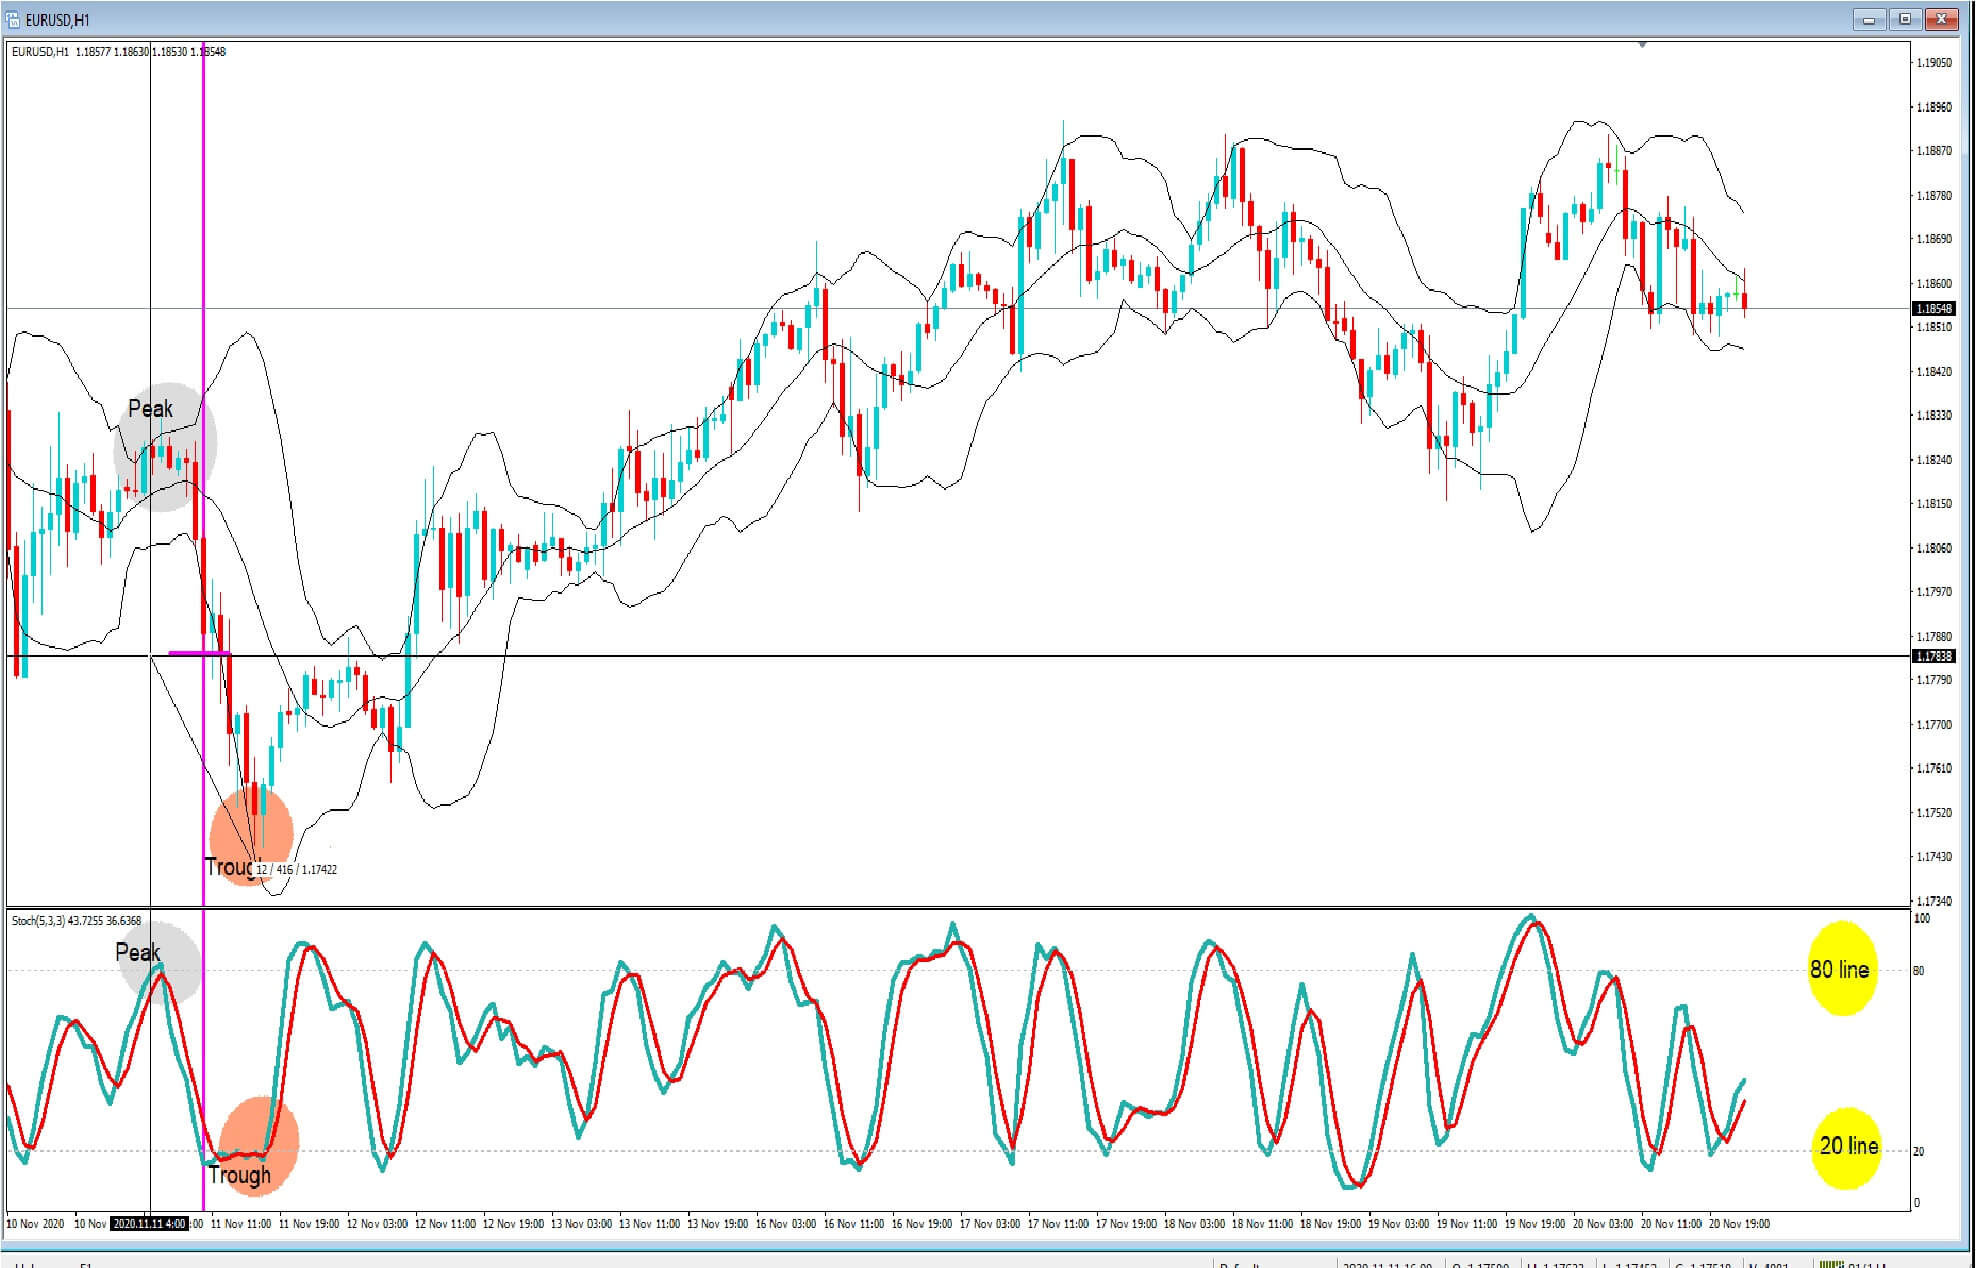

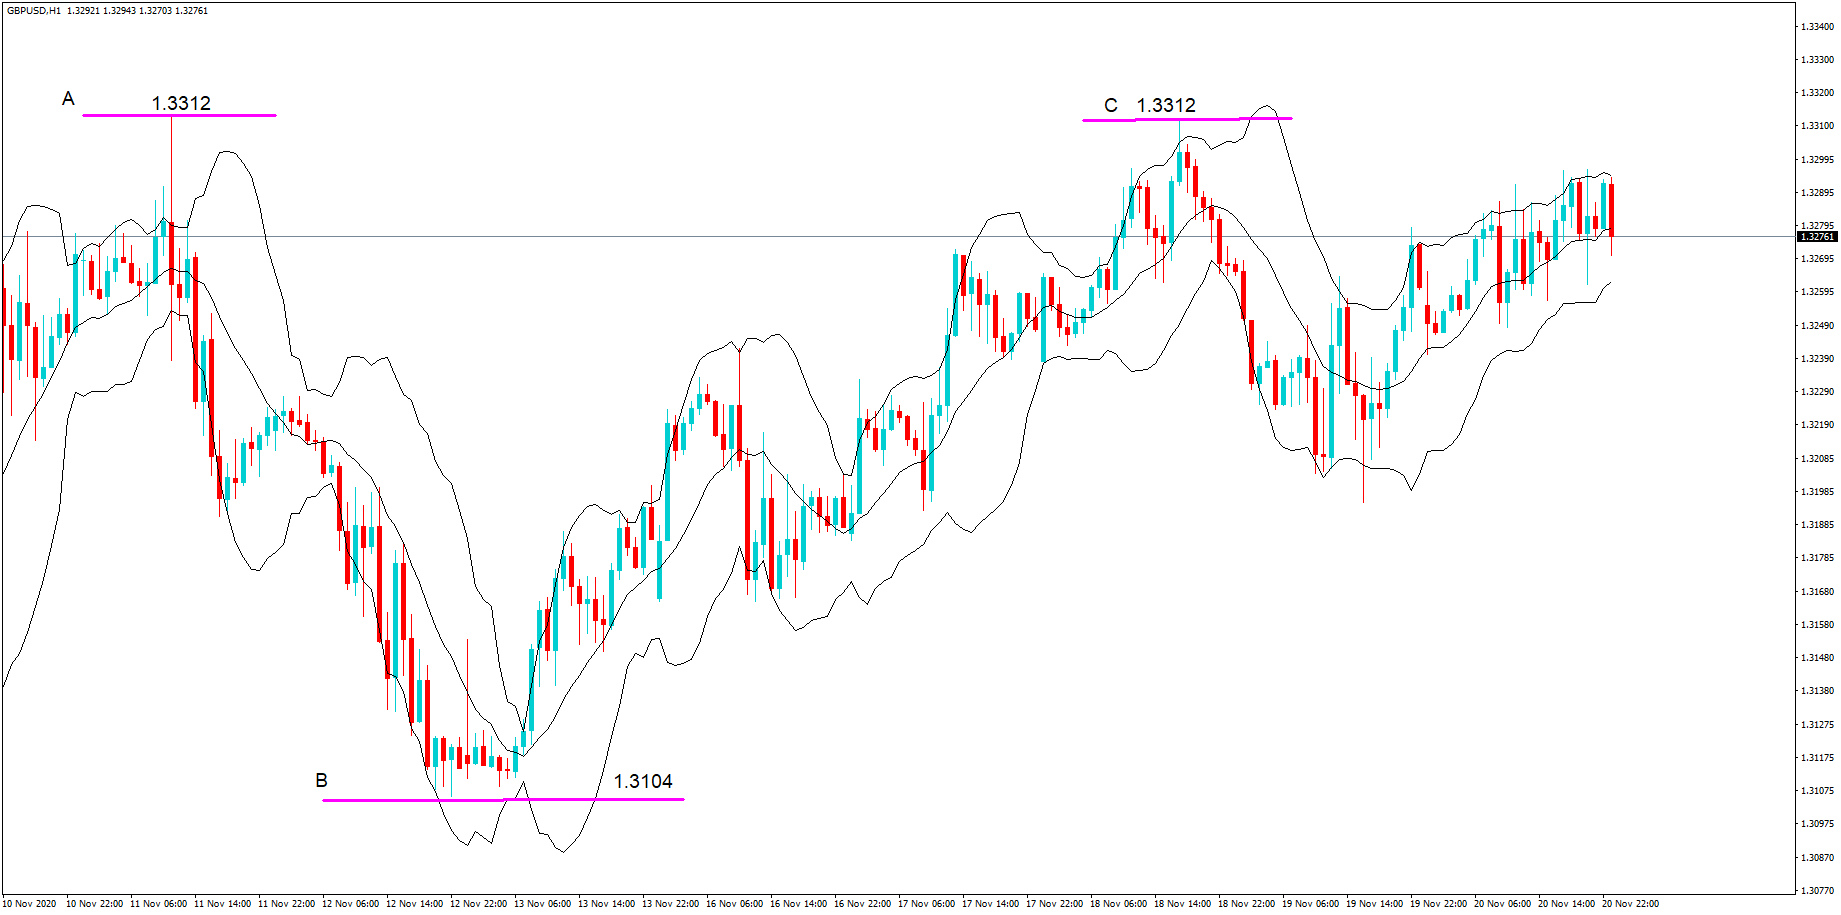
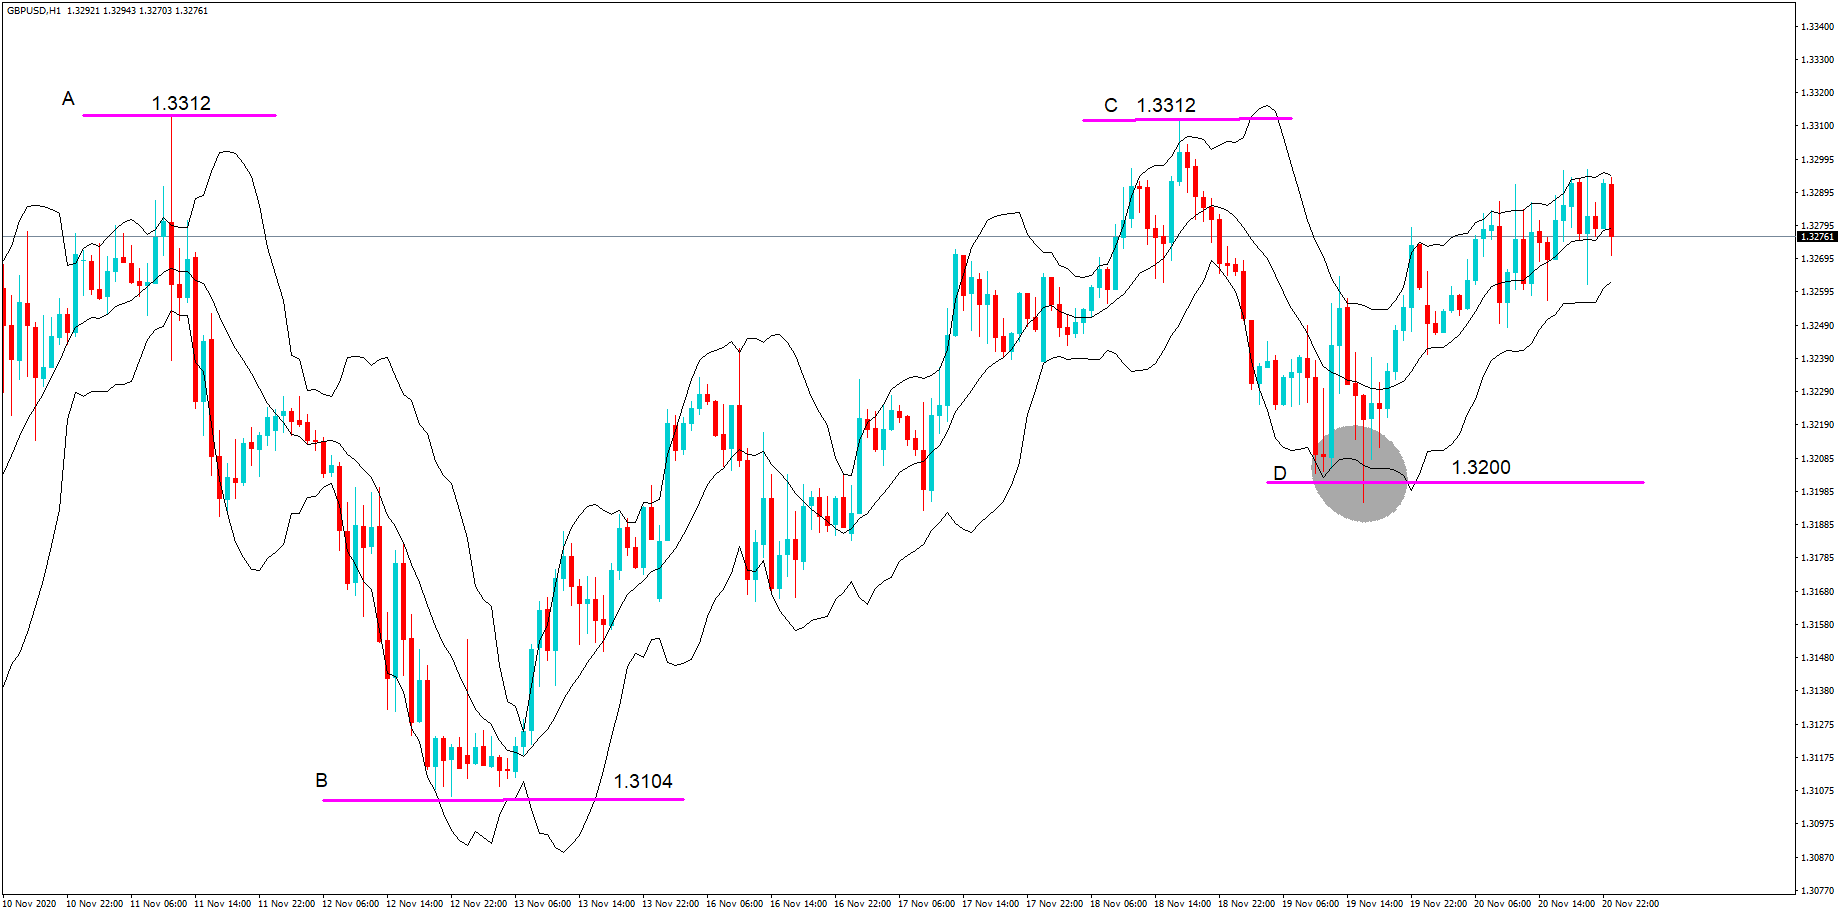


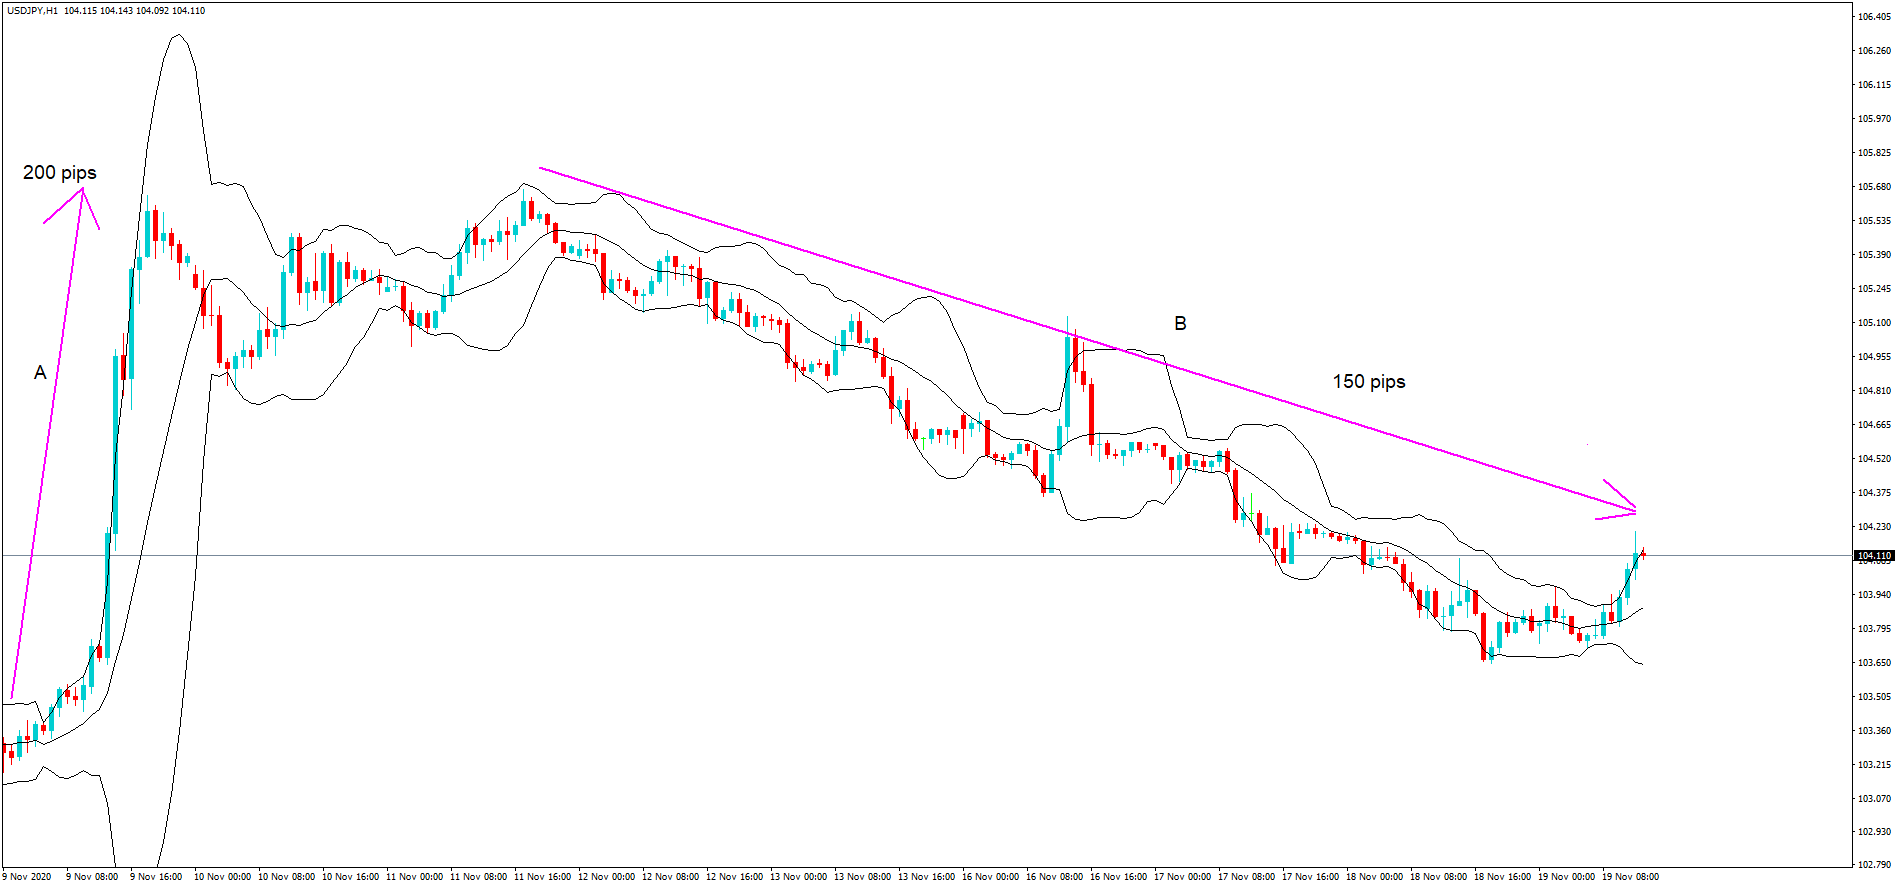
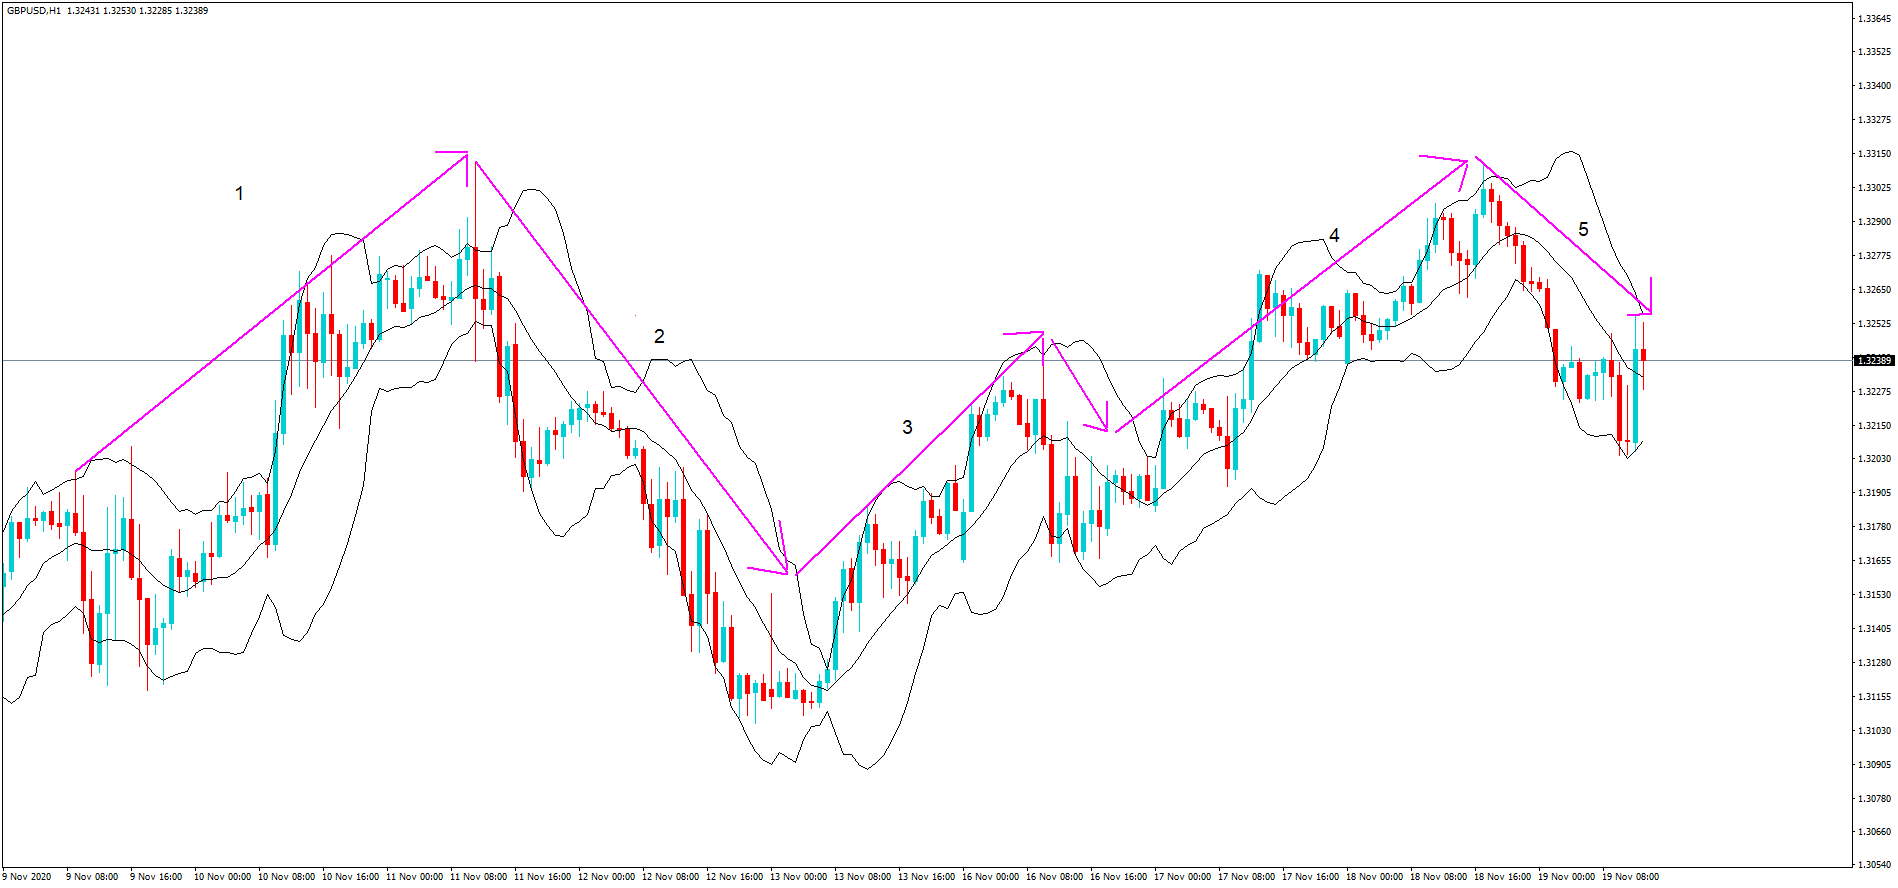
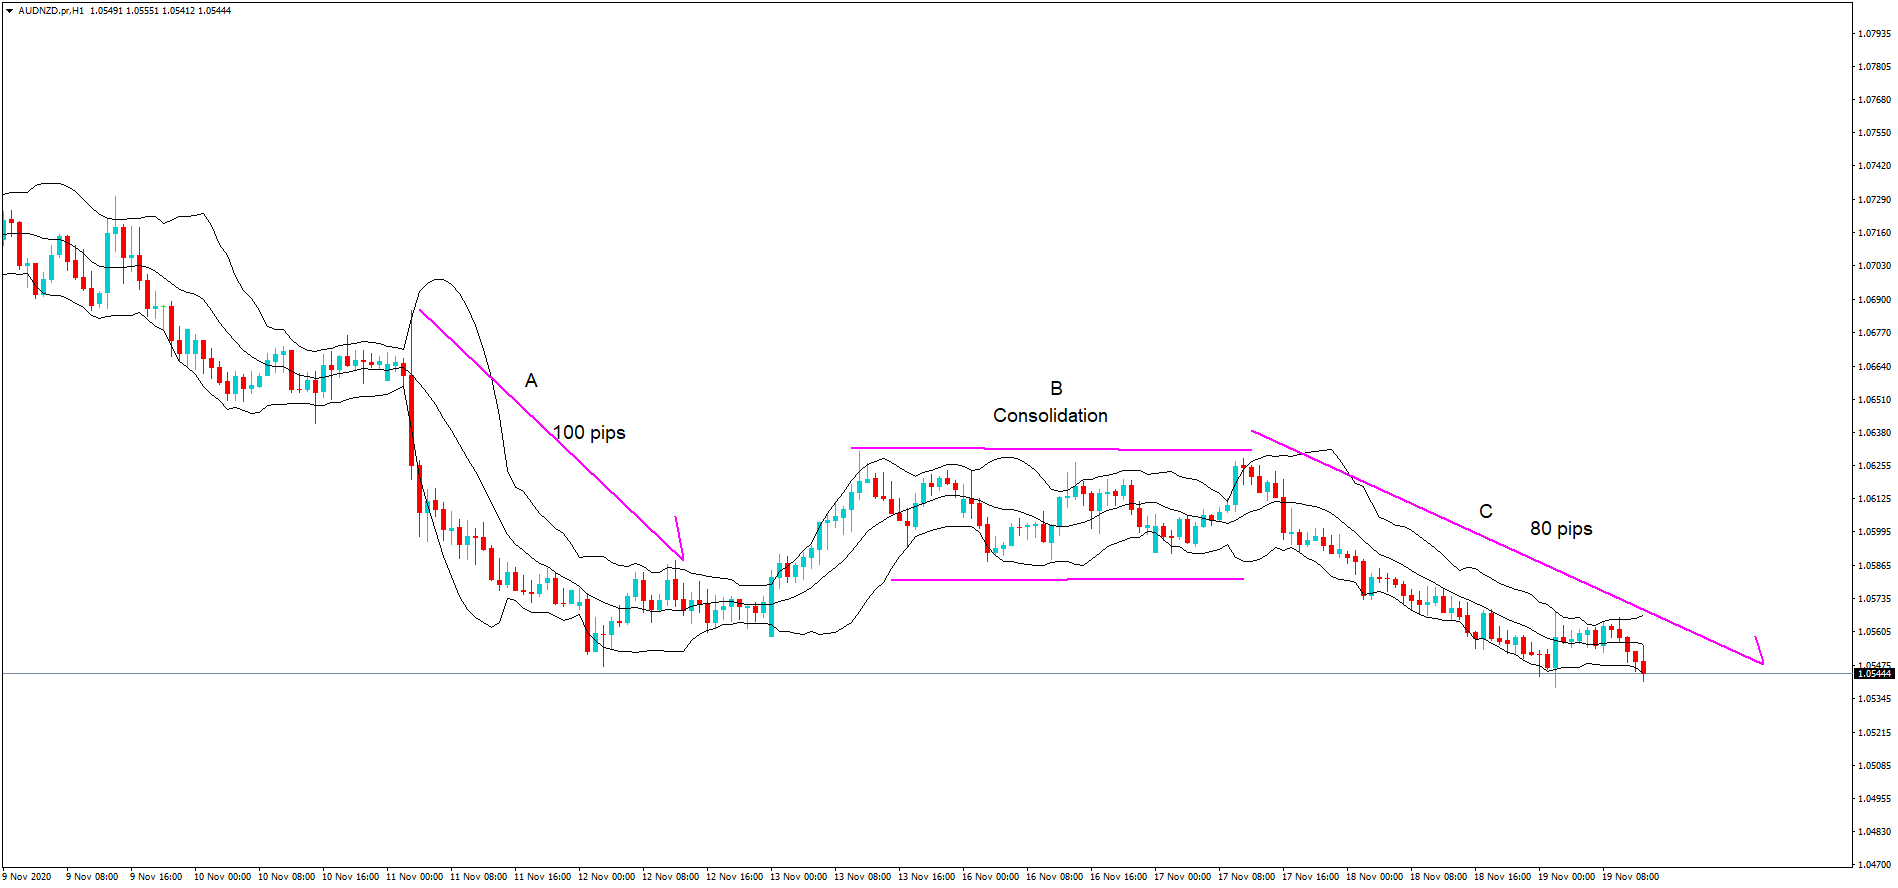
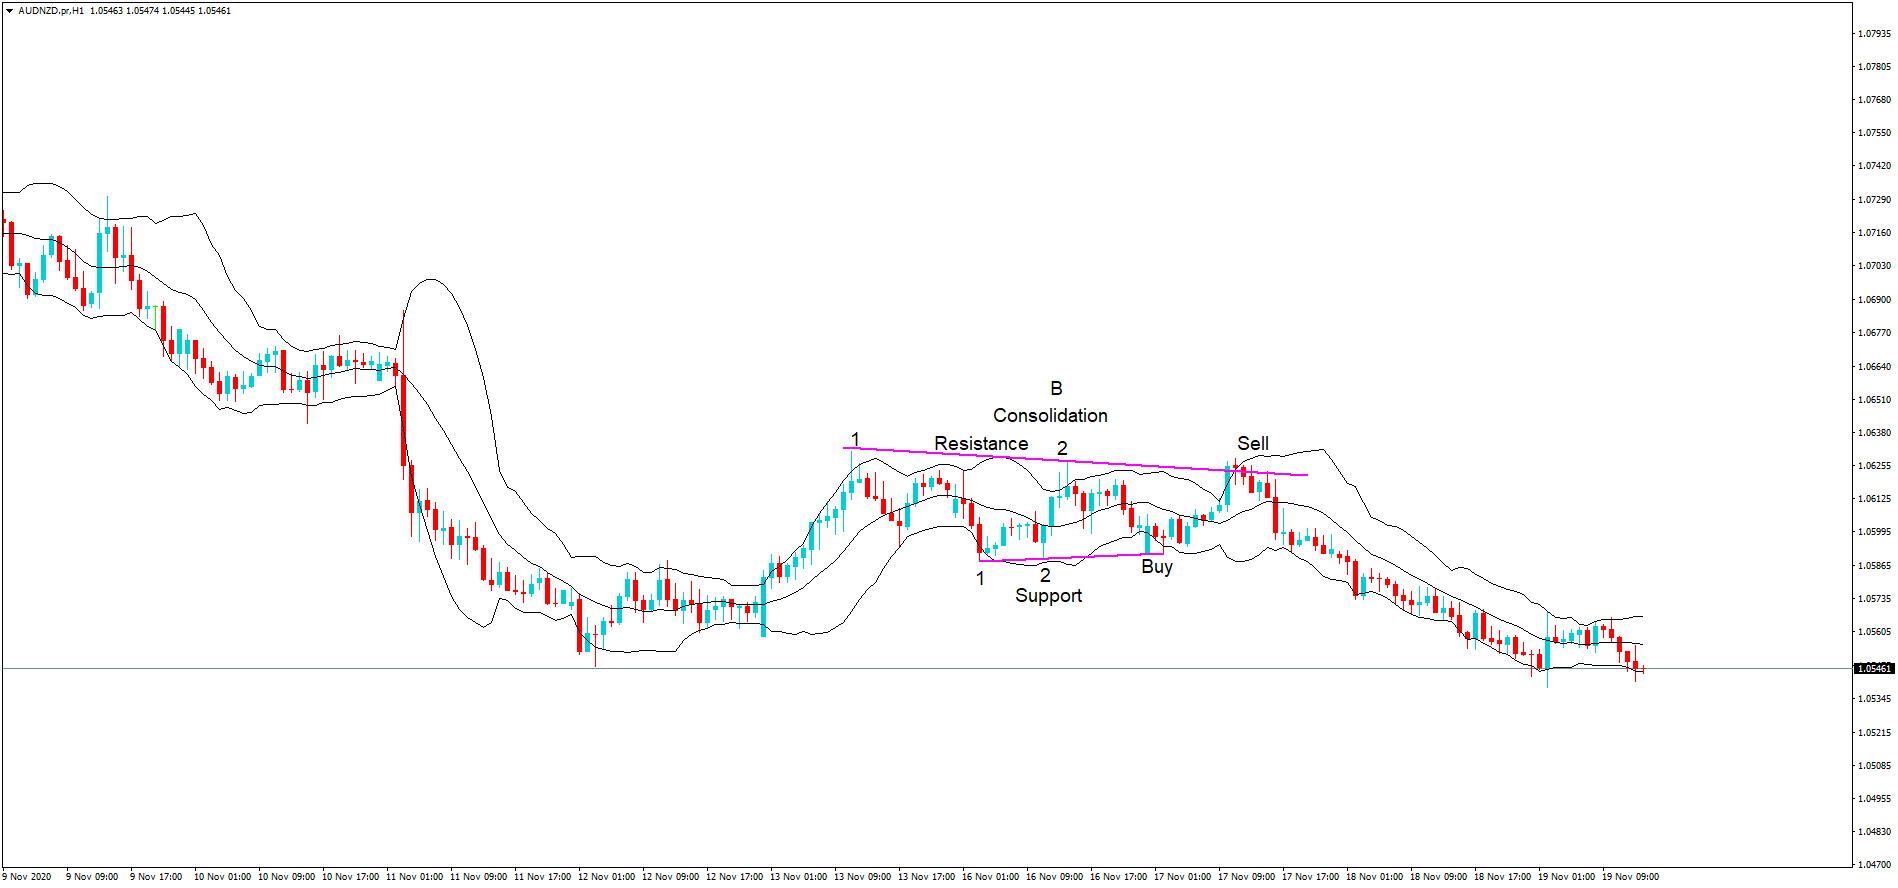

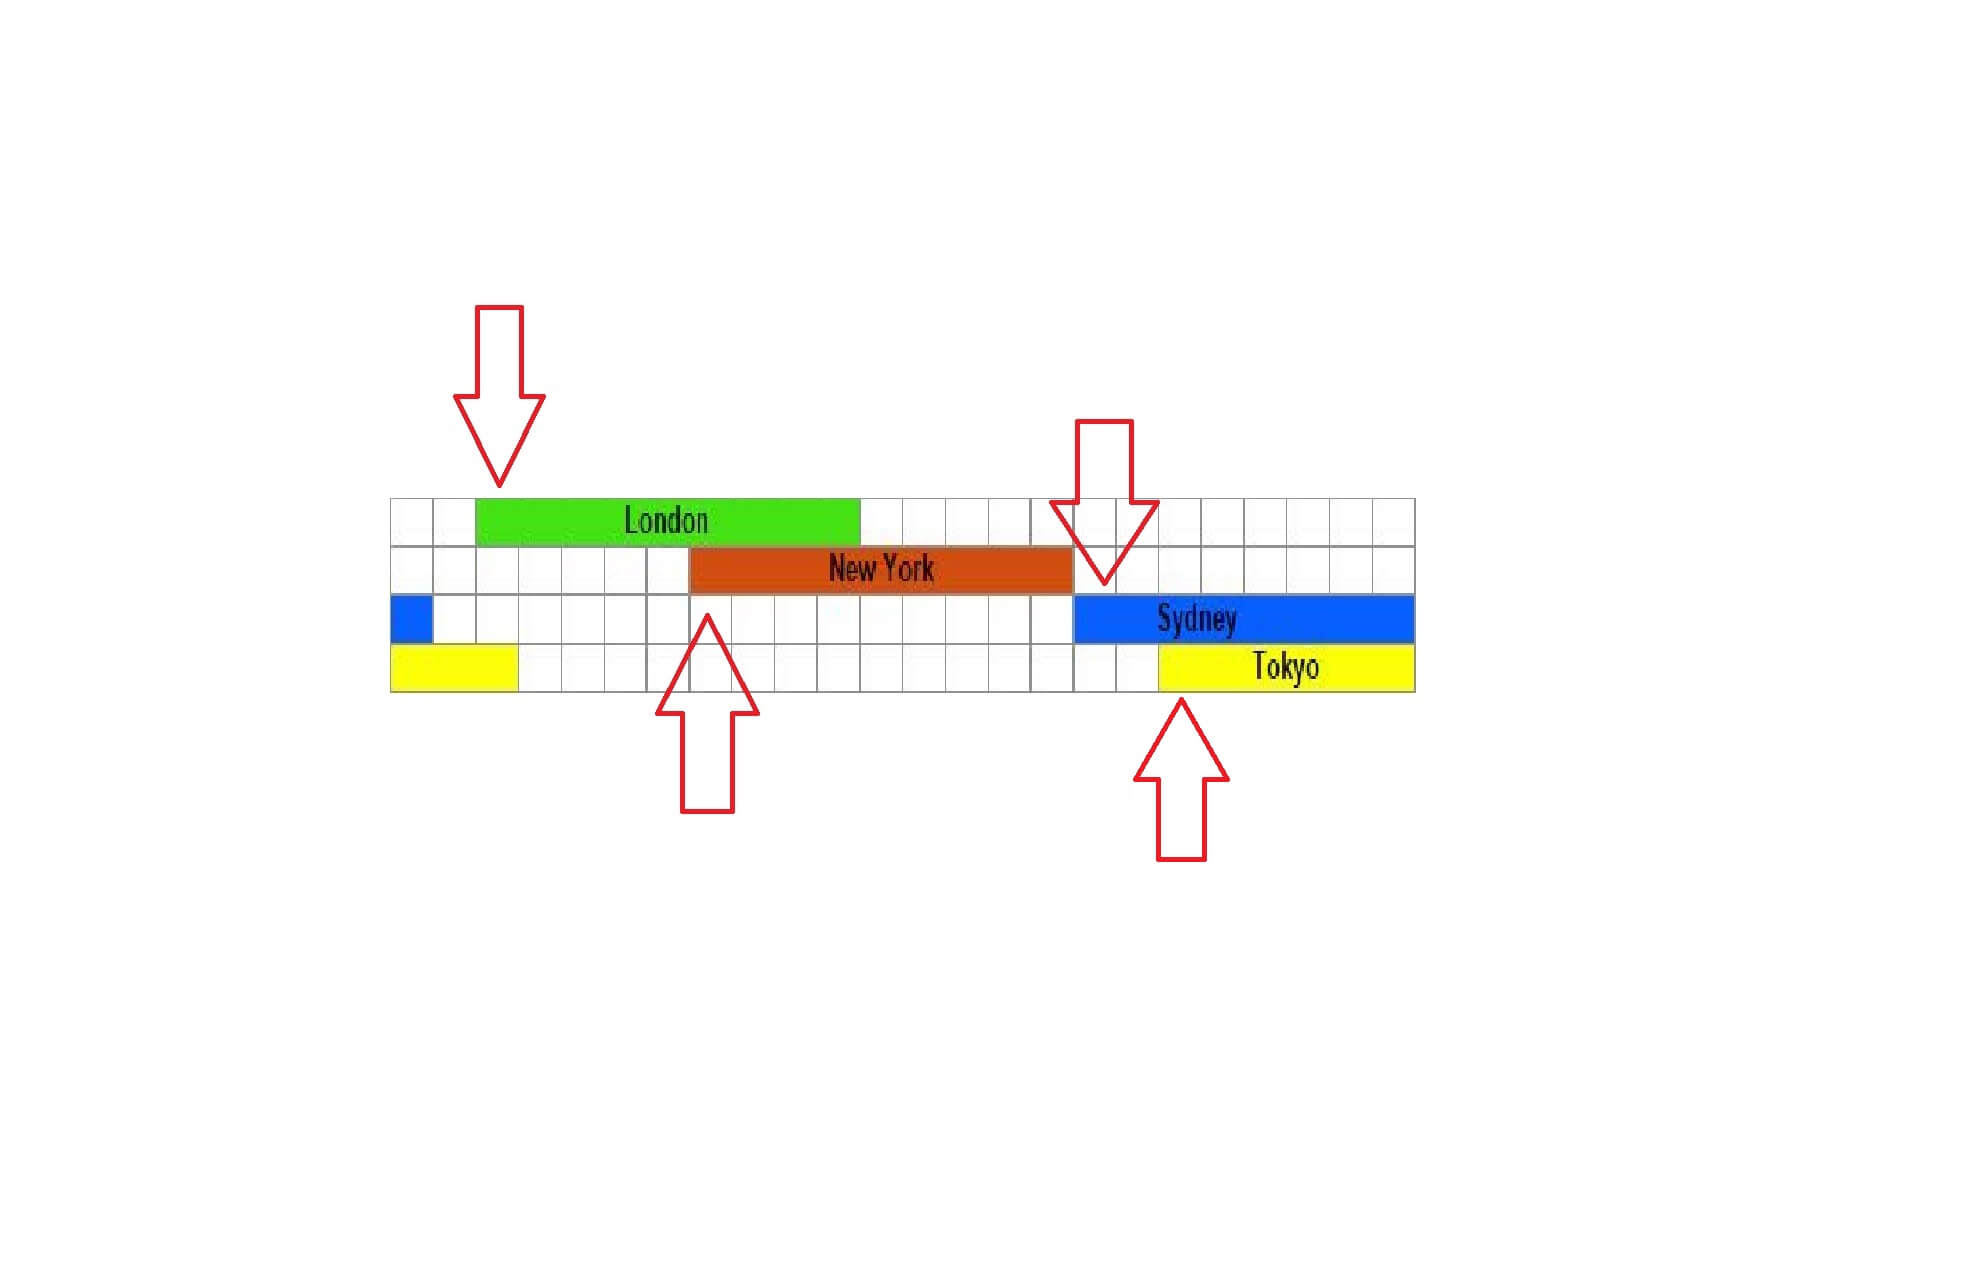
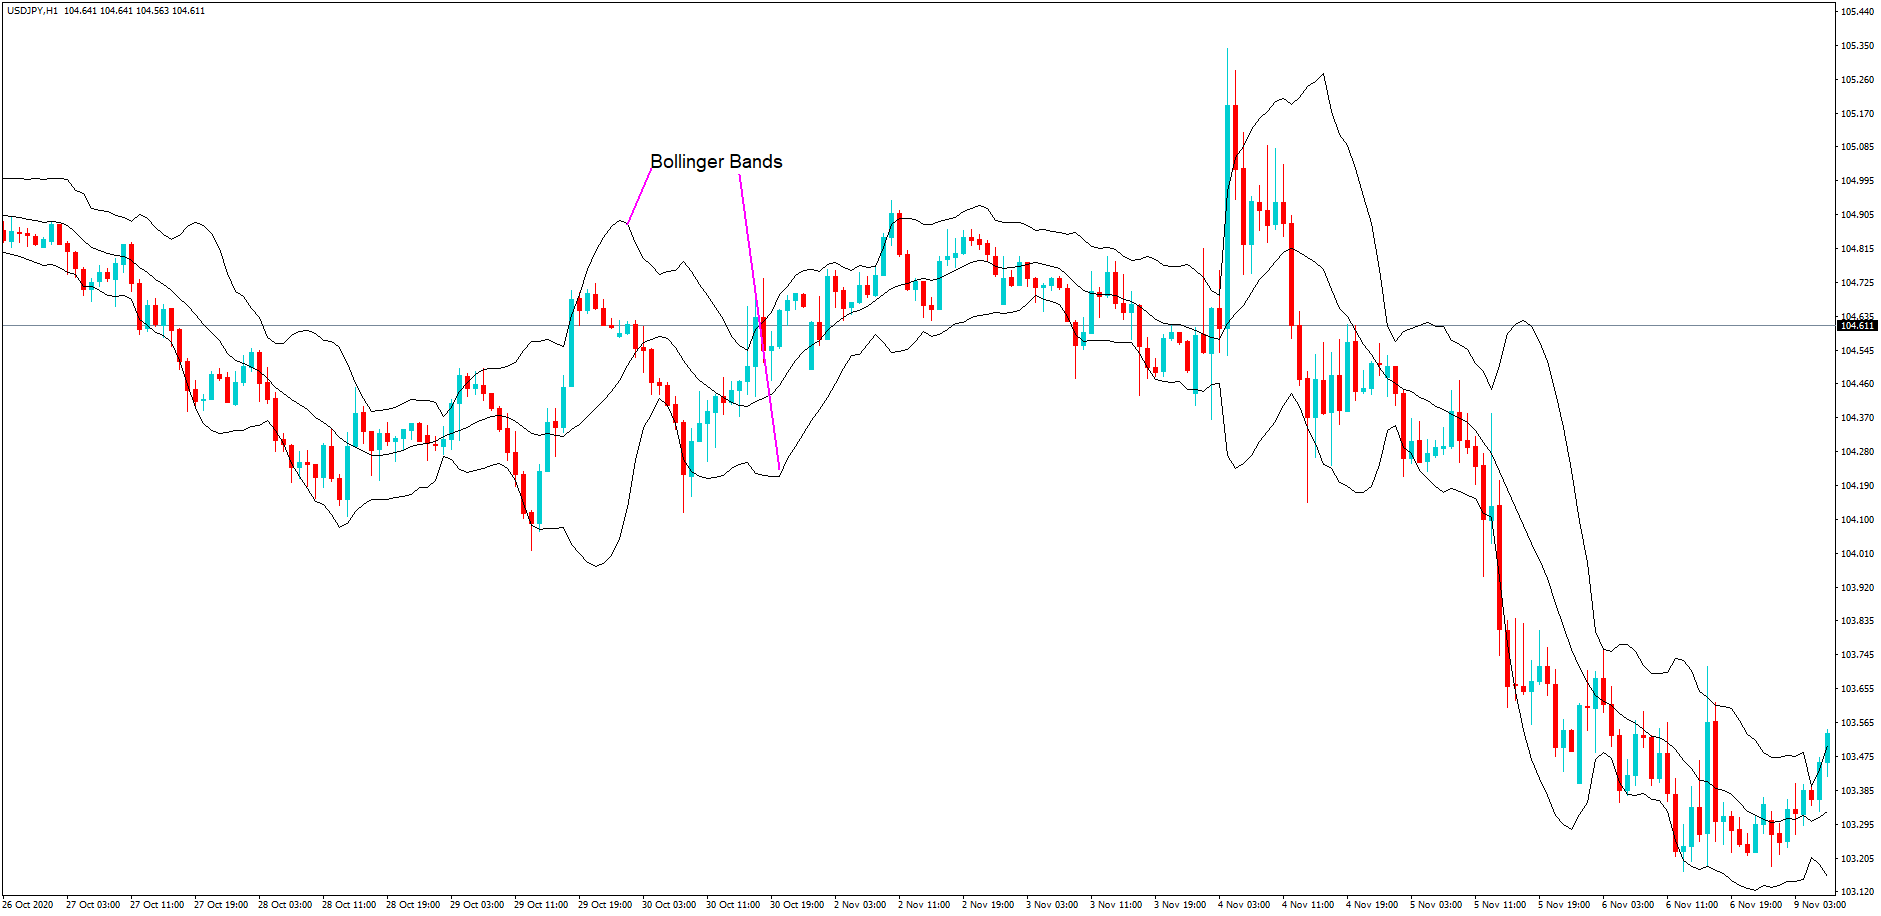
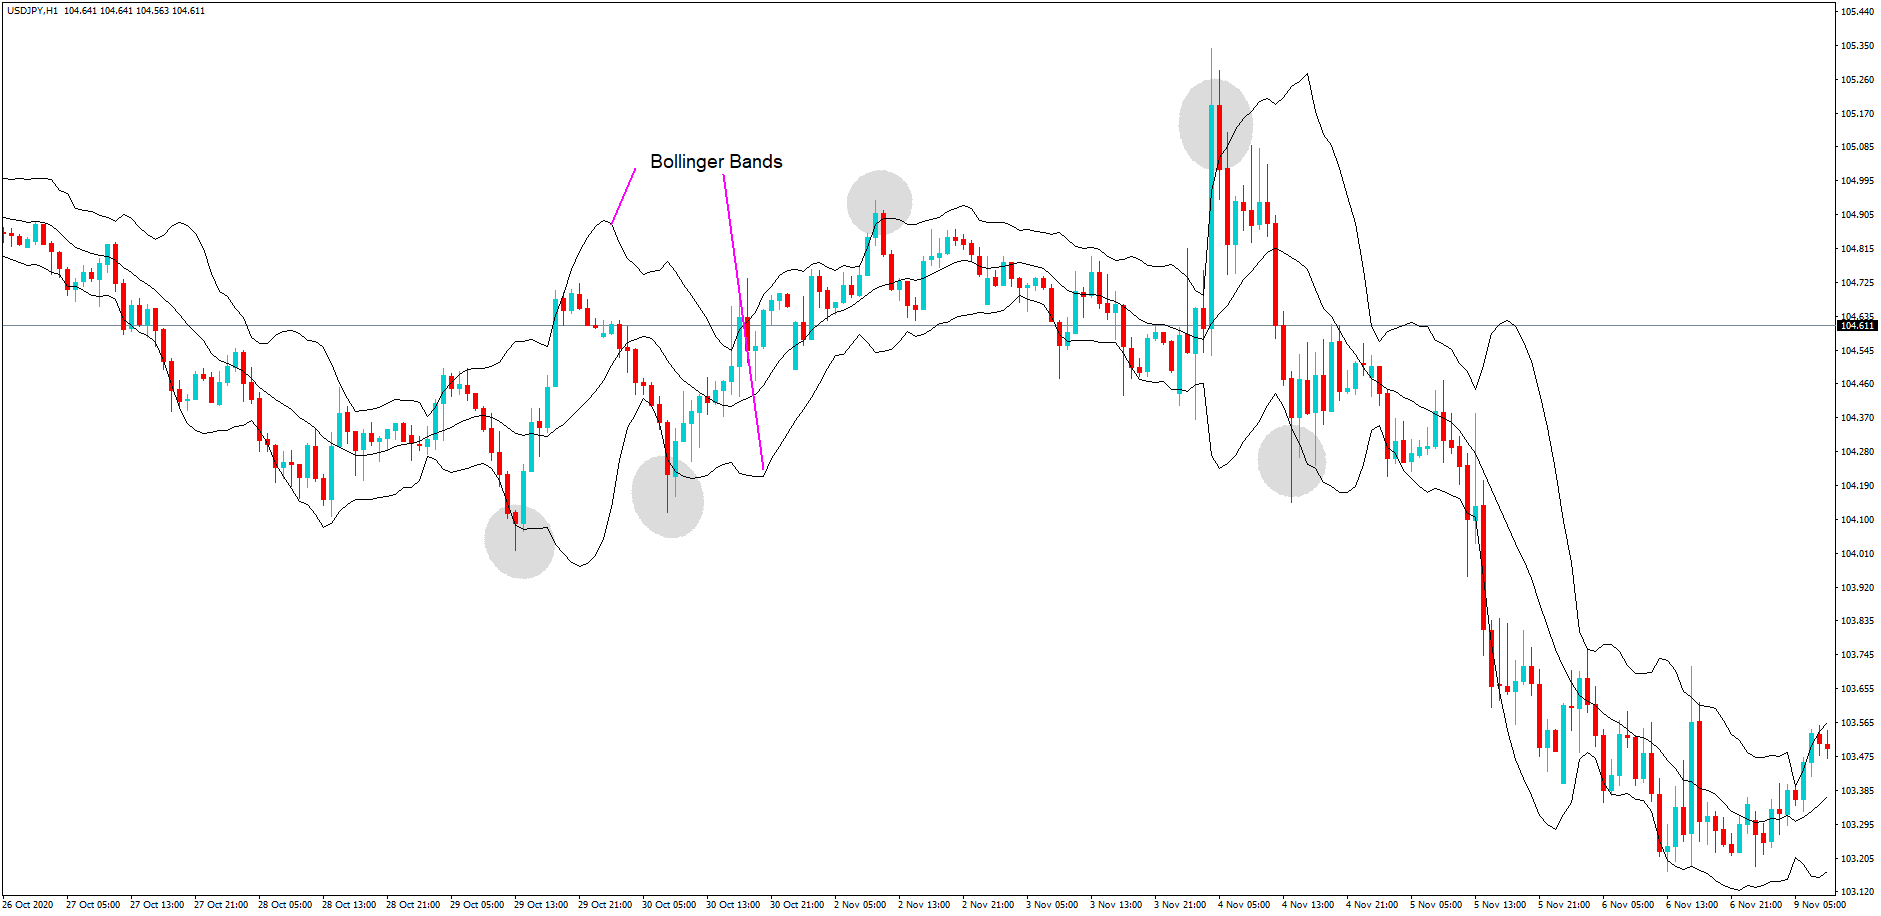
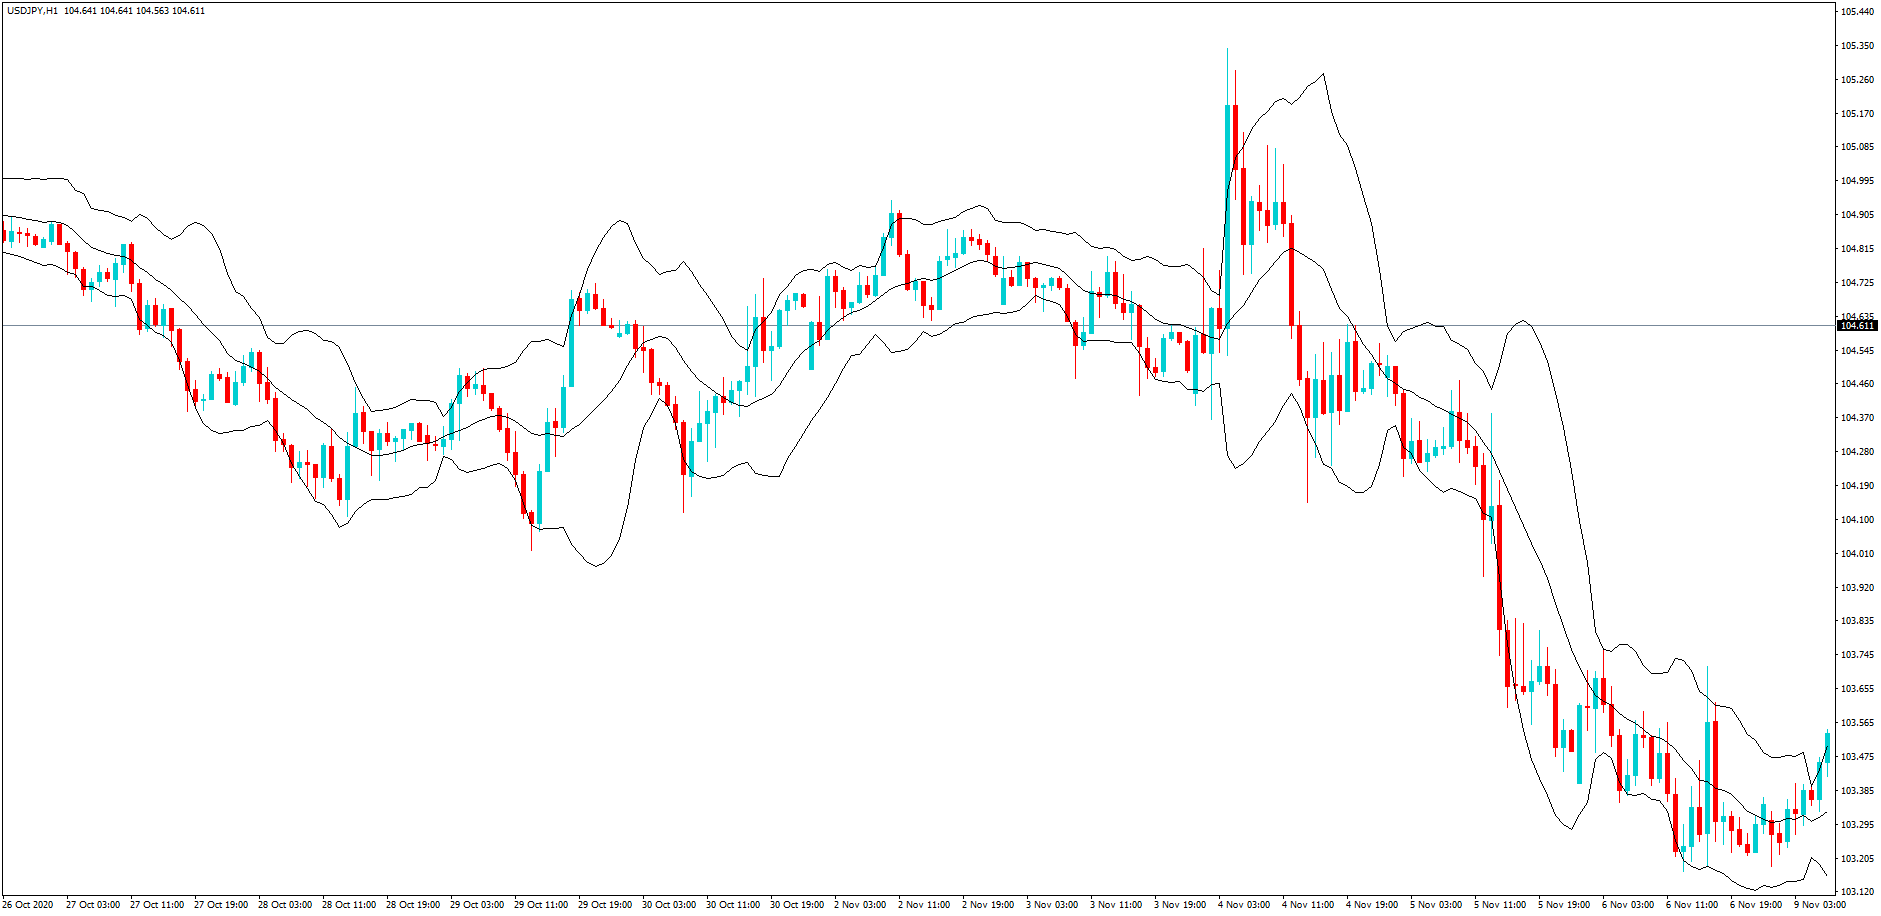
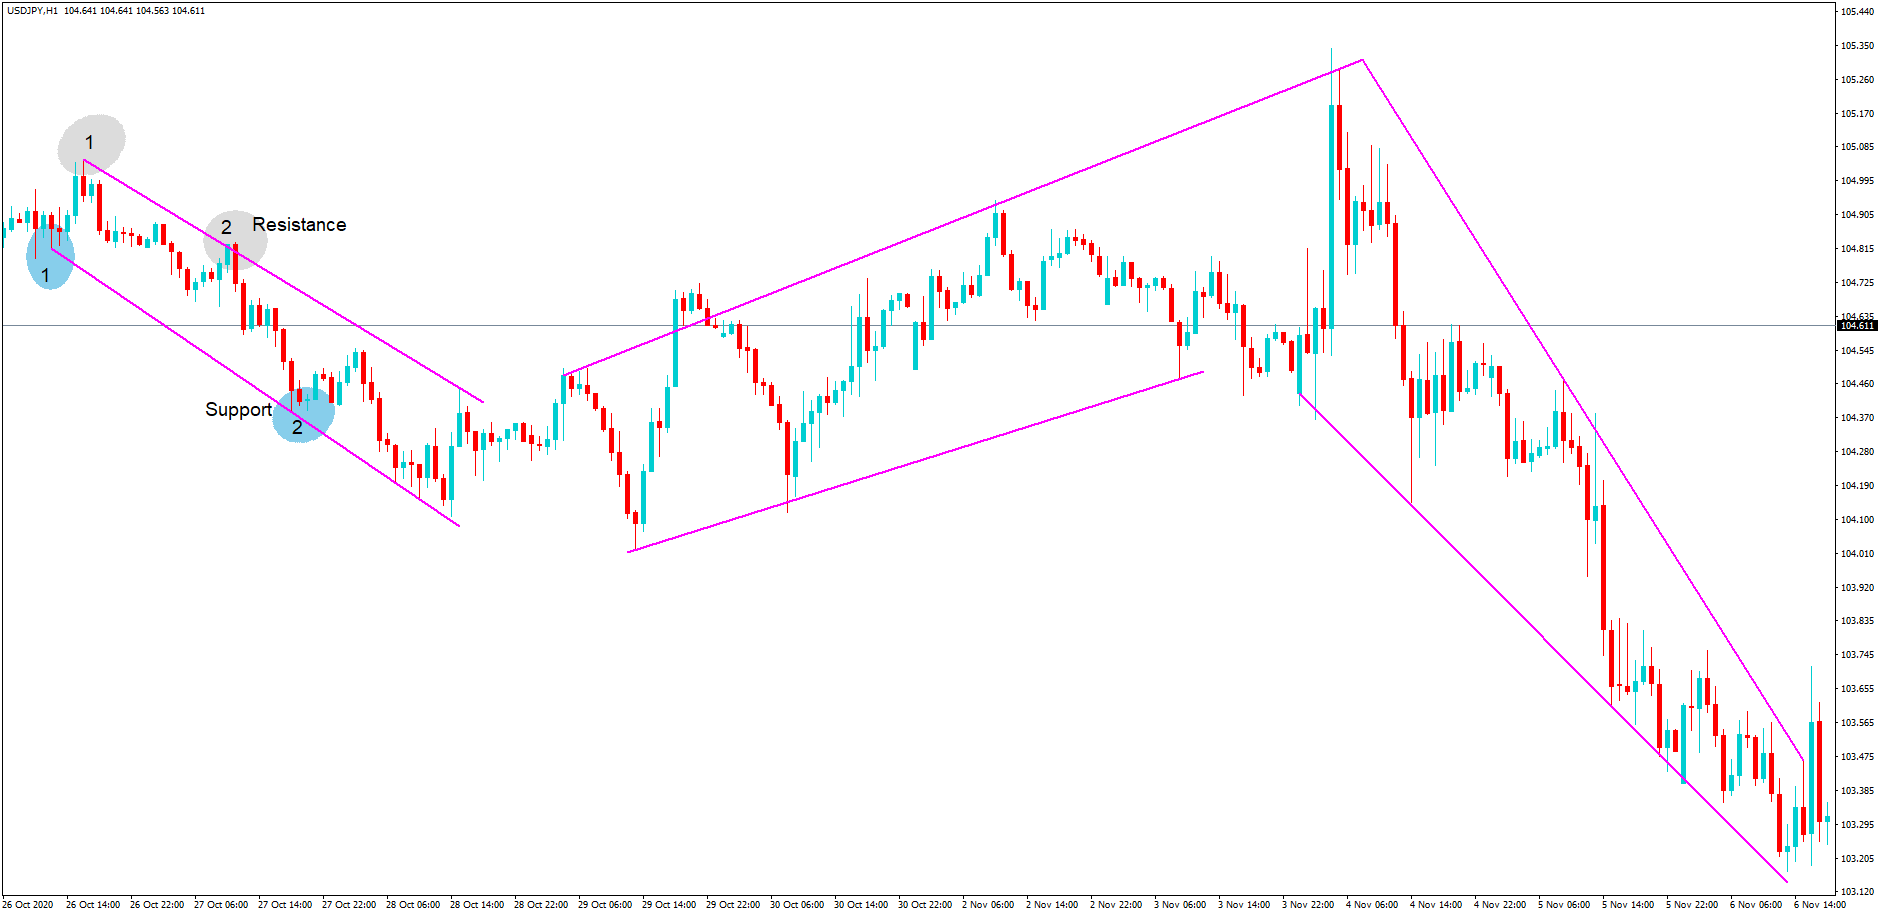
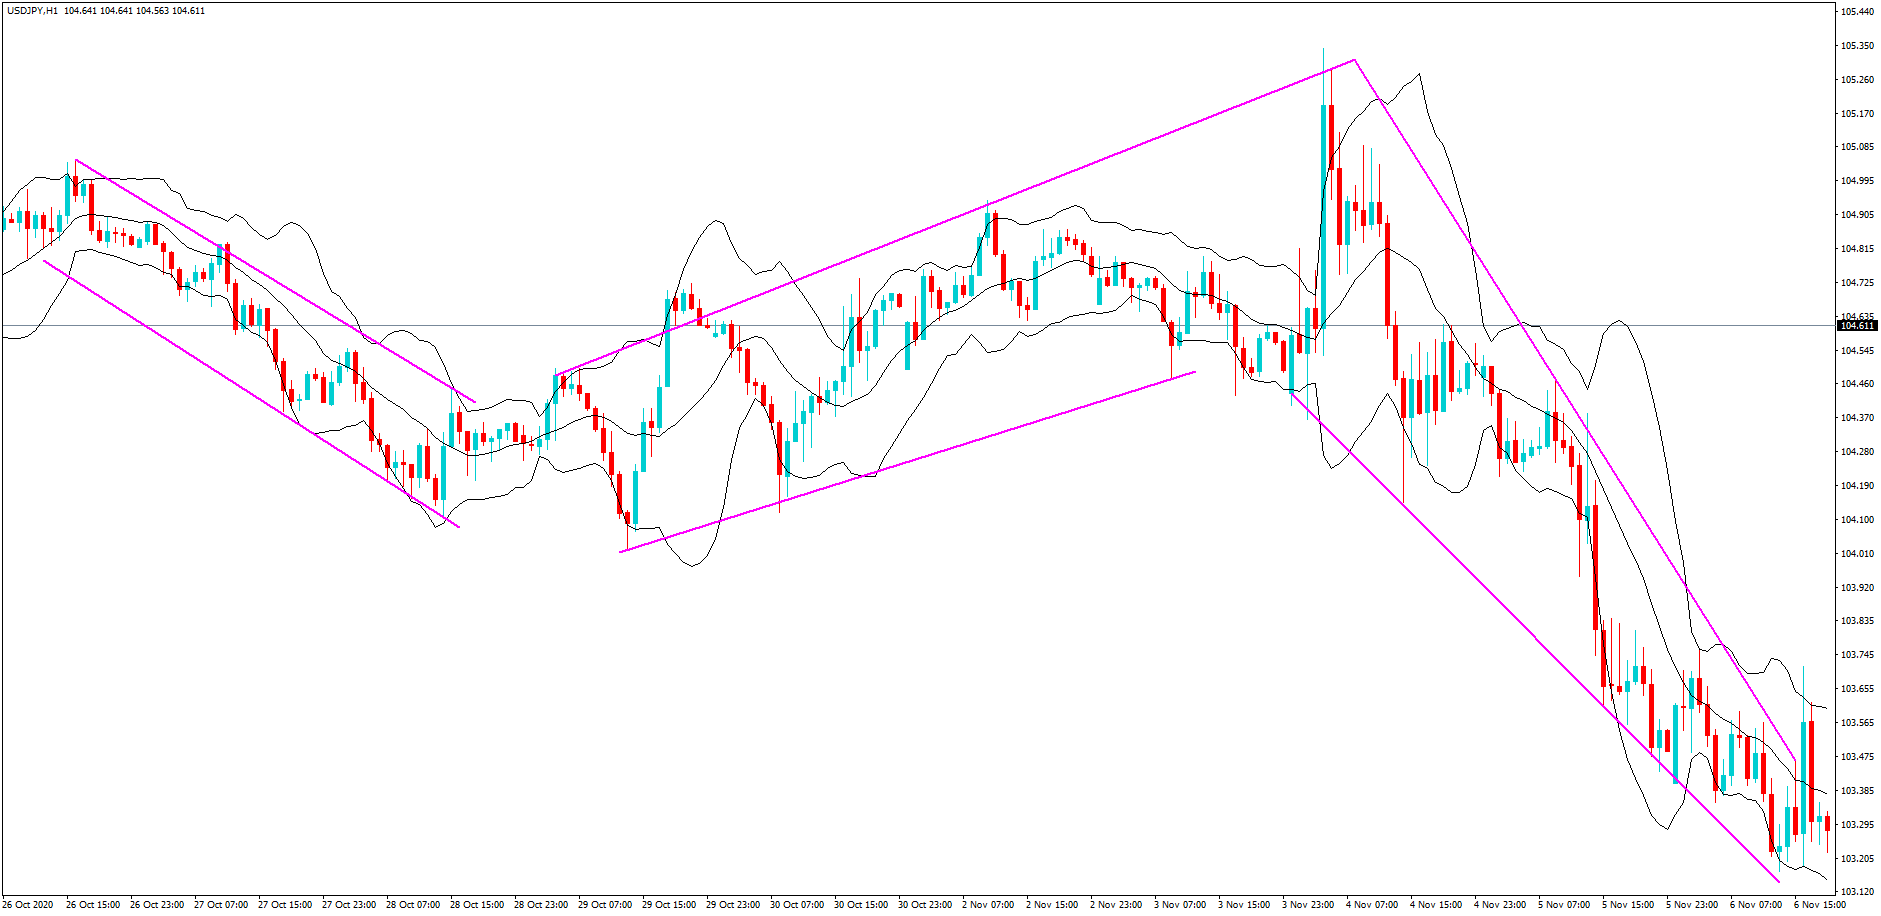
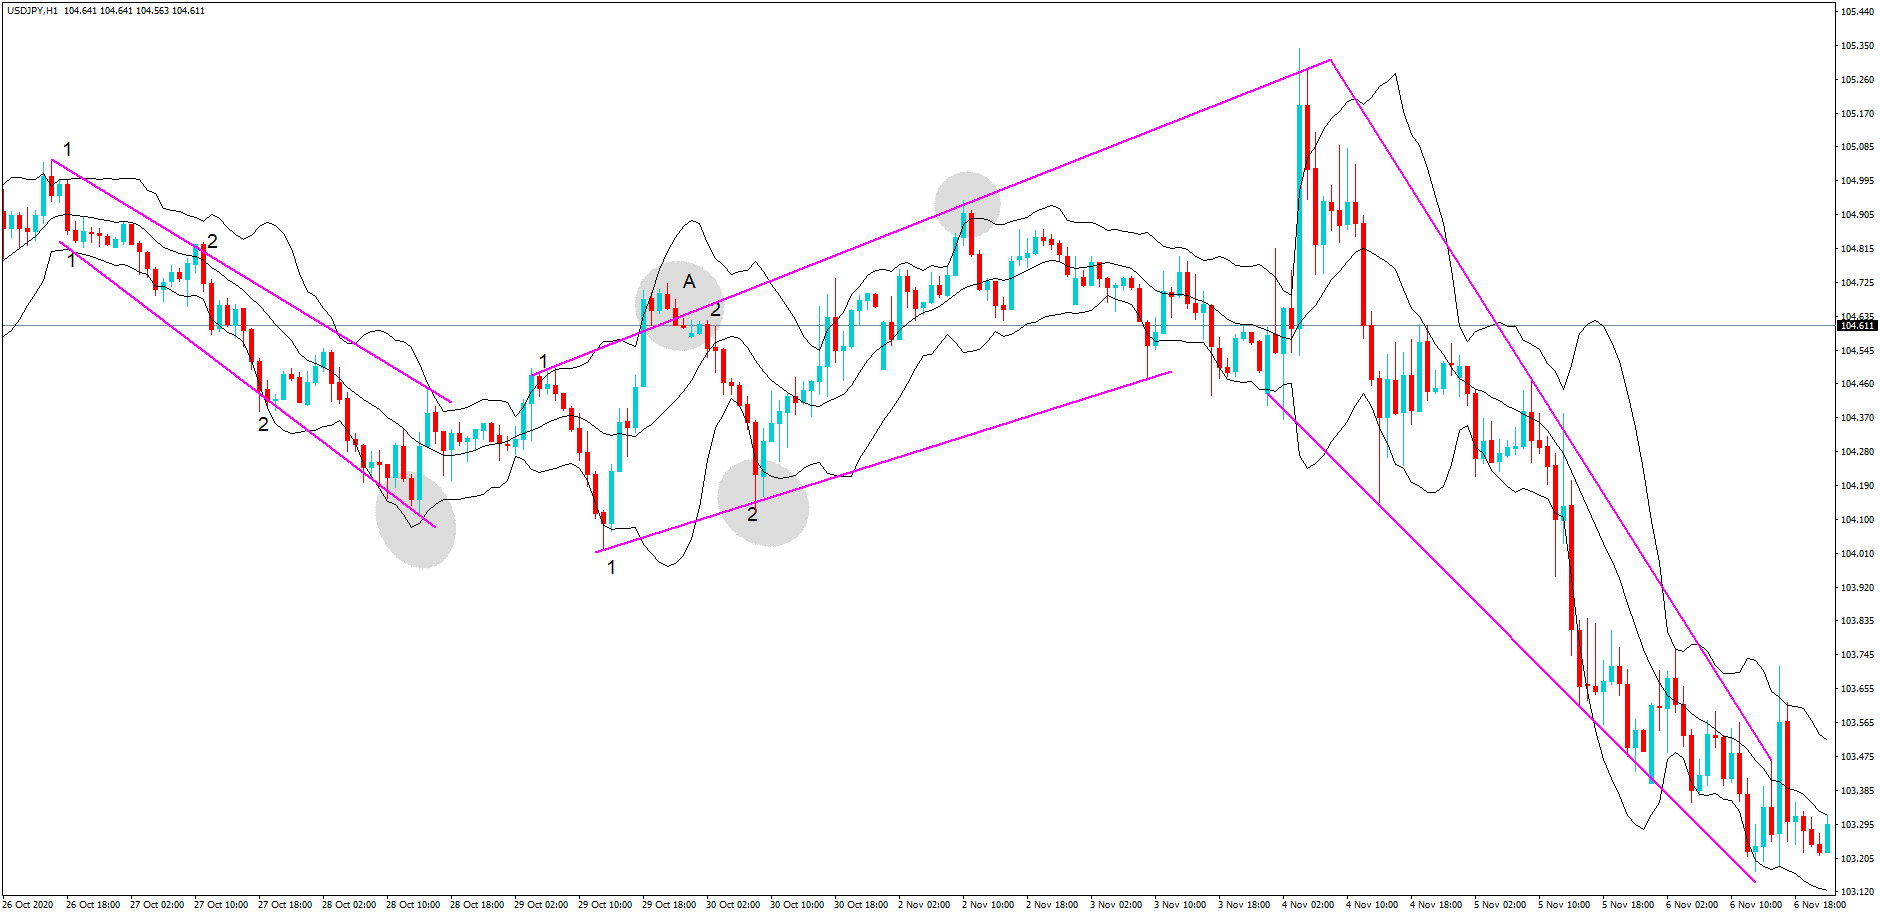

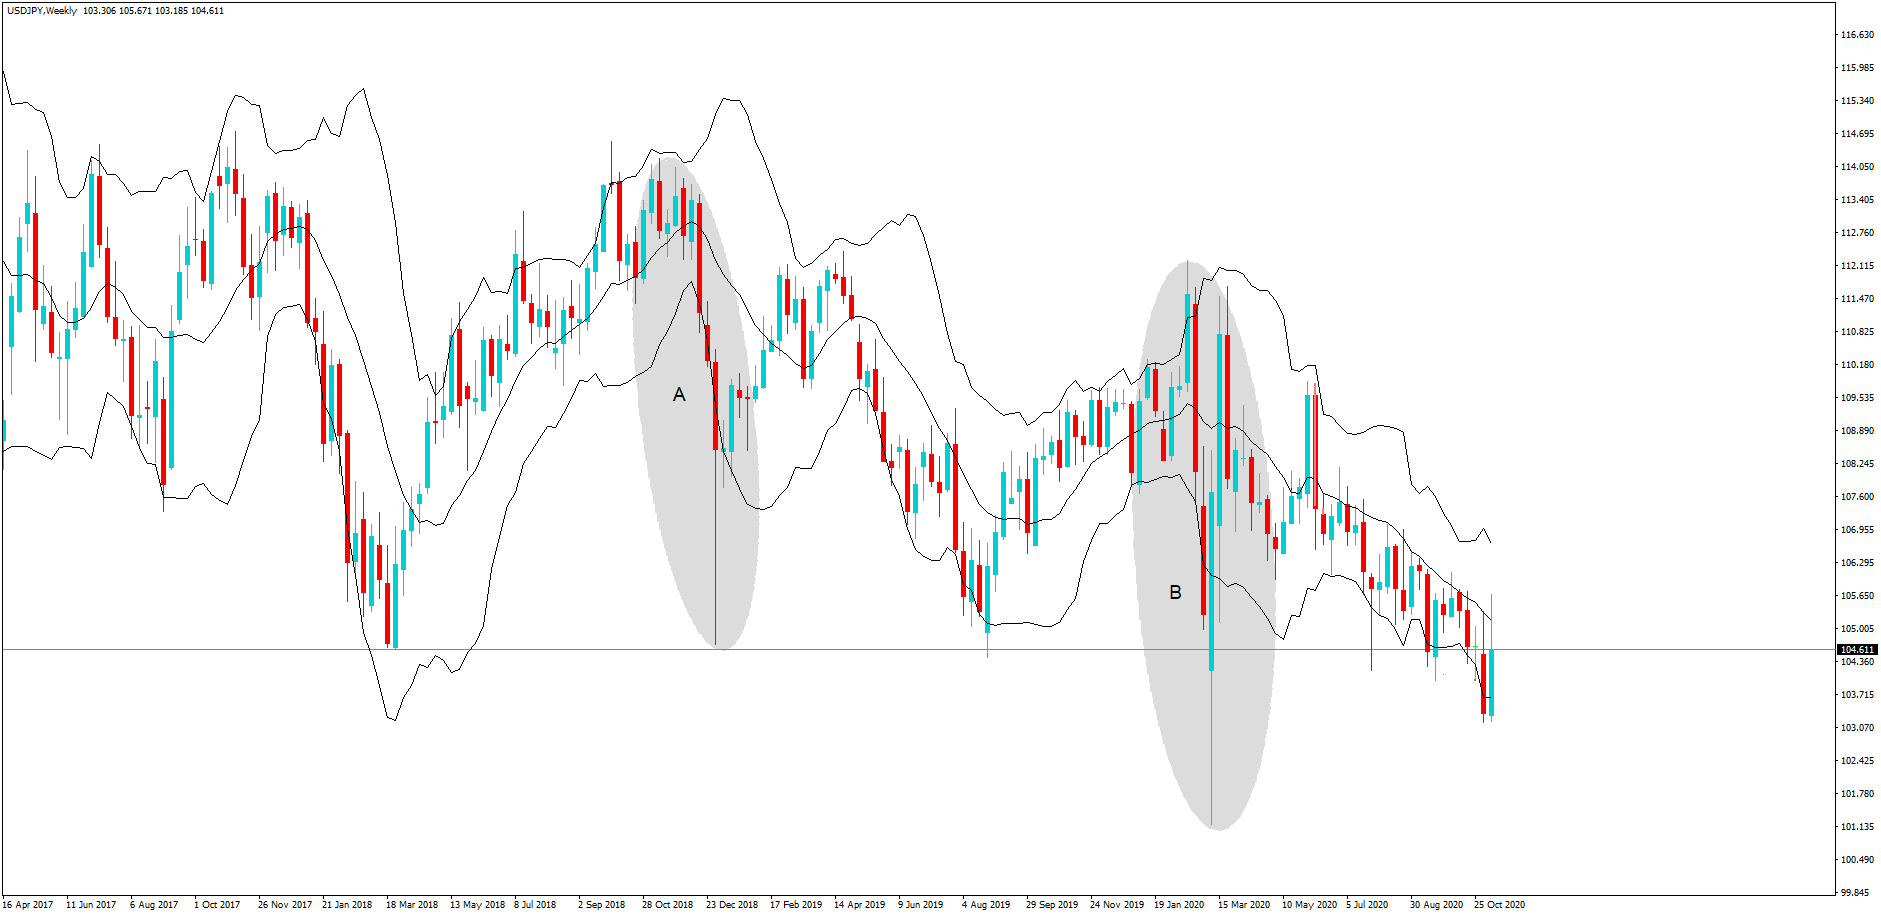
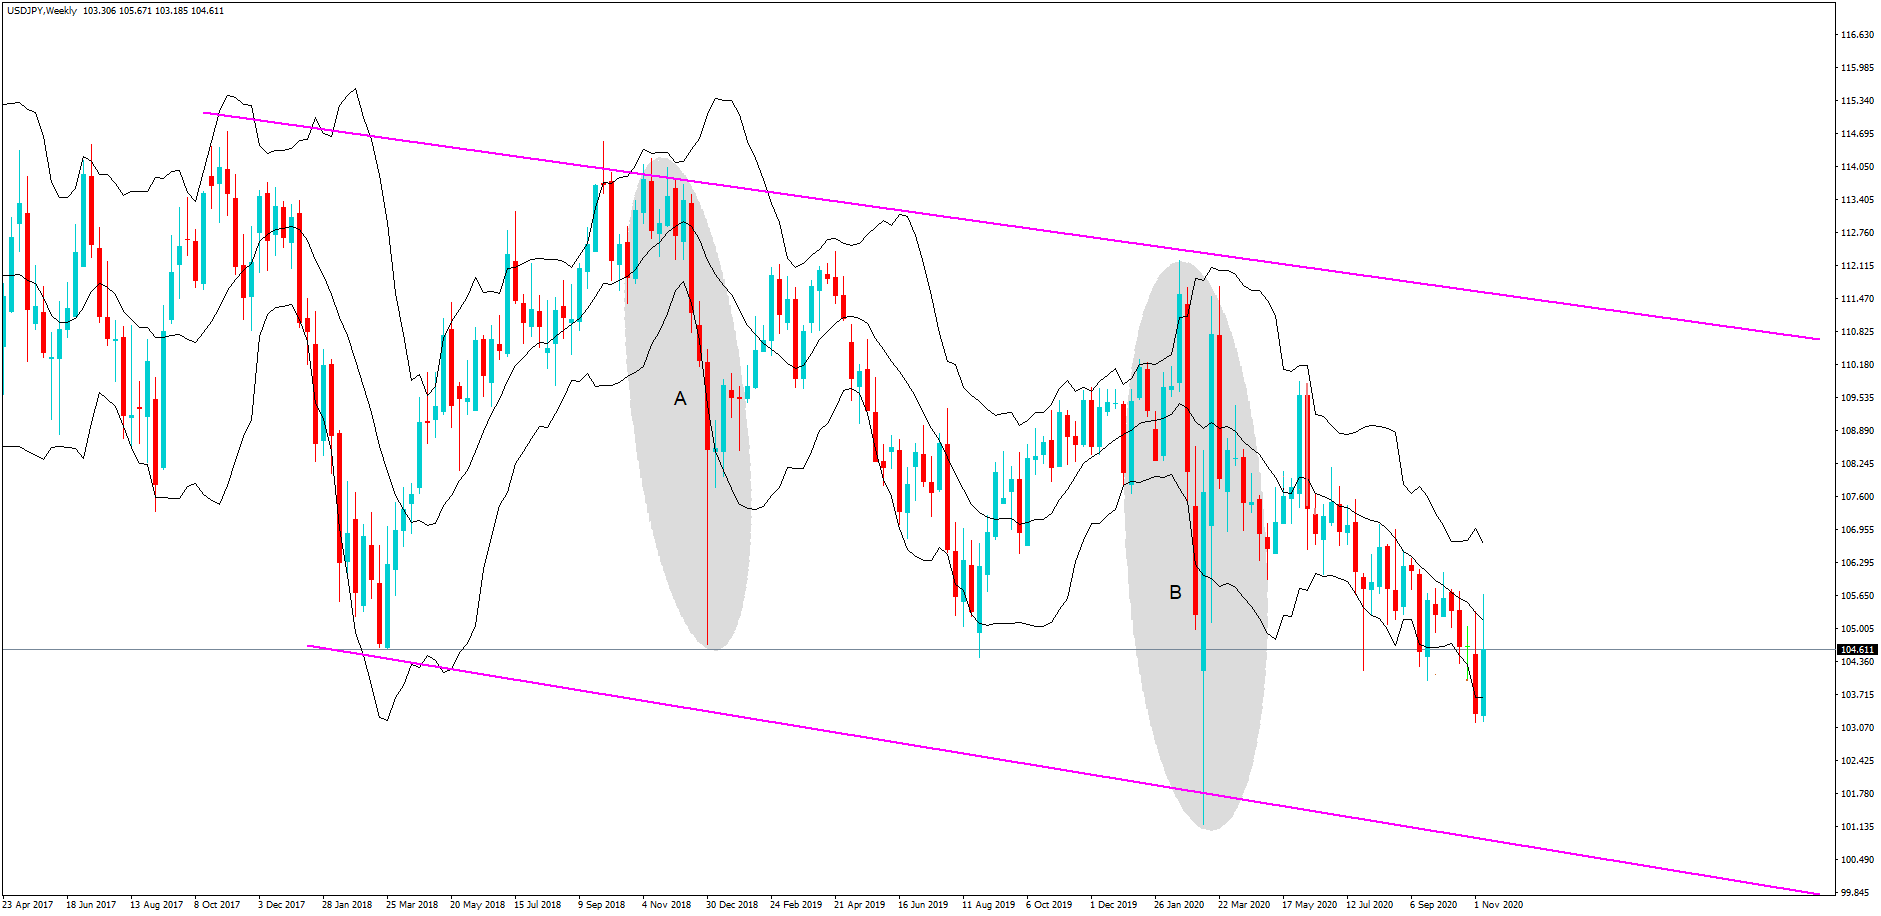
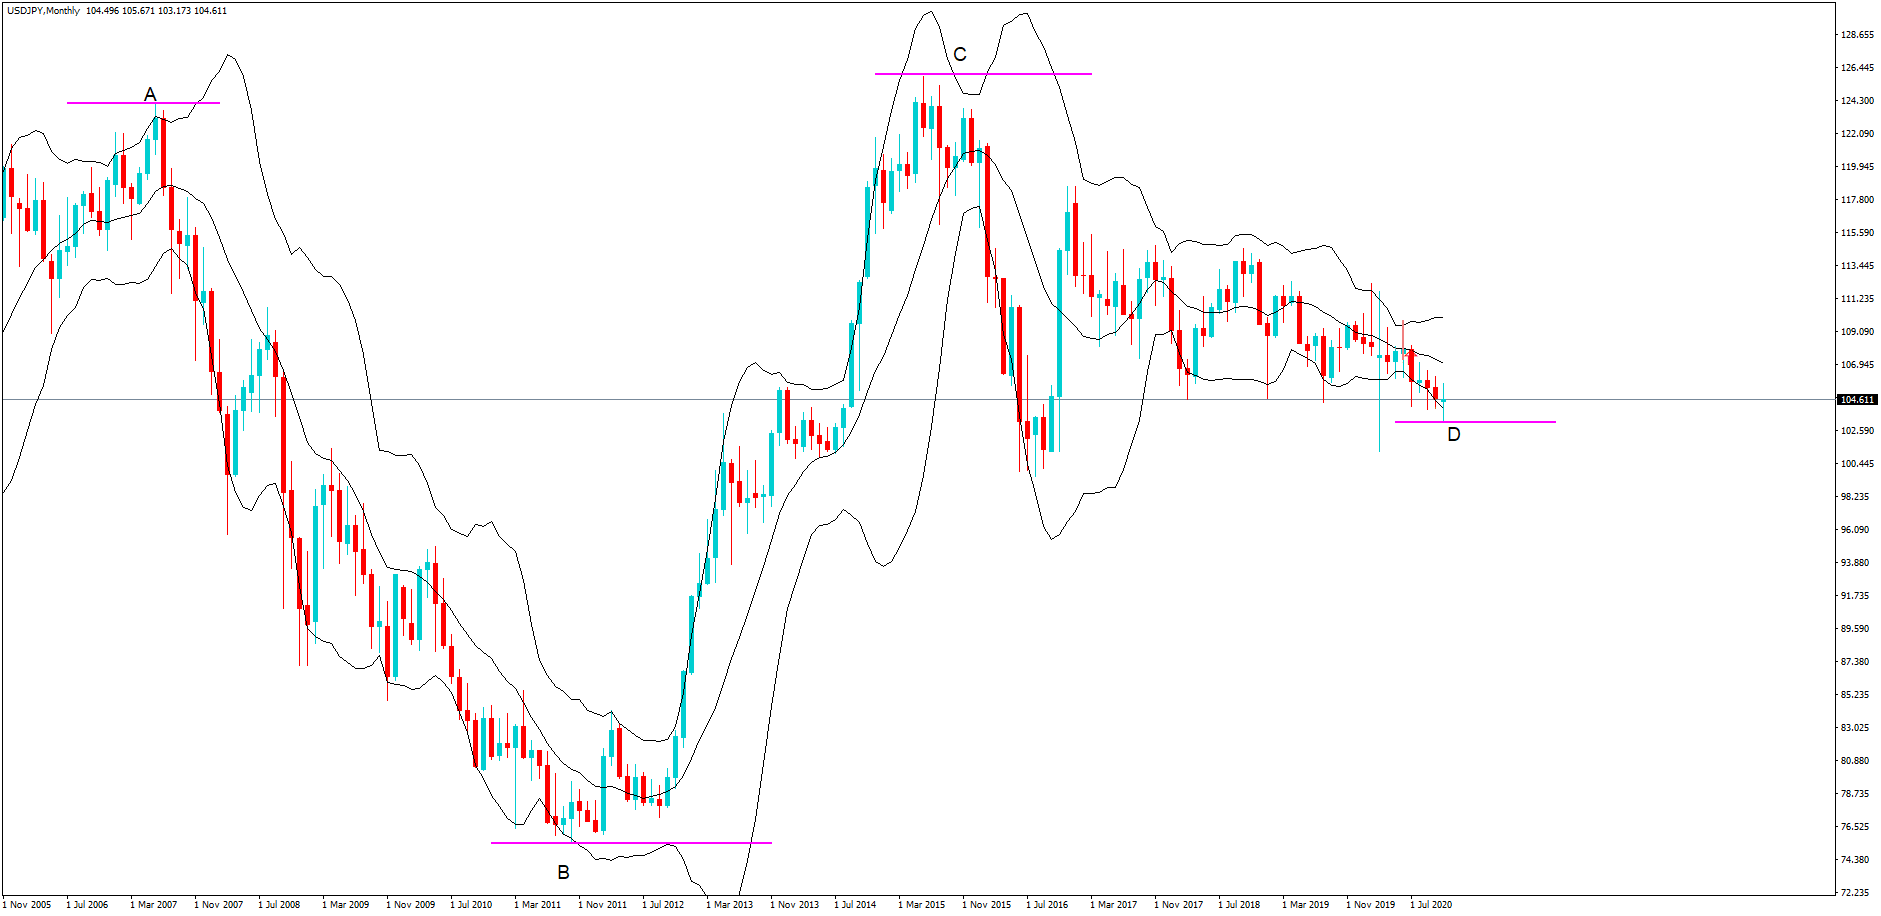
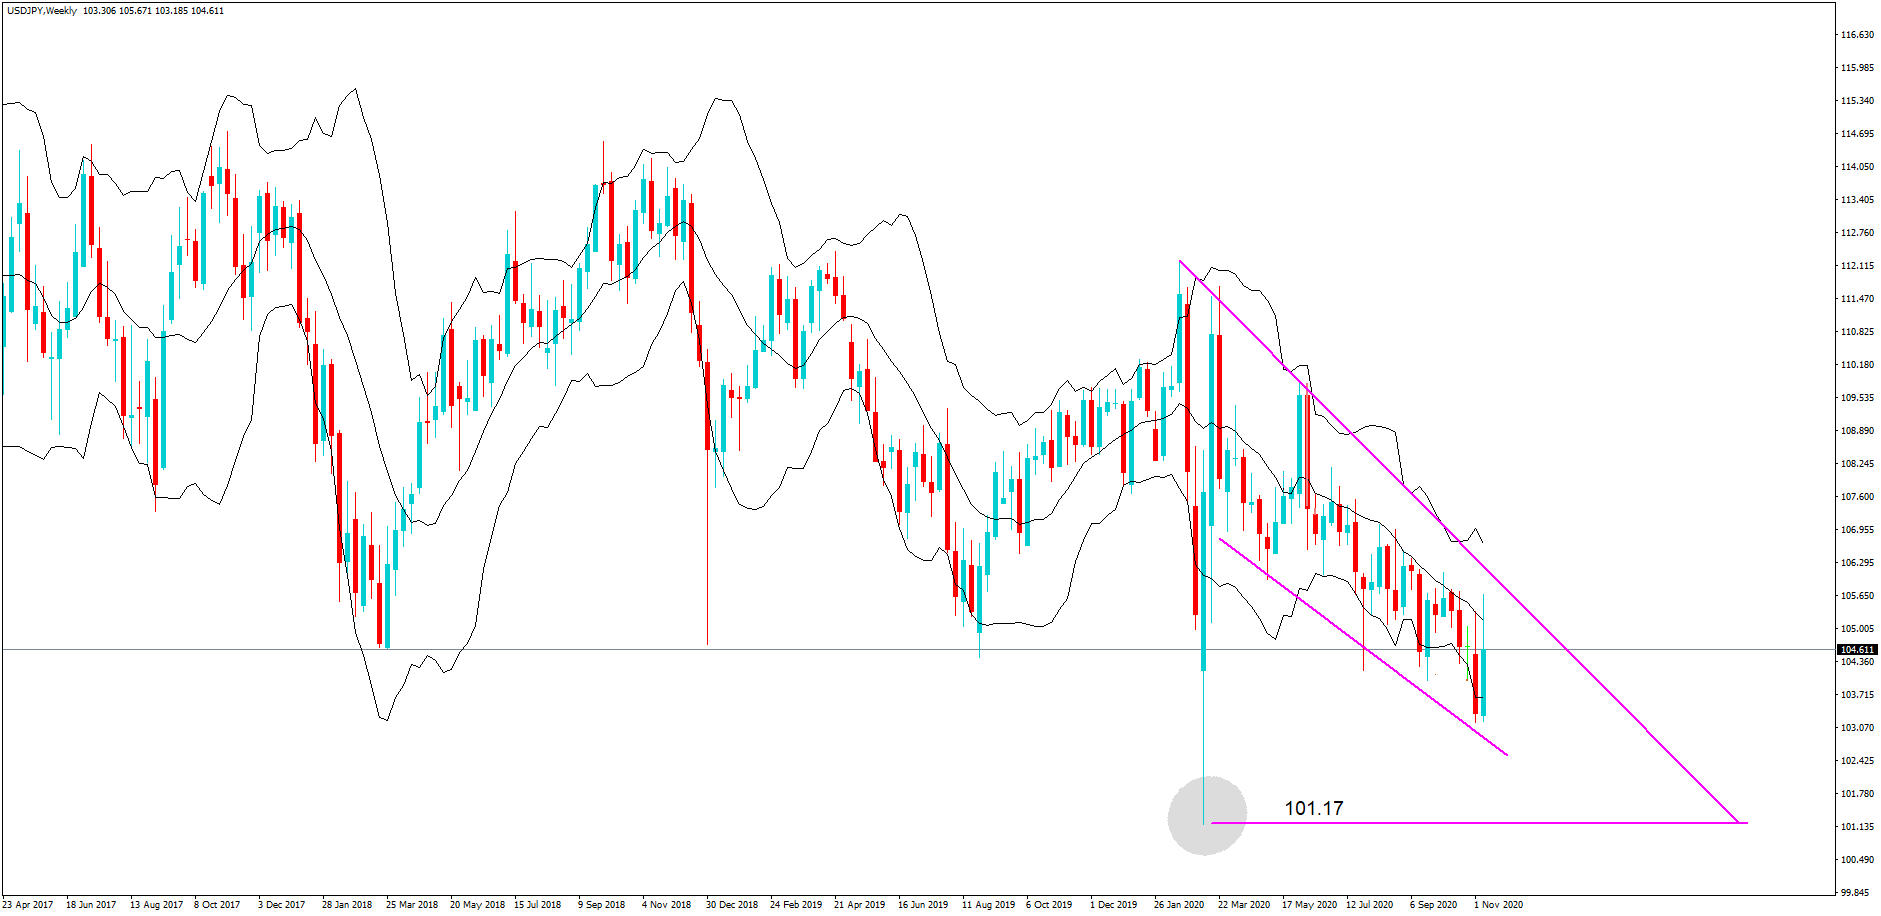
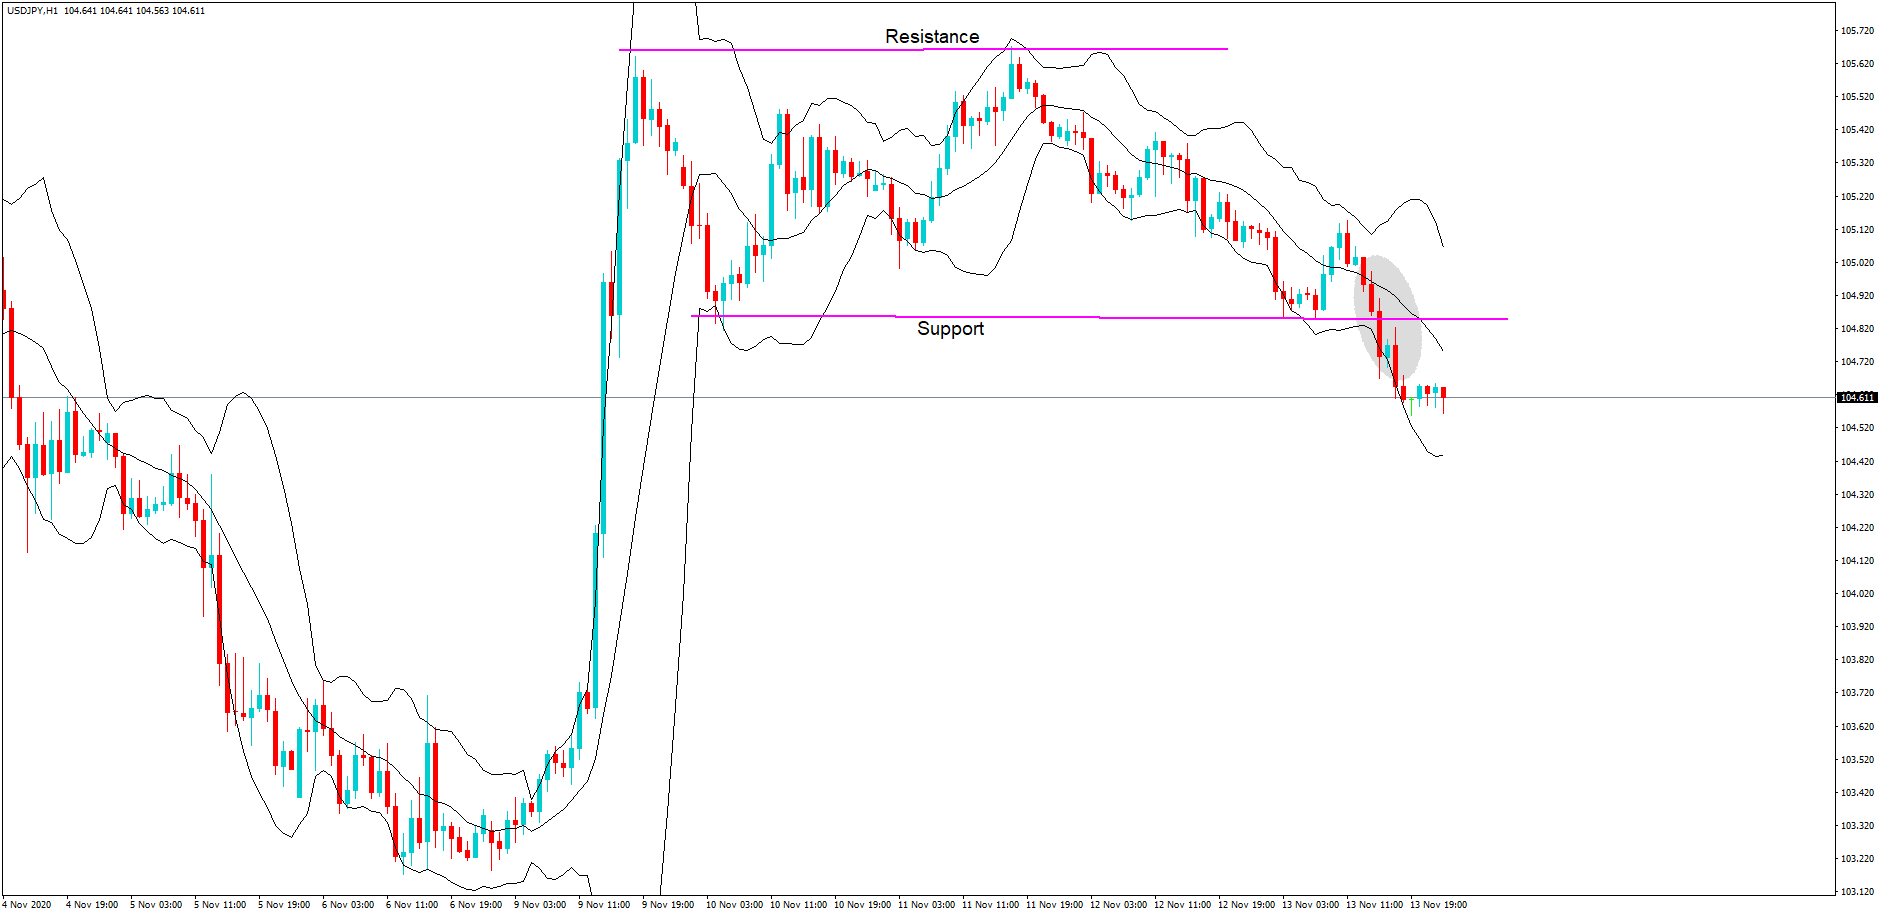
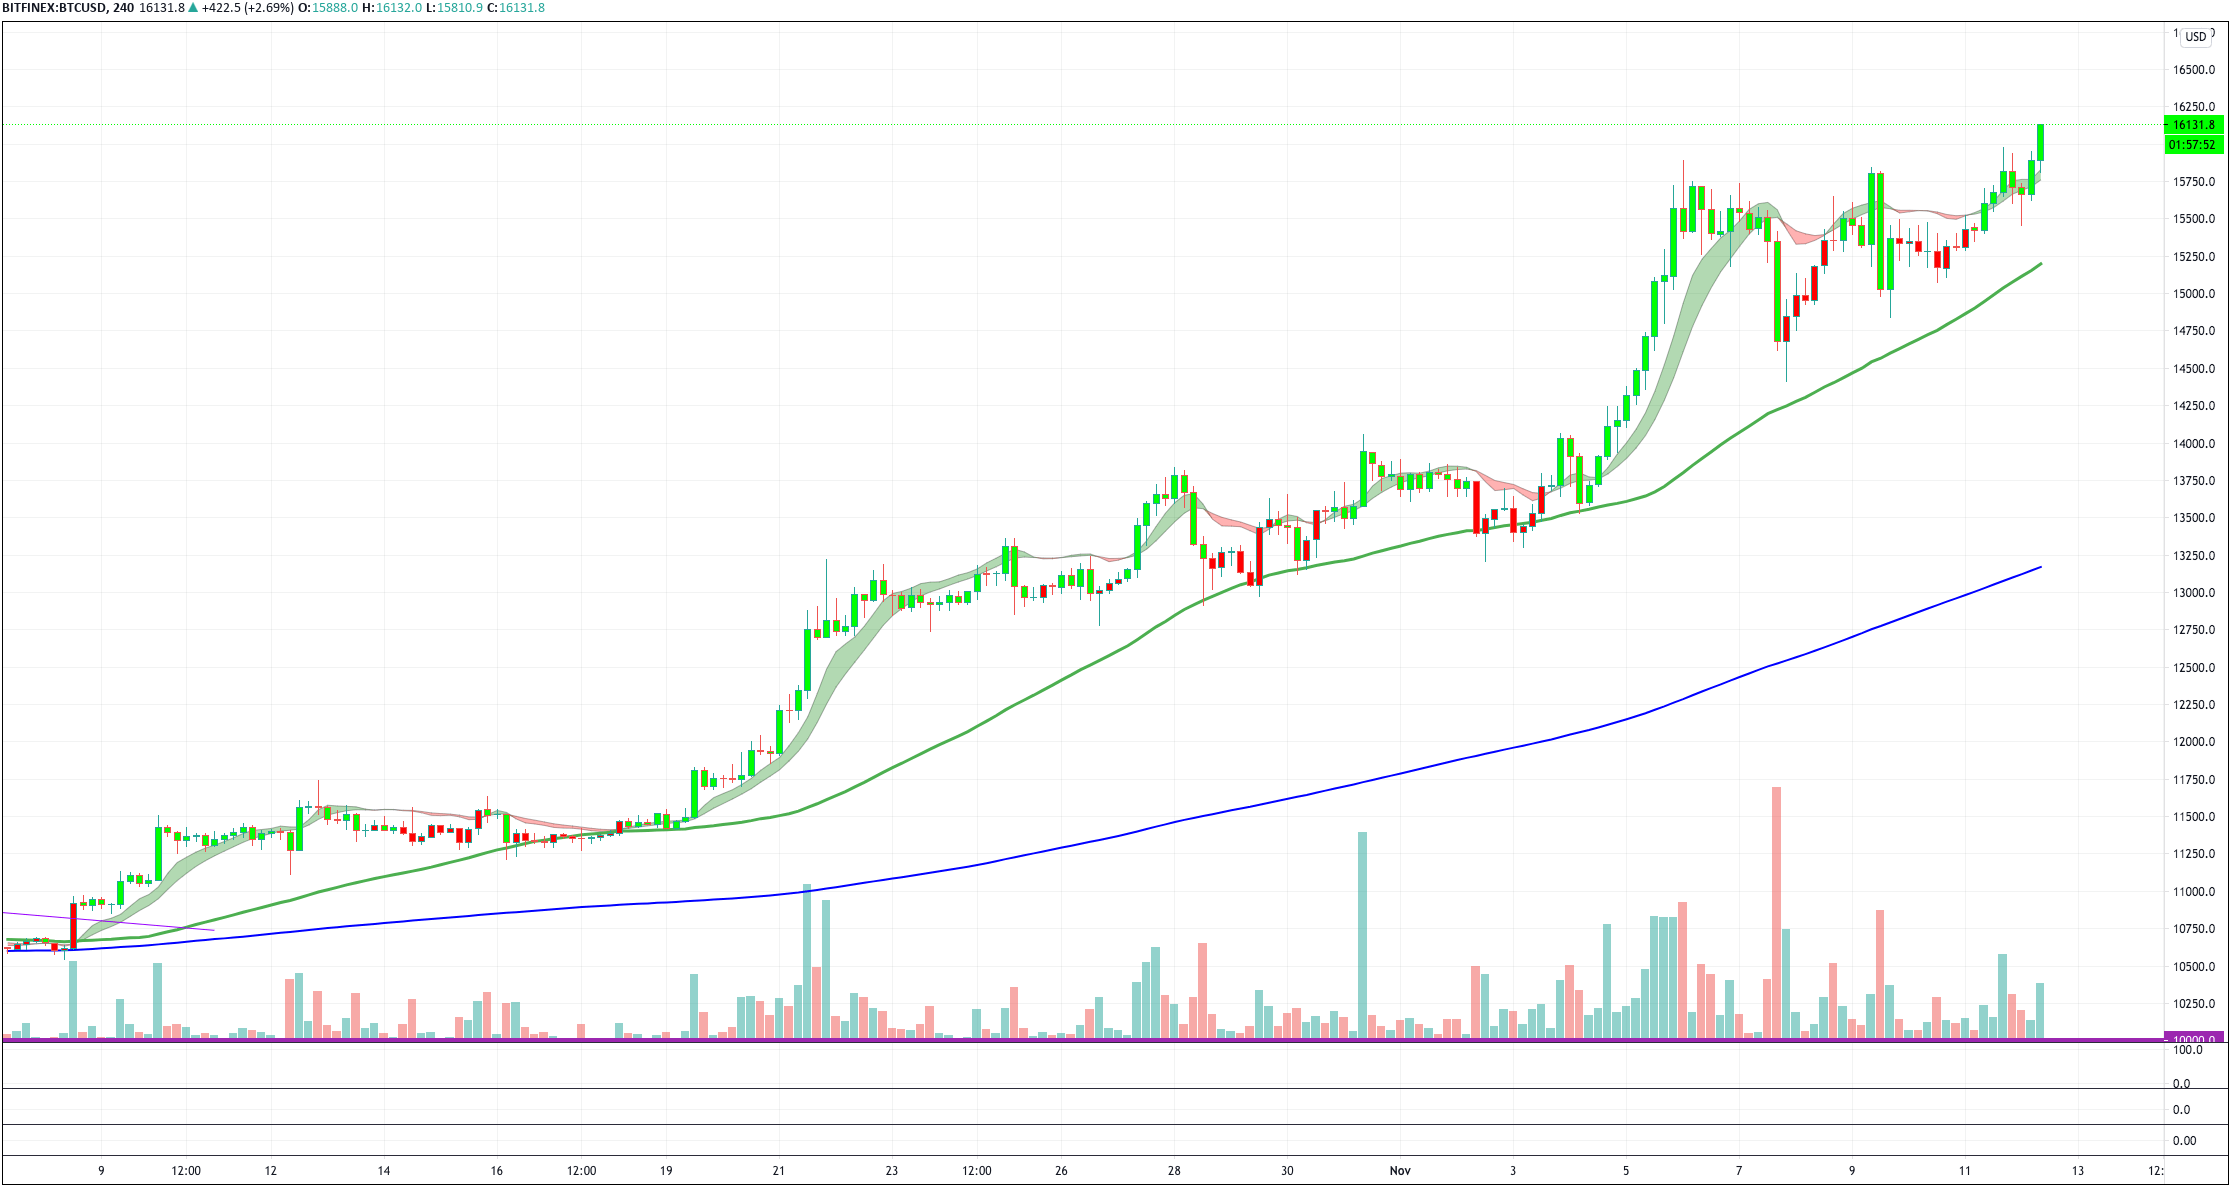
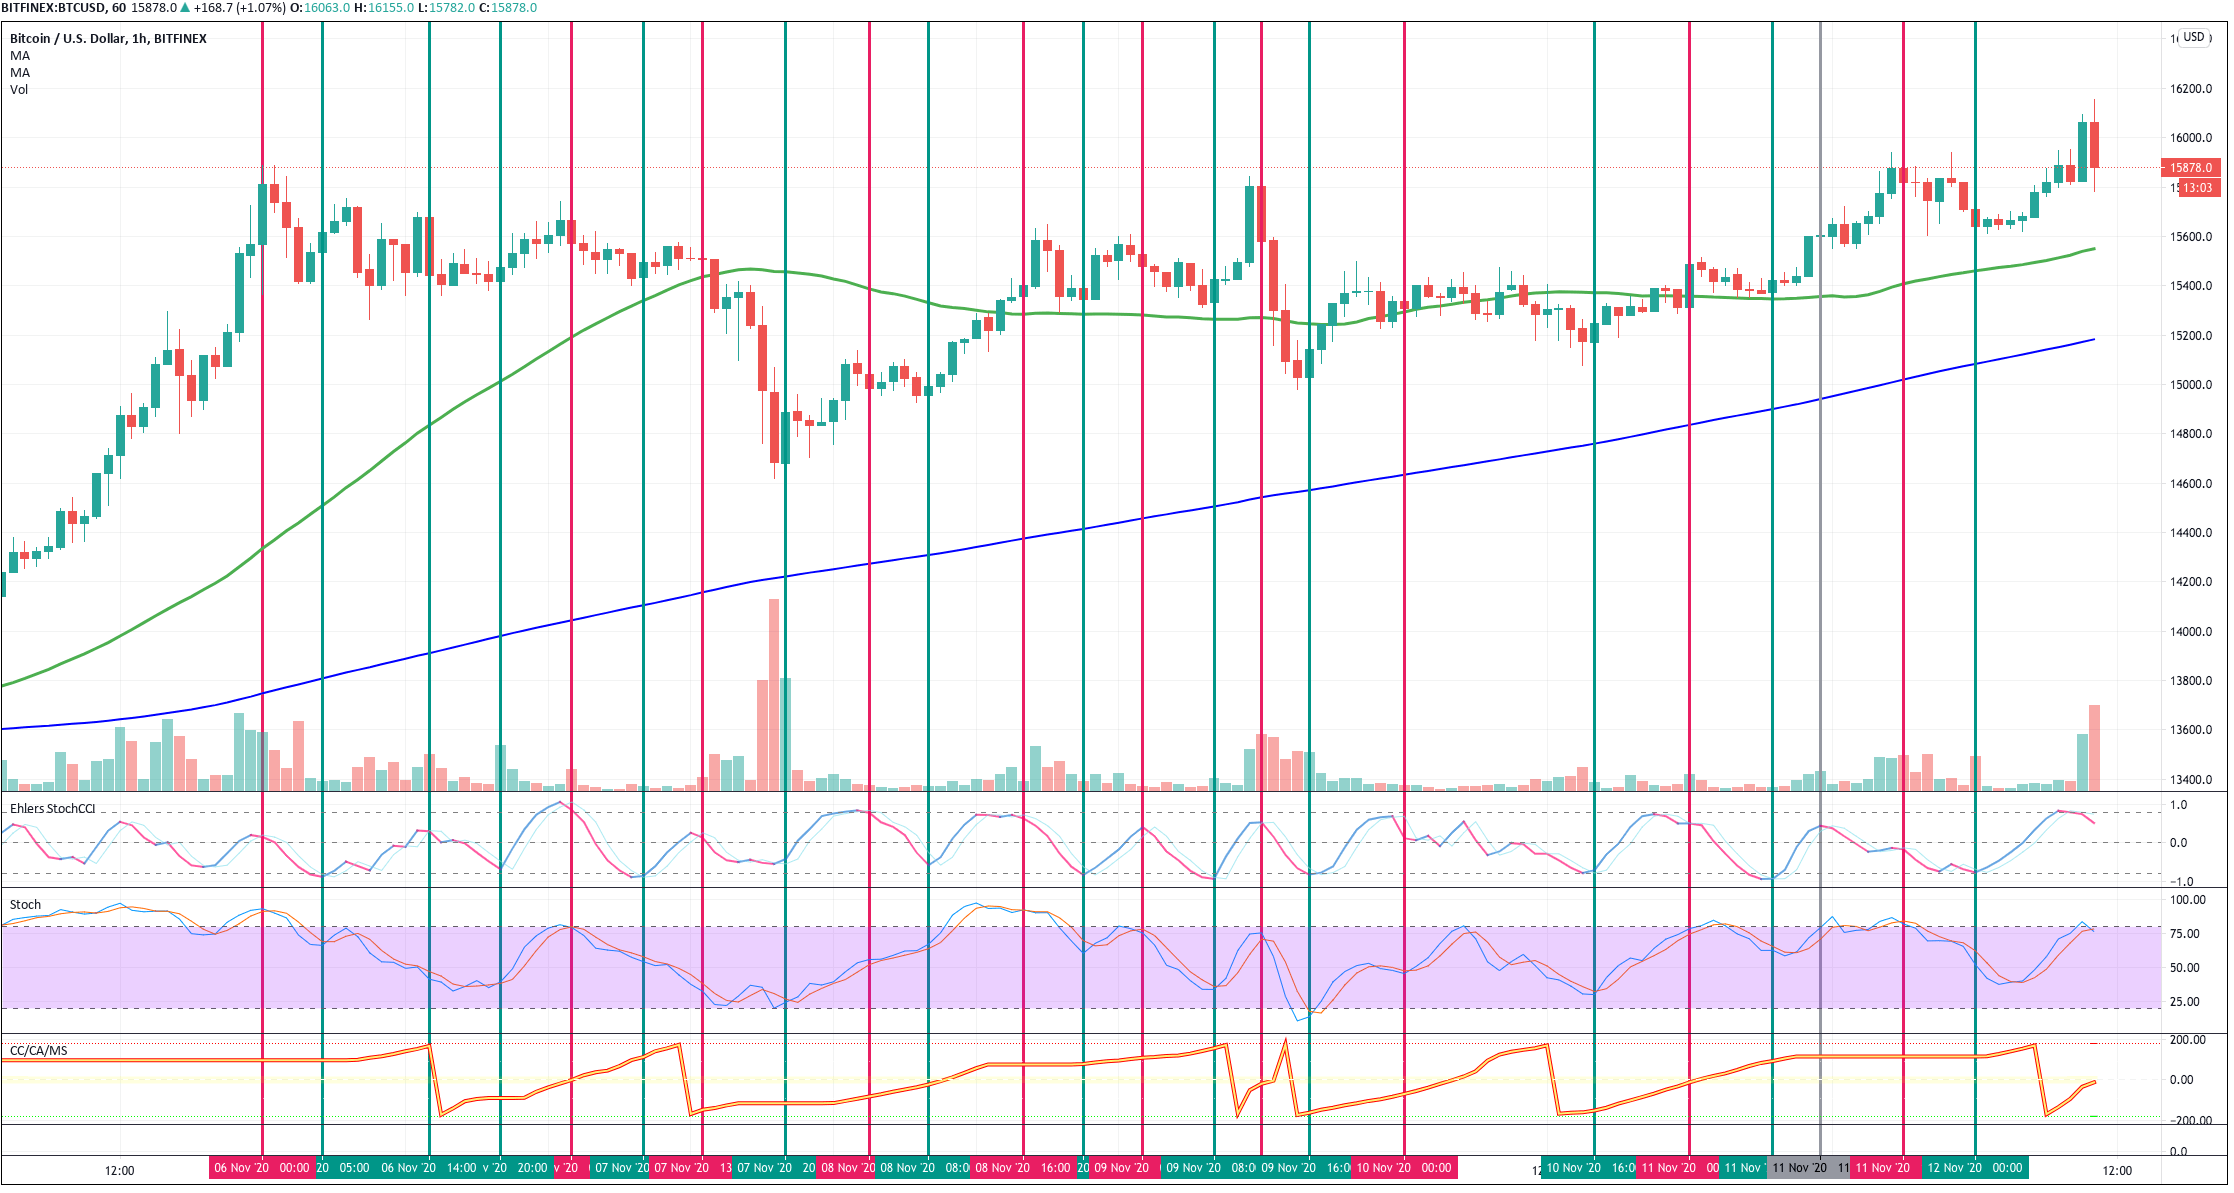
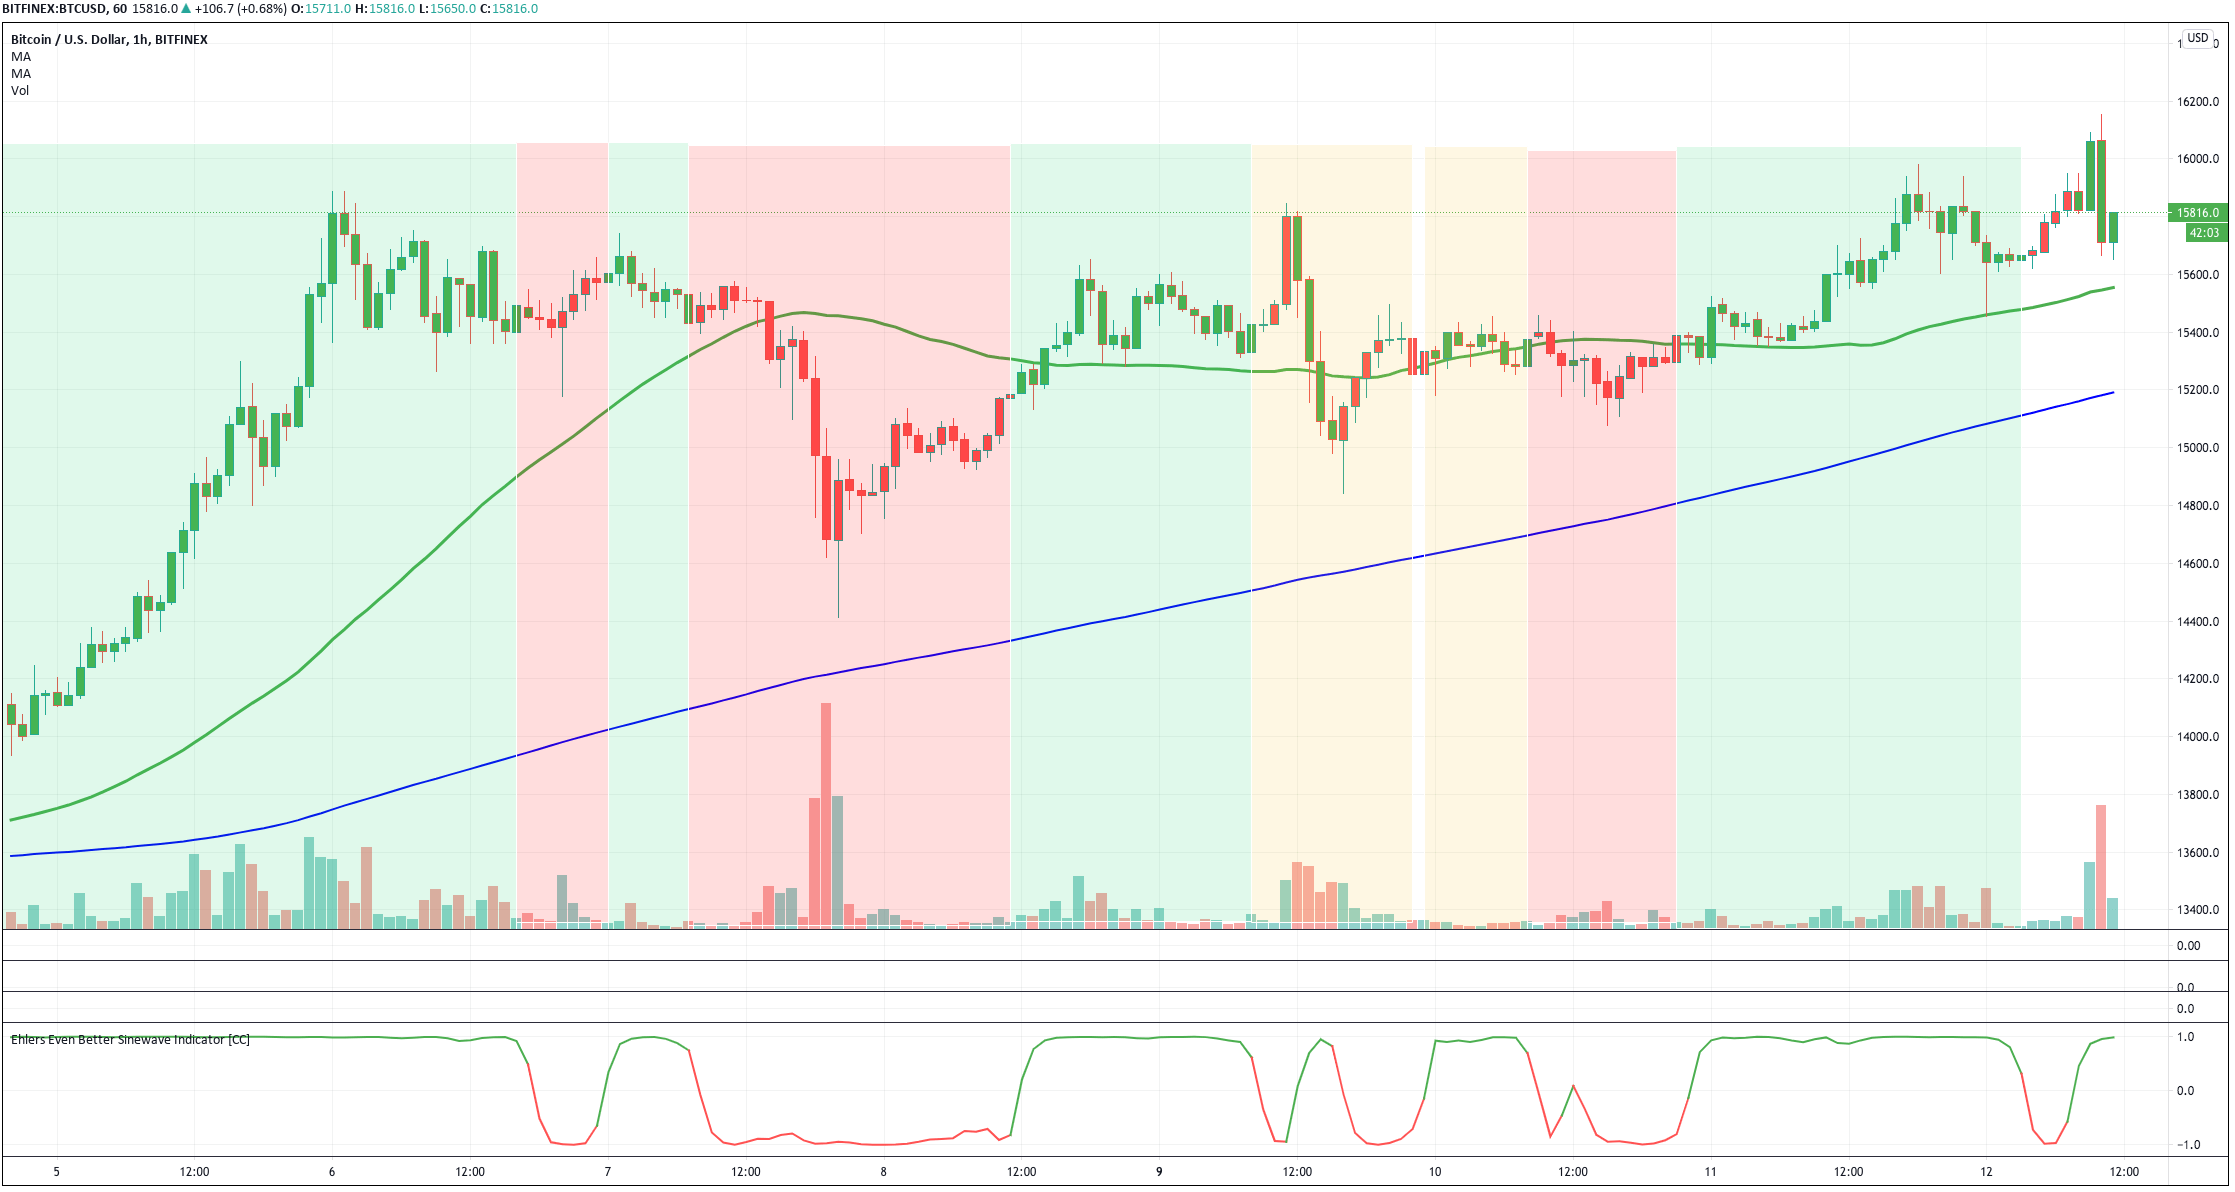
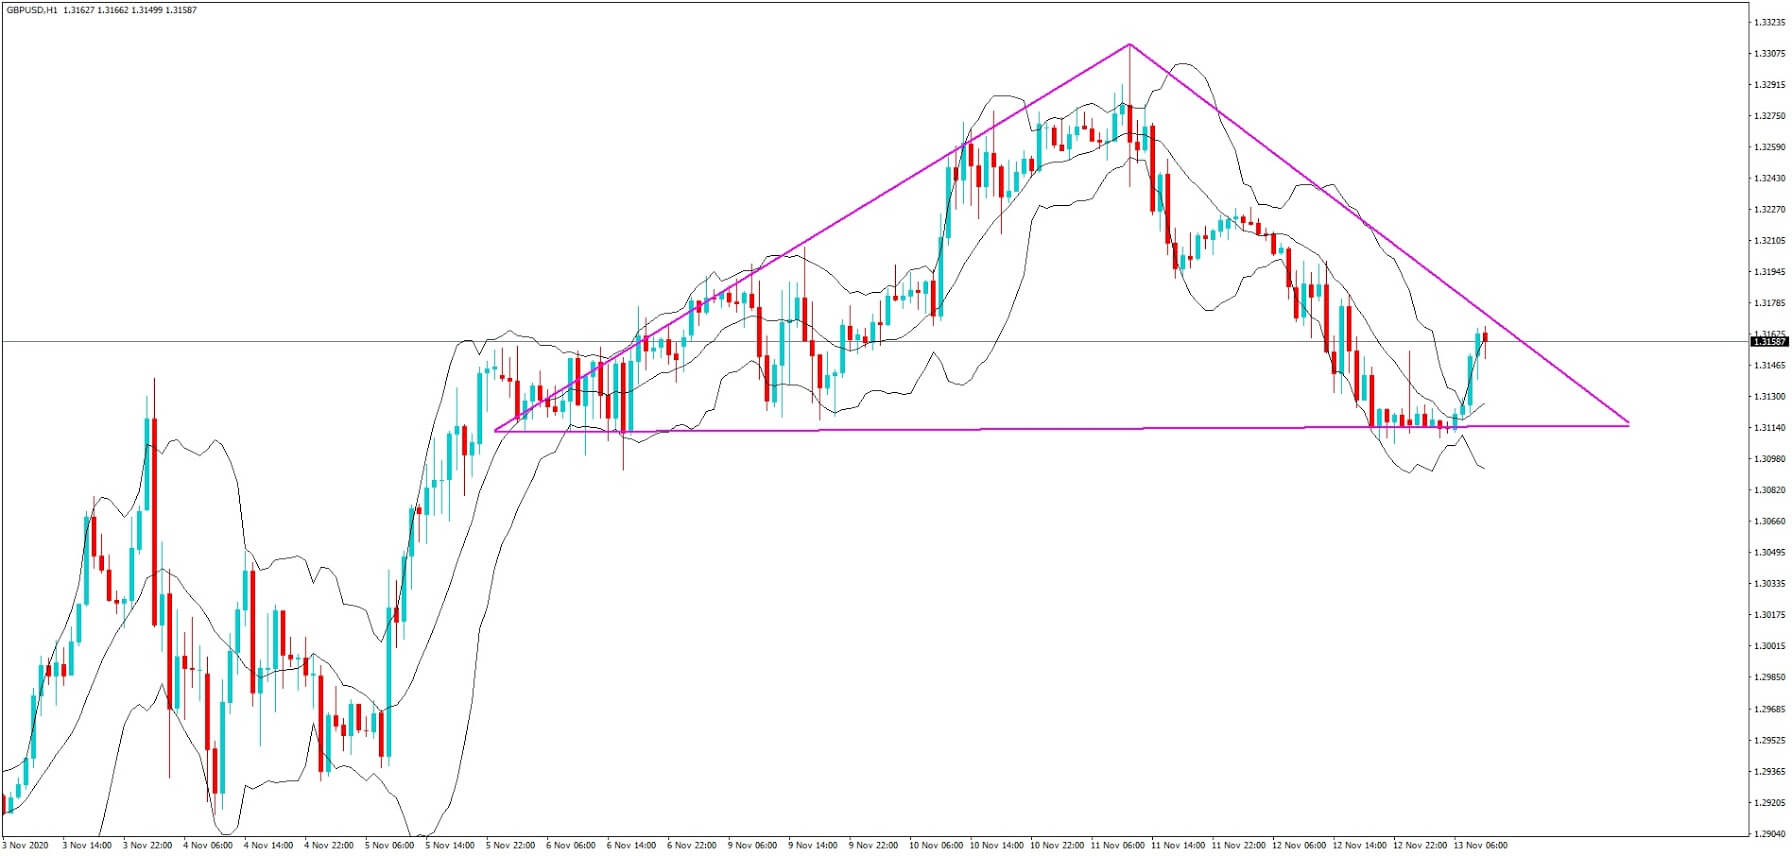
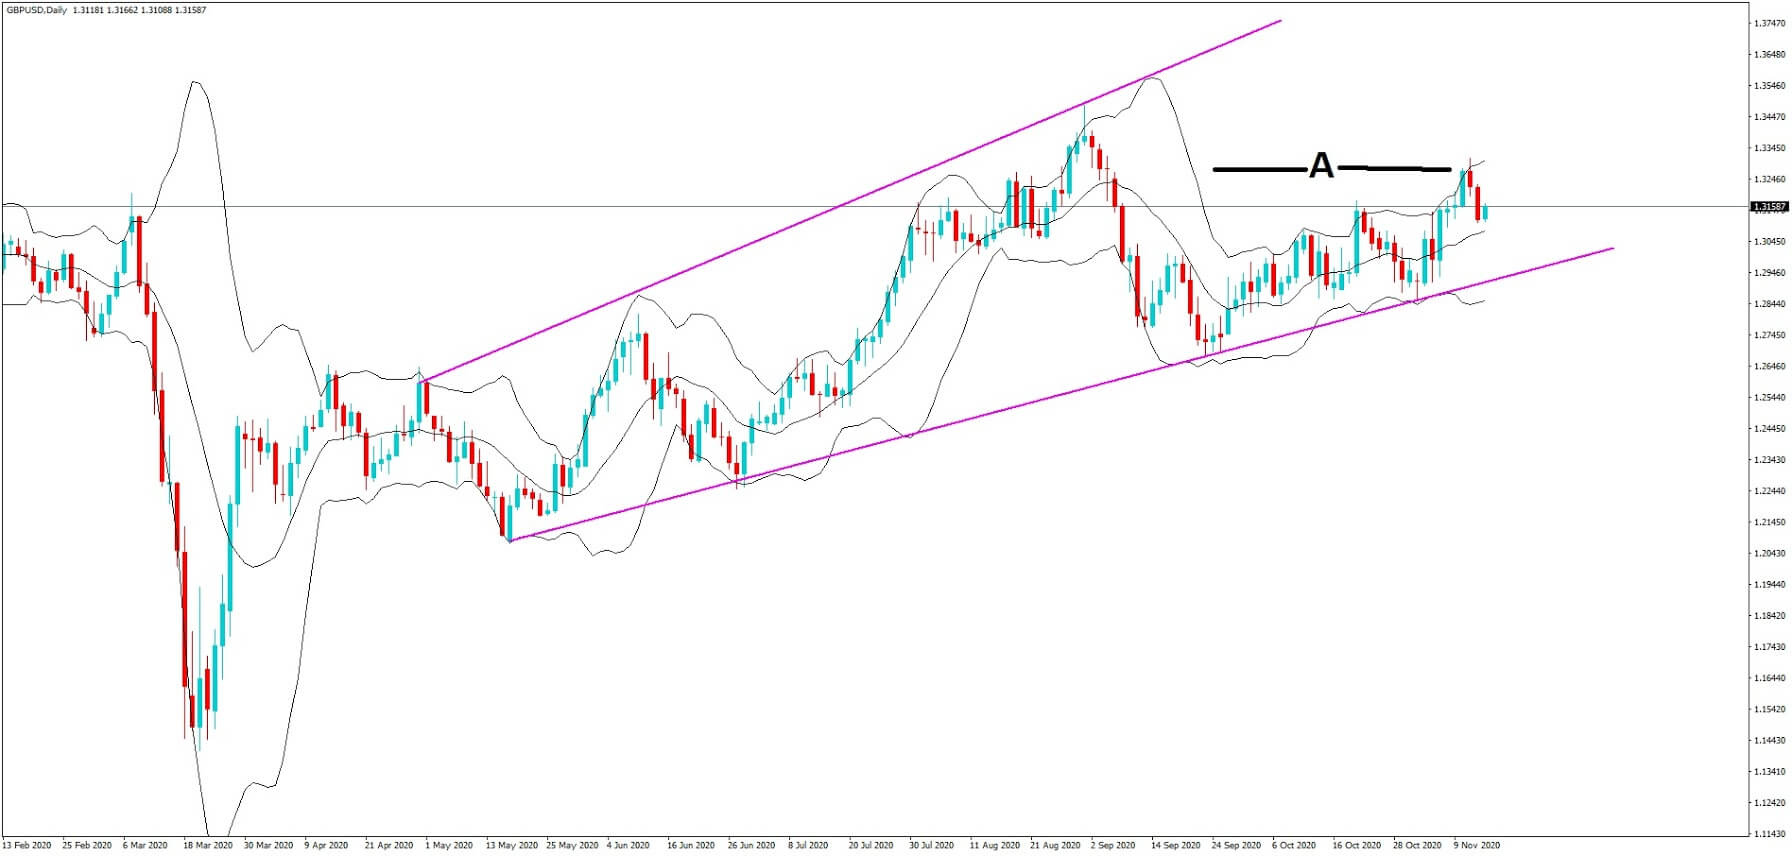
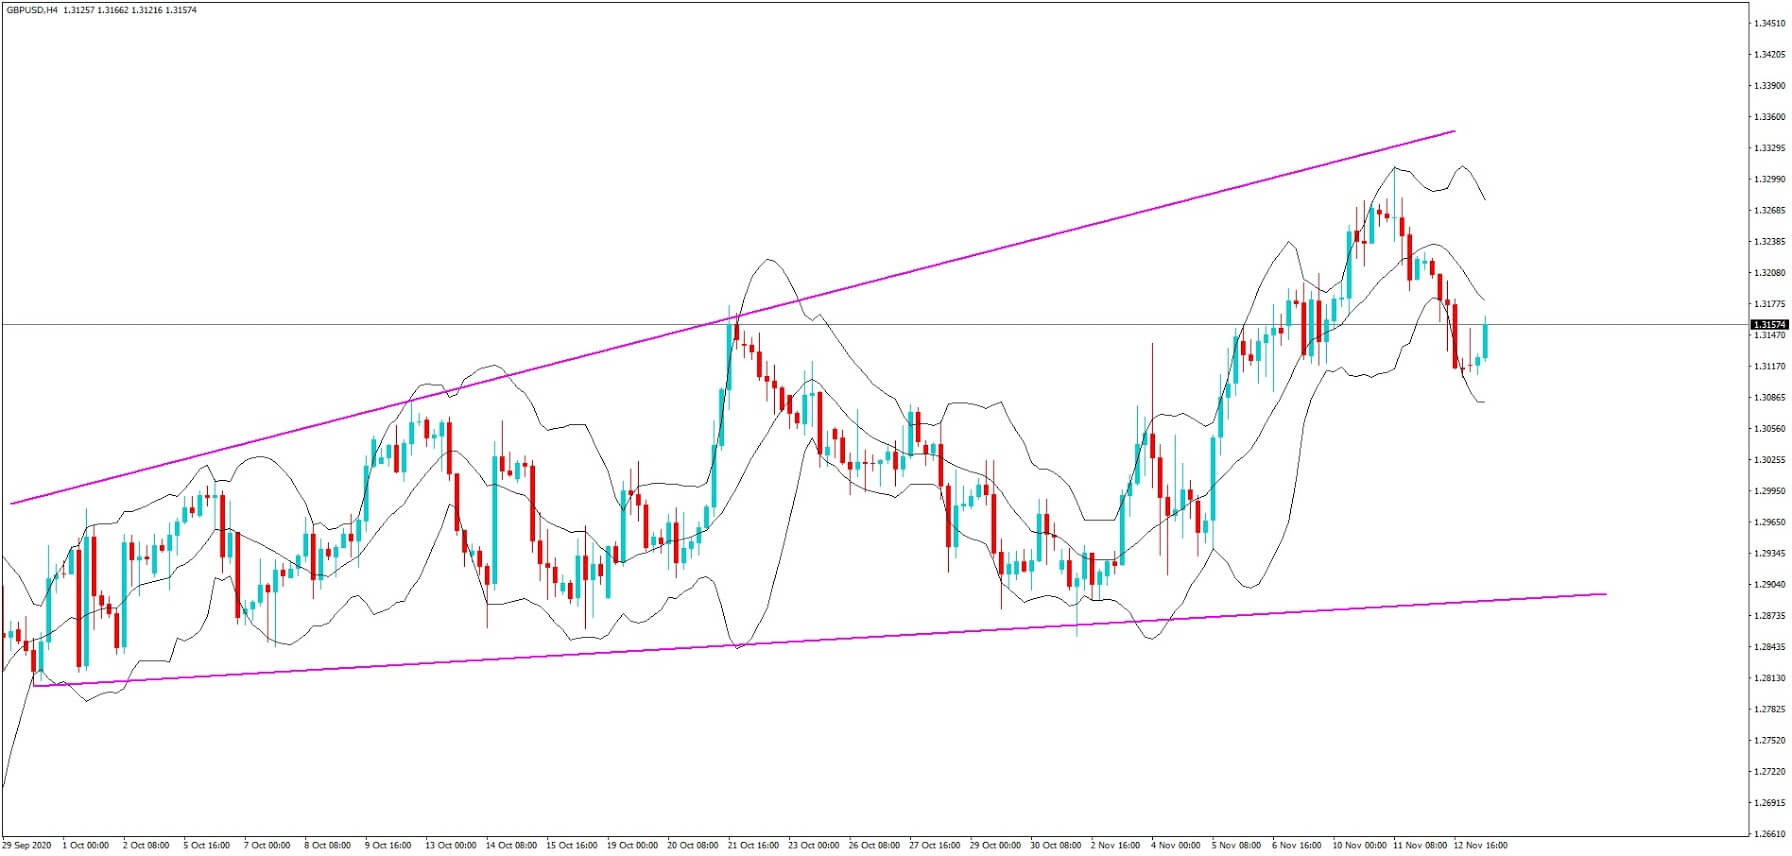
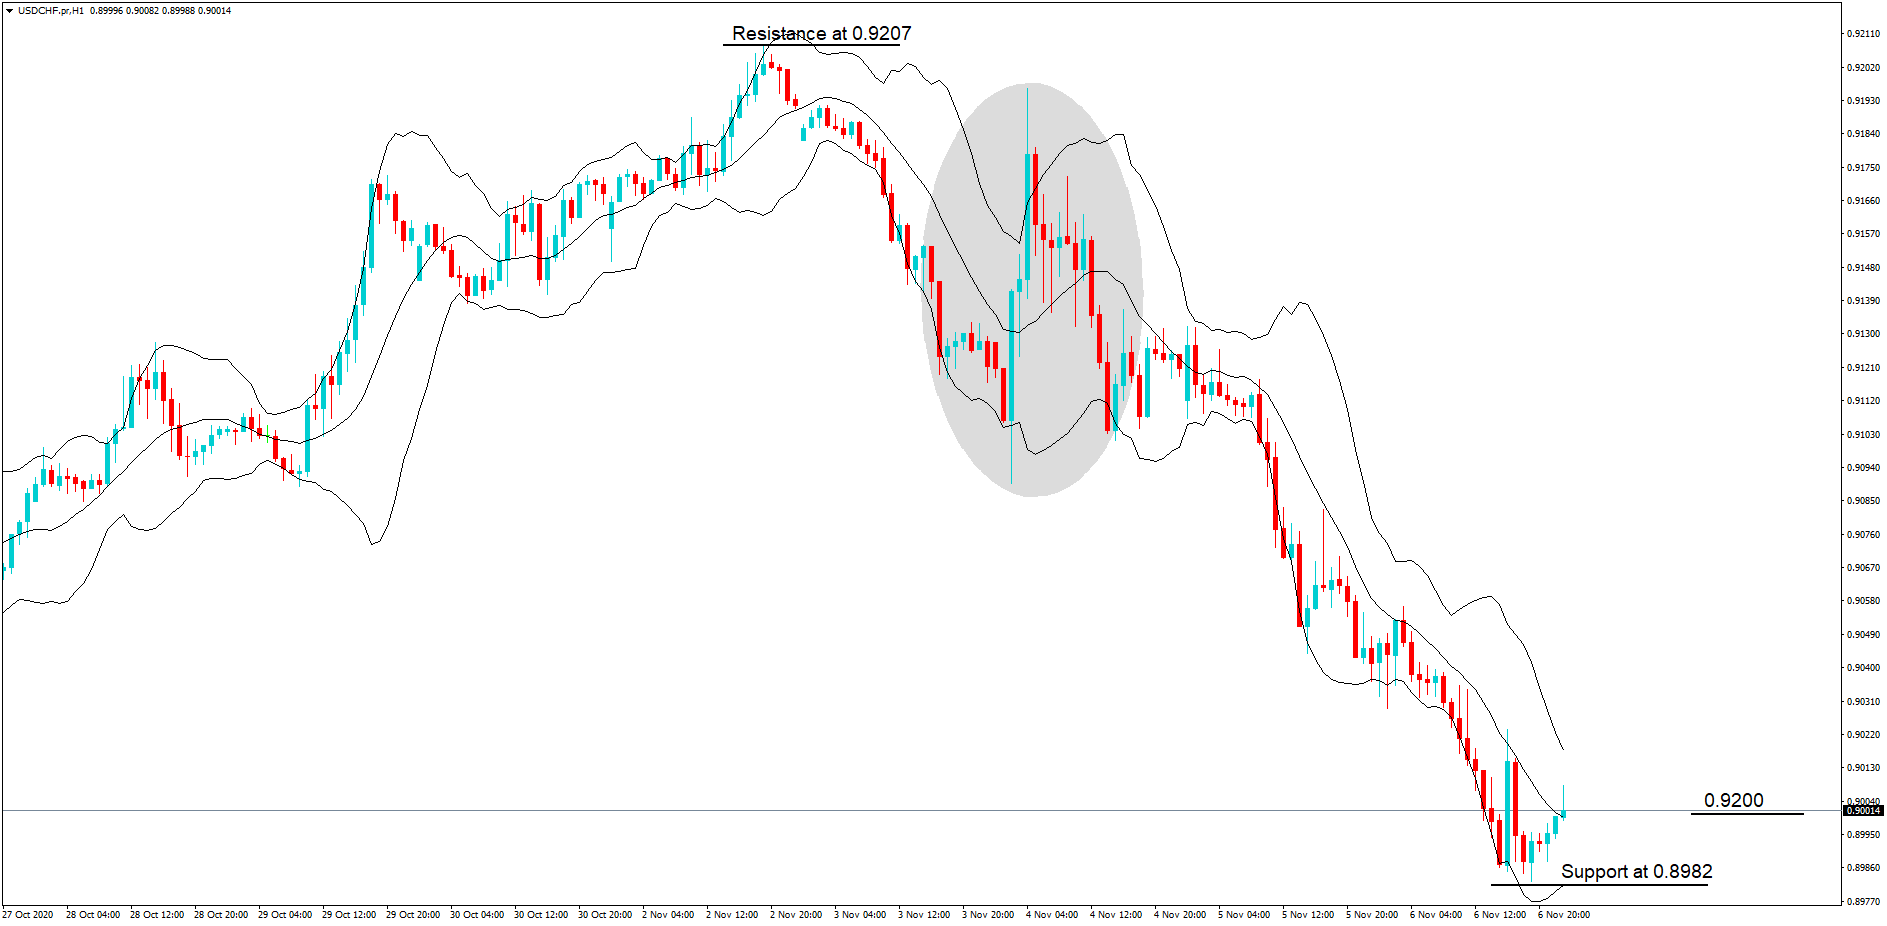
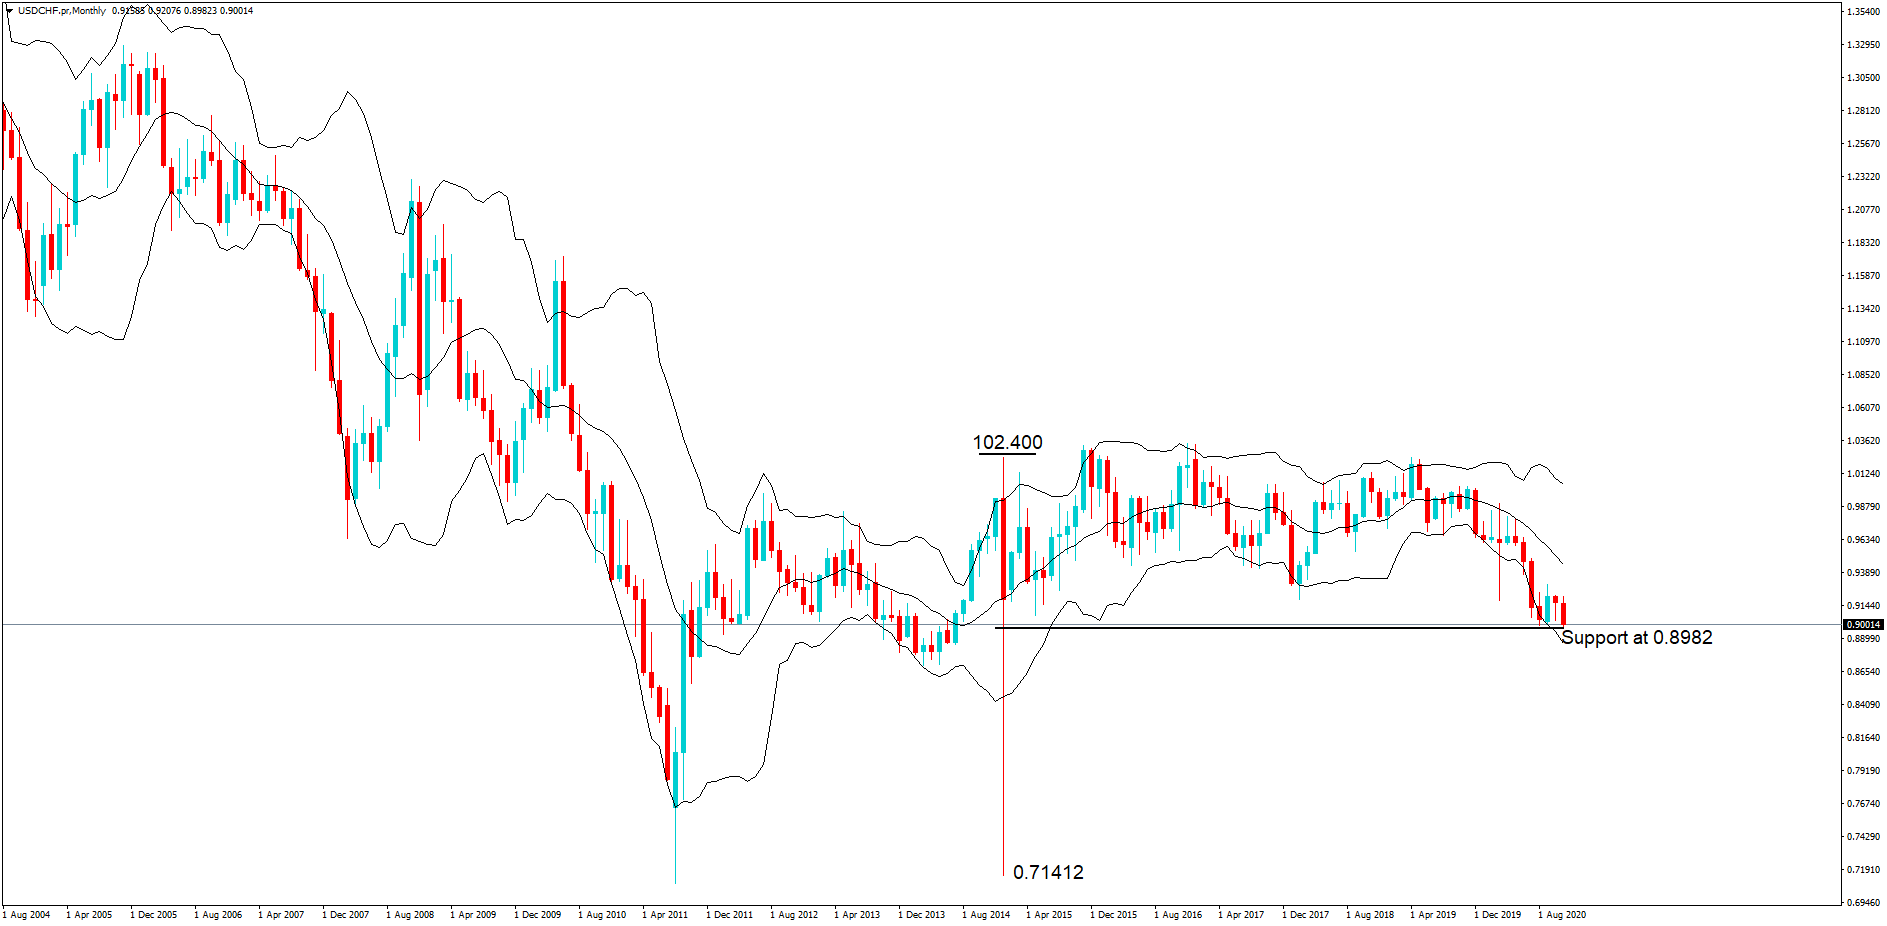
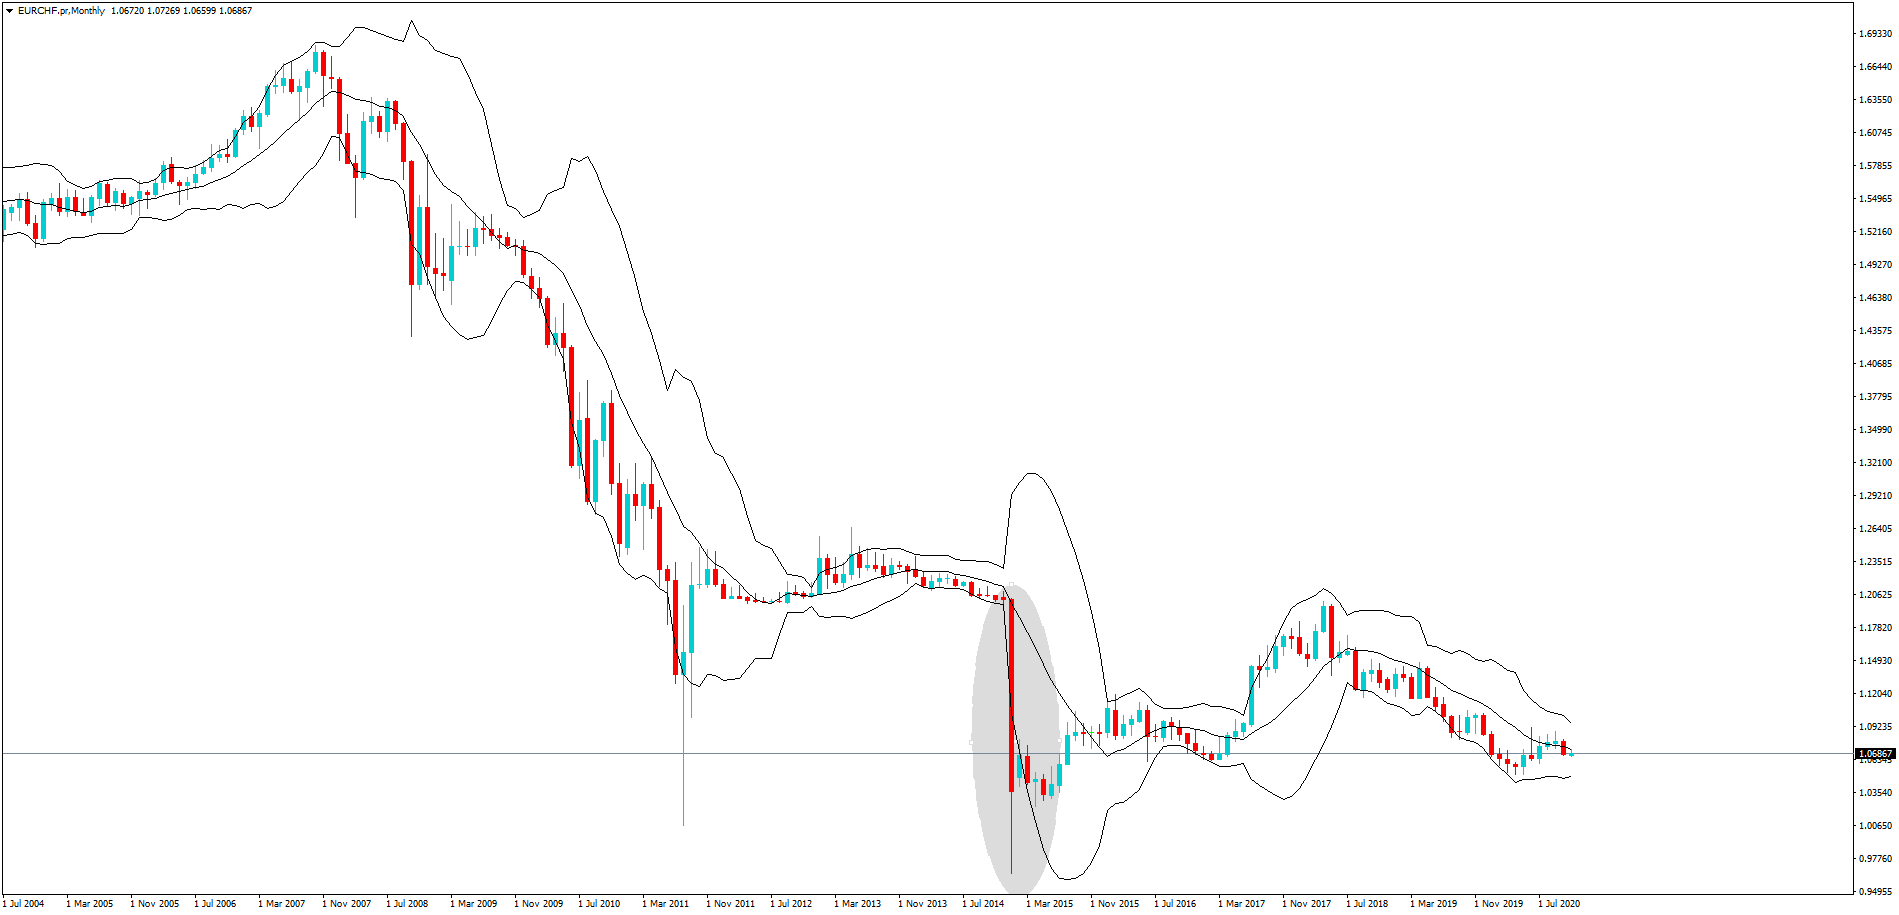
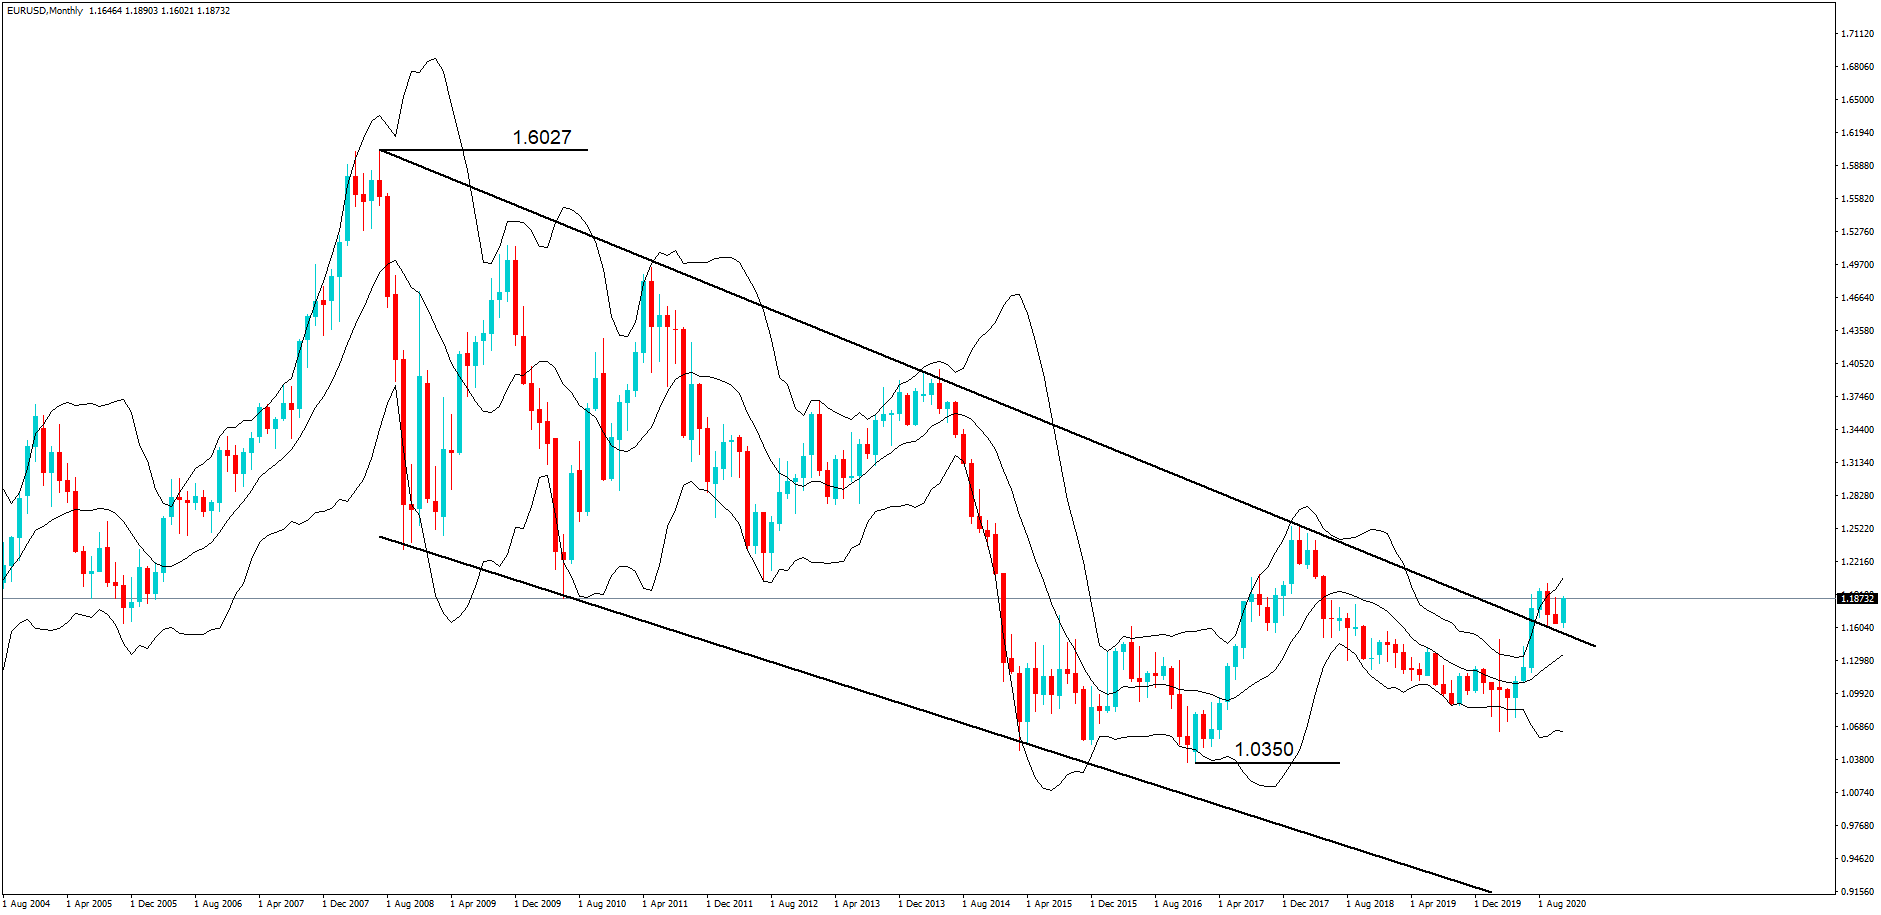
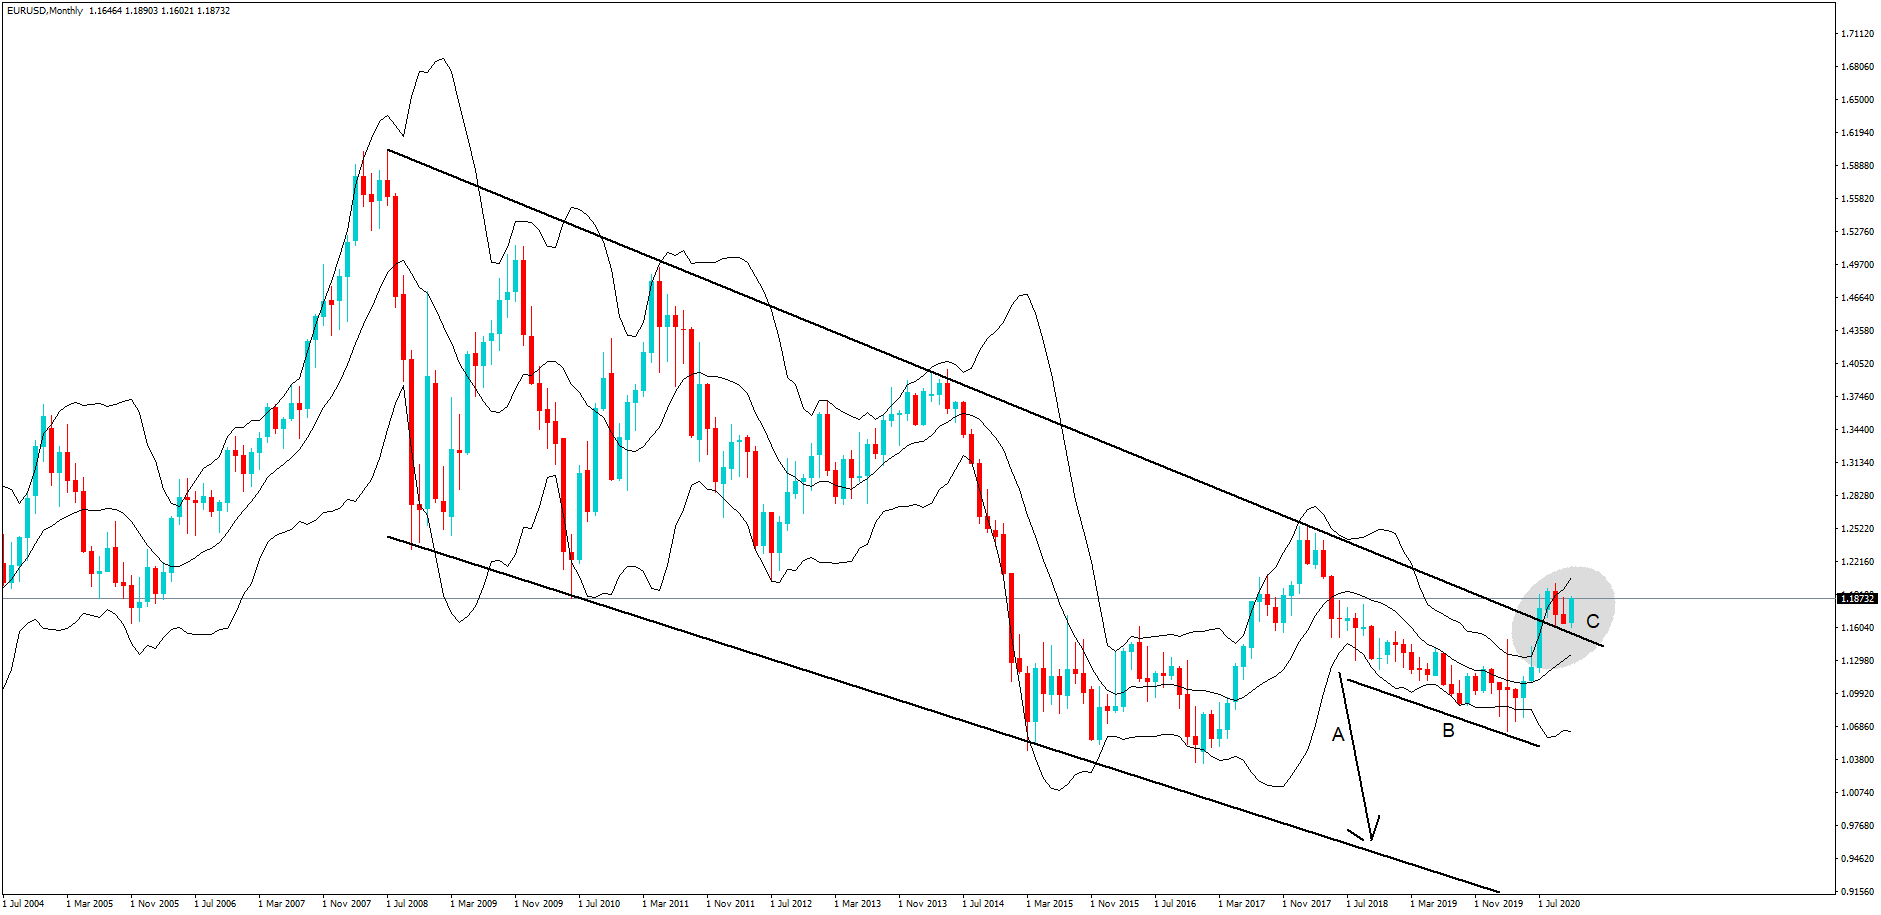
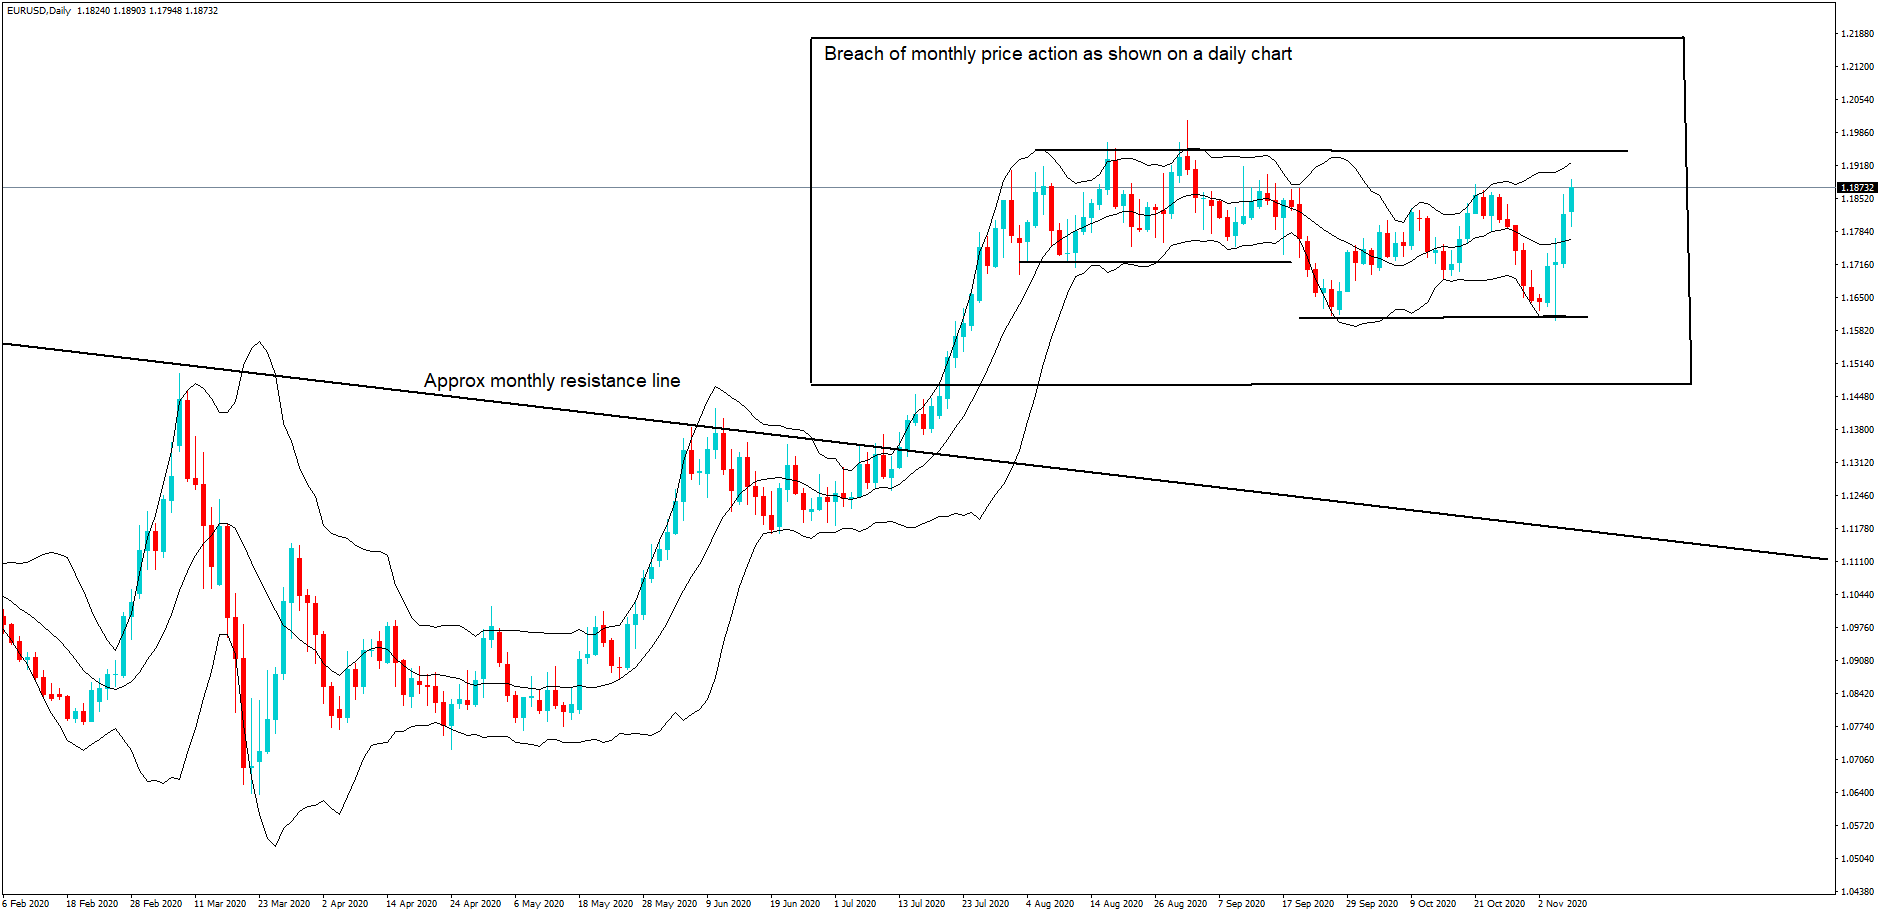
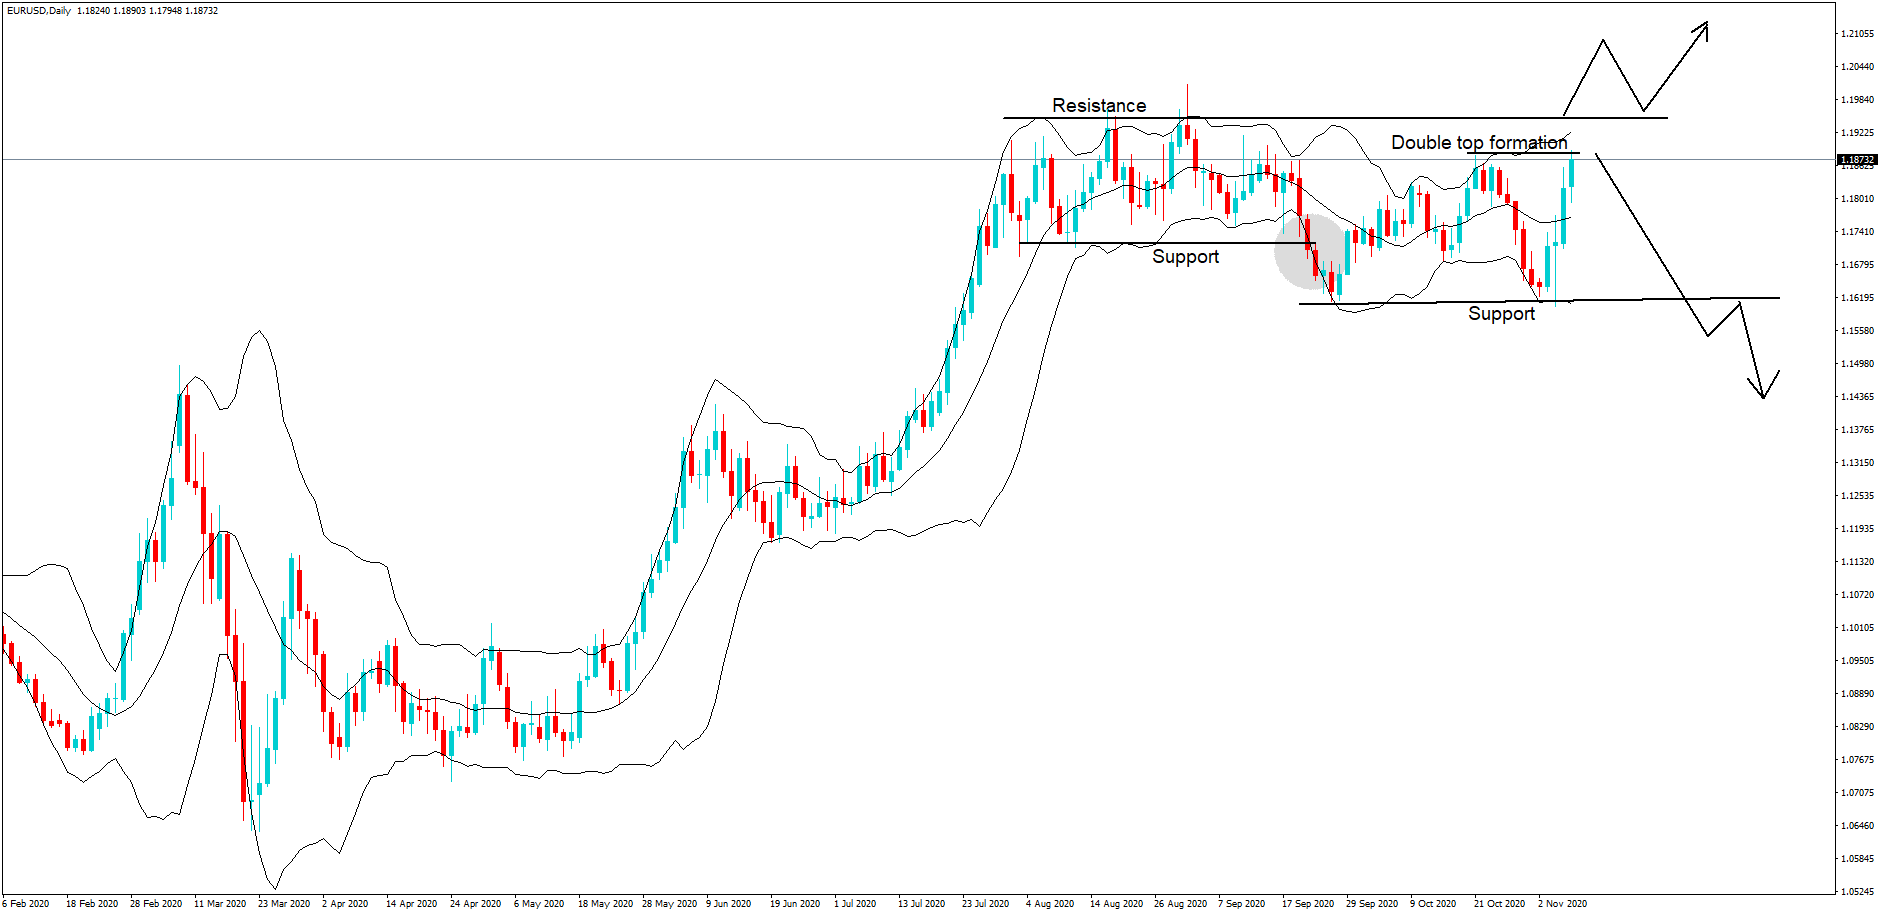

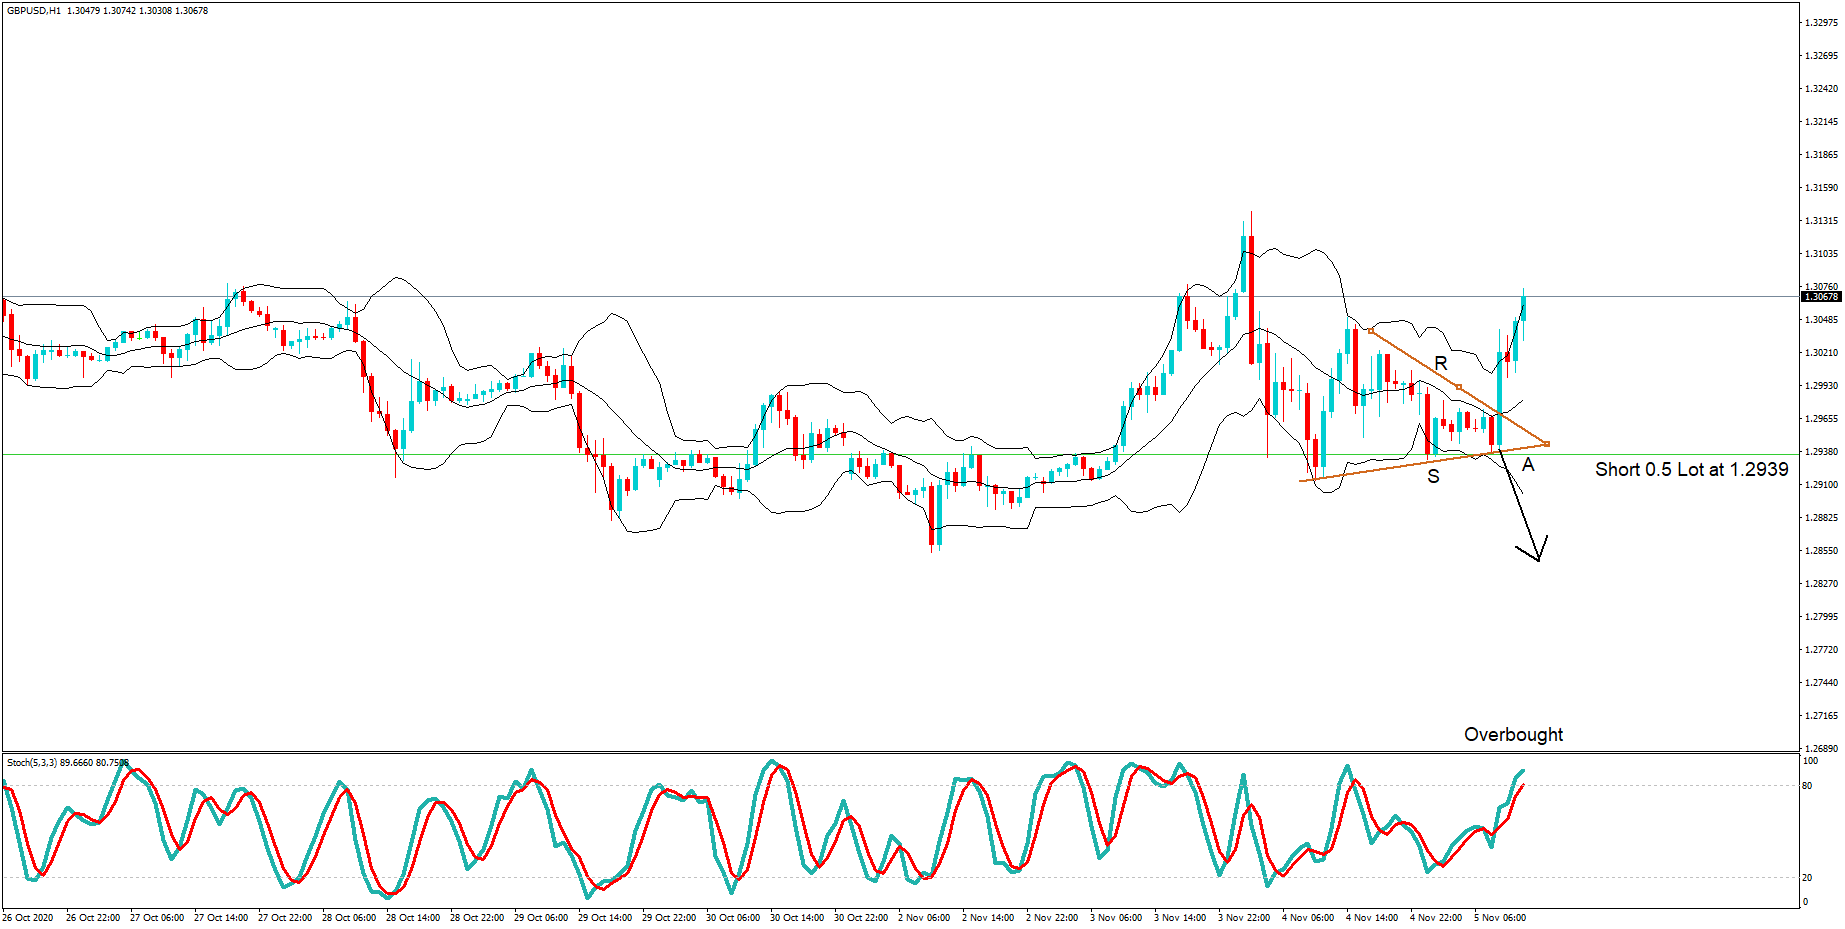
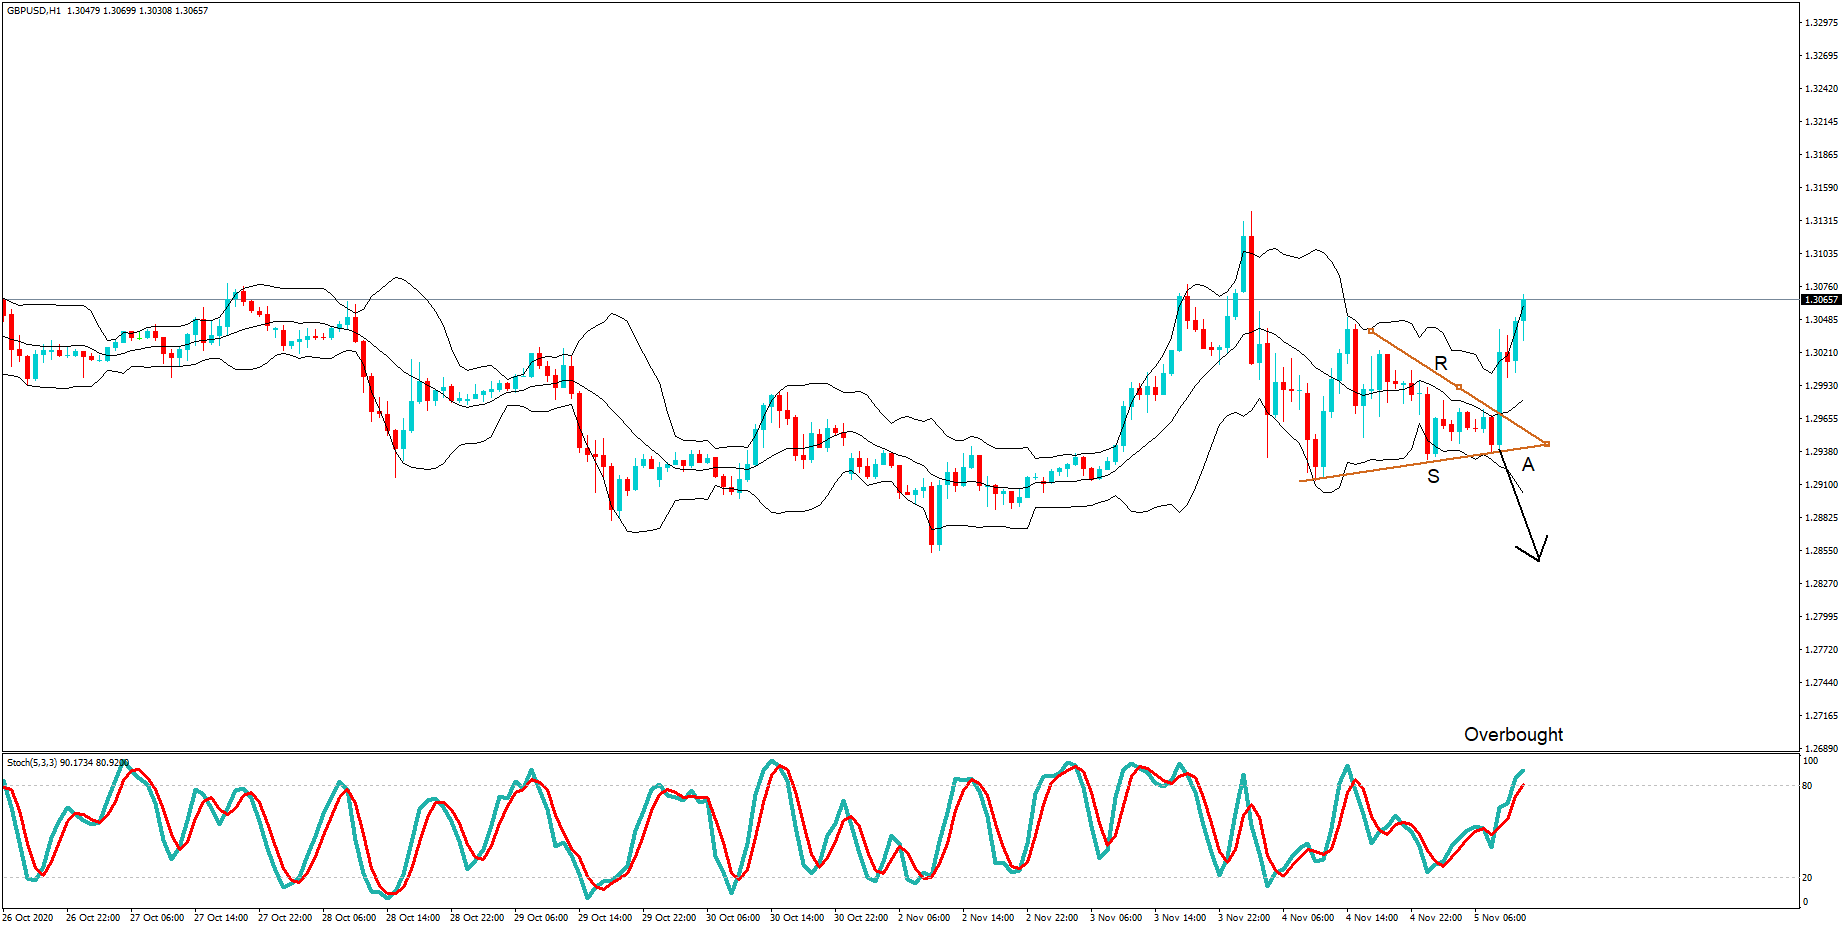
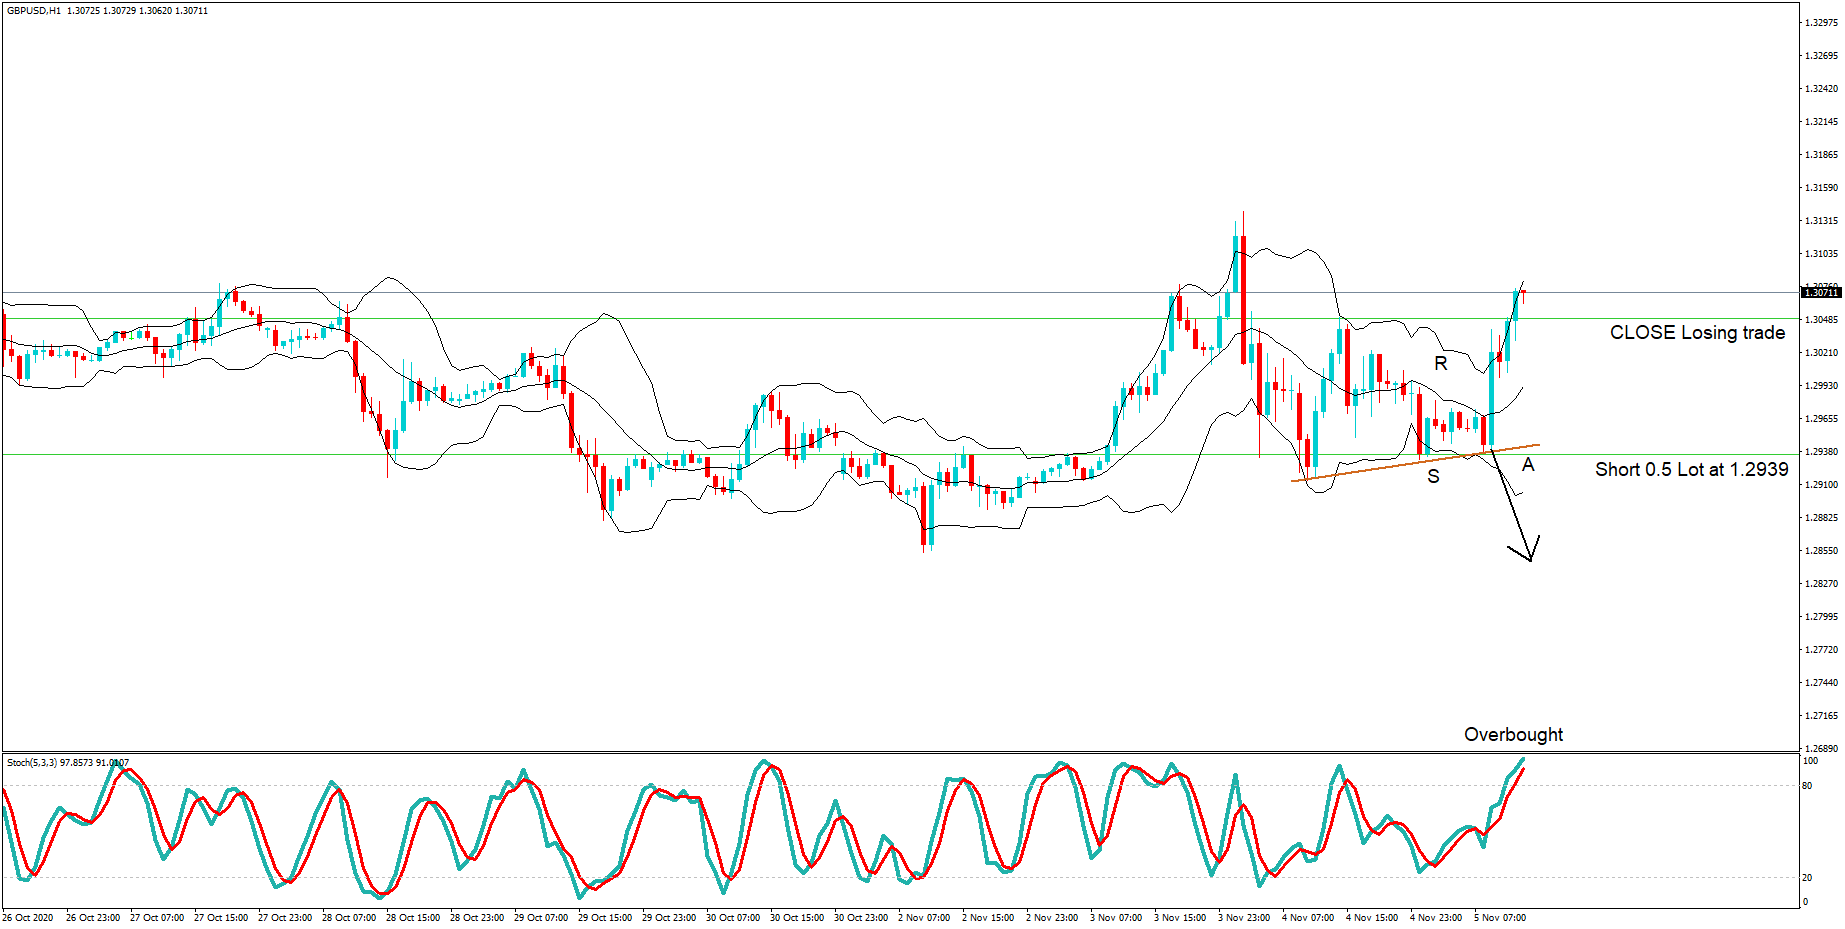
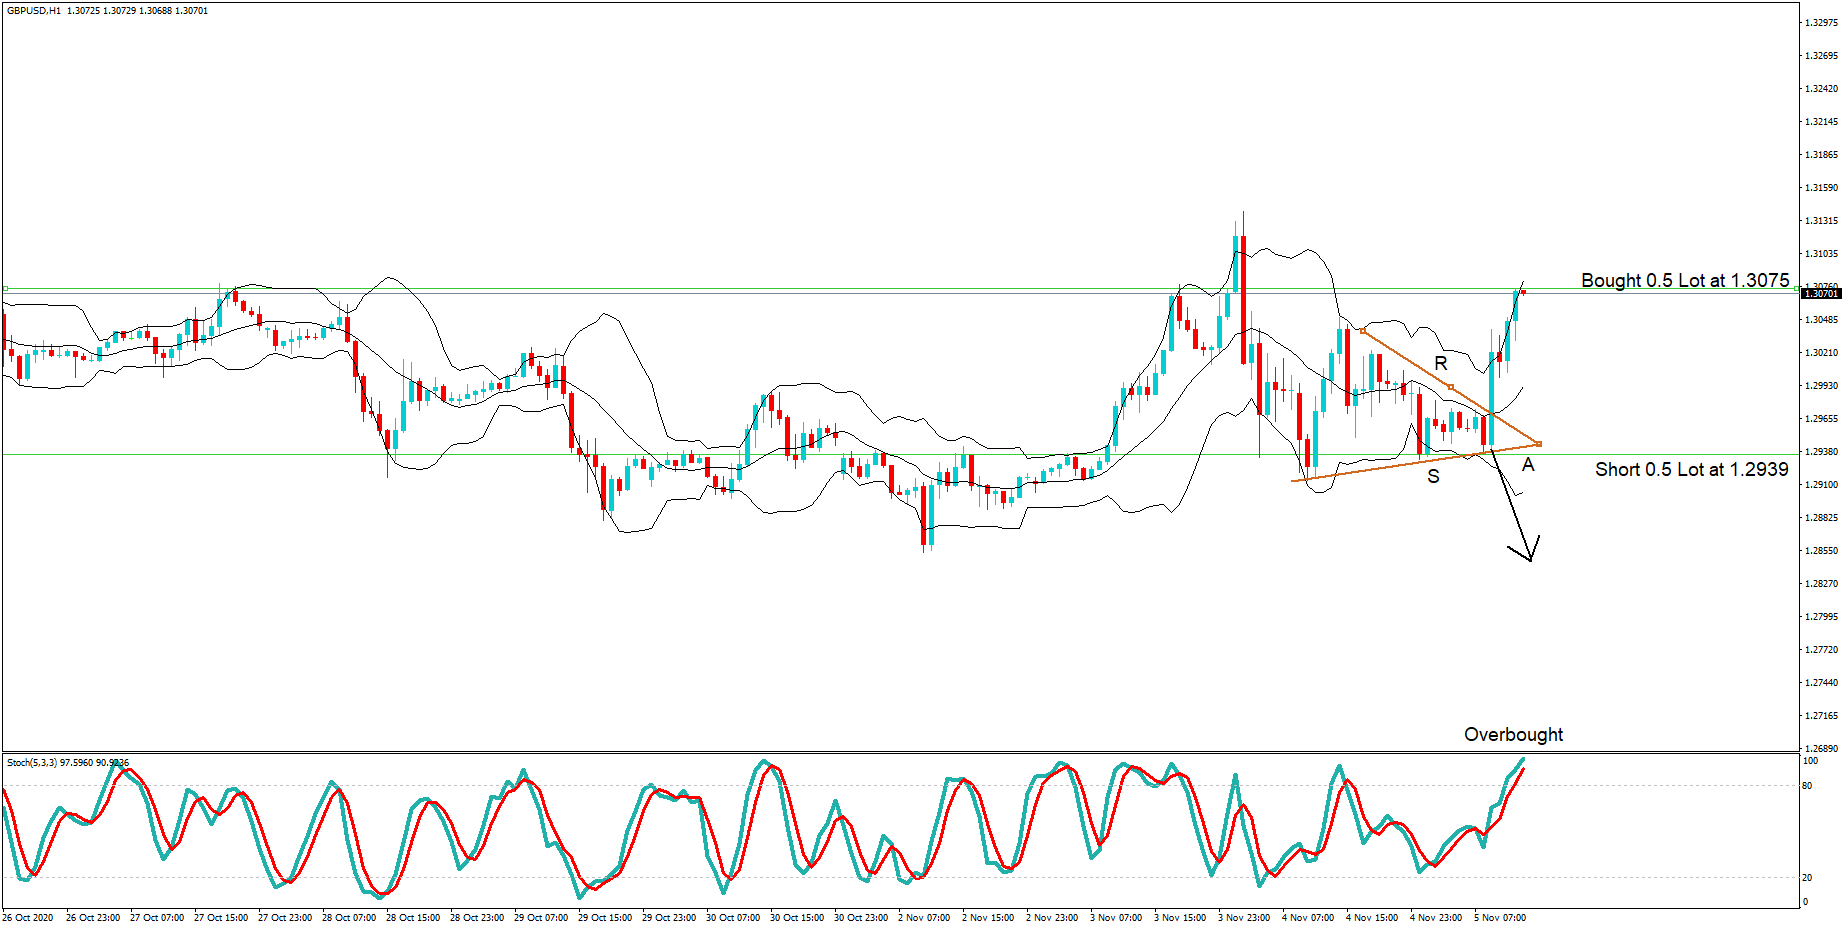
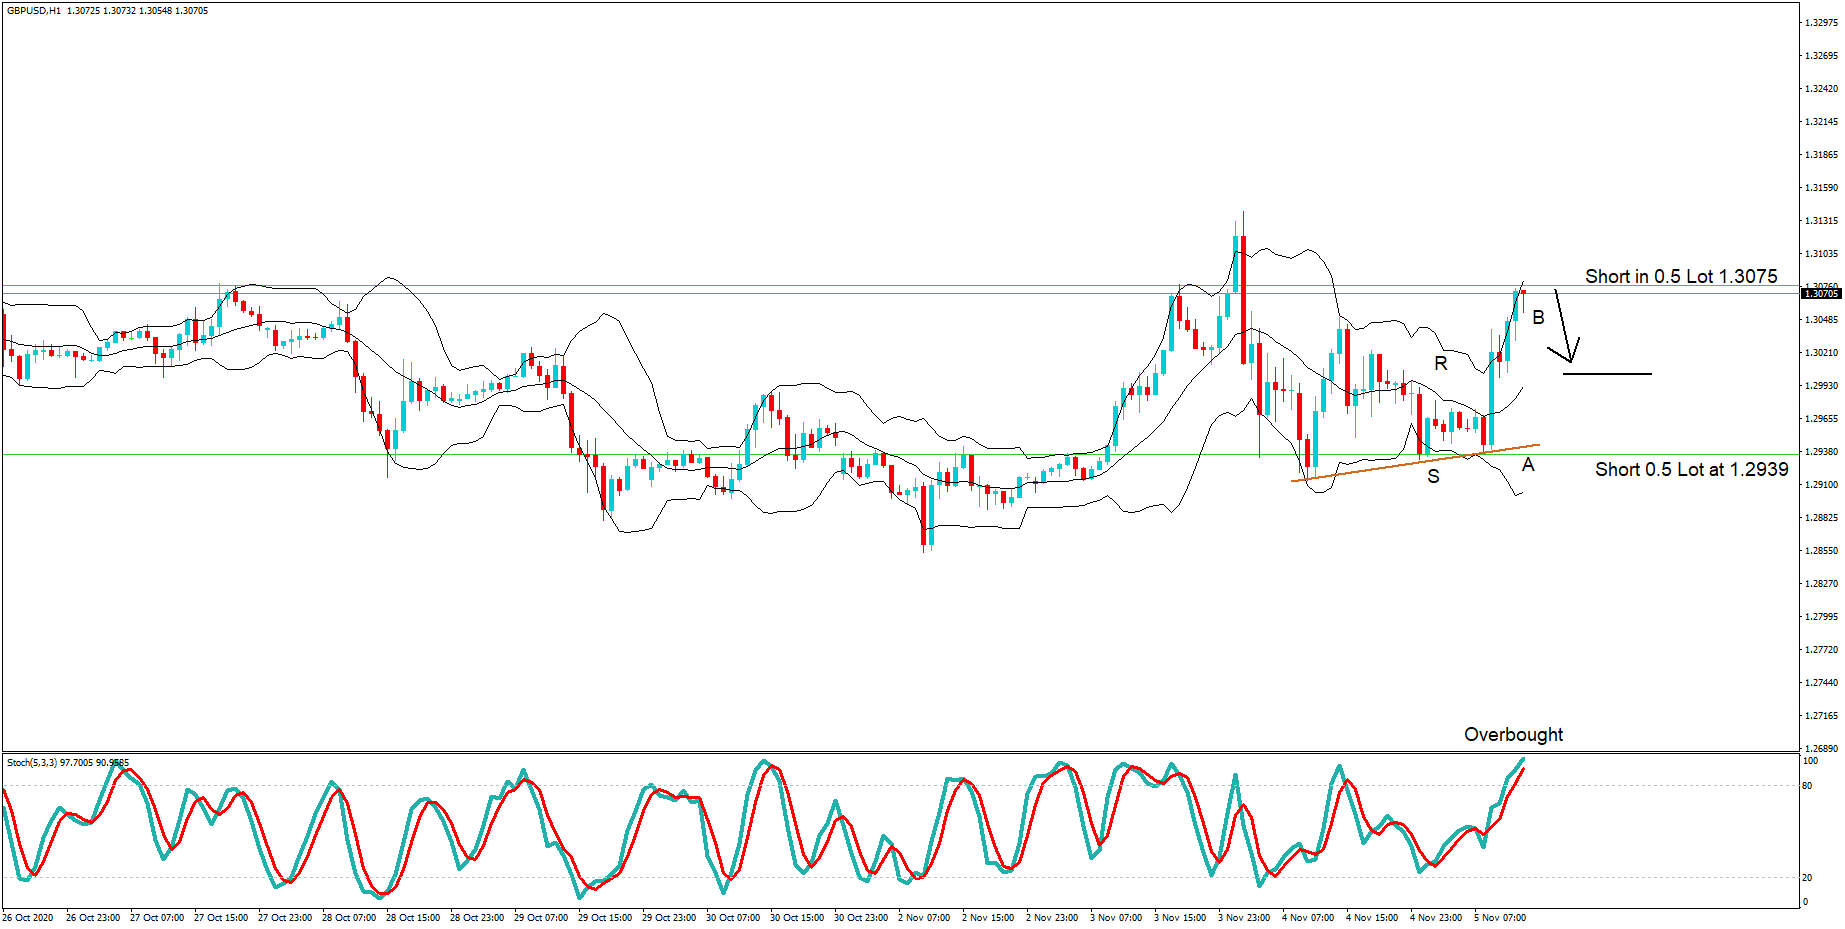
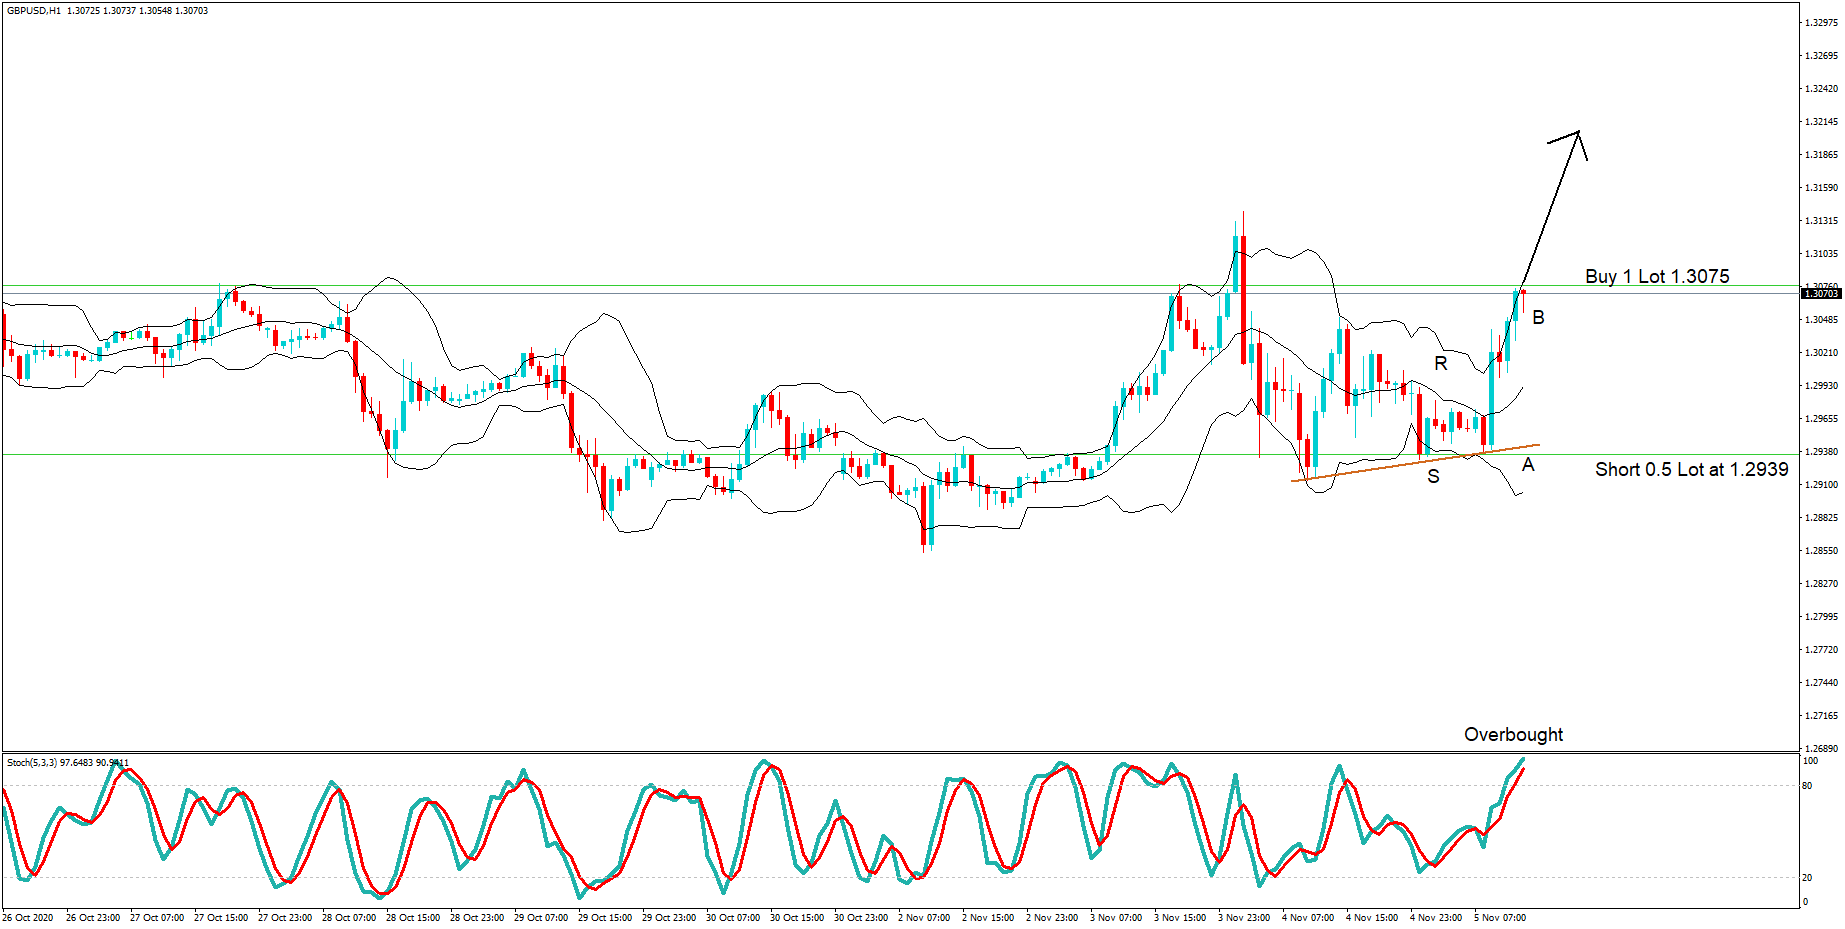
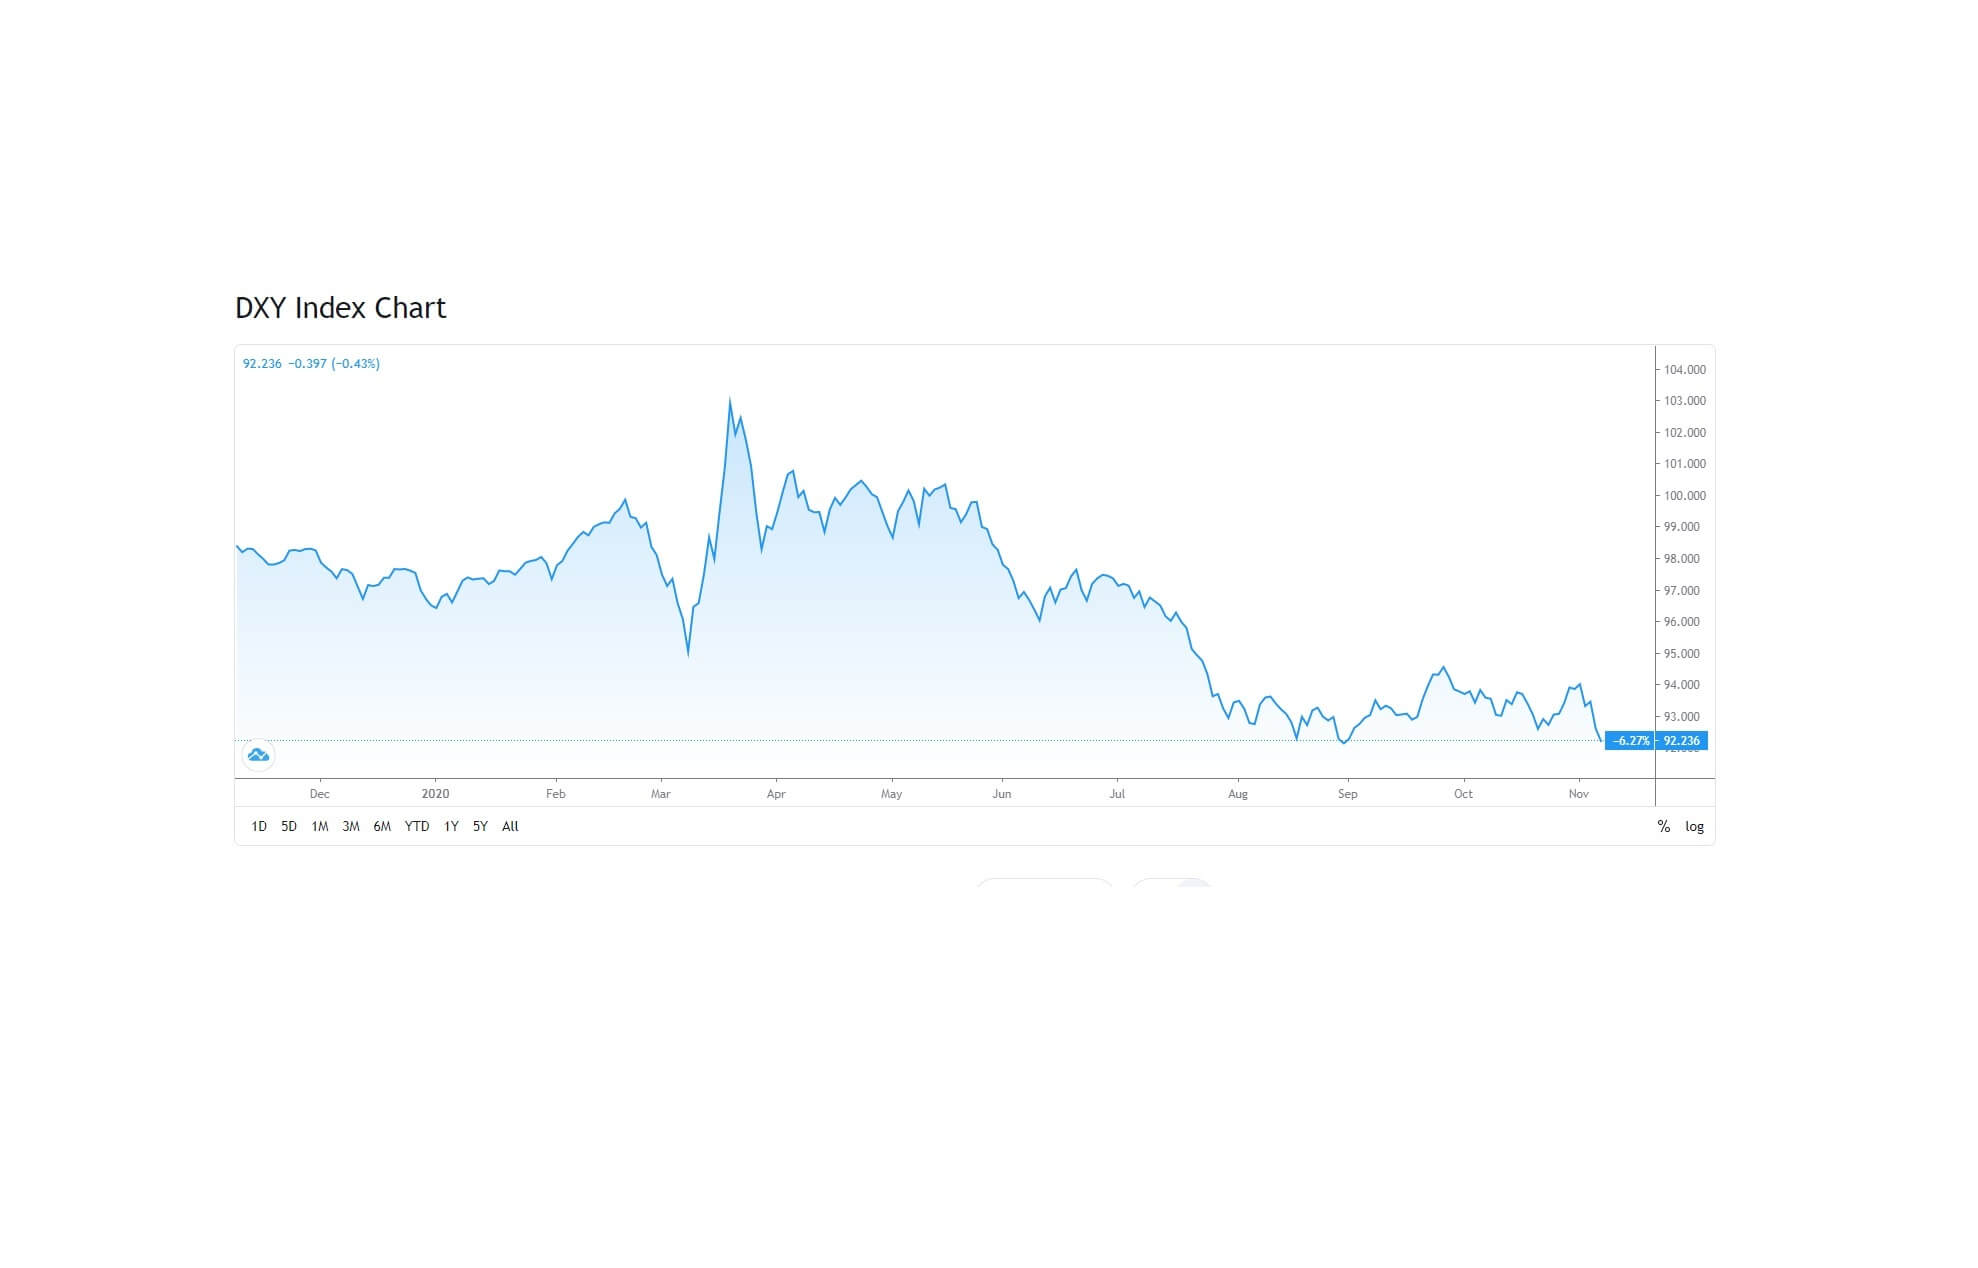
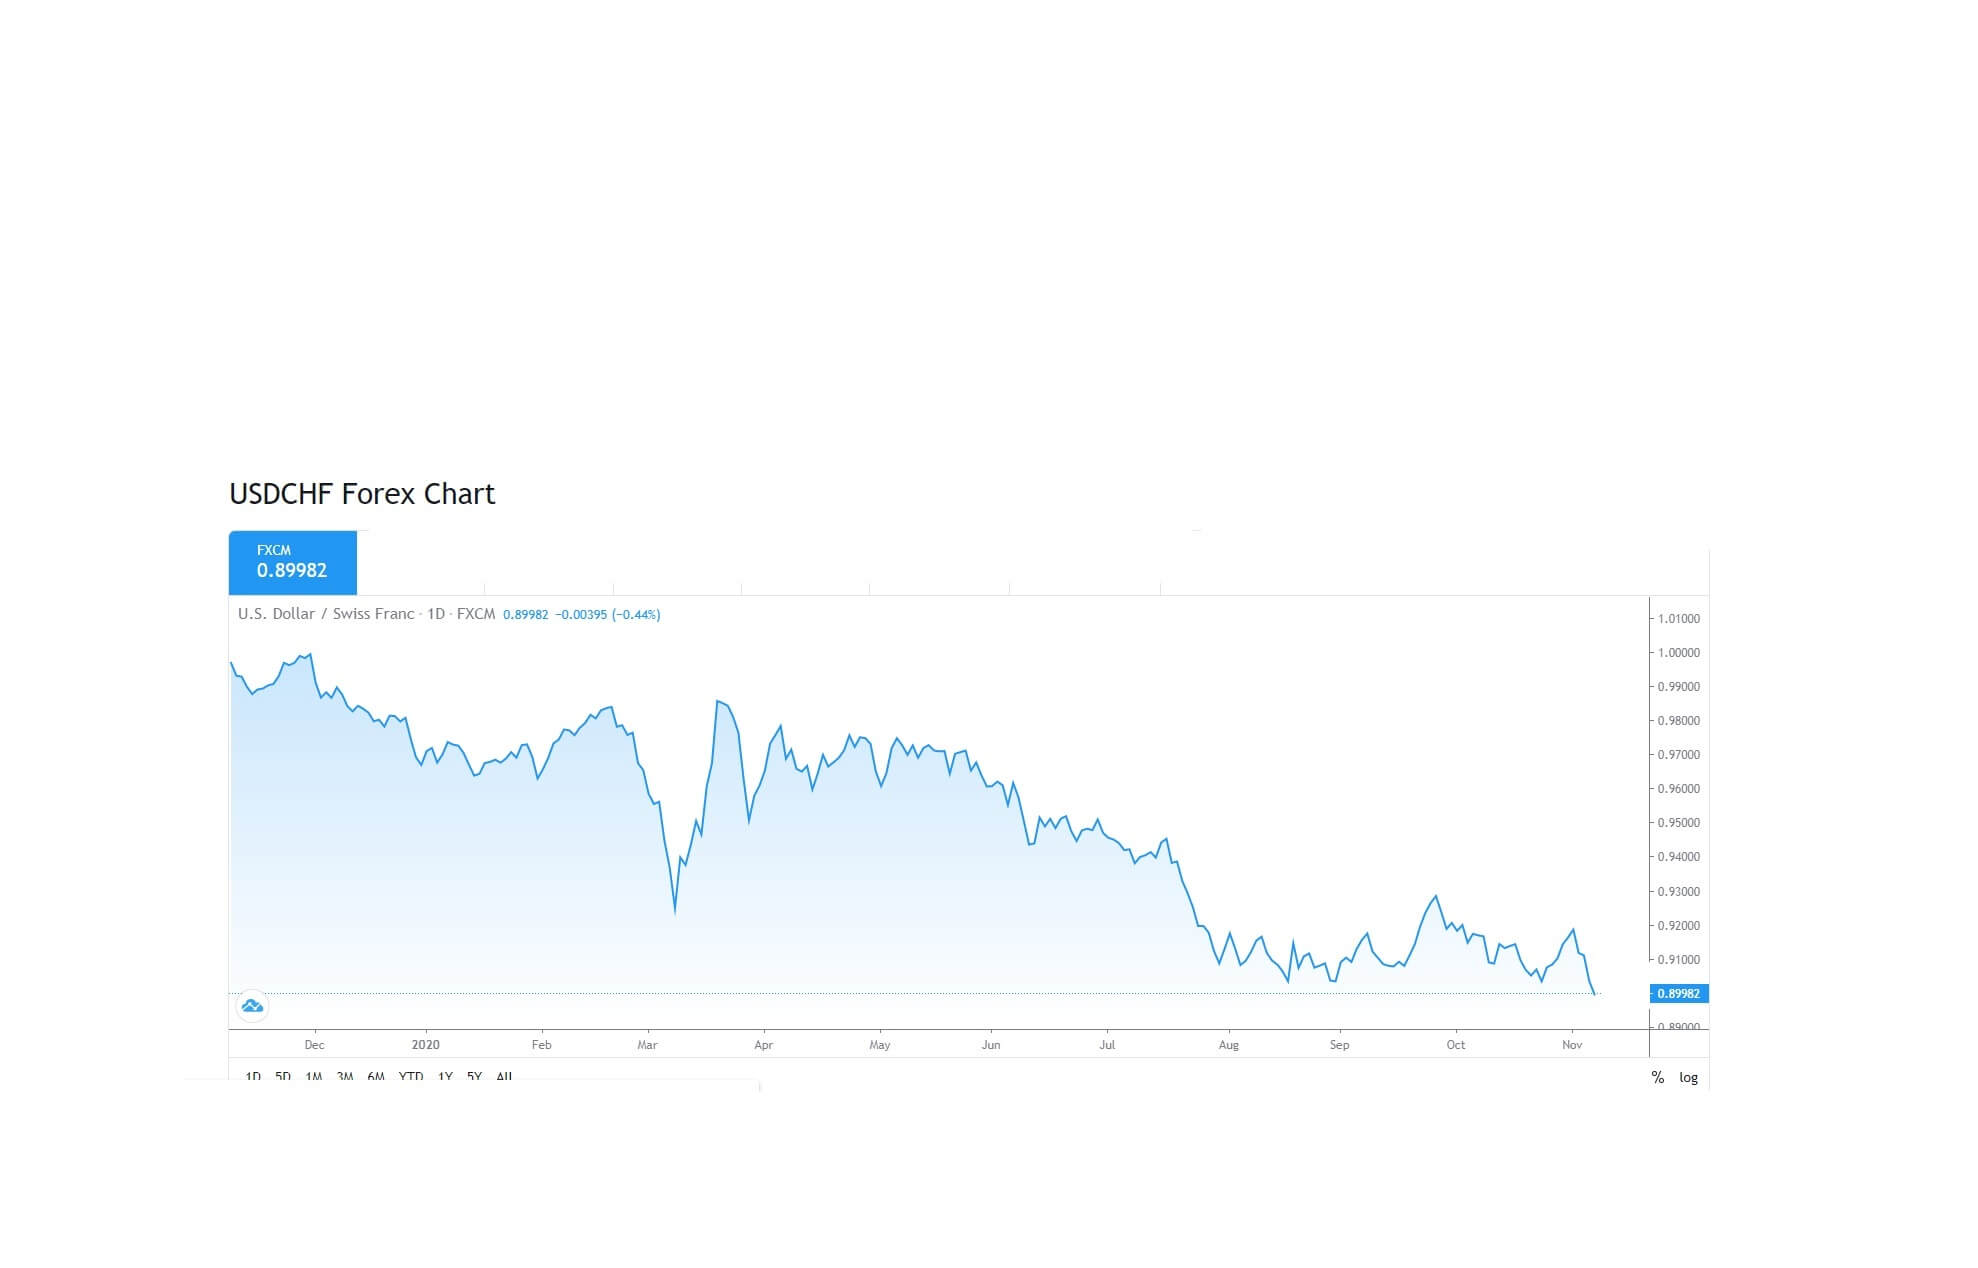
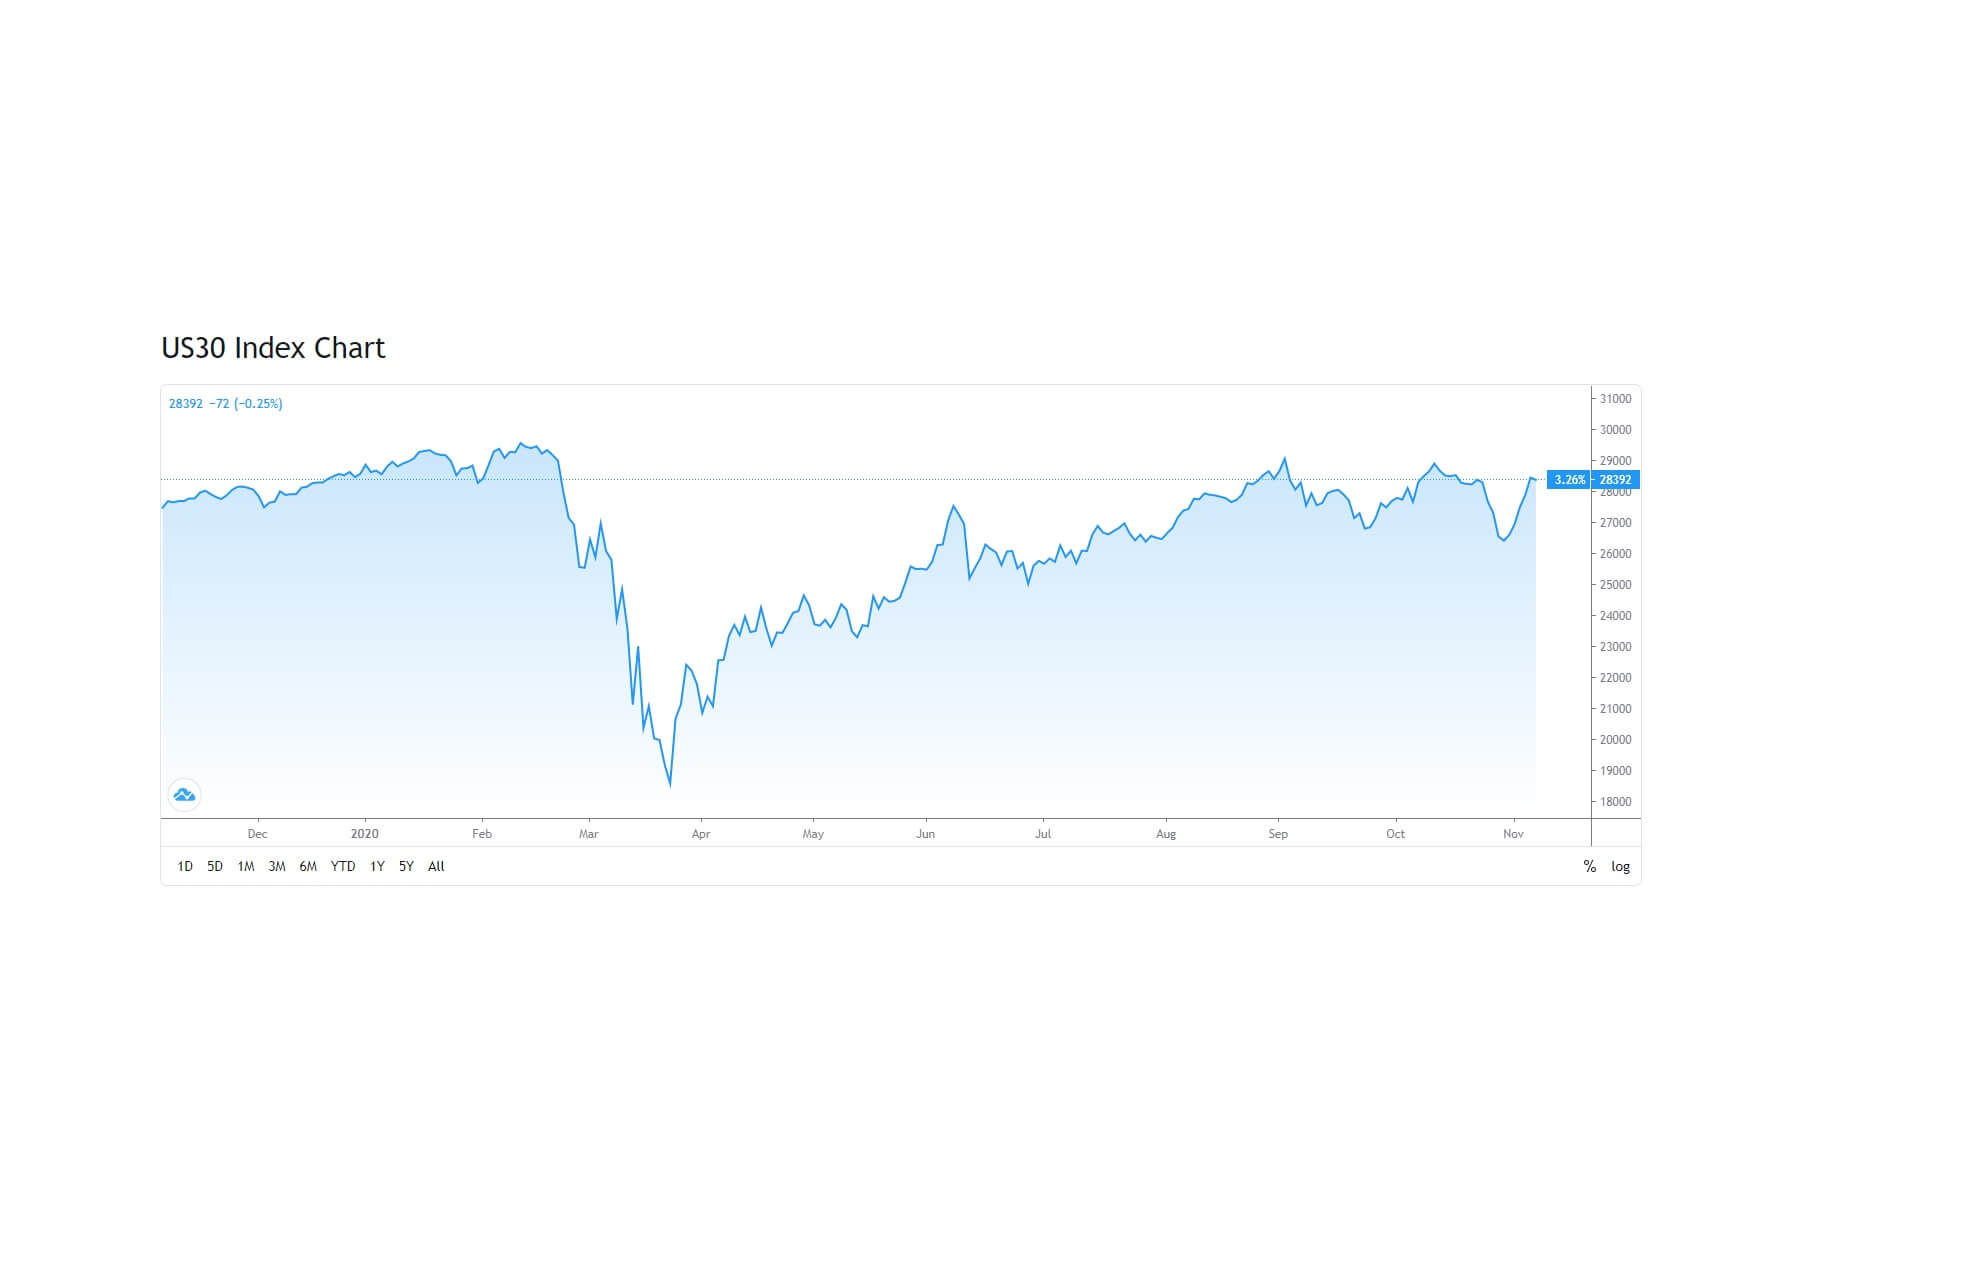
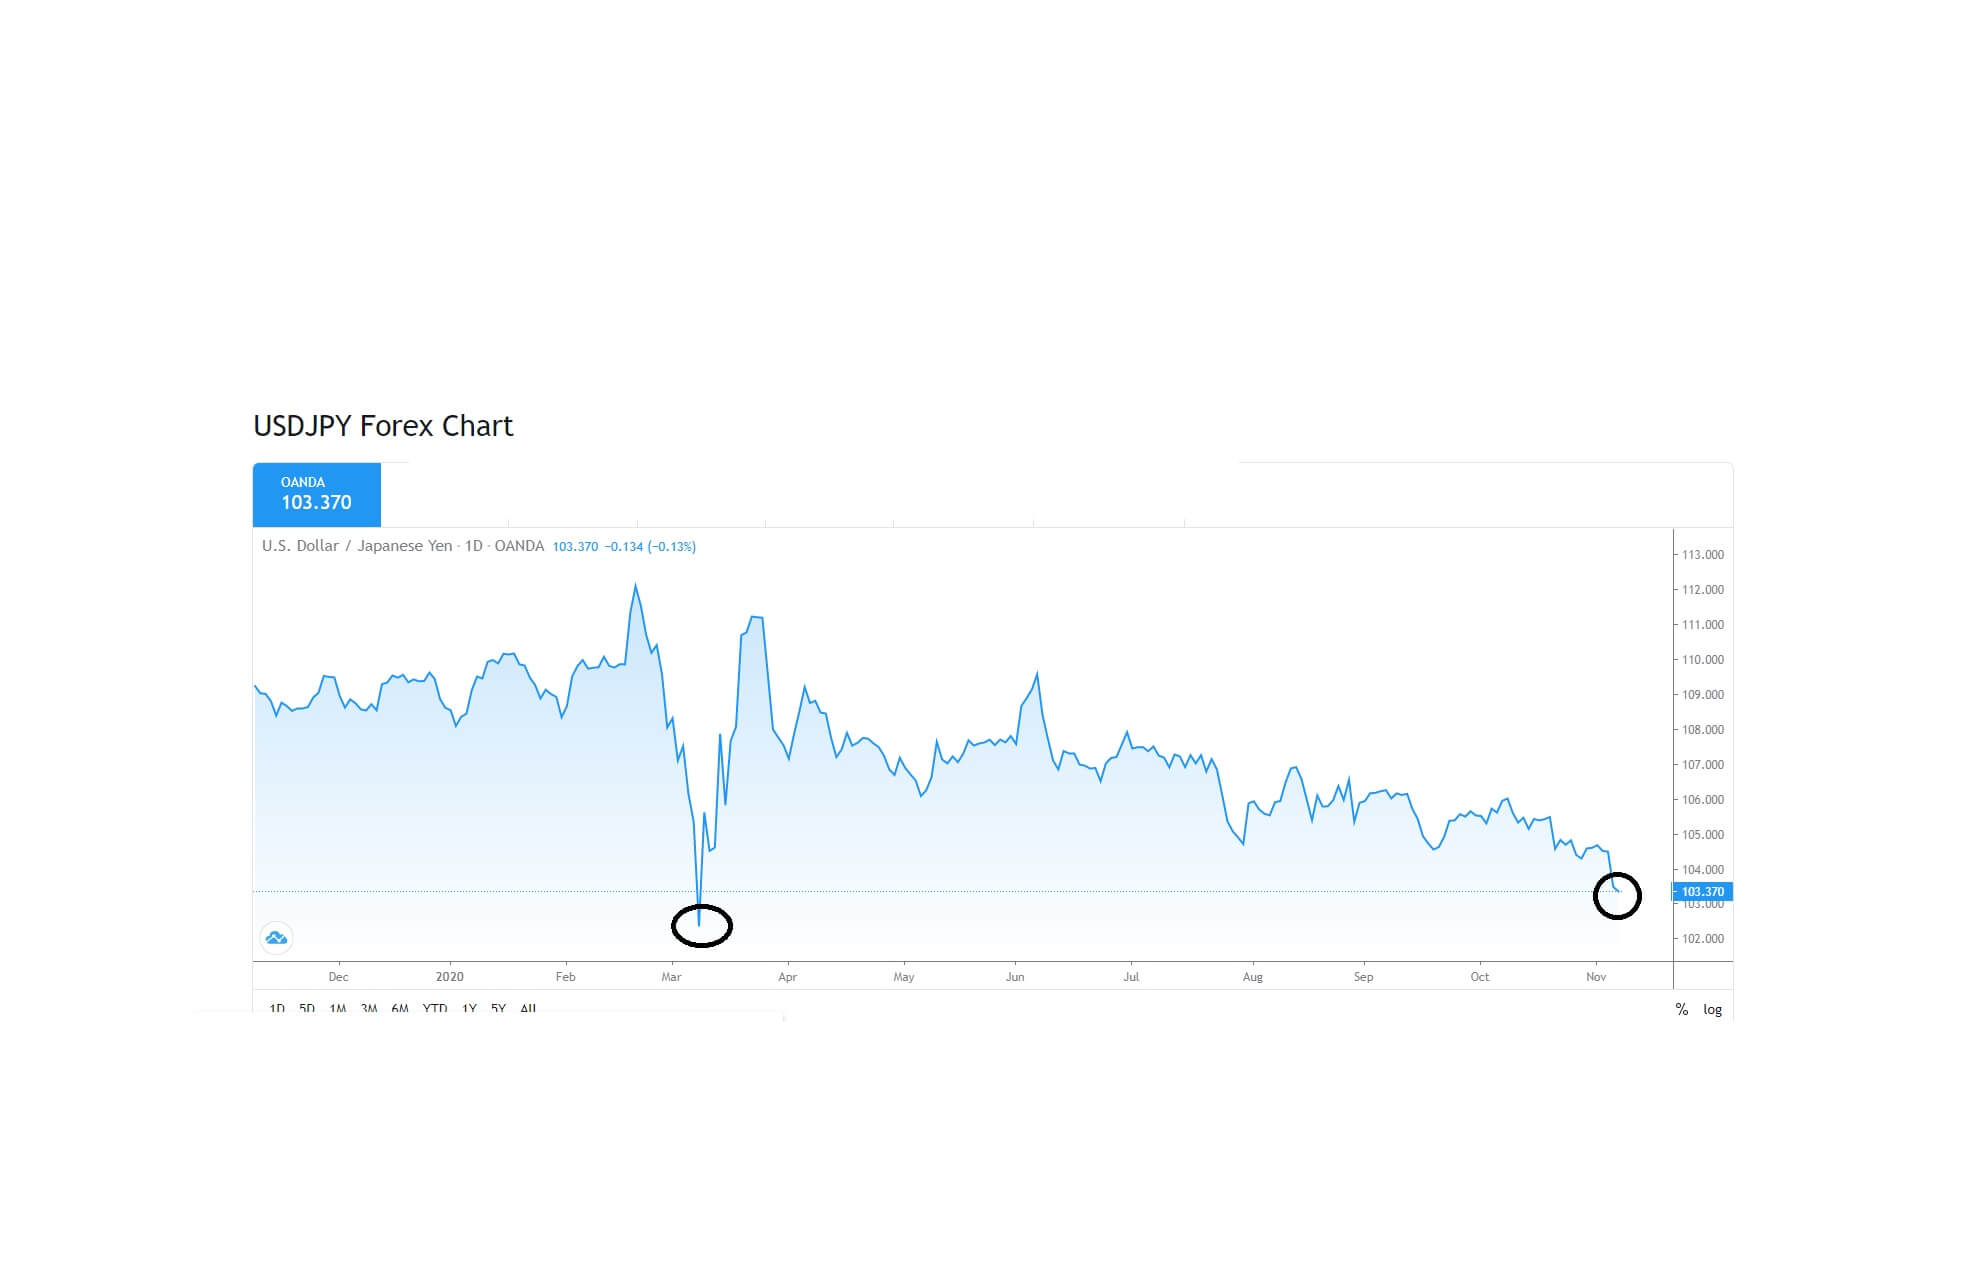
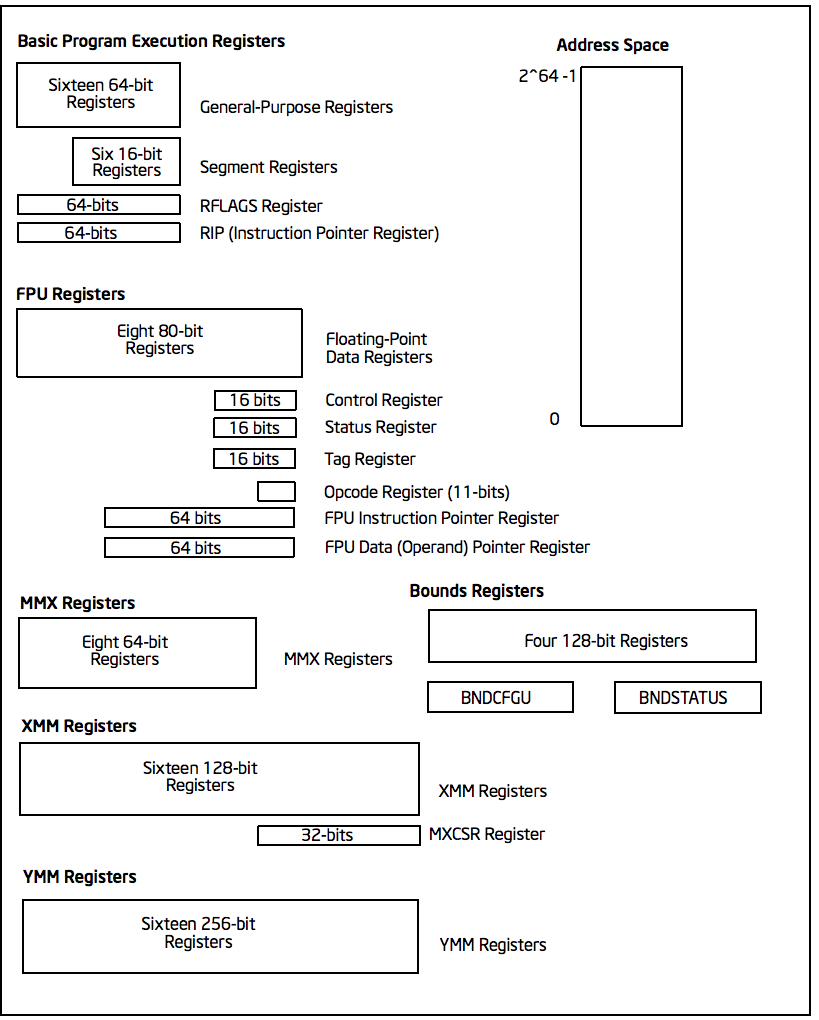