The AUD/USD prices have exhibited sharp bullish bias during the European and the U.S. session in the wake of stronger Aussie. The AUD/USD pair is currently holding around 0.6609. Meanwhile, the minutes of the Reserve Bank of Australia revealed that the Central Bank admitted that the Australian economy was set to experience a contraction due to coronavirus pandemic. Bank also believed that fiscal and monetary measures would reduce the impact of the virus crisis on the economy.
The AUD/USD prices have exhibited sharp bullish bias during the European and the U.S. session in the wake of stronger Aussie. The AUD/USD pair is currently holding around 0.6609. Meanwhile, the minutes of the Reserve Bank of Australia revealed that the Central Bank admitted that the Australian economy was set to experience a contraction due to coronavirus pandemic. Bank also believed that fiscal and monetary measures would reduce the impact of the virus crisis on the economy.
The AUD/USD prices have exhibited sharp bullish bias during the European and the U.S. session in the wake of stronger Aussie. The AUD/USD pair is currently holding around 0.6609. Meanwhile, the minutes of the Reserve Bank of Australia revealed that the Central Bank admitted that the Australian economy was set to experience a contraction due to coronavirus pandemic. Bank also believed that fiscal and monetary measures would reduce the impact of the virus crisis on the economy.
The Bank held its rates on a 0.25% level in its latest meeting and confirmed its intention to retain a 3-year bond yield of close to 0.25% by increasing government bond purchases.
RBA’s board members projected a 10% contraction in the Australian economy during H1 2020 and an overall decrease of 6% for the whole year. RBA said that the nature of shrinkage would be public health measures, and it would be easy & quick to recover from, in comparison of the contraction caused by financial factors. In the absence of any economic data from Australia, USD movement and updates about US-China & US-Australia relations drove this pair.
The technical outlook of the AUD/USD prices has violated 0.6563 resistance level, and bullish trend continuation can extend buying until 0.6688 level. The EMA and MACD are supporting an upward trend in the market, and these may lead Aussie further higher today.
The EUR/USD prices were closed at 1.09228 after placing a high of 1.09759 and a low of 1.09020. Overall the movement of the EUR/USD pair remained bullish throughout the day.
The EUR/USD prices were closed at 1.09228 after placing a high of 1.09759 and a low of 1.09020. Overall the movement of the EUR/USD pair remained bullish throughout the day.
The EUR/USD prices were closed at 1.09228 after placing a high of 1.09759 and a low of 1.09020. Overall the movement of the EUR/USD pair remained bullish throughout the day.
After gaining almost 100 pips at the start of the week, the EUR/USD pair rose to near its highest level in 2 weeks of 1.0976 level on Tuesday. The upbeat market mode was derived by the Franco-German recovery fund proposal, which was announced and provided a boost to the single currency EUR.
The Vice President of the European Commission, Valdis Dombrovskis, said that the European Stability Mechanism (ES) strongly supported the Franco-German proposal. Commission was also looking forward to presenting the proposal in the upcoming European summit on the 27th of May.
The technical outlook for EUR/USD pair seems bullish as the pair is trading at 1.0938, having formed a bullish engulfing pattern above an immediate support level of 1.0918 level. On the 4 hour timeframe, the pair is also forming a higher high and higher low pattern, which can drive further buying trends in the EUR/USD pair. The MACD is bullish, while the 50 EMA is also supporting the bullish bias among traders. The pair has the potential to trade towards north to target 1.0993 triple top area while support holds at 1.0918 and 1.08850 level today.
Gold prices were closed at $1744.21 after placing a high of $1747.91 and a low of $1725.74. Overall the movement of gold prices traded downward throughout the day. Gold prices posted gains after US Treasury Secretary; Steven Mnuchin warned that if coronavirus lockdown continued for months, then the US economy could face permanent damage. He added that job numbers would fell on a worse level before they get better. US administration’s officers said that the government could suffer losses from the risky loans it issued during the pandemic.
Gold prices were closed at $1744.21 after placing a high of $1747.91 and a low of $1725.74. Overall the movement of gold prices traded downward throughout the day. Gold prices posted gains after US Treasury Secretary; Steven Mnuchin warned that if coronavirus lockdown continued for months, then the US economy could face permanent damage. He added that job numbers would fell on a worse level before they get better. US administration’s officers said that the government could suffer losses from the risky loans it issued during the pandemic.
Gold prices were closed at $1744.21 after placing a high of $1747.91 and a low of $1725.74. Overall the movement of gold prices traded downward throughout the day. Gold prices posted gains after US Treasury Secretary; Steven Mnuchin warned that if coronavirus lockdown continued for months, then the US economy could face permanent damage. He added that job numbers would fell on a worse level before they get better. US administration’s officers said that the government could suffer losses from the risky loans it issued during the pandemic.
At this moment, the yellow-metal prices are currently trading at 1,748.71 and are consolidating above a strong support area of 1,739 level. Moreover, the broad-based US dollar modest weakness kept a lid on any additional losses in the gold and contributed to the pair’s bullish moves.
On the technical side, gold has completed 50% Fibonacci retracement at 1,727 level, and closings of candles above this level have the potential to lead gold prices higher towards 1,754 and 1,763. While the 50 EMA is also supporting bullish bias. At the same time, the MACD is forming smaller histograms on the selling side, signaling chances of bullish trend continuation on gold.
The safe-haven currency Japanese yen is losing it’s appeal in the wake of the risk-on market sentiment, which could be attributed to the latest optimism about the coronavirus vaccine. Moderna shared the positive results of its phase one experiment for its COVID-19 vaccine, which weakened the demand for the safe-haven Japanese yen and pushed the currency pair AUD/JPY higher.
The safe-haven currency Japanese yen is losing it’s appeal in the wake of the risk-on market sentiment, which could be attributed to the latest optimism about the coronavirus vaccine. Moderna shared the positive results of its phase one experiment for its COVID-19 vaccine, which weakened the demand for the safe-haven Japanese yen and pushed the currency pair AUD/JPY higher.
The safe-haven currency Japanese yen is losing it’s appeal in the wake of the risk-on market sentiment, which could be attributed to the latest optimism about the coronavirus vaccine. Moderna shared the positive results of its phase one experiment for its COVID-19 vaccine, which weakened the demand for the safe-haven Japanese yen and pushed the currency pair AUD/JPY higher.
The drugmaker company Moderna said there was a high probability that this vaccine would provide protection against coronavirus disease. This news rose risk sentiment in the market and made the US dollar weaker. The broad-based US dollar reported modest losses on the day and dropped further from Friday’s 3-weeks high, which eventually held investors from placing any strong position and limited the upward trend of USD/JPY currency pair, which also triggered buying in AUD/JPY.
The AUD/JPY pair traders did not give any significant attention to Tuesday’s dovish RBA meeting minutes; wherein they showed that the board members were prepared to increase bond purchases to control the economic fallout caused by the coronavirus pandemic. The buyers also ignored the intensifying tension between the US-China and fears about the second wave of coronavirus outbreak.
The AUD/JPY has violated the ascending triangle pattern, which can be seen on the 4-hour timeframe at 70.166 level. Bullish crossover of this level could drive more buying until the next resistance level of 71.35. The recent two candles on the 4-hour timeframe are suggesting odds of bullish trend continuation. Therefore, we have taken a buying position at 70.694 with a stop loss at 70.094 and take profit at 71.494.
The safe-haven-metal prices flashed green and erased its previous session losses mainly due to intensifying trade war tensions between the US-China. However, the yellow metal hit its highest level since December of 2012 at $1,765 on Monday, but after that, the gold prices dropped sharply during the American trading session. The reason for the sharp decline could be attributed to the positive news about the COVID-19 vaccine.
The safe-haven-metal prices flashed green and erased its previous session losses mainly due to intensifying trade war tensions between the US-China. However, the yellow metal hit its highest level since December of 2012 at $1,765 on Monday, but after that, the gold prices dropped sharply during the American trading session. The reason for the sharp decline could be attributed to the positive news about the COVID-19 vaccine.
The safe-haven-metal prices flashed green and erased its previous session losses mainly due to intensifying trade war tensions between the US-China. However, the yellow metal hit its highest level since December of 2012 at $1,765 on Monday, but after that, the gold prices dropped sharply during the American trading session. The reason for the sharp decline could be attributed to the positive news about the COVID-19 vaccine.
At this moment, the yellow-metal prices are currently trading at 1,733.71 and are consolidating in the range between 1,732.05 –and 1,740.38, while representing 0.18% gains and having hit the high of $1,735.84. Moreover, the broad-based US dollar modest weakness kept a lid on any additional losses in the gold and contributed to the pair’s bullish moves.
Gold futures were higher by 0.27% at $1,739.35 by 12:43 AM ET (5:43 AM GMT). Stocks, which normally have an inverse relationship with gold, were also up on Tuesday. Despite the optimism surrounding the market about Moderna (NASDAQ: MRNA) reports of positive results on Monday from its phase one experiment for its COVID-19 vaccine, the investors preferring into safe-haven yellow metal manly because the US-China trade tussle was getting worse day by day.
Trump warned about stopping US funds to WHO if the United Nations body will not be able to show bigger improvements and independence from China in the next 30 days. The reason behind the high preference of gold in the market could be the report that the NASDAQ stock exchange set to implement new restrictions on Chinese IPOs.
Daily Support and Resistance
S1 1666.87
S2 1704.45
S3 1718.73
Pivot Point 1742.02
R1 1756.3
R2 1779.6
R3 1817.17
On the technical side, the yellow metal gold is trading sideways below 1,739 resistance and above the support level of 1,726 level. In between this range, the market is likely to offer choppy trading sessions, until the trading range gets violated. We may see an extension of a bullish trend upon the bullish breakout of 1,739, which may open further room for buying until the next target level of 1,750 and 1,759. Below 1,726 old prices can drop until 1,716 level. Let’s wait for a breakout, and then we will open a position accordingly. Good luck!
EURAUD has been moving inside a slightly ascending channel. The last interaction of the price drove the pair to the bottom of the channel. On Monday afternoon, the price did a strong reversal on increased volume, confirmed by a second bullish candle. We see also that the MACD made a bullish transition, as the RSI reversed from the 30 level.
EURAUD has been moving inside a slightly ascending channel. The last interaction of the price drove the pair to the bottom of the channel. On Monday afternoon, the price did a strong reversal on increased volume, confirmed by a second bullish candle. We see also that the MACD made a bullish transition, as the RSI reversed from the 30 level.
EURAUD has been moving inside a slightly ascending channel. The last interaction of the price drove the pair to the bottom of the channel. On Monday afternoon, the price did a strong reversal on increased volume, confirmed by a second bullish candle. We see also that the MACD made a bullish transition, as the RSI reversed from the 30 level.
A bullish setup can be created with entry at the current levels and target at the top of the channel, and stop-loss below the last lows.
Risk:76 pips, or $491 per lot, 49,1 per mini-lot, and 4.91 per micro-lot
Reward: 126 pips, or $816 per lot, 81.6 per mini-lot, and 8.16 per micro-lot.
A knowledgeable trader will invest no more than 2 percent of its funds in a trade. A rookie trader should start less, no more than 1 percent. That means five micro-lots every $1,000 in the trading account.
The GBPAUD cross, in its hourly chart, advances in a downward structure that follows the Elliott wave sequence as an ending diagonal pattern, which suggests a potential scenario of upside.
According to the textbook, the ending diagonal pattern is a structure that reflects the exhaustion of the trend, and its reversion would be imminent.
Currently, the price action advances below the lower guideline of the diagonal pattern, which warns us about the potential bearish failure continuation.
Our bullish scenario considers the long-side entry in the current area, looking for the upward move until the previous consolidation area at 1.8998. Our upward outlook considers the invalidation level at 1.87187
The GBP/JPY pair flashing green as the currency pair soared from multi-day lows below the 129.260 as the Brexit uncertainty and also BOE’s willingness to act weighed on the pair. Whereas, the slowdown in the UK’s coronavirus (COVID-19) cases helping the currency pair to erase its early-day losses.
The GBP/JPY pair flashing green as the currency pair soared from multi-day lows below the 129.260 as the Brexit uncertainty and also BOE’s willingness to act weighed on the pair. Whereas, the slowdown in the UK’s coronavirus (COVID-19) cases helping the currency pair to erase its early-day losses.
The GBP/JPY pair flashing green as the currency pair soared from multi-day lows below the 129.260 as the Brexit uncertainty and also BOE’s willingness to act weighed on the pair. Whereas, the slowdown in the UK’s coronavirus (COVID-19) cases helping the currency pair to erase its early-day losses.
The GBP/JPY recovered from the earlier losses, which they added in the downfall of GBP/JPY prices, was the increased tensions between US & China after the US Commerce Department announced to cut off Huawei from overseas chips manufacturers. The department showed concerns that the Chinese government was trying to spy by building backdoors into the network infrastructure. However, China denied such accusations and said that it would respond accordingly. This increased risk-appetite from the market is also driving bullish bias for the GBP/JPY pair.
<
Technically, the GBP/JPY is heading north to trade below an immediate resistance level of 131.33. The level is important as the 50 periods EMA holds there, while the downward trendline may also extend resistance around 131.336. Conversely, the bullish crossover of 131.336 level may help drive the selling trend in the GBP/JPY pair today. Let’s place a sell limit at 131.
The USD/CAD pair was closed at 1.40460 after placing a high of 1.41406 and a low of 1.40318. Overall the movement of the USD/CAD pair remained bearish throughout the day. After posting gains for the last 3 days, the USD/CAD pair dropped on Thursday amid the increased demand for crude oil. WTI Crude Oil gained ground after the International Energy Agency (IEA) improved its oil demand outlook for 2020. Oil prices rose to $27.92 barrel on Thursday and gave strength to commodity-linked currency-Loonie.
The USD/CAD pair was closed at 1.40460 after placing a high of 1.41406 and a low of 1.40318. Overall the movement of the USD/CAD pair remained bearish throughout the day. After posting gains for the last 3 days, the USD/CAD pair dropped on Thursday amid the increased demand for crude oil. WTI Crude Oil gained ground after the International Energy Agency (IEA) improved its oil demand outlook for 2020. Oil prices rose to $27.92 barrel on Thursday and gave strength to commodity-linked currency-Loonie.
The USD/CAD pair was closed at 1.40460 after placing a high of 1.41406 and a low of 1.40318. Overall the movement of the USD/CAD pair remained bearish throughout the day. After posting gains for the last 3 days, the USD/CAD pair dropped on Thursday amid the increased demand for crude oil. WTI Crude Oil gained ground after the International Energy Agency (IEA) improved its oil demand outlook for 2020. Oil prices rose to $27.92 barrel on Thursday and gave strength to commodity-linked currency-Loonie.
Strong Canadian Dollar against the US dollar pulled the USD/CAD pair on Thursday to post losses after rising for the last three days. On the other side, the US dollar continued to get support from the increased fears in the market related to the second-wave of coronavirus after easing of lockdowns started throughout the globe.
Multiple Health experts have warned about the consequences for opening the economy too soon, saying that a hasty opening could lead to a bigger health crisis, which would ultimately lead to more economic damage.
The US Initial Jobless Claims last week showed a surge to 2.9M against the 2.5M expectations and weighed on the US dollar, which added in the downfall of USD/CAD prices on Thursday.
From the Canada side, at 17:30 GMT, the Manufacturing Sales for March was declined by -9.2% against the forecasted decline by -4.4% and weighed on the Canadian Dollar. Meanwhile, on Thursday, The Governor of Bank of Canada, Stephen Poloz, said that the better times for oil have come after seeing an unprecedented collapse by COVID-19 and a destructive price war between Russia and Saudi Arabia.
He said that the impact of recent oil price shock on Canada’s economy was similar to the crash in late 2014 and early 2015. He said that the improved outlook and prices of crude oil were still very far from where they were before COVID-19, and the significant risk in the shape of the virus was still there.
Daily Technical Levels
Support Resistance
1.3995 1.4107
1.3956 1.4180
1.3883 1.4219
Pivot Point: 1.4068
On the technical side, the USD/CAD is trading at a price of 1.4070, and the upward channel is violated, providing support to the USD/CAD pair at around 1.4110 level. On the 2 hour timeframe, the USD/CAD has closed shooting star below 1.4113 trading level. Below this 1.4113 level, we may see USD/CAD prices dipping further until 1.4018 level, especially due to improved crude oil prices. Conversely, a bullish breakout of 1.4112 level may lead to the USD/CAD pair towards 1.4164 level. Good luck!
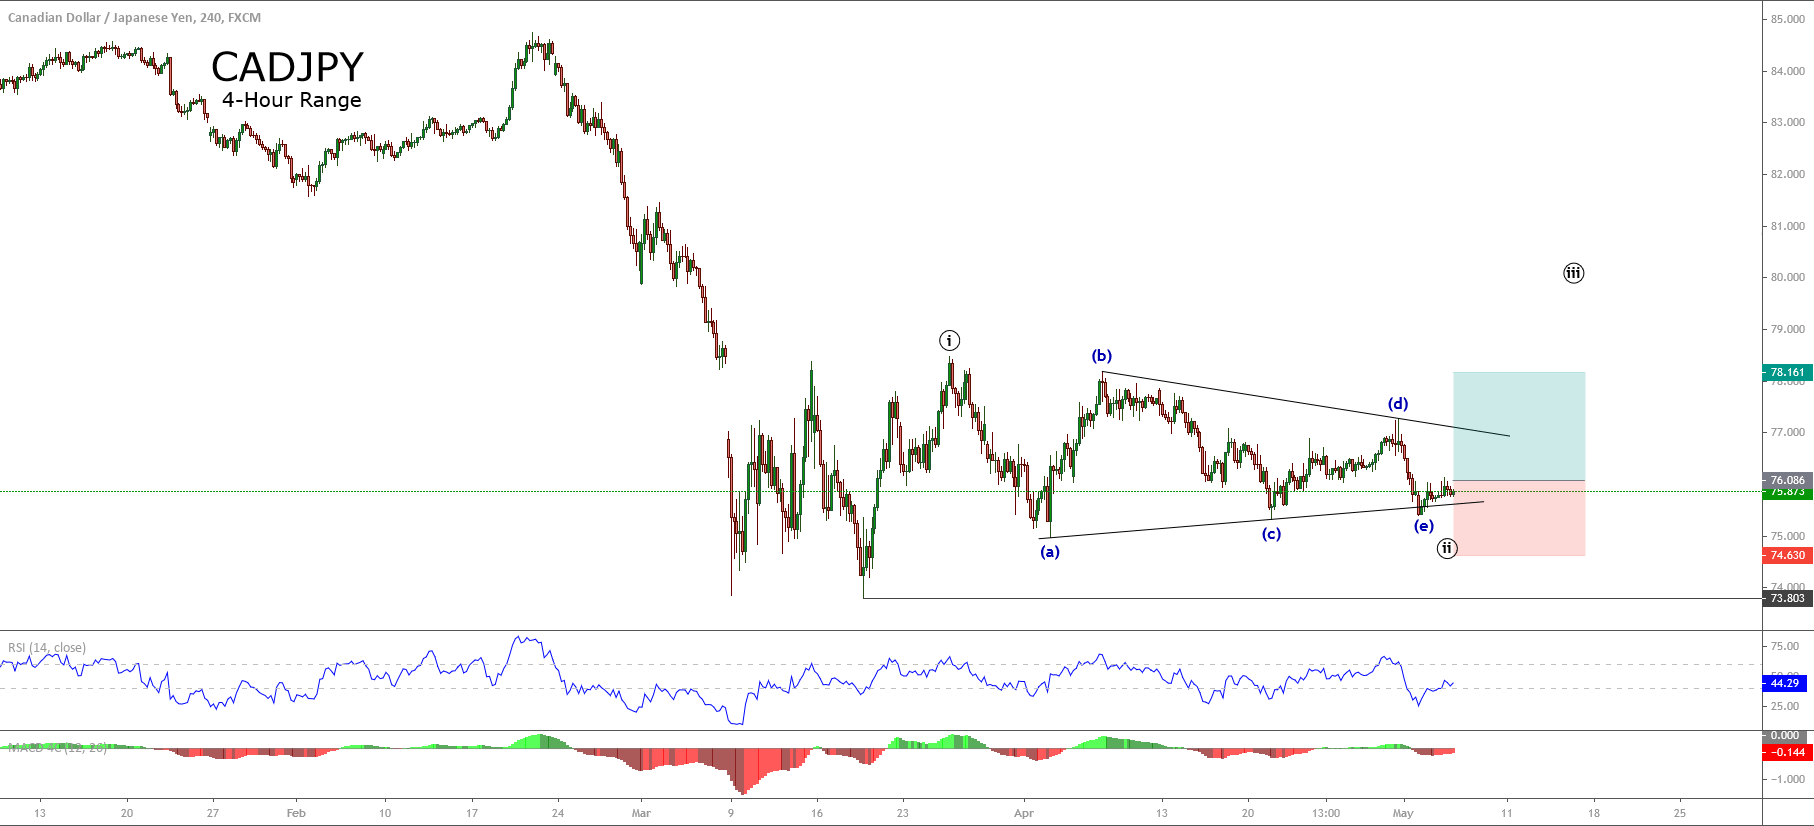
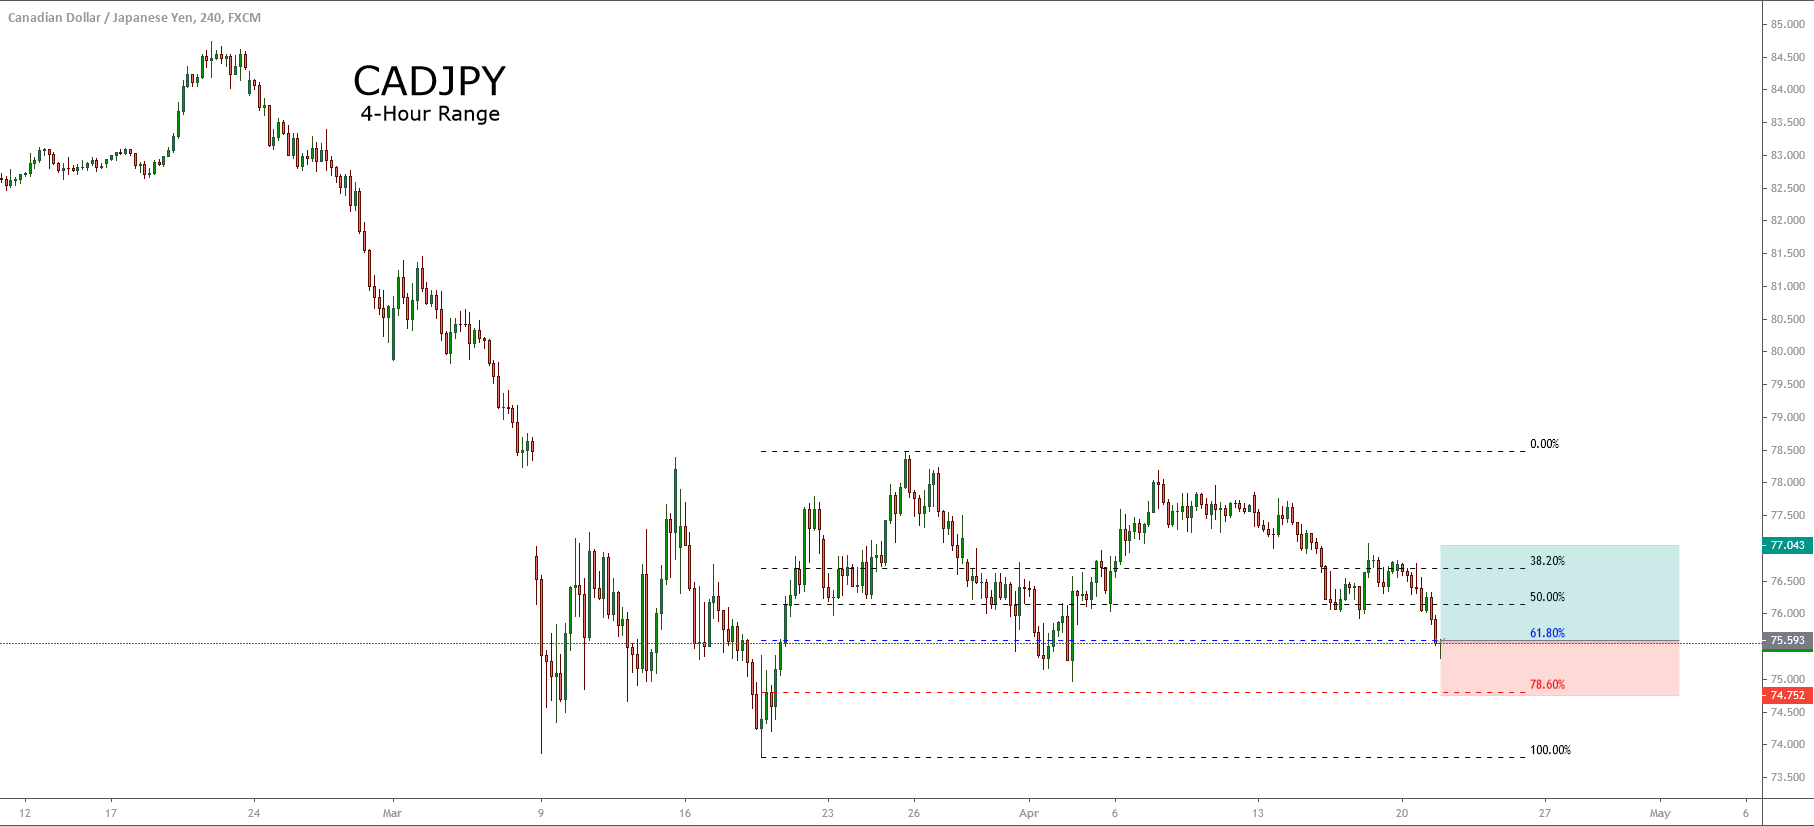
The CADJPY cross, in its 4-hour chart, shows a triangle pattern that should continue the upward movement of the previous impulsive move in the following trading sessions.
The Elliott wave perspective of CADJPY reveals the price action is running in a descending triangle, which could be ended its wave (e) of the Minuette degree labeled in blue. At the same time, CADJPY should be ending its wave ((ii)) of Minute degree in black.
The upward movement developed in the Thursday trading session, warns us that CADJPY could resume its advances in a wave ((iii)) of Minor degree.
Our bullish scenario considers an upside entry from the current zone at 76.373. In a conservative outlook, we expect a potential profit target at 77.973.3
Finally, the upward scenario will be invalid if the price action declines below 75.573.
Gold has been having a corrective movement lately. The price has created a slightly descending channel. If we draw a linear regression channel we can easily see the consensus of price, represented by the mean line, which is the average line of the price set for the range, and the edges of the channels are set at ±2 Sigmas (standard deviation) of the centerline.
On the 2H chart we see that, after the price did a higher low below the centerline, it went up, and consolidated for a while above that line. Today it made an engulfing figure that broke through the recent range and is heading up.
A long position was entered at 1,711.12 with a stop-loss at $1,699.12 and a take profit of 1,725.12, which gives a reward to risk ratio of 1.17, which is less than the usual, but also the target can be reached easier, as it is not set at the top of the channel but at the recent high of the price, made on May 08.
Fig 1 – CADJPY triple bounce off the upper linear regression channel boundary
CADJPY has been obeying a slightly descending linear regression channel. On the 60 min chart, the ± 2 sigma lines are shown in blue, whereas the regression line, is shown in dotted white. In that chart, we can observe that the price has bounced three consecutive times off that line, and now, in its third bounce, it also pierced its 50-hour SMA to the downside.
A trade can be created with an entry at the current price and a target neat the bottom of the channel, for an excellent reward to risk factor. The rationale for this type of trade is the following. On channels like that, the odds of a reversal from a 2 sigma line is high, at least 95% of the time. The issue here is the reversal is strong enough to reach our target? Usually, it is highly likely a movement to touch the mid of the channel, but, since here the channel is descending, the odds of it moving to the bottom is higher. We will follow this trade, though, and adapt our stop-loss level and take profit as we see how the bearish momentum evolves.
The USD/CAD pair was closed at 1.40160 after placing a high of 1.40424 and a low of 1.39000. Overall the movement of the USD/CAD pair remained bullish throughout the day.
The USD/CAD pair was closed at 1.40160 after placing a high of 1.40424 and a low of 1.39000. Overall the movement of the USD/CAD pair remained bullish throughout the day.
The USD/CAD pair was closed at 1.40160 after placing a high of 1.40424 and a low of 1.39000. Overall the movement of the USD/CAD pair remained bullish throughout the day.
The USD/CAD pair posted gains on Monday after falling for the past 2 trading days. The decreased crude oil prices on Monday caused the CAD to outperform its rival currency US dollar and raised the USD/CAD pair.
In the past week, the WTI crude oil prices were supported by the heightened hopes of recovery in global energy demand amid the easing of coronavirus induced lockdowns from across the globe.
The barrel of WTI crude oil rose almost 30% last week, which is the largest weekly gain of the year. However, the cautious market mood on Monday dragged down the WTI crude prices by 3.5% to 25.20$.
During the Asian session, bullish bias was dominating the USD/CAD prices as these lead the pair towards the next resistance level of 1.4100. On the 4 hour timeframe, the USD/CAD pair managed to crossover the 50 EMA and has closed bullish candles above the EMA support level of 1.4000.
On the higher side, the USD/CAD prices may lead the pair towards the next resistance level of 1.4100, but currently, the pair is retracing back and it may test the support area of 1.4000 level. But I case, the pair manages to close below 1.4000 level, our signal will be at risk of hitting the stop loss. Let’s see how it goes.
The EUR/USD prices were closed at 1.08066 after placing a high of 1.08504 and a low of 1.08004. Overall the movement of the EUR/USD pair remained bearish throughout the day.
The EUR/USD prices were closed at 1.08066 after placing a high of 1.08504 and a low of 1.08004. Overall the movement of the EUR/USD pair remained bearish throughout the day.
The EUR/USD prices were closed at 1.08066 after placing a high of 1.08504 and a low of 1.08004. Overall the movement of the EUR/USD pair remained bearish throughout the day.
EUR/USD pair dropped on Monday and posted a fresh daily low of 1.0801. The downward trend of the EUR/USD pair was due to the strength of the US dollar. The US Dollar Index was up by 0.45% and was back to above 100.00, it was pushed by higher US yields on Monday.
On the data front, at 13:00 GMT, the Italian Industrial Production in the month of March showed a decline in production activity by 28.4% against the forecasted decline of 20.0%. It weighed on single currency euro and added in the downward track of EUR/USD pair.
Daily Technical Levels
Support Resistance
1.0826 1.0847
1.0813 1.0855
1.0804 1.0868
Pivot Point: 1.0834
The EUR/USD price is trading slightly bearish below an immediate resistance level of 1.0823, which is extended by the 50 EMA. On the 4 hour timeframe, the 50 EMA is pushing the EUR/USD pair around 1.0820. Below this, we may see EUR/USD prices falling until 1.0777, while bullish breakout of 1.0850 can lead EUR/USD prices towards 61.8% Fibonacci retracement level of 1.0869 level.
The safe-haven-metal prices flashing green and take bids around the $1,710 while representing 0.50% gains on the day mainly due to fresh allegations on China by the United States helping to increase the safe-have demand in the market. The Sino-US relationship was eased after both parties agreed to improve the atmosphere for fulfilling the phase-one deal’s promises. This came after President Donald Trump threatened new tariffs on Chinese goods in case of not buying $200 worth U.S. farm products by China.
The safe-haven-metal prices flashing green and take bids around the $1,710 while representing 0.50% gains on the day mainly due to fresh allegations on China by the United States helping to increase the safe-have demand in the market. The Sino-US relationship was eased after both parties agreed to improve the atmosphere for fulfilling the phase-one deal’s promises. This came after President Donald Trump threatened new tariffs on Chinese goods in case of not buying $200 worth U.S. farm products by China.
The safe-haven-metal prices flashing green and take bids around the $1,710 while representing 0.50% gains on the day mainly due to fresh allegations on China by the United States helping to increase the safe-have demand in the market. The Sino-US relationship was eased after both parties agreed to improve the atmosphere for fulfilling the phase-one deal’s promises. This came after President Donald Trump threatened new tariffs on Chinese goods in case of not buying $200 worth U.S. farm products by China.
The Consumer Credit for the month of March was released from the Federal Reserve of the U.S., which showed a decline by -12.0B against the expectations of positive 14.9B. This weighed on the U.S. dollar and limited the downfall of gold prices on Friday.
Furthermore, the latest economic data from the United States fueled expectations that the Federal Reserve will stimulate more in the next meeting, and markets started to price in for a negative interest rate environment. On Saturday, President Donald Trump said that the United States would purchase $3B worth of dairy & farm products in order to help the struggling U.S. farmers. He stated that the government’s purchase would be a part of “Farmers to Family Food Box.”
The demand for agricultural products was decreased due to the lockdown caused by the coronavirus pandemic, which started in March, and it has disrupted the supply chains across the nations. This has caused some U.S. farmers even to destroy their products, which they can’t store. Donald Trump also said with no evidence that coronavirus pandemic will go away without a vaccine. He spared the specifics, said that other viruses also disappeared, and the same would happen with this COVID-19. He added that viruses die too like everything else, and he was hopeful that this virus would also go away after some time.
Gold is trading with a bearish bias, holding mostly below 1,710 resistance level. Gold is trying to cross below the 50 EMA support area, which can lead to gold prices further lower towards 1,694 level. Alongside, the RSI is also holding below 50, suggesting odds of selling bias in gold.
On the upper side, gold’s resistance is expected to be found near 1,720 and 1,737, whereas the support continues to stay around 1,694 regions. In case of a downward breakout, gold prices may slip towards 1,671 level.
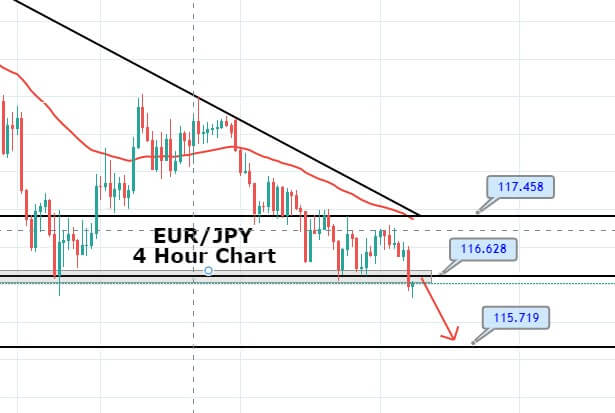
The Japanese cross EUR/JPY is on a bullish run, having crossed over 50 periods EMA at 115.551. As for the Japanese economic data is concerned, the Monetary Base for the year from Japan showed a decline to 2.3% against the expectations of 4.5% and weighed on JPY, which resulted in the upward movement of the EUR/JPY pair.
The Japanese cross EUR/JPY is on a bullish run, having crossed over 50 periods EMA at 115.551. As for the Japanese economic data is concerned, the Monetary Base for the year from Japan showed a decline to 2.3% against the expectations of 4.5% and weighed on JPY, which resulted in the upward movement of the EUR/JPY pair.
The Japanese cross EUR/JPY is on a bullish run, having crossed over 50 periods EMA at 115.551. As for the Japanese economic data is concerned, the Monetary Base for the year from Japan showed a decline to 2.3% against the expectations of 4.5% and weighed on JPY, which resulted in the upward movement of the EUR/JPY pair.
On the other hand, the uptick move from the major US equity indexes also made it difficult for JPY to gather any strength. On the last day of the week, the traders keeping their eyes on Non-Farm Payrolls from the United States to further take hints about the US economy. Better than expected labor market is weakening the demand for safe-haven assets such as JPY itself.
Technically, the EUR/JPY pair has closed three white soldiers pattern on the two-hourly timeframes at 115.650. Besides, the crossover above 50 EMA is also supporting the bullish bias among traders and typically drives an upward trend in the market. Lastly, the MACD is also forming strong histograms over 0, supporting bullish bias. Closing of the candle above 115.550 can drive more buying in the EUR/JPY pair. Thus, we have taken a buying trade. Let’s see how it goes.
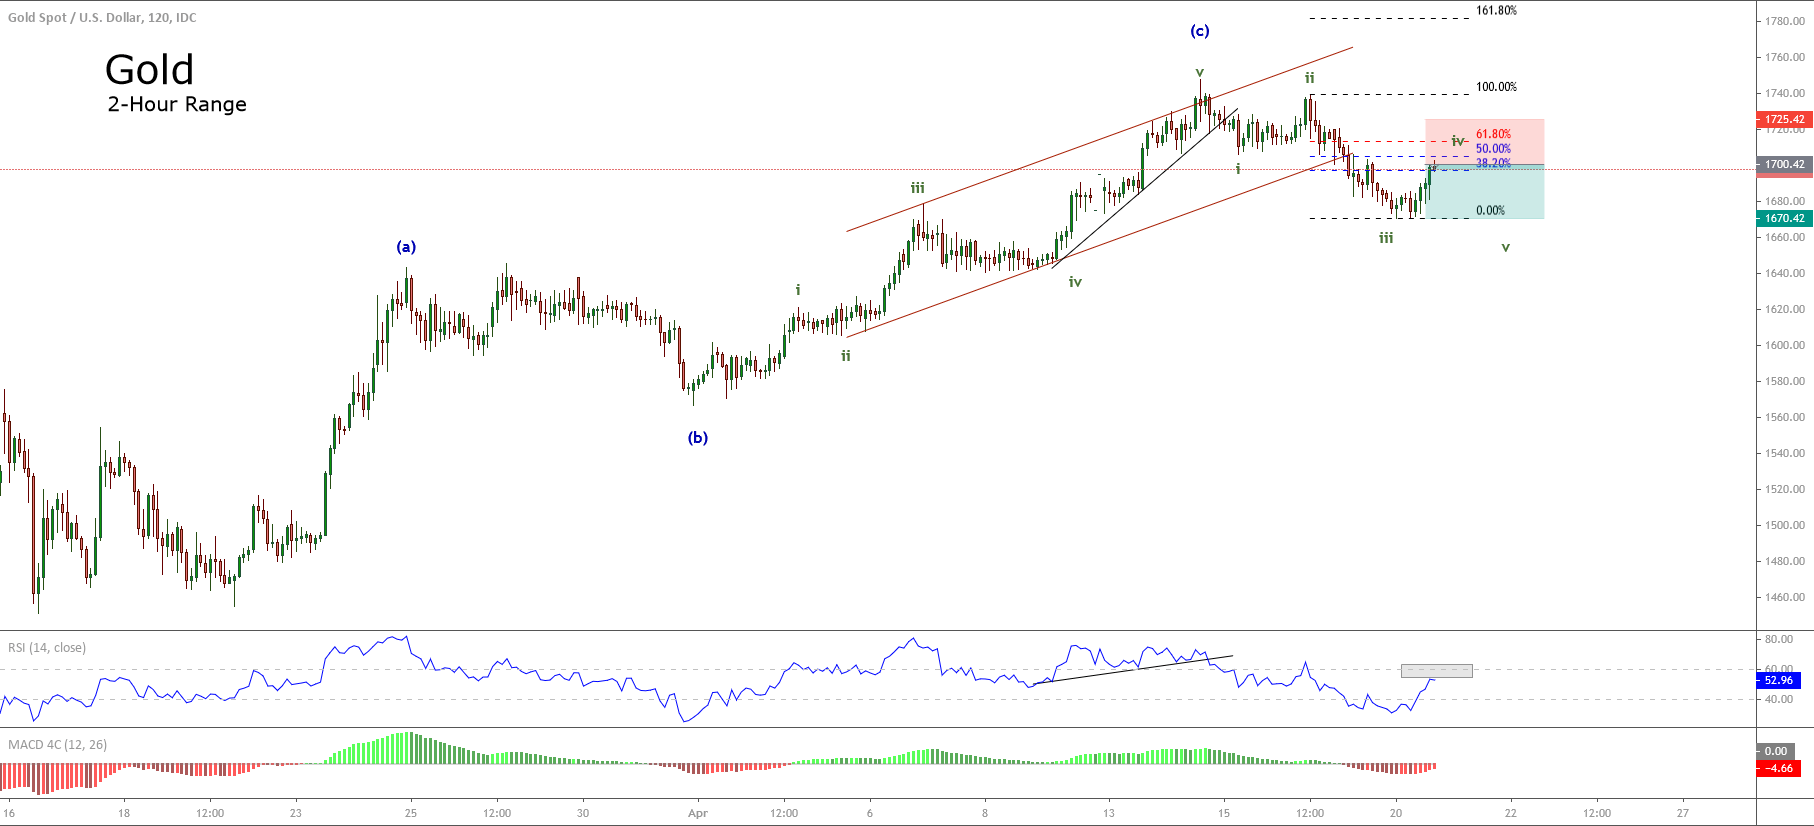
Gold, in its 2-hour chart, illustrates a decreasing advance that could correspond to a corrective structure in progress, which could result in further declines.
The Elliott wave sequence suggests the possibility of an incomplete wave ((c)) that could be developing its internal wave (ii) of the Minuette degree identified in blue.
On the other hand, the yellow metal retraced until 50% of the last bullish sequence. This retrace makes us foresee that the upward cycle could be in an exhaustion stage, and Gold couldn’t realize a new higher high that surpass the April high at $1,747.74 per ounce.
Our bearish scenario foresees a decline from the current area at $1,696 per ounce, with a potential bearish target located at level $1,676.
The scenario forecasted will be invalid if the price surpasses and closes above $1,711 per ounce.
Earlier today, the NZD/USD trading signal got into losses and closed at stop-loss, costing us 60 red pips, even before we could update about its setup. The market is quite uncertain today and moving sideways without any clear setup. Anyways, now let’s take a look at the USD/CAD pair as it’s been on the move since the U.S. session has begun.
Earlier today, the NZD/USD trading signal got into losses and closed at stop-loss, costing us 60 red pips, even before we could update about its setup. The market is quite uncertain today and moving sideways without any clear setup. Anyways, now let’s take a look at the USD/CAD pair as it’s been on the move since the U.S. session has begun.
Earlier today, the NZD/USD trading signal got into losses and closed at stop-loss, costing us 60 red pips, even before we could update about its setup. The market is quite uncertain today and moving sideways without any clear setup. Anyways, now let’s take a look at the USD/CAD pair as it’s been on the move since the U.S. session has begun.
A day before, the USD/CAD pair was closed at 1.41447 after placing a high of 1.41569 and a low of1.40226. Overall the movement of the USD/CAD pair remained bullish throughout the day. The pair USD/CAD posted dips during the Asian and European sessions following the reports of U.S. crude oil inventories showed a rise and reignited the oversupply concerns and hence affected the crude oil prices.
According to the American Petroleum Institute, the stockpiles of crude oil last week raised by 8.4Million barrels, which was more than the expected.
Despite such inventory data, crude oil is making a bullish movement, causing a downtrend of USD/CAD was the report of Non-Farm Payrolls from the US ADP on Wednesday.
The drop of more than 20 million jobs fell under the expectations and helped the U.S. dollar to pick up the pace. Strong U.S. dollar across the board added in the upward movement of USD/CAD pair and took its prices near 1.4157 level.
In the absence of any macroeconomic data from Canada, the pair USD/CAD relied on the U.S. dollar and crude oil prices on Wednesday. At 19:30 GMT, the Crude Oil Inventories from Energy Information Administration for last week showed that inventories dropped to 4.8M from 8.5M of expectations. The U.S. dollar was also strong on Wednesday due to the easing of lockdown measures across the globe, and this added in the rise of USD/CAD prices.
Daily Technical Levels
Support Resistance
1.4003 1.4093
1.3959 1.4139
1.3912 1.4183
Pivot Point: 1.4049
For now, the USD/CAD pair is making a strong sell movement, having dropped from 1.4130 to 1.3975 level. The pair has already completed 61.8% Fibonacci retracement at 1.3975, and below this, it can head to the next support level of 1.3900 level. Let’s keep an eye in 1.4020 level today, as selling trades can be seen below this level with a target of 1.3850 level. Good luck!
The price of Bitcoin Cash (BCH/USD) is preparing to develop a new rally that could take it to beat the previous highs of March, located in the area of 352.96.
The price of Bitcoin Cash (BCH/USD) is preparing to develop a new rally that could take it to beat the previous highs of March, located in the area of 352.96.
The price of Bitcoin Cash (BCH/USD) is preparing to develop a new rally that could take it to beat the previous highs of March, located in the area of 352.96.
BCH/USD, in its 4-hour chart, shows the advance of a potential upward impulsive sequence that began when the price found its bottom at level 133.67 last March 13th.
From the previous chart, we observe the price action advancing in its wave ((iv)) of Minute degree labeled in black. At the same time, this ongoing structural series is forming the internal segment corresponding to wave (c) of the Minuette degree identified in blue.
The wave (c) in progress began at the top of April 30th, located at level 275.95, when Bitcoin Cash completed its wave (b).
The internal structure of the wave (c) shows the intraday downward trendline joining the sequence of lower highs, which leads us to conclude that the short-term sentiment maintains on the bearish side.
On the other hand, according to the Elliott wave theory, for the long-term structural series to be a valid impulsive sequence, the wave ((iv)) must not penetrate the area of wave ((i)).
In this context, the corrective downward movement currently being developed by BCH/USD should not fall below the 200 level, which corresponds to the top of the wave ((i)).
On the other hand, one of the aspects that consider both the alternation principle and the construction of the extended wave indicates that an extended wave will be preceded or followed by a complex corrective structure.
Considering this Elliott wave concept, from the 4-hour chart, we observe that the current corrective sequence shows a level of complexity higher than the complexity level developed by wave ((ii)). Consequently, once the structural series of wave ((iv)) will complete, BCH/USD should perform a new upward impulsive movement that should present the characteristic of an extended wave, which could surpass the level 352.
In conclusion, as long as the wave ((iv)) of Minute degree does not finish, our preferred positioning will remain neutral, waiting for confirmation to enter on the bullish side that allows incorporation to the wave ((v)).
GBPUSD has created a descending leg inside a linear regression channel, which is pointing slightly upwards. The pair has bounced near the -2Sigma line that signals the bottom of the channel. We see also that, after piercing the 200-SMA line it soon recovered and is back above it. Additionally, we see that the price has made a kind of morning star figure, with a strong candle that engulfed the last two bearish candlesticks.
A buy-stop order at the high of the last candle in progress could create a movement to the upside, seeking the top of the channel, helped by the sentiment of investors about the relief by the UK government of the confinement British people are enduring due to the COVID-19 pandemic.
The EOS prices develop a bullish sequence following the Elliott wave structure of a leading diagonal pattern, which began on the March low at 1.4200.
The EOS prices develop a bullish sequence following the Elliott wave structure of a leading diagonal pattern, which began on the March low at 1.4200.
The EOS prices develop a bullish sequence following the Elliott wave structure of a leading diagonal pattern, which began on the March low at 1.4200.
The price action developed by EOS and reflected in its 4-hour chart, shows the cryptocurrency testing the baseline of the leading diagonal pattern, which links the end of the waves ((ii)) and ((iv)) of Minute degree labeled in black.
According to the textbook, a leading diagonal pattern is an impulsive structure having five internal segments, which are subdivided into an internal sequence 3-3-3-3-3. This pattern tends to appear on the first wave of an impulsive series.
So far, EOS completed a five-wave bullish sequence of Minute degree. This impulsive wave began in the March low at 1.4200. At the same time, this structural series gave rise to a higher-grade impulsive wave corresponding to the wave 1 of Minor degree labeled in green.
Following the wave theory described by R.N. Elliott, since EOS completed an impulsive movement, the market must perform a corrective sequence of the same degree and in the opposite direction to the previous move.
From the previous chart, we observe the price action developing a corrective downward movement. Within its internal structure, we recognize that the sequence in progress could correspond to a wave ((b)) of Minute degree identified in black.
This movement, which is composed of a three-wave internal structure, is moving on the baseline of the leading diagonal pattern. A bearish breakdown would activate the wave ((c)) in black.
Once EOS completes this three-wave sequence, it will end the wave 2 of Minor degree, and consequently, the price action will give way to a third upward wave.
According to the alternation principle between the impulsive waves, considering that the first wave has a lower momentum, the third wave could have a higher momentum than the first one.
In conclusion, in the short term, our preferred positioning remains on the bullish side, which will be confirmed once the Minor degree wave-2 is finished.
How You Can Make Money Using Forex.Academy’s Free Trading Signals Service – PART 1
The Forex.Academy’s Free Trading Signals Service. What is it and how can it help you?
Forex.Academy has recently launched its free trading signals service which can be found under
the Signals tab on the Forex.academy website.
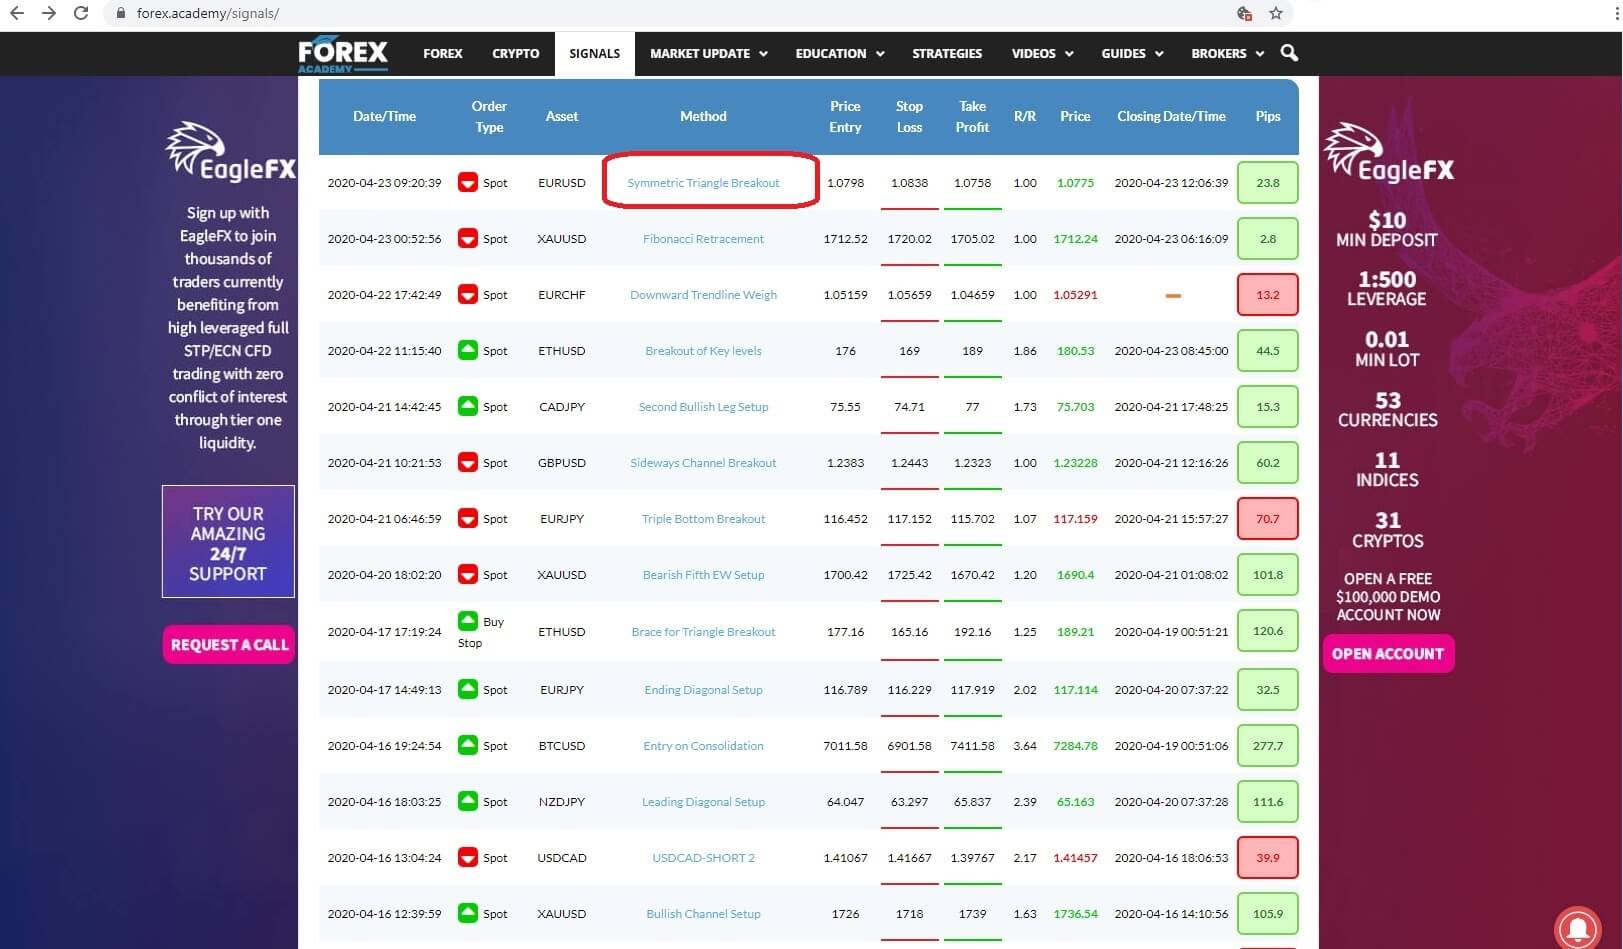
The webpage lists many open and pending orders relating to trades in several assets, from currency pairs, gold, and bitcoin.
And the trades are managed by professional traders, some who have come from an institutional background, having trading with institutional size deal tickets running into $ billions. Biographies of each trader will be added to the technical analysis for every trade and you will be able to access this information to help you decide which trades to copy. You wont be disappointed. These guys really know their stuff.
Each individual trade is listed on the table, and comprises of several components parts, including: Insert 1: The date the trade was listed: Insert 2: The type of order, which could be an instant execution, or spot trade, or a limit order including a buy limit or stop buy order or a sell limit or stop sell order, Insert 3: the type of asset, which could be a number of major or cross FX pairs and gold and bitcoin. Insert 4: the method where the each trader gives a detailed analysis of the thinking behind each trade, which, incidentally, most other signal providers do not offer, and where we will come back later in this video to take a more detailed look, Insert 5: the entry price for the trade, Insert 6: the stop loss for the trade, Insert 7 : the take profit level, Insert 8, The risk to reward level, Insert 9: the price level at close; Insert 10:
The closing date and time, if applicable and insert 11: the amount of pips won or lost or in the event of an open trade the fluctuating level of pips in play.
Now lets drill down a little further into the trade methodology as promised earlier.
The platform has a cool feature called the method, it allows total scrutiny of all trades by third parties, such as yourself, who want to know about the thinking and methodology behind the set-up of each trade. This is not about tossing a coin and hoping for the best, it’s about incorporating all the methods and techniques which are employed and incorporated by professional traders and institutions which have a high for this type of technical and fundamental analysis, which tend to offer a high success rate.
And so in this spot EURUSD trade, the trader had based his assumption that the pair should move lower and entered a short position as an instant execution trade at the exchange rate of 1.0798 with a stop loss of 1.0838 and a take profit target level of 1.0758 with a risk to reward ratio of 1.00 and where the trade was manually closed out on the 23rd 04 2020 at 12:06 PM with a profit of 23.8 pips. This tells us that the price action was reversing and unlikely to achieve its target exchange rate at 1.0758 and therefore the trader decided to close out. Followers would have the same option, and remember, this is about making money, and that markets can change direction and things can therefore change.
So let’s now click on the Method tab, and drill down further into the trading methodology behind this trade. Now you will be presented with a detailed analysis of this train set up. In this instance, the trader is Ali.B, who has elected to use a technical and fundamental analysis approach, based on a symmetrical
triangle breakout and while preferring the 4-hour time frame. Ali has incorporated several support and resistance levels, and has keenly observed that price action was forming a squeeze, and that a symmetrical triangle breakout had occurred and this was the set-up that he had incorporated as the backbone of this trade.
Ali provides detailed clarification from a fundamental basis, which is backed up by cool headed technical analysis.
By scrolling down we can see that more detailed information has been provided and where copy traders can also calculate what their profit and loss would likely be in the trade was allowed to go all the way to the targets and stop levels, based on the incorporation of using a standard or micro lots for those who decide to copy the signals.
This is the trading signals service table in a nutshell, it’s completely transparent, fully detailed, easy to follow with trades that can be copied by others, including new traders, or even experienced ones with a limited amount of time to set up their own trades, or those who wish to supplement their trading portfolios.
So what is the catch I hear you say? Other signal providers want to charge me a monthly subscription fee, often quite expensive, so there must be a catch or there must be something wrong with this service. Well just because it’s free, it doesn’t devalue the product and Insert J
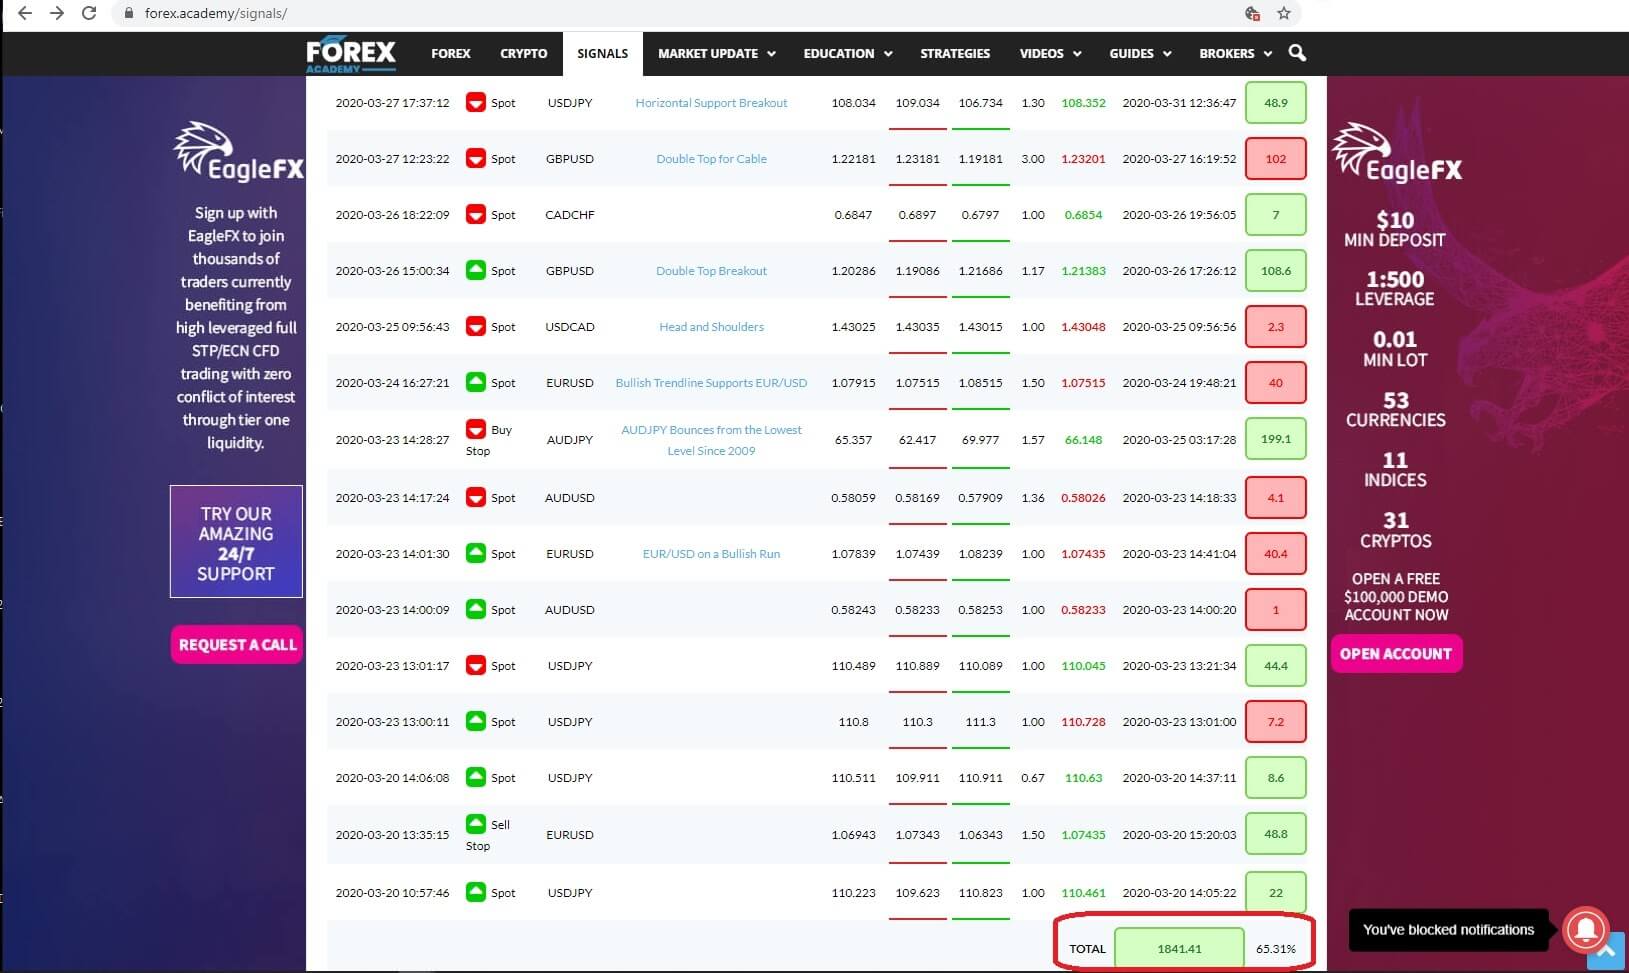
just look at the success story so far, in just a few weeks our team of professional traders, many who will be trading these setups themselves, with their own funds, has bagged a very impressive amount of pips won of 1841.41, and that equates to $18,410 less fees and spreads for traders who copied all these signals with risking one standard lot size, and even a still impressive $1,841 less fees and spreads while risking a mini lot. All with a win to lose ratio currently running at over 65%.
As for the trading signals service being free; well it is all a part of the commitment by the owners and team here at Forex.Academy to offer free professional, comprehensive educational and related services within the world of financial trading.
Join us for part 2 to find out how this brand new free service can help you.
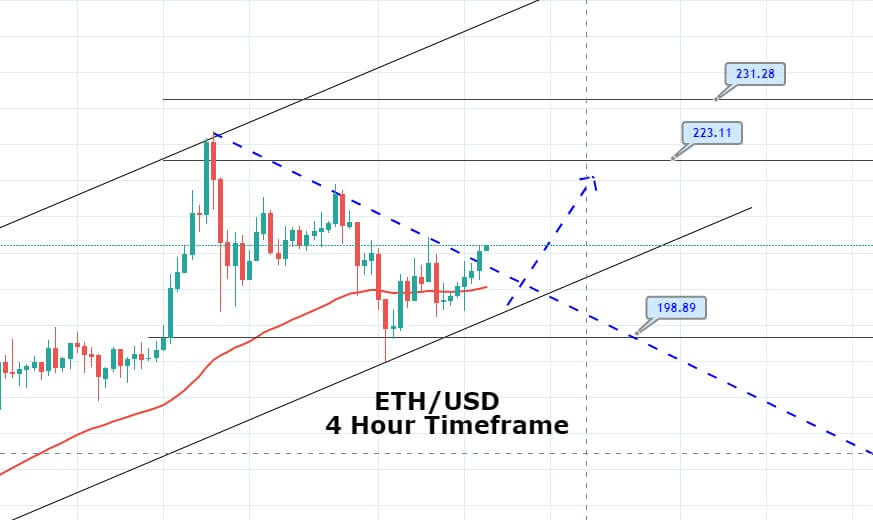
Yesterday on Tuesday, the ETH/USD pair had exhibited slight bullish momentum on the 4-hour timeframe, which leads Ethereum prices to soar over 200 resistance levels. With this, the ETH/USD pair has crossed over 50 periods EMA and has also closed three white soldiers pattern on an 8-hour timeframe, which suggests odds of the bullish trend.
Yesterday on Tuesday, the ETH/USD pair had exhibited slight bullish momentum on the 4-hour timeframe, which leads Ethereum prices to soar over 200 resistance levels. With this, the ETH/USD pair has crossed over 50 periods EMA and has also closed three white soldiers pattern on an 8-hour timeframe, which suggests odds of the bullish trend.
Yesterday on Tuesday, the ETH/USD pair had exhibited slight bullish momentum on the 4-hour timeframe, which leads Ethereum prices to soar over 200 resistance levels. With this, the ETH/USD pair has crossed over 50 periods EMA and has also closed three white soldiers pattern on an 8-hour timeframe, which suggests odds of the bullish trend.
The support level stays around 205, which is extended by the 50 periods EMA on the 4-hour timeframe. While the MACD is also showing a bullish crossover as it has started concluding histograms above 0, demonstrating bullish bias in ETH/USD.
For now, the ETH/USD has the potential to target the next resistance around 220 and 224. However, on the way, it may also meet an immediate hurdle around the 211 level. Therefore, the idea will be to place a buy stop above 177.16 with a stop loss below 165.16 and take profit at 192.16.
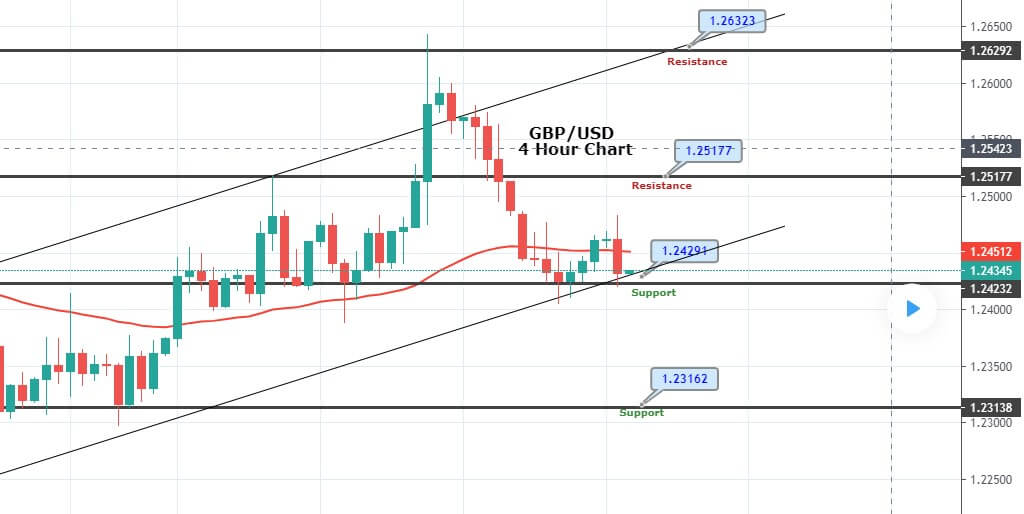
The GBP/USD currency pair failed to stop its 3-day losing streak and still trading below 1.2390 while representing 0.46% declines on the 4-hour timeframe. Sell-off came after the United Kingdom registered the highest death toll in Europe. The receding expectations of the government aid package also keep the currency pair under pressure.
The GBP/USD currency pair failed to stop its 3-day losing streak and still trading below 1.2390 while representing 0.46% declines on the 4-hour timeframe. Sell-off came after the United Kingdom registered the highest death toll in Europe. The receding expectations of the government aid package also keep the currency pair under pressure.
The GBP/USD currency pair failed to stop its 3-day losing streak and still trading below 1.2390 while representing 0.46% declines on the 4-hour timeframe. Sell-off came after the United Kingdom registered the highest death toll in Europe. The receding expectations of the government aid package also keep the currency pair under pressure.
Moreover, the broad-based US dollar recovery rally weighed on the cable pair. At the press time, the GBP/USD currency pair is currently trading at 1.2435 and consolidates in the range between the 1.2425 – 1.2450. However, traders are cautious about placing any strong positions as they are keenly awaiting for the upcoming final reading of April month UK Constriction PMI.
As per the latest report, the UK reported the highest death toll in Europe by rose above Italy’s 29,315 figures with 29,427. As in result, the Tory government get pressurized and could face additional criticism. As we know, the UK government is already criticized massively about the shortage of medical supplies, falling below testing targets, and a lack of clear guidelines for lockdown exit as well.
On the technical front, the GBP/USD pair has violated the upward channel on the 4-hour timeframe. The channel was supporting the pair around 1.2427 level, which Cable violated via closing a bearish engulfing candle. At the same time, the 50 EMA also extends resistance around 1.2425 area, and below this, the pair has the potential to drop until the next target level of 1.2318 level and even below this until 1.2246. Considering this, we should wait for a slight retracement in Sterling, and it’s worth placing a sell limited instead of entering a sell trade right away.
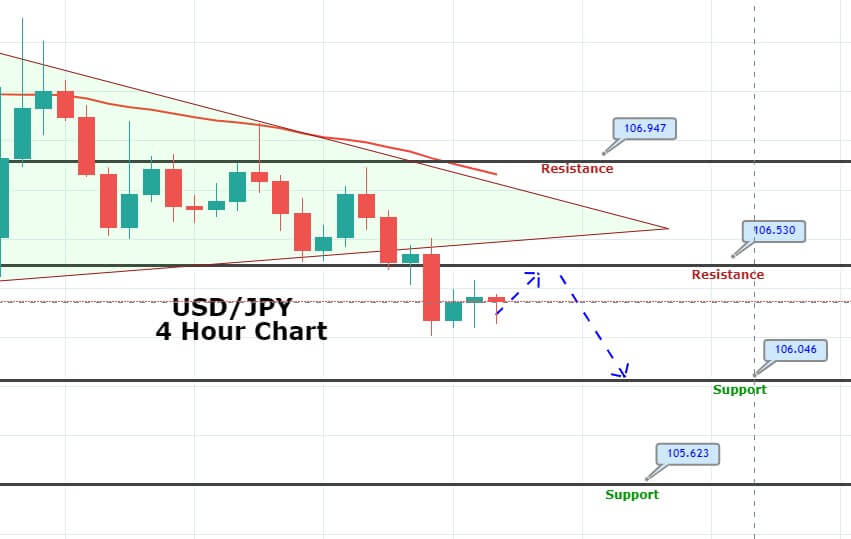
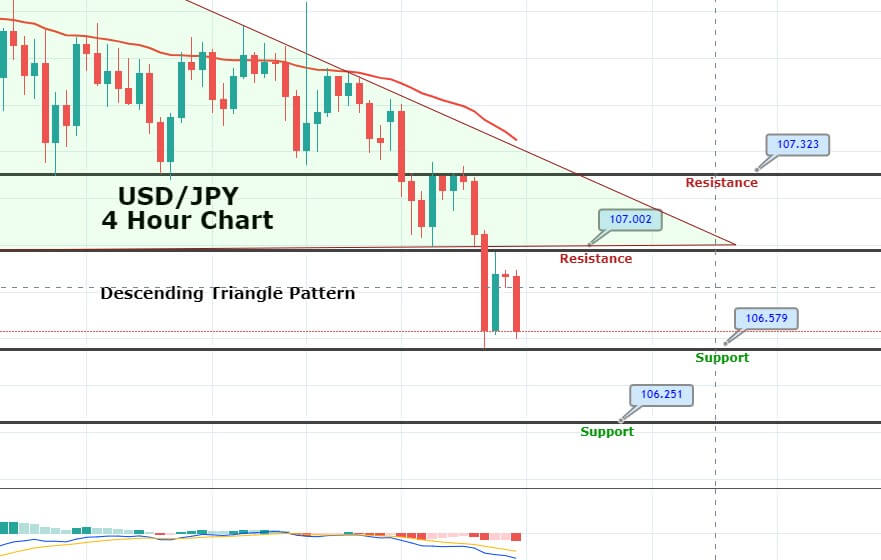
The USD/JPY currency pair failed to stop its 4th-consecutive session losing streak and dropped to fresh seven-week lows, around the 106.20 regions on Wednesday as the US dollar still depressed against its Japanese counterpart. The intensifying tension of the US-China war boosted the Japanese yen safe-haven demand, which eventually keeps the currency pair under pressure.
The USD/JPY currency pair failed to stop its 4th-consecutive session losing streak and dropped to fresh seven-week lows, around the 106.20 regions on Wednesday as the US dollar still depressed against its Japanese counterpart. The intensifying tension of the US-China war boosted the Japanese yen safe-haven demand, which eventually keeps the currency pair under pressure.
The USD/JPY currency pair failed to stop its 4th-consecutive session losing streak and dropped to fresh seven-week lows, around the 106.20 regions on Wednesday as the US dollar still depressed against its Japanese counterpart. The intensifying tension of the US-China war boosted the Japanese yen safe-haven demand, which eventually keeps the currency pair under pressure.
At this moment, the USD/JPY currency pair is currently trading at 106.31 and consolidates in the range between the 106.22 – 106.64. However, the currency pair failed to cheer the positive news about the re-opening of economies as traders awaited Chinese reaction to the US allegations.
Despite the fresh, positive report that most of the nations are set to re-starting their economies, investors are still cautious due to the intensifying fears of the second flow of a rise in the virus infections and worsening US-China relationships.
US President Donald Trump gave warning about imposing a fresh tariff on Chinese goods in toke revenge on the mishandling of the virus outbreak at the early stage. As in result, the Japanese yen continues to taking bids.
Technically, the USD/JPY pair has violated the symmetric triangle pattern, which was supporting the pair around 106.530. Violation of this candle may drive further selling in the pair until the next support area of 106.027, while resistance now continues to stay at 106.530. The MACD has started forming bearish histograms below 0, which is supporting selling bias in the USD/JPY pair. The violation of a symmetric triangle pattern can trigger further selling, so we have opened a selling trades in USD/JPY.
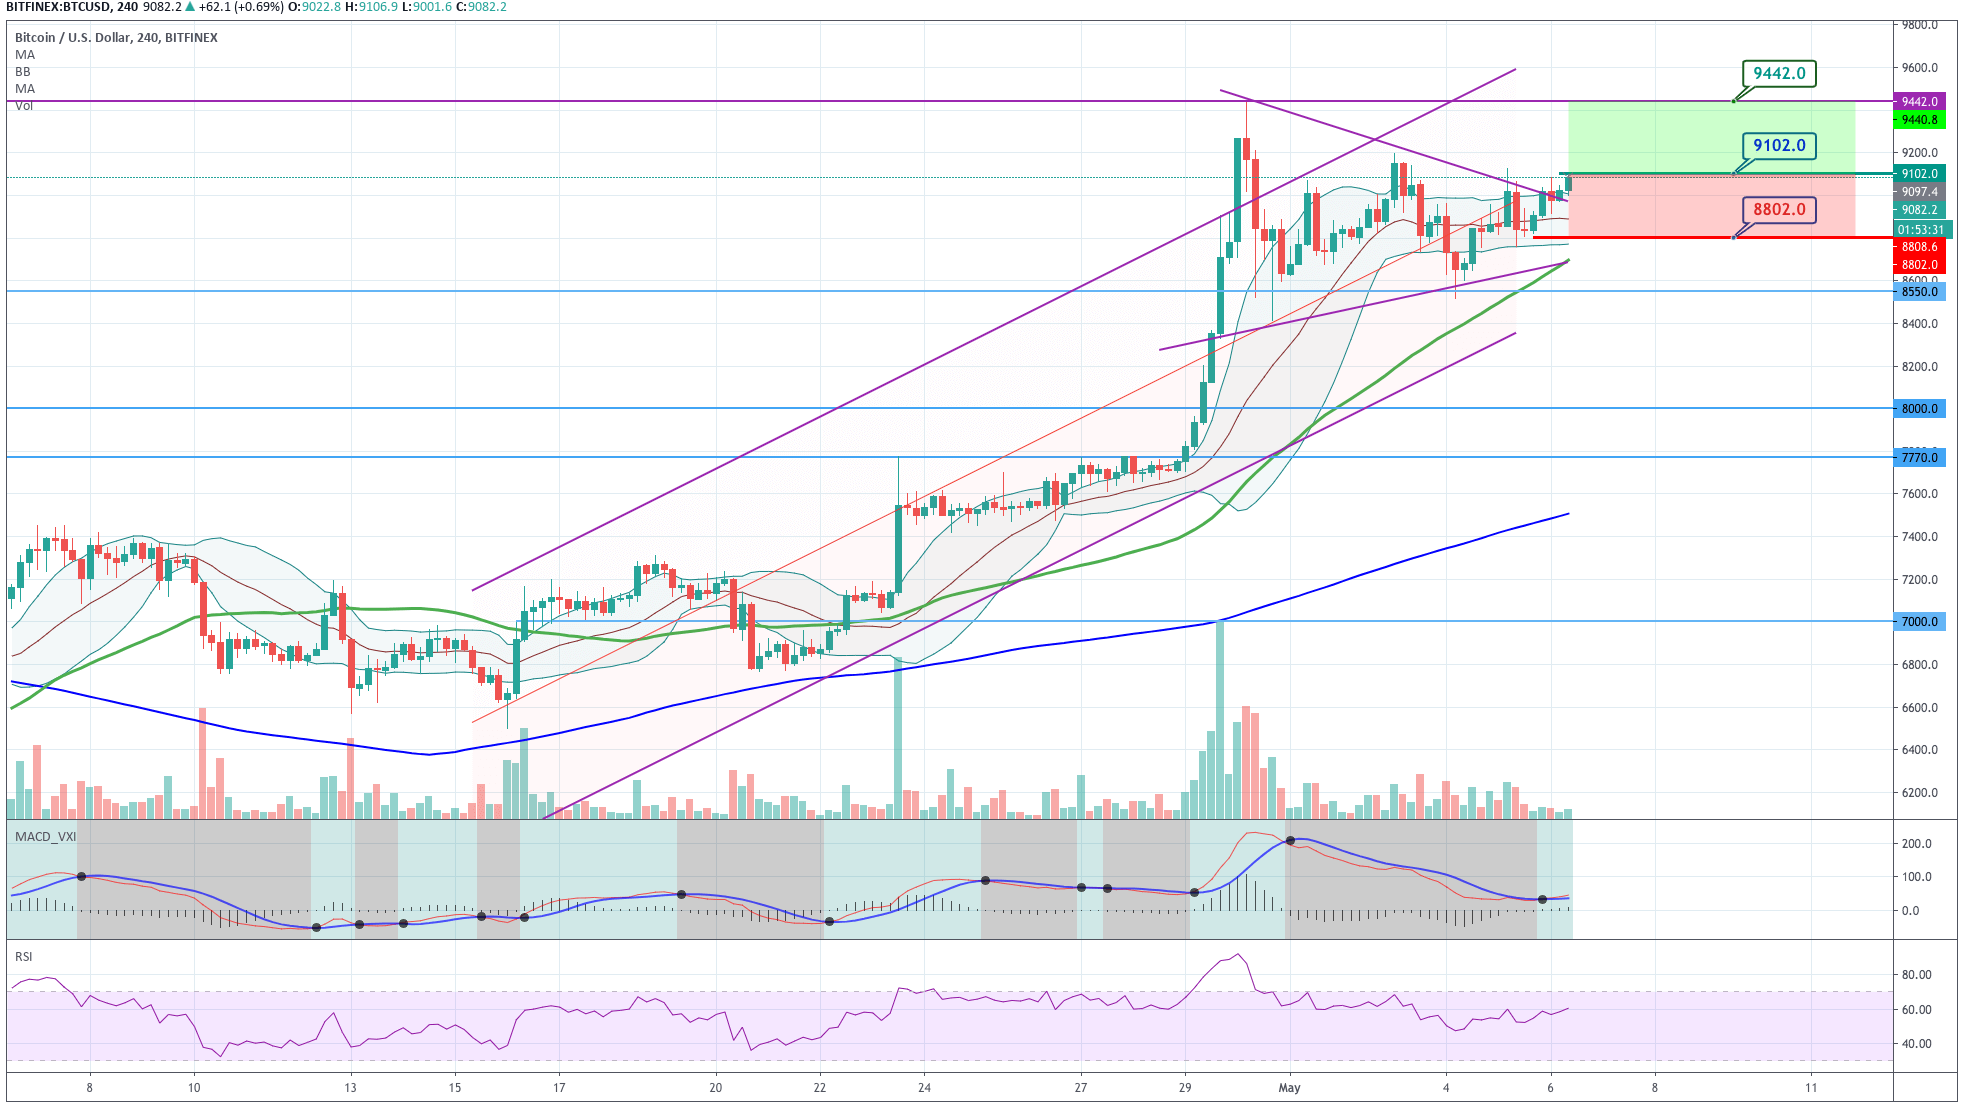
Bitcoin has been creating a consolidation range after the extensive bullish impulse made on April 29. The consolidation is also within the upward channel. Lately, the price is making a breakout of the triangle, and above the $9,000 resistance level. Also, the MACD made a bullish crossover, and the RSI is progressing and touching the 60 level.
Also, BTC price moves above its 20-, 50- and 200-period SMA which means the underlying trend is up.
A trading plan can be made, assuming the continuation of the bullish trend, with an entry above the current price of $9,100, with a stop below the recent low, and betting that at least the price will try to hit the last high of $9,442
The CADJPY cross, in its 4-hour chart, exposes a contracting triangle pattern that belongs to the second wave of Minute degree identified in black.
According to the alternation principle and the extensions of the Elliott wave theory, this complex structure should precede the extended impulsive wave.
On the other hand, the last rally developed by the Oil group could support the bullish sentiment in favor of the Canadian currency.
A buy-side position will activate if the CADJPY cross soars above 76.08. In our conservative scenario, we foresee a rally at least until the level 78.16; however, we don’t discard an upside till level 80.
The bullish scenario will be invalid if the price drops below the level 74.63.
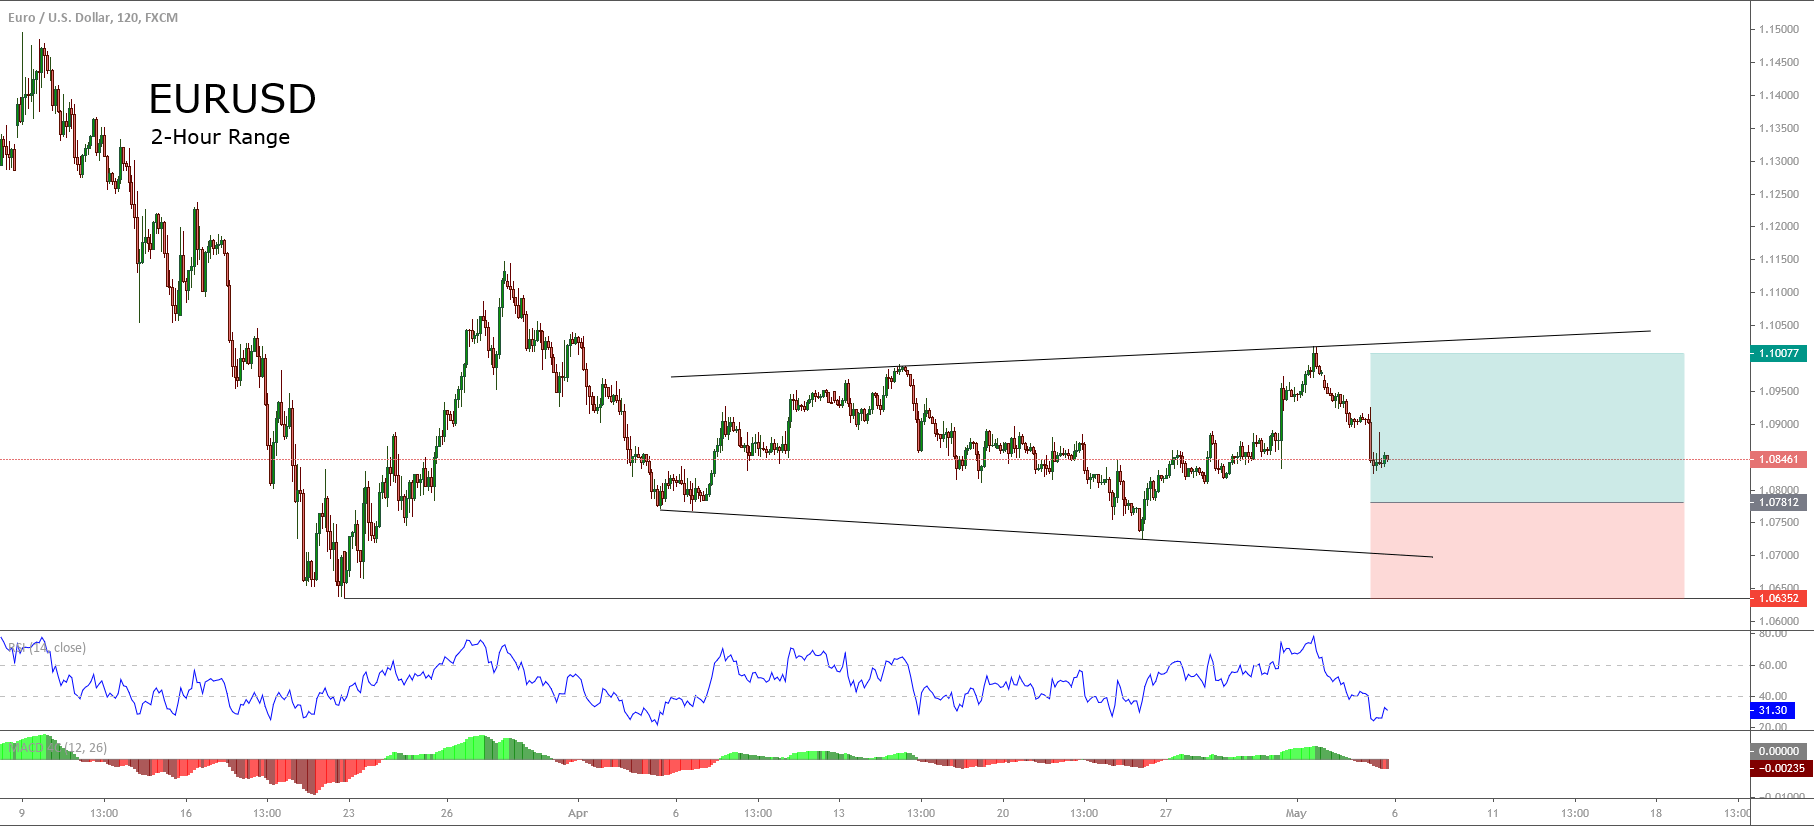
EURUSD, in its 2-hour chart, illustrates an expanding triangle in progress that began in early April and could develop a limited decline before rallies.
The current bearish leg in progress shows an aggressive decline supported by an extreme oversold revealed on the RSI oscillator. However, the price action remains its bearish momentum.
For the coming trading sessions, we foresee a consolidation structure, which should move up the RSI oscillator. After this move, the EURUSD should decline modestly, creating a bullish divergence, for then unveiling a bullish divergence.
Likely the NFP data release on Friday could provide the necessary volatility to activate the upward scenario as the result of a false decline.
The buy-side position will activate if the common currency touches and closes above level 1.0782. Our conservative scenario foresees an upside to 1.10 as a psychological level.
The bullish scenario will be invalid if EURUSD violates the 1.0636, which corresponds to March 22nd low.
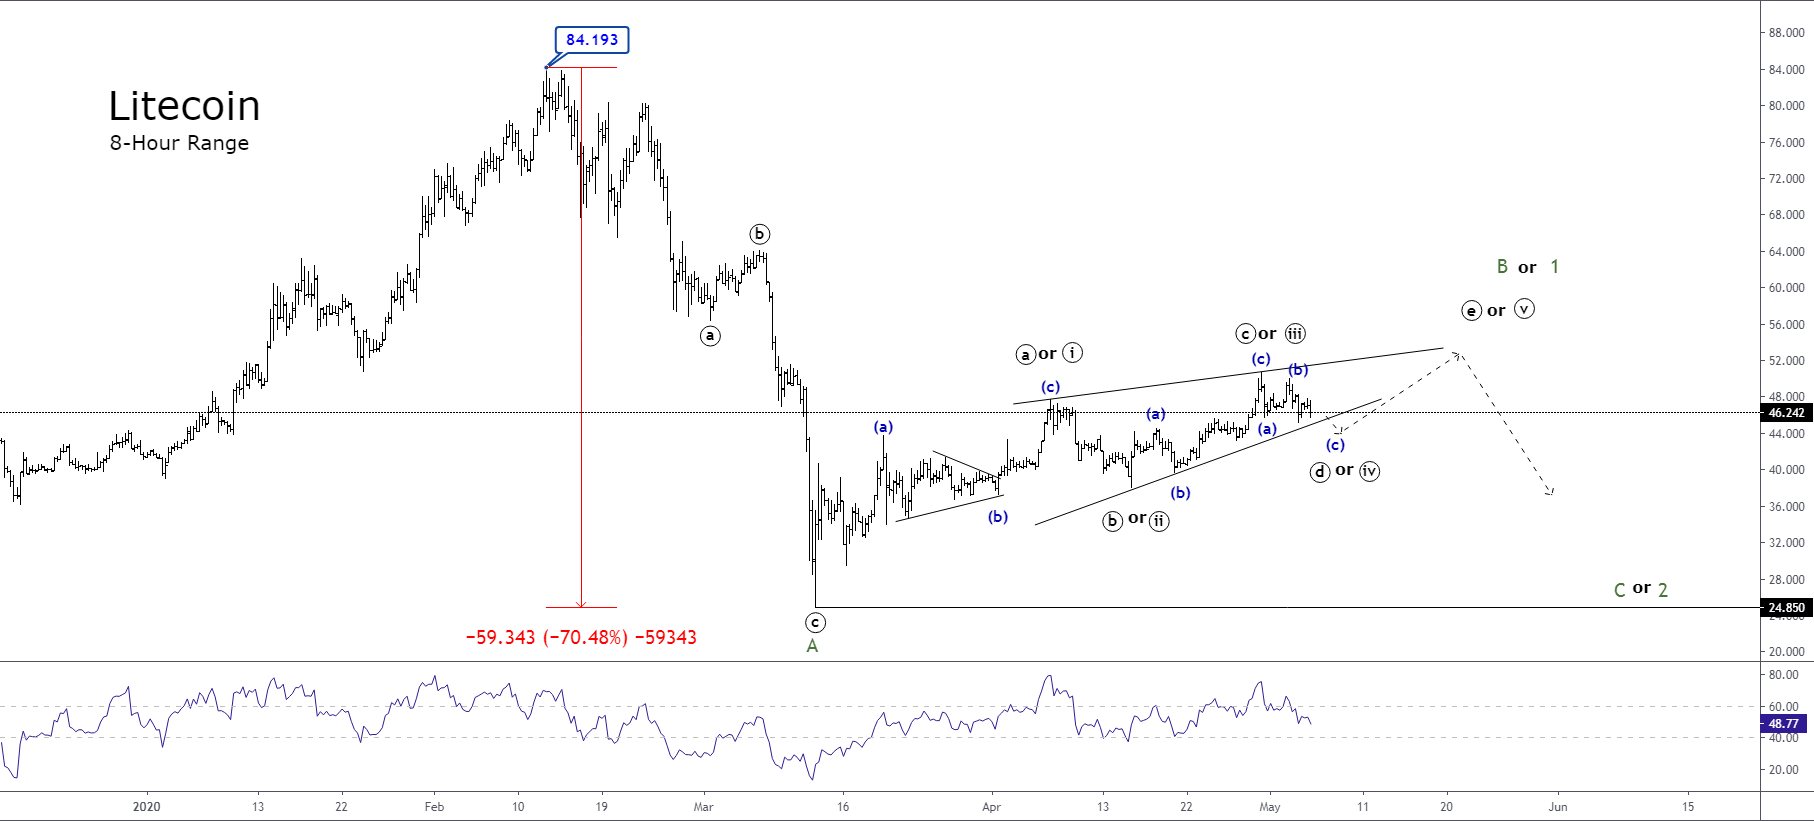
Litecoin is progressing slightly upward within a complex structural series, which leads to foresee two possible scenarios.
Litecoin is progressing slightly upward within a complex structural series, which leads to foresee two possible scenarios.
Litecoin is progressing slightly upward within a complex structural series, which leads to foresee two possible scenarios.
The cryptocurrency Litecoin against the US Dollar (LTC/USD), in its 8-hour chart, shows the plummet that led it to lose more than 70% of its value since February 13th when the price topped at level 84.193.
Once Litecoin hit the top at 84.193, the price made a three-wave bearish sequence, which ended on March 13th when the price found fresh buyers at level 24.850. In the previous chart, we distinguish this structural series identified in the waves ((a)-((b))-((c)) of Minute degree in black.
After LTC/USD completed the wave ((c)), the price action began to advance in a complex structural series with its internal movements composed of three waves. This sideways movement with a slightly upward bias leads us to foresee two potential scenarios for currency crypto.
Scenario 1 – Triangle Pattern in Progress
The first scenario considers the possibility that Litecoin advances in a triangular formation belonging to a wave B of Minor degree labeled in green.
According to the Elliott wave theory, a triangle pattern is composed of a series of five internal segments, which is subdivided into three waves following the 3-3-3-3 structure. Likewise, within a price cycle, this pattern tends to appear in waves 4 and B.
Scenario 2 – Developing a Leading Diagonal
The second scenario presents the option that the price action develops an ending diagonal pattern.
This type of pattern is composed of five internal waves overlapped one each other and follows a 3-3-3-3-3 sequence.
If the price action develops this scenario, the next movement should correspond to a wave 2 of Minor degree, and it should be composed of a three-wave structural series.
The main consequence of this scenario would be that, once the wave 2 completion, Litecoin should perform a bullish wave 3.
At the same time, considering the alternation principle of the wave theory, this third wave should have greater upward momentum than that momentum observed in the current wave in progress.
In conclusion, our short term preferred positioning is on the neutral side until the completion of the current formation.
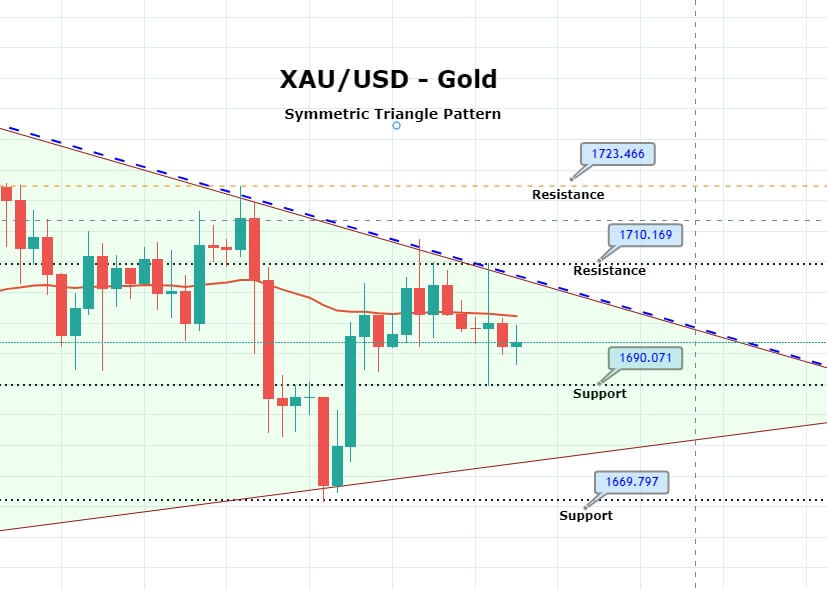
Gold prices continue to move in a sideways trading range of 1,710 – 1,690, while the recently formed symmetric triangle pattern is stretching the trading range. The fresh trading range is likely to provide selling below 1,700 and buying above 1,680. The gold prices are exhibiting mixed bias in the wake of mixed risk sentiment as many nations have also joined the United States in this blame-game to China because of the increased number of deaths and the global economic slowdown, both caused by the coronavirus pandemic.
Gold prices continue to move in a sideways trading range of 1,710 – 1,690, while the recently formed symmetric triangle pattern is stretching the trading range. The fresh trading range is likely to provide selling below 1,700 and buying above 1,680. The gold prices are exhibiting mixed bias in the wake of mixed risk sentiment as many nations have also joined the United States in this blame-game to China because of the increased number of deaths and the global economic slowdown, both caused by the coronavirus pandemic.
Gold prices continue to move in a sideways trading range of 1,710 – 1,690, while the recently formed symmetric triangle pattern is stretching the trading range. The fresh trading range is likely to provide selling below 1,700 and buying above 1,680. The gold prices are exhibiting mixed bias in the wake of mixed risk sentiment as many nations have also joined the United States in this blame-game to China because of the increased number of deaths and the global economic slowdown, both caused by the coronavirus pandemic.
Britain has asked that China would have to answer about the information it shared about the outbreak. The US is formulating measures to hold China responsible for the damage caused by the pandemic. The measures would probably be the sanctions, new trade policies, and cancelation of US debt obligations.
On the other hand, on Sunda,y the US Secretary of State, Mike Pompeo, said that there was enormous evidence that the COVID-19 pandemic was originated in the Chinese Wuhan laboratory. All of the above news indicates the need for safe-haven and hence, gold surges above $1713 on Monday. Coronavirus has infected almost 3.5M people across the globe, and governments & central banks all over the world have announced considerable monetary and fiscal measures to reduce the economic damage.
On the macroeconomic data side, at 19:00 GMT, the Factory orders of the United States showed a decline of 10.3% in the month of March, which was previously expected to be declined by 9.2%. This weakened the US dollar across the board and added in the upward movement of gold prices.
On the technical front, gold has crossed below 50 periods EMA which is providing resistance around 1,701 level. Recent close of bearish engulfing on the 4-hour timeframe suggesting investor’s bias towards selling. On the higher side, a downward trendline may also extend resistance around 1,705, and below this level, we may see selling until 1,690 and 1,683 level today.
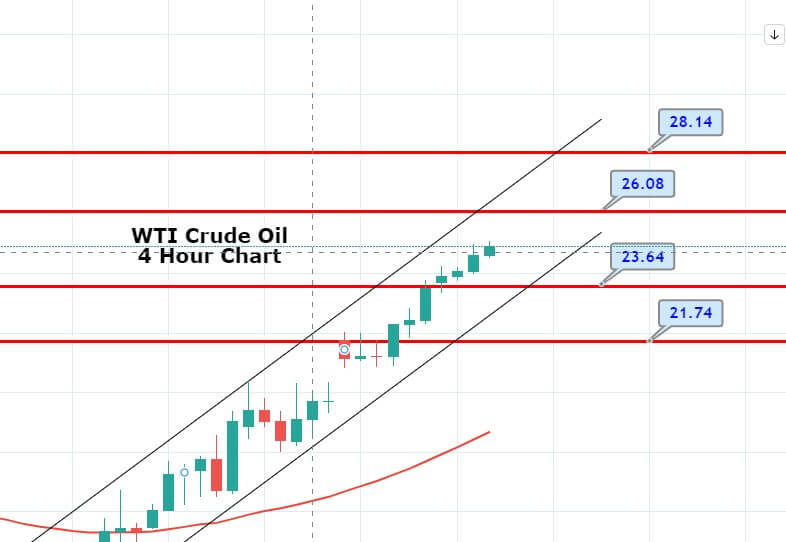
The U.S. WTI crude oil futures continue to advance at $24.39 a barrel in the wake of optimization around the market sentiment and weaker U.S. dollar. Besides this, the latest report about the slowdown in inventories at Cushing since mid-March also continues to support crude oil prices.
The U.S. WTI crude oil futures continue to advance at $24.39 a barrel in the wake of optimization around the market sentiment and weaker U.S. dollar. Besides this, the latest report about the slowdown in inventories at Cushing since mid-March also continues to support crude oil prices.
The U.S. WTI crude oil futures continue to advance at $24.39 a barrel in the wake of optimization around the market sentiment and weaker U.S. dollar. Besides this, the latest report about the slowdown in inventories at Cushing since mid-March also continues to support crude oil prices.
The reason for the uptick in crude oil prices could also be attributed to the U.S. dollar weakness. The U.S. dollar is losing its bullish traction and struggling to gain any follow-through traction. Whereas, the U.S. dollar index stalled its moderate bounce just above 99.50 to now trade moderately lower at 99.40.
The start of the OPEC+ production cut by 9.7 million barrels a day also boosted the oil prices. Looking forward, the oil traders will keep their eyes on the weekly release of private inventory data from the American Petroleum Institute (API), which is scheduled to release at 20:30 GMT. The industry stockpile for the week ended on May 1 will likely follow the tracks of the previous reduction to 9.978 million barrels into the inventories.
Crude oil has made a strong bullish recovery, as it has violated the resistance level of 21.82 level. Above 21.82, we may see oil prices soaring further higher until 25.02 level. For now, support holds around 21.85, but the bullish bias remains strong as the RSI is also heading north and may also lead oil prices on the upper side.
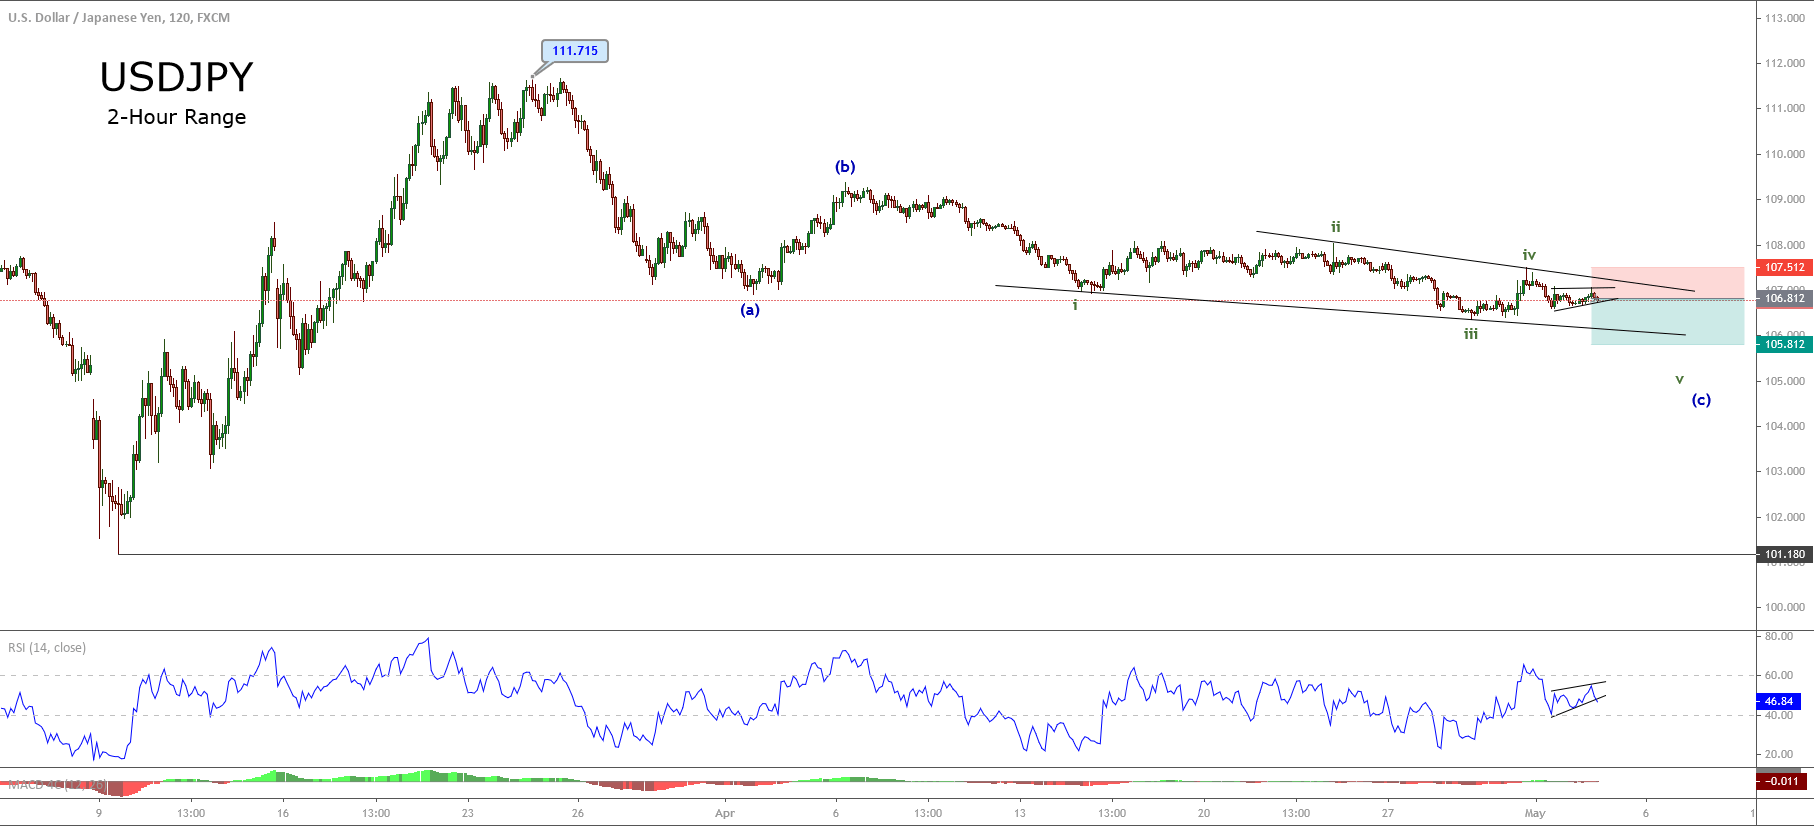
The USDJPY pair, in its 2-hour chart, exposes an incomplete bearish Elliott wave formation as an ending diagonal pattern, which suggests the possibility of further declines for the coming trading sessions.
Currently, USDJPY develops a bearish corrective sequence that began on March 24th, when the price topped at 111.715.
The internal structure of the three-wave sequence shows an incomplete ending diagonal pattern in the wave (c) of Minuette degree labeled in blue, from where the price should develop its fifth wave of Subminuette degree in green.
The intraday chart shows a consolidation structure in progress, which could provide an opportunity to place us on the sell-side. Our potential profit target locates at 105.812, which coincides with the lower line of the downward diagonal.
Our bearish scenario will be invalid if the price breaks and closes above 107.512, or surpass the upper line of the diagonal pattern.
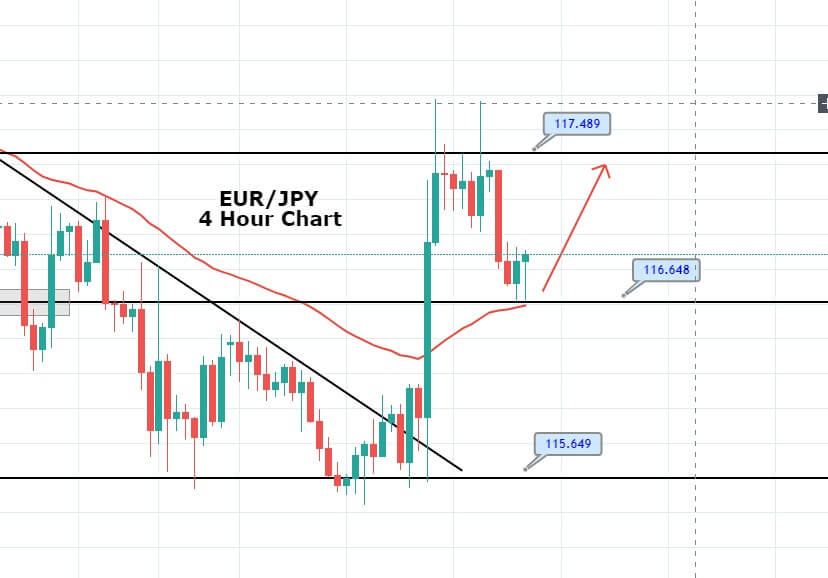
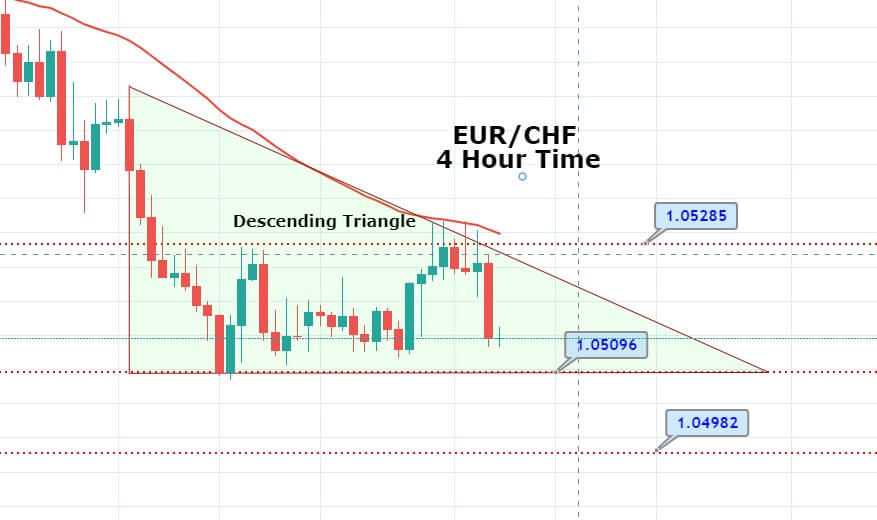
The EUR/JPY is trading bearish at 116.850, falling below the triple top resistance level of 117.500. The broad-based selling pressure of the Euro made it difficult for the EUR/JPY pair to come out of the negative territory. The 10 Year US Treasury bond yield added in the downfall of USD/JPY when it fell more than 2% on Friday.
The EUR/JPY is trading bearish at 116.850, falling below the triple top resistance level of 117.500. The broad-based selling pressure of the Euro made it difficult for the EUR/JPY pair to come out of the negative territory. The 10 Year US Treasury bond yield added in the downfall of USD/JPY when it fell more than 2% on Friday.
The EUR/JPY is trading bearish at 116.850, falling below the triple top resistance level of 117.500. The broad-based selling pressure of the Euro made it difficult for the EUR/JPY pair to come out of the negative territory. The 10 Year US Treasury bond yield added in the downfall of USD/JPY when it fell more than 2% on Friday.
On the other hand, the strategy to blame China for the outbreak of COVID-19 started weeks ago, and on Thursday, when Trump officially accused China of this and said that he would punish China for mishandling the outbreak by imposing tariffs, many other countries showed their support to him as well.
Technically, the EUR/JPY is holding above 116.580, having closed a Doji candle above 50 EMA support level of 116.600. Below this, selling bias remains strong, and it can lead the EUR/JPY pair until 115.450. On the 4 hour timeframe, EUR/JPY seems to violate the descending triangle support level of 116.600, and this can lead the pair towards an initial target level of 115.450. The MACD is holding above 0, suggesting bullish bias among traders. While the 50 periods, EMA continues to support the selling trend in the pair.
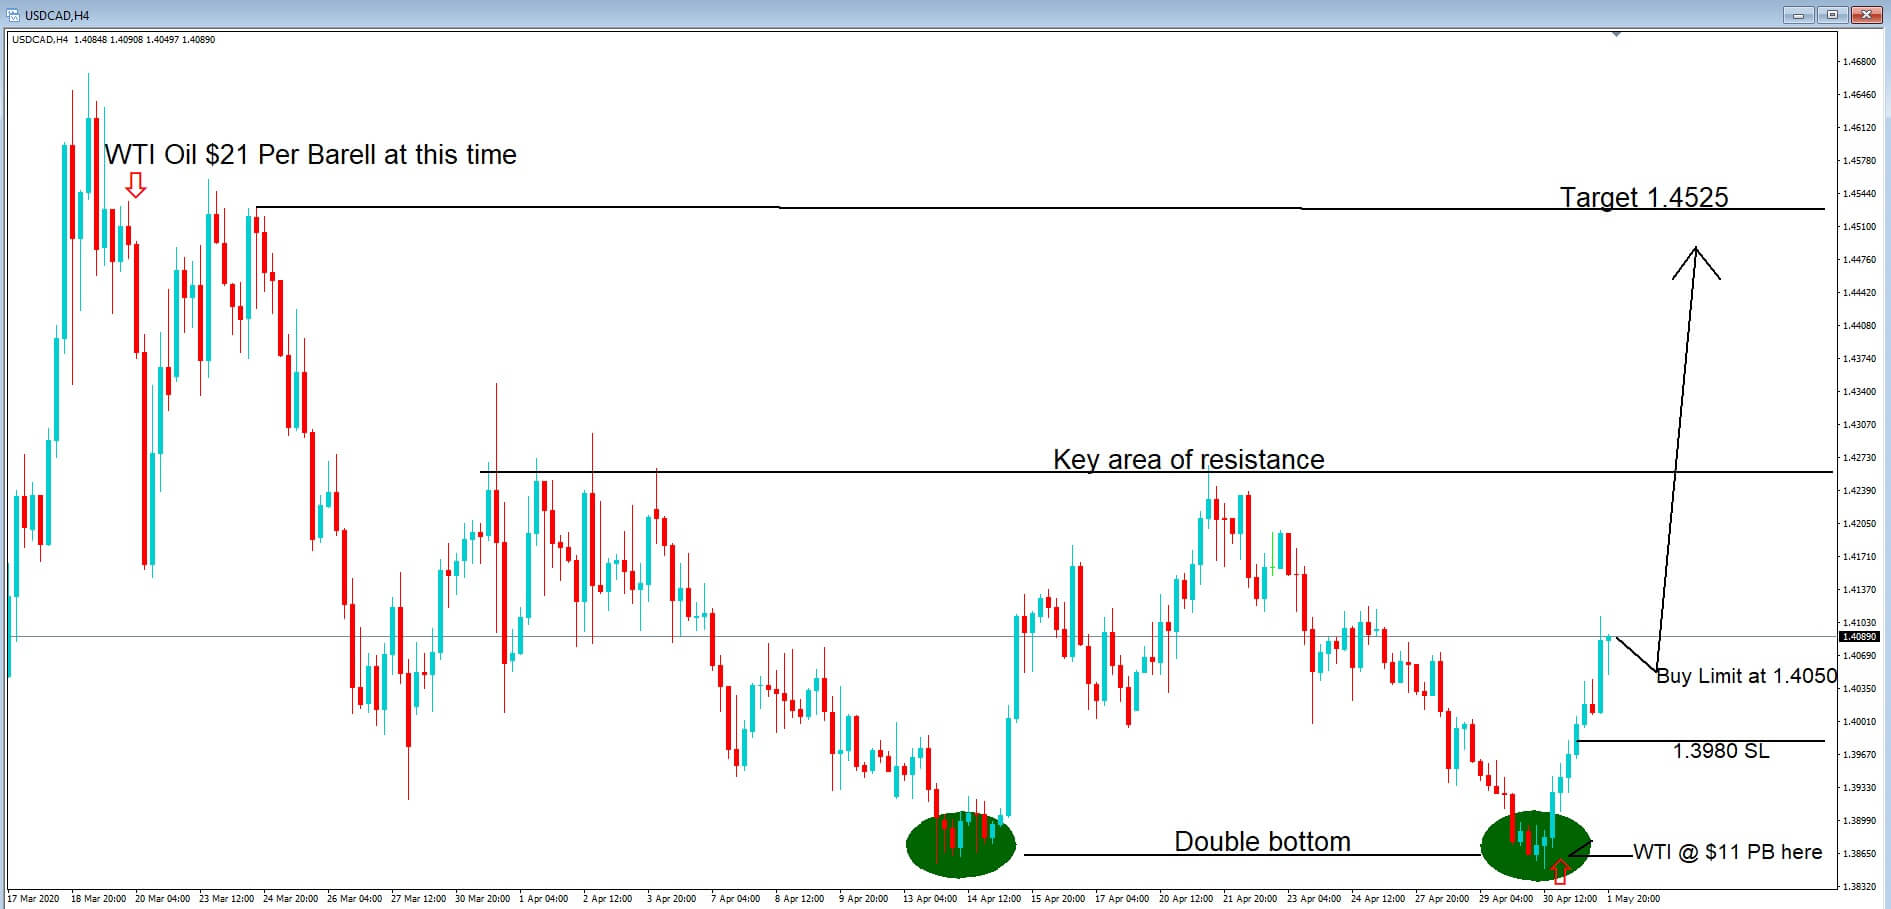
USDCAD Limit Buy entry at 1.4050 with a target of 1.4525 and SL of 1.3980
USDCAD Limit Buy entry at 1.4050 with a target of 1.4525 and SL of 1.3980
USDCAD Limit Buy entry at 1.4050 with a target of 1.4525 and SL of 1.3980
This is a 4-hour chart of the USDCAD pair. The fundamentals have been lagging the technicals with regard to this pair recently. With the Canadian GDP being heavily dependent on the oil market which equates to around 10% of the Cad$1.8 trillion Canadian income (pre Covid-19 outbreak). Therefore, any disruption in this sector will heavily affect the value of the Canadian dollar.
On the 30th of March, we saw WTI oil plummet in value, from last year’s high of over $65 per barrel to around $21 per barrel, because of the Covid virus pandemic. This sent the USDCAD pair to 1.4670, before falling to 1.3864. And where this recently became a double bottom on the 4-hour chart. Notably, the recent low at that exchange rate was when oil was 50% lower at only $11 per barrel, having crashed into negative territory at the end of April for the May future’s contract delivery.
We are now in a bull run, where we would expect a slight pullback at the beginning of the week and where we hope to go long on that pullback at 1.4050 and capture some momentum up to our target of 1.4525, based on our belief that oil prices will remain low and that the market will try and recapture the previous highs from March.
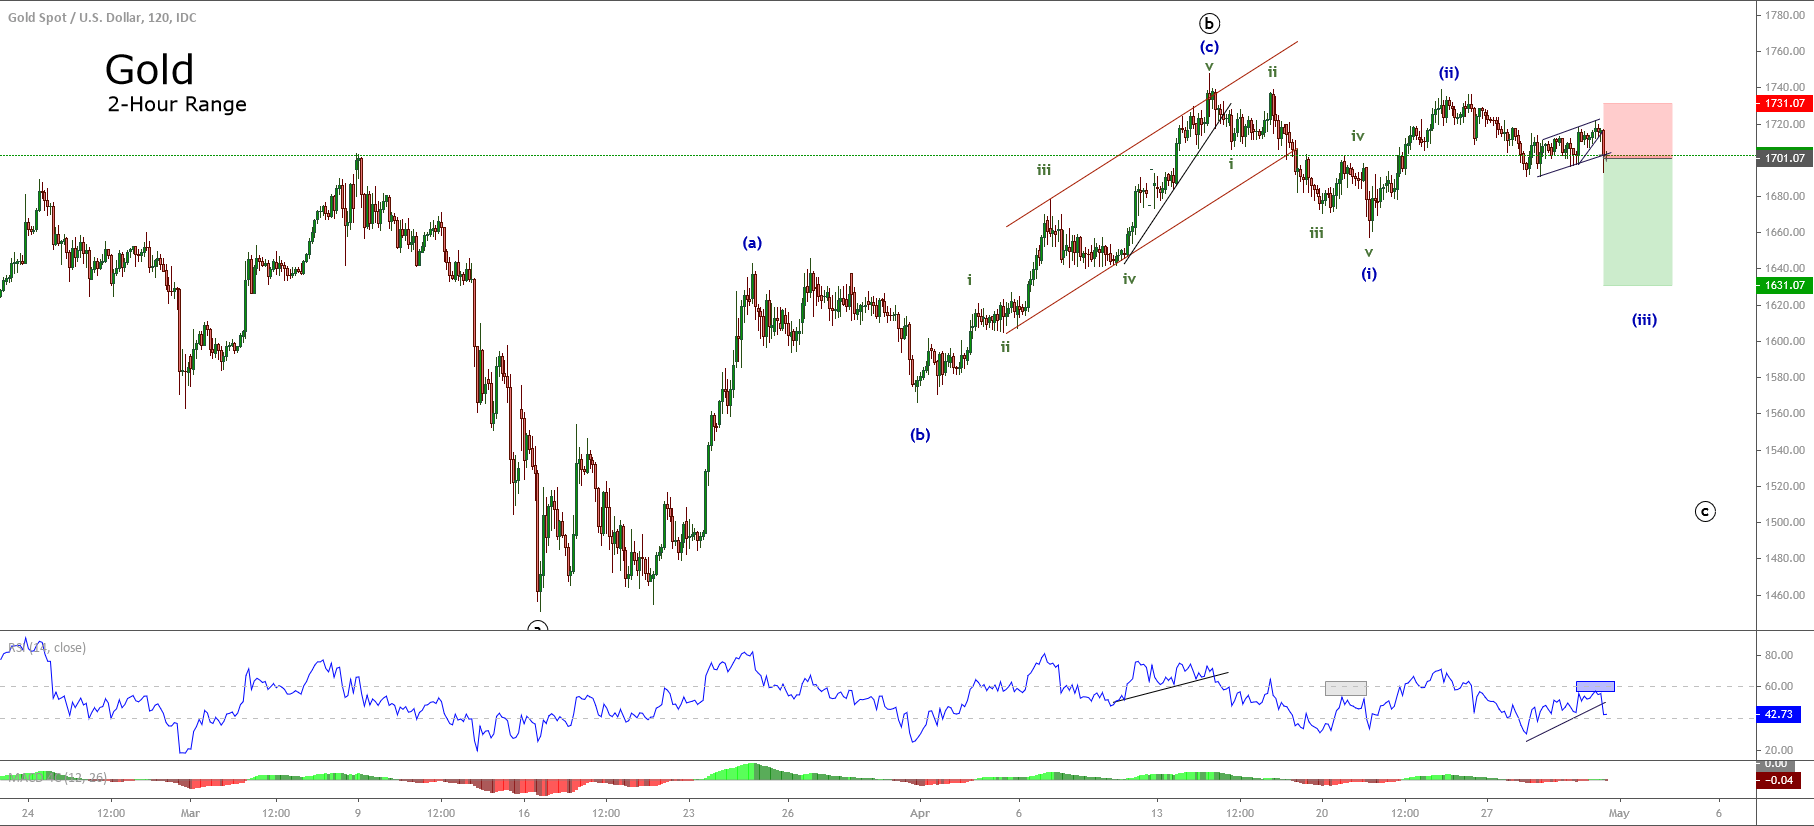
Gold, in its 2-hour chart, exposes the violation of the ascending trendline that links the latest lower highs.
The last pause structure that looks like a flag pattern suggests the possibility of bearish continuation of the previous downward movement.
On the other hand, the lower speed observed in the price action, and considering the alternation principle, we expect an aggressive sell-off, which could be supported by the strength of the US Dollar.
In the same way, the RSI oscillator rejected the last upside below level 60, which provide us an additional clue for the bearish sentiment.
We consider a bearish scenario from the current levels expecting a decline until $1,631 per ounce.
Our bearish outlook will be invalid if the price soars and closes above $1,731 per ounce.
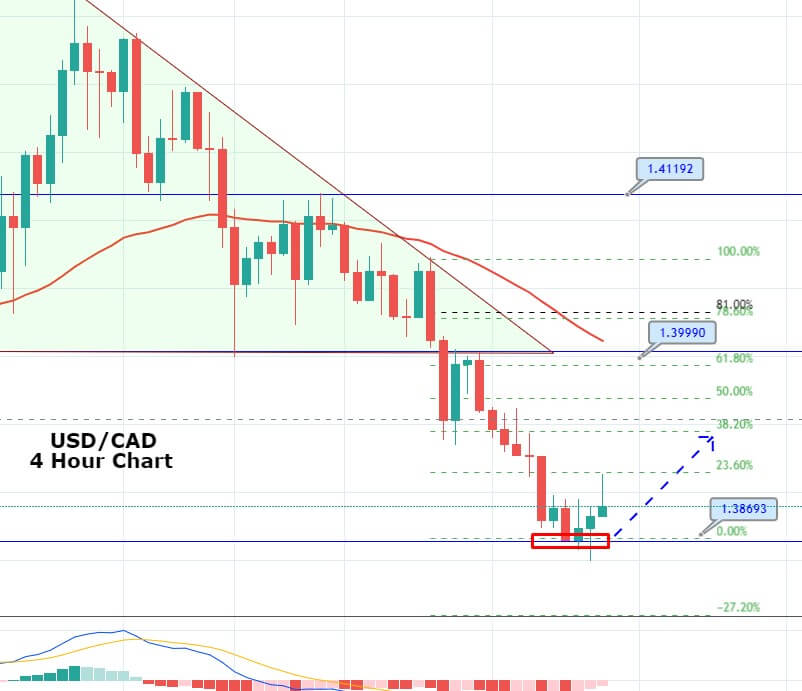
The USD/CAD pair slipped sharply to form the double bottom pattern around 1.3864 level on the 4-hour chart. The primary reason behind a sharp sell-off in the USD/CAD pair is the risk-on market sentiment, which is increasing demand for crude oil following the report of successful clinical trials of Gilead Sciences’ retroviral drug Remdesivir. The drug will be used to treat those infected by COVID-19, and investors are expecting the market will be back to its feet once this medicine gets success.
The USD/CAD pair slipped sharply to form the double bottom pattern around 1.3864 level on the 4-hour chart. The primary reason behind a sharp sell-off in the USD/CAD pair is the risk-on market sentiment, which is increasing demand for crude oil following the report of successful clinical trials of Gilead Sciences’ retroviral drug Remdesivir. The drug will be used to treat those infected by COVID-19, and investors are expecting the market will be back to its feet once this medicine gets success.
The USD/CAD pair slipped sharply to form the double bottom pattern around 1.3864 level on the 4-hour chart. The primary reason behind a sharp sell-off in the USD/CAD pair is the risk-on market sentiment, which is increasing demand for crude oil following the report of successful clinical trials of Gilead Sciences’ retroviral drug Remdesivir. The drug will be used to treat those infected by COVID-19, and investors are expecting the market will be back to its feet once this medicine gets success.
With this, demand for oil will be strong again, and due to which, Loonie will gain bullish bias, causing USD/CAD pair to drop. The US dollar draws further offers in the wake of less heaven demand and exert some pressure on the USD/CAD currency pair.
From the technical perspective, the USD/CAD pair’s failure to register any meaningful recovery further indicates that the near-term bearish pressure could not finish soon. Therefore, the range-bound trading action might still be classified as a consolidation phase before the next leg of the pair’s bearish move. Before we see further selling in the USD/CAD pair, the odds of bullish retracement will remain strong. The USD/CAD pair may drive the pair’s prices towards 23.6% or 38.2% Fibonacci retracement level of 1.3915 and 1.3945, respectively.
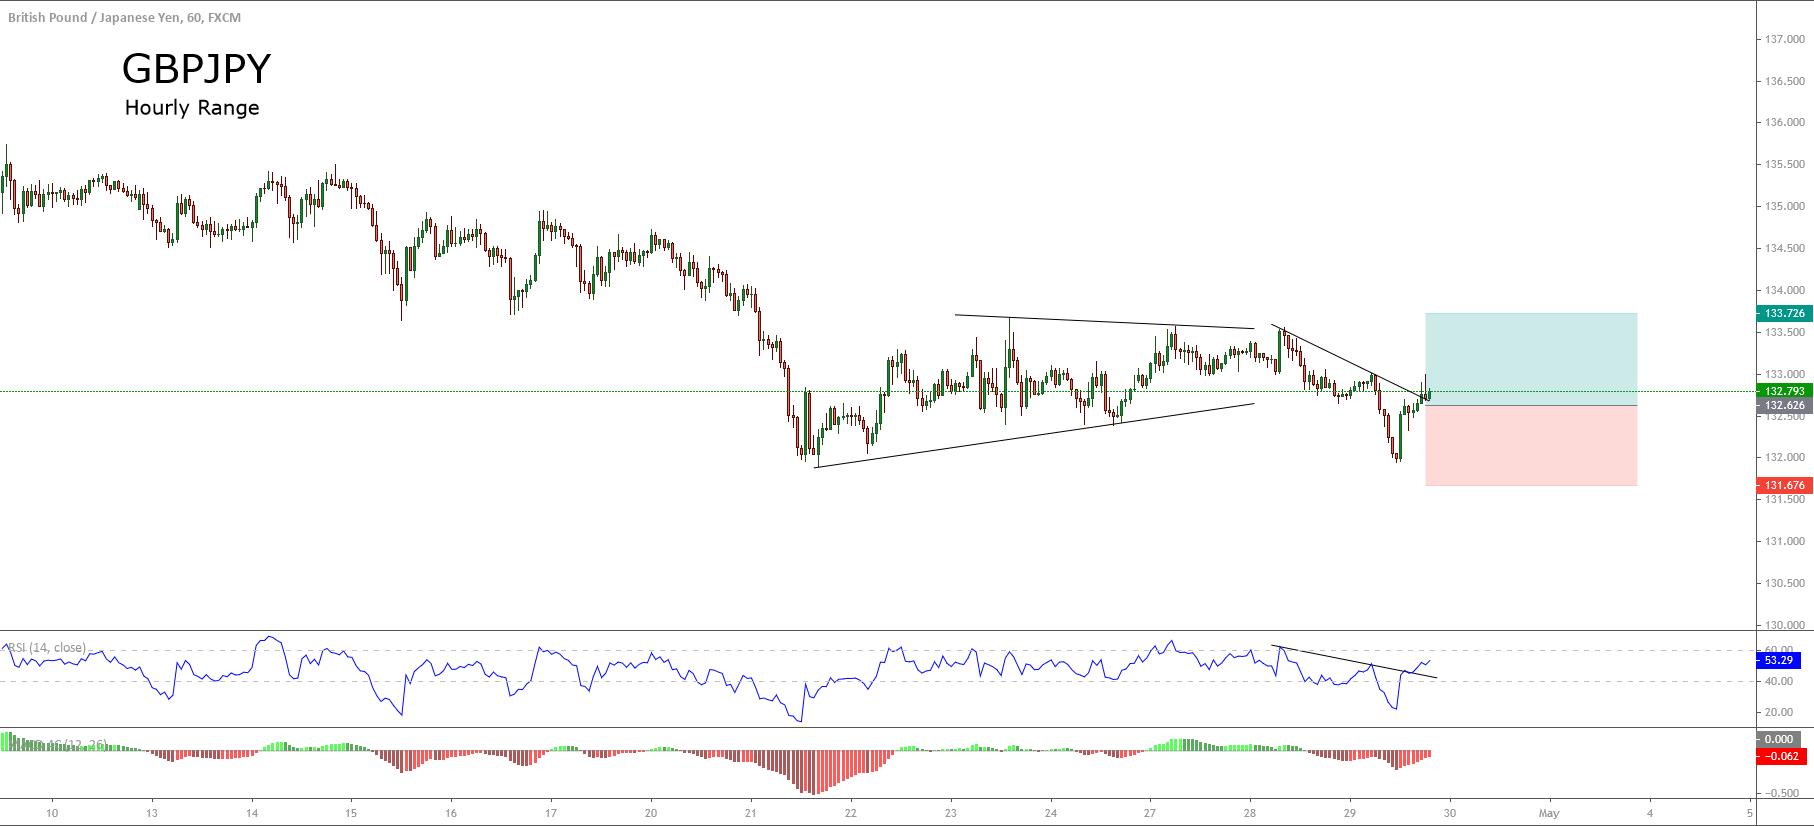
The GBPJPY cross in its hourly chart shows an intraday upward reaction leaving an engulfing candle. This movement suggests the possibility of a bullish sequence, which could continue in the trading sessions ahead.
On the other hand, the RSI oscillator exposes a bullish breakout of the descending trendline corresponding to the last decline developed by the cross.
Our bullish scenario considers the possibility of a retrace of price action until the area of the previous pivot candle at level 132.62. This retracement could allow the incorporation of fresh bull traders supporting the movement left by the engulfing candle.
In our conservative scenario, we expect an upside above the previous highs at level 133.76. The level that invalidates our upward setup locates at 131.67.
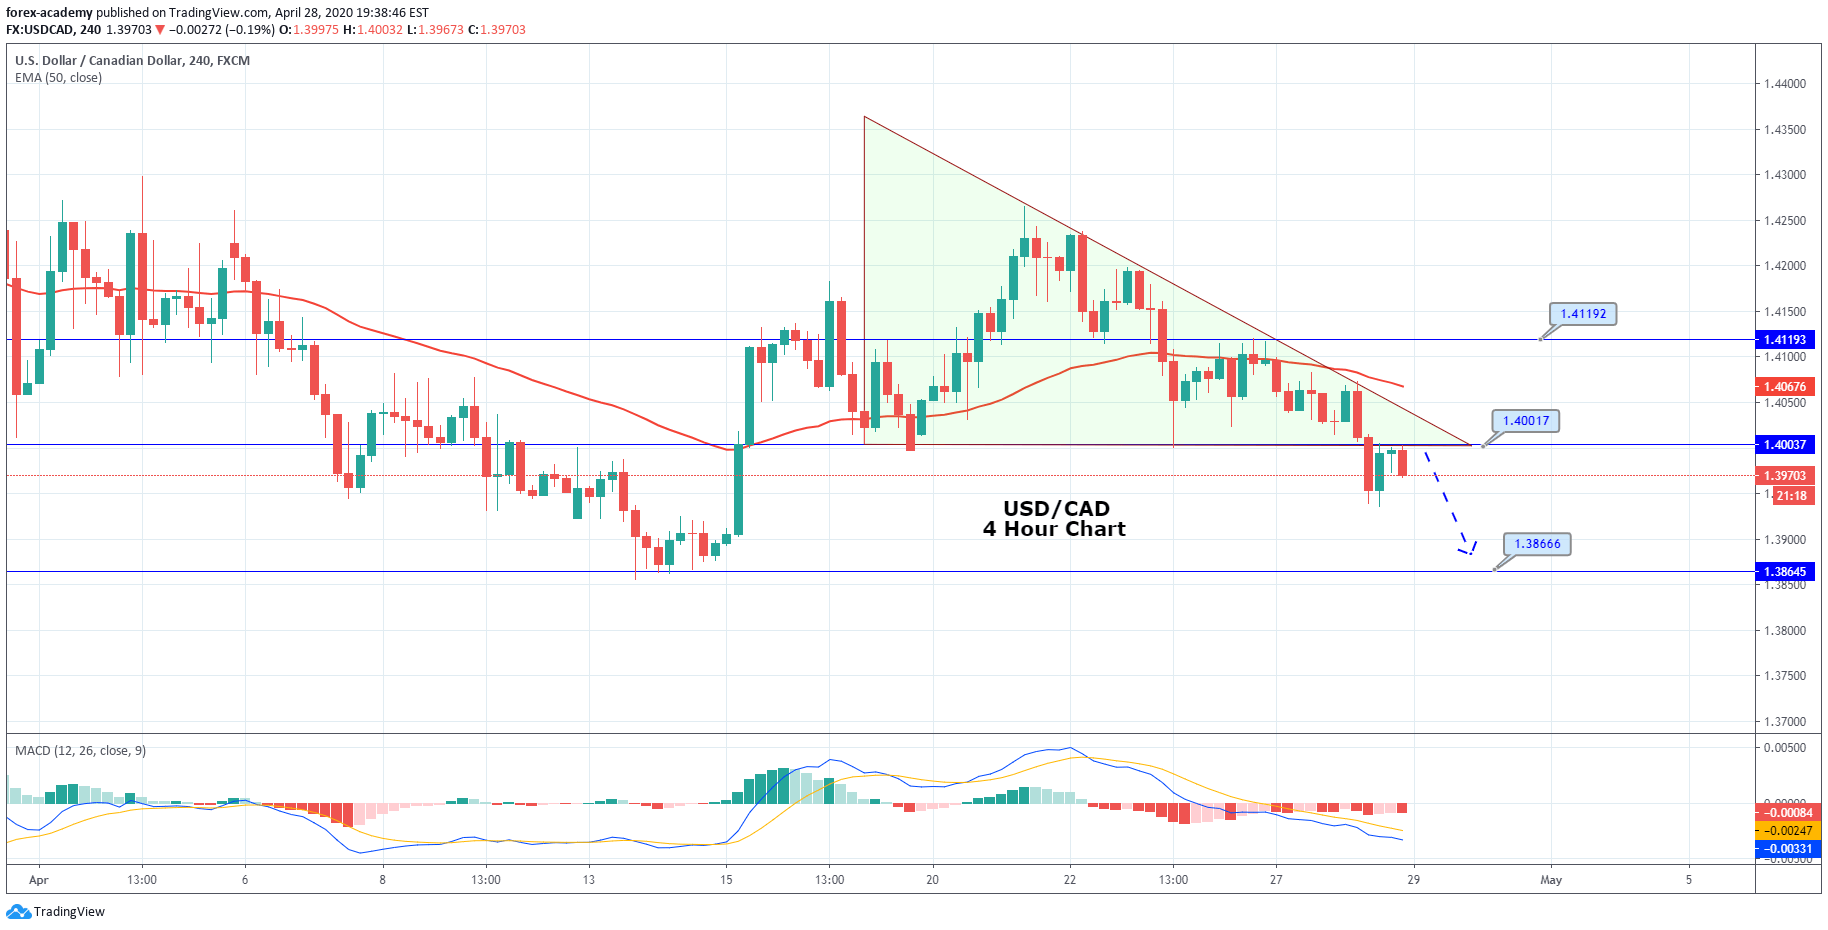
The USD/CAD is trading with a bearish bias at 1.3970 level since the pair has violated the descending triangle pattern, which supported the pair around 1.4000. It seems like most of the selling is triggered in the wake of increased crude oil prices. The WTI prices soared despite on-going worries about oversupply and a lack of storage space across the world. These concerns come after the most significant US exchange-traded fund said it would sell all its front-month crude contracts to avoid further losses, which eventually weakened the Canadian dollar.
The USD/CAD is trading with a bearish bias at 1.3970 level since the pair has violated the descending triangle pattern, which supported the pair around 1.4000. It seems like most of the selling is triggered in the wake of increased crude oil prices. The WTI prices soared despite on-going worries about oversupply and a lack of storage space across the world. These concerns come after the most significant US exchange-traded fund said it would sell all its front-month crude contracts to avoid further losses, which eventually weakened the Canadian dollar.
The USD/CAD is trading with a bearish bias at 1.3970 level since the pair has violated the descending triangle pattern, which supported the pair around 1.4000. It seems like most of the selling is triggered in the wake of increased crude oil prices. The WTI prices soared despite on-going worries about oversupply and a lack of storage space across the world. These concerns come after the most significant US exchange-traded fund said it would sell all its front-month crude contracts to avoid further losses, which eventually weakened the Canadian dollar.
Traders failed to cheer the latest optimism about the easing of coronavirus-related restrictions globally, mainly due to the latest declines in crude oil prices. As in result, the traders lost their confidence during the current cautious moo in the equity markets.
Consider the bearish breakout of the descending triangle pattern; we may see USD/CAD prices to go after 1.3866 support level, while resistance continues to stay at 1.4000. The 50 EMA is holding at 1.4067, and the MACD is below 0, suggesting chances of bearish trend continuation. Hence, we have opened a selling trade in USD/CAD.
The USD/JPY failed to stop its four-day declining streak and witnessed some further selling near two-weeks lows at 106.65 level, mainly due to the cautious mood around the equity markets, which strengthens the Japanese yen’s safe-haven demand and sent the pair down.
The USD/JPY failed to stop its four-day declining streak and witnessed some further selling near two-weeks lows at 106.65 level, mainly due to the cautious mood around the equity markets, which strengthens the Japanese yen’s safe-haven demand and sent the pair down.
The USD/JPY failed to stop its four-day declining streak and witnessed some further selling near two-weeks lows at 106.65 level, mainly due to the cautious mood around the equity markets, which strengthens the Japanese yen’s safe-haven demand and sent the pair down.
On the other hand, the broad-based US dollar weakness helps the pair to dip further below 107, the triple bottom level. It seems like the trader’s sentiment is badly damaged despite the latest positive hopes about easing coronavirus-related lockdowns worldwide and a push to accelerate the gradual re-opening of the economies.
The safe-haven demand further increased by the fresh downturn in the US Treasury bond yields, which also contributed to the pair’s bearish moves. However, the latest pullback of the US dollar helped limit deeper losses.
On the technical front, the USD/JPY was facing solid support around 107, the round figure, but it got violated over increased demand for safe-haven yen. At the moment, the USD/JPY is facing strong resistance around 107, along with support at 106.500, but this support seems weaker, and we may see USD/JPY prices falling further until 106.240 later today. Consider moving your stop loss at breakeven as soon as the signal starts yielding 20 pips profit.
The AUD/USD currency pair registered 5-day winning streak and continues to taking bids mainly due to the risk-on market sentiment. The pair has succeeded in recovering around 25-30 pips from the session lows and reached near the high end of its daily trading range at 0.6479 as most of the governments showing a willingness to reopen their economies. On the other hand, the latest pullback of the US dollar keeps the currency pair gains limited.
Currently, the AUD/USD is trading at 0.6483 and consolidates in the range between the 0.6433 – 0.6483. Earlier in the day, the risk sentiment got support from the hopes of easing lockdowns in the major economies, including Australia, mainly due to the death toll dropped to its lowest level in the month. However, global scientists are still struggling to find the vaccine of the coronavirus (COVID-19).
Technically, the AUD/USD pair is gaining strong support around 0.6443, and closing of bullish engulfing pattern over this level may drive some buying in the Aussie dollar pair. The 50 EMA and MACD both are in support of the buying trend while an upward trendline on the 4-hour timeframe is suggesting chances of bullish trend continuation in the market. The Aussie dollar may continue trading bullish until next resistance area of 0.6536 and 0.65736. Hence, we opened a buying trade with an entry price of 0.64736.
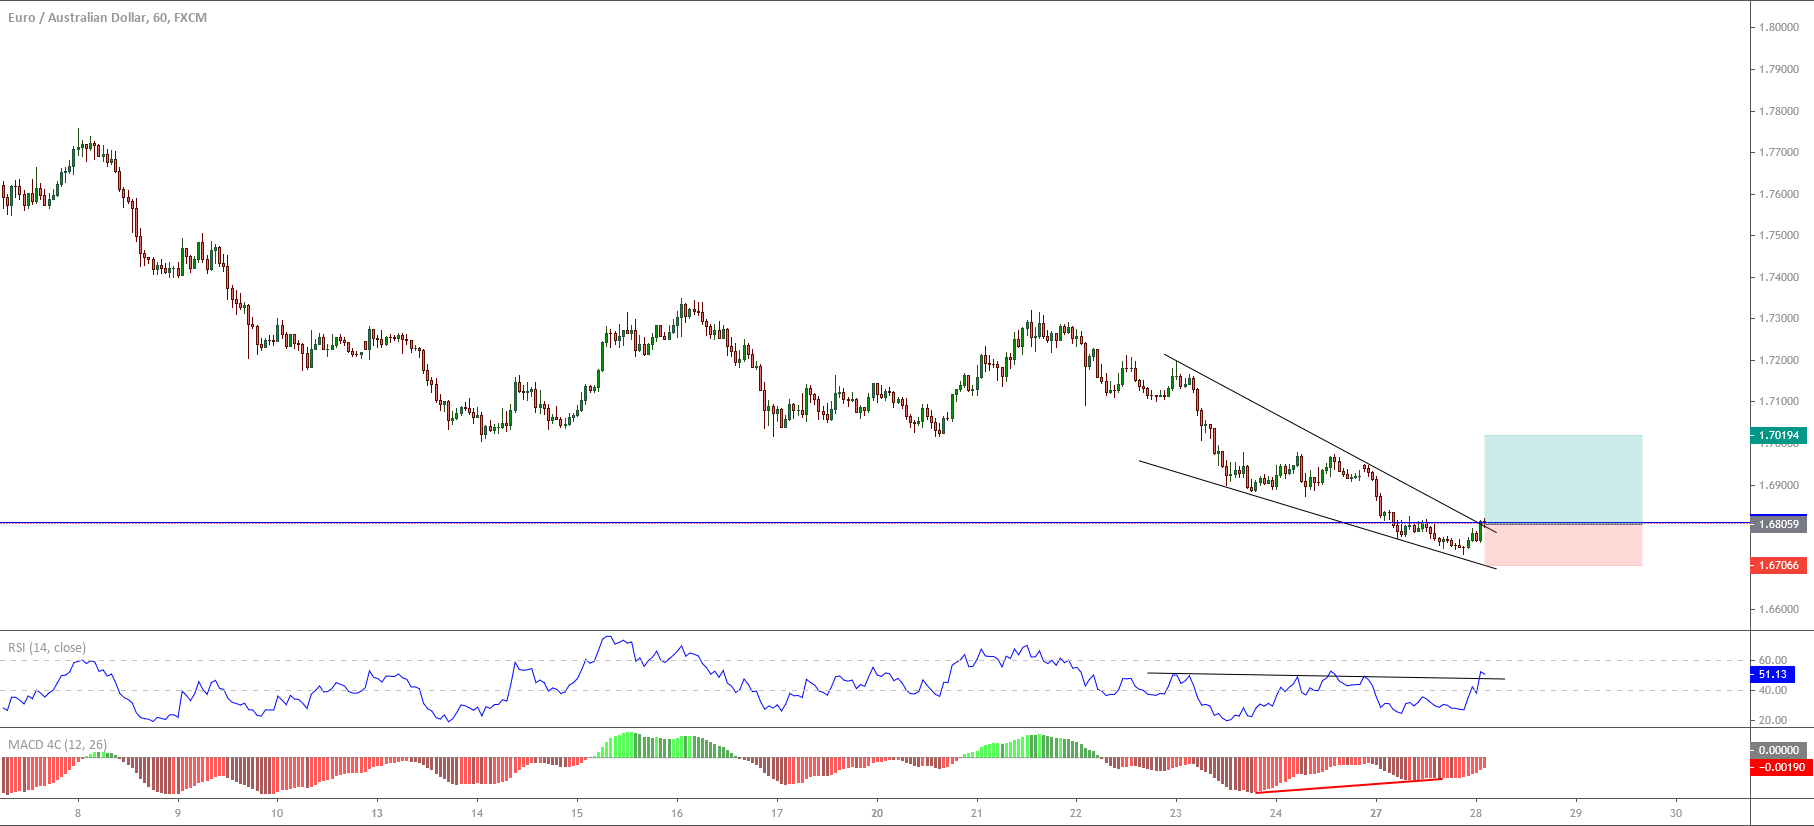
The EURAUD cross, in its hourly chart, shows a falling wedge chartist pattern, which could be ending due to the price action soars above the upper line of the descending formation.
The falling wedge is a terminal formation that suggests the end of the trend, and in consequence, the possibility of the change of the market bias.
On the other hand, the oscillators RSI and MACD shows exhaustion signals of the bearish trend in progress. In the same way, RSI exposes a breakout signal, suggesting the probability of a new bullish movement.
If the price action confirms the bullish breakout, the EURAUD cross may soar until level 1.7019. The level that invalidates our bearish scenario locates at 1.6706.
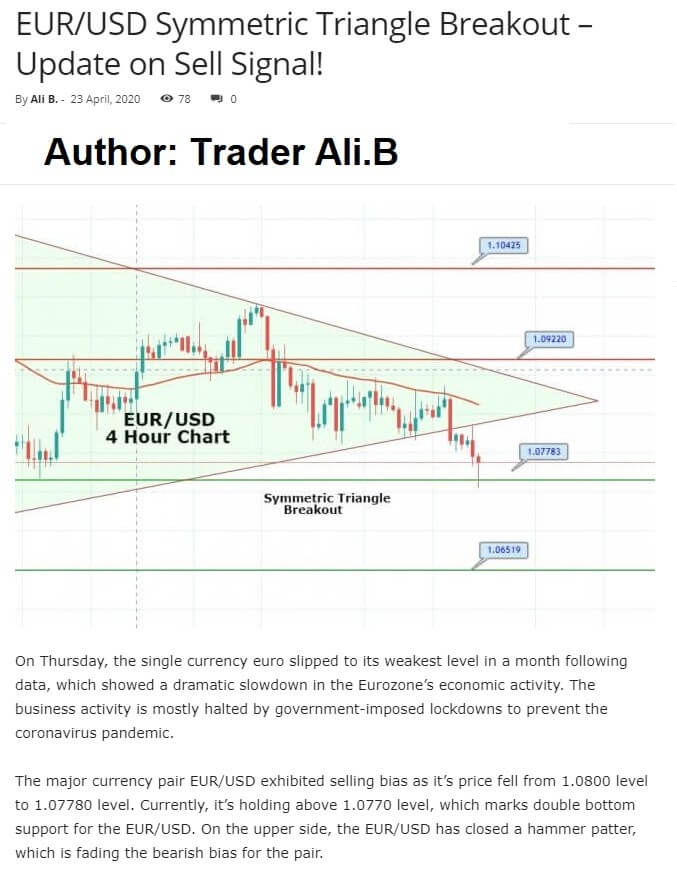
On Thursday, the single currency euro slipped to its weakest level in a month following data, which showed a dramatic slowdown in the Eurozone’s economic activity. The business activity is mostly halted by government-imposed lockdowns to prevent the coronavirus pandemic.
On Thursday, the single currency euro slipped to its weakest level in a month following data, which showed a dramatic slowdown in the Eurozone’s economic activity. The business activity is mostly halted by government-imposed lockdowns to prevent the coronavirus pandemic.
On Thursday, the single currency euro slipped to its weakest level in a month following data, which showed a dramatic slowdown in the Eurozone’s economic activity. The business activity is mostly halted by government-imposed lockdowns to prevent the coronavirus pandemic.
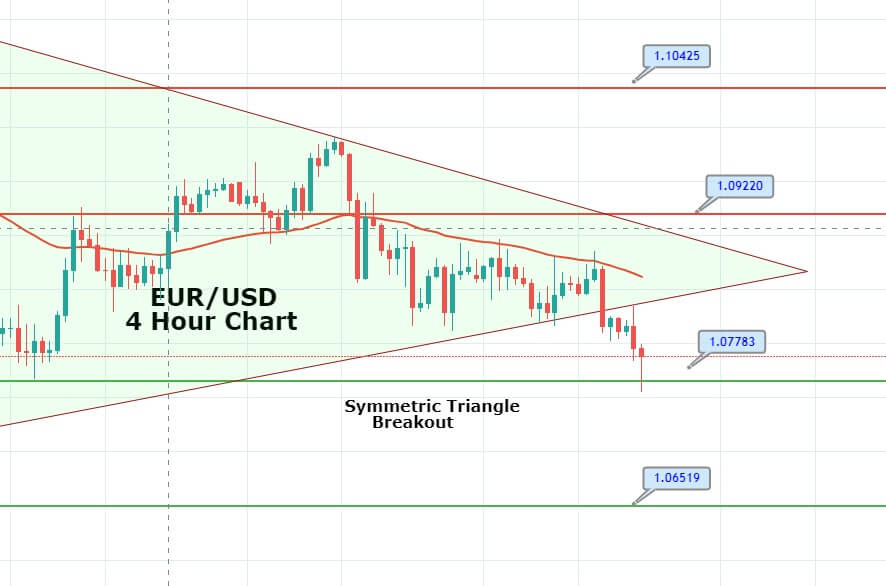
The major currency pair EUR/USD exhibited selling bias as it’s price fell from 1.0800 level to 1.07780 level. Currently, it’s holding above 1.0770 level, which marks double bottom support for the EUR/USD. On the upper side, the EUR/USD has closed a hammer patter, which is fading the bearish bias for the pair.
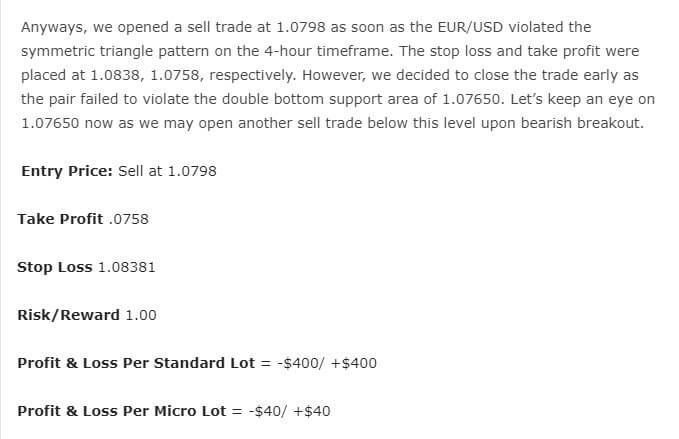
Anyways, we opened a sell trade at 1.0798 as soon as the EUR/USD violated the symmetric triangle pattern on the 4-hour timeframe. The stop loss and take profit were placed at 1.0838, 1.0758, respectively. However, we decided to close the trade early as the pair failed to violate the double bottom support area of 1.07650. Let’s keep an eye on 1.07650 now as we may open another sell trade below this level upon bearish breakout.
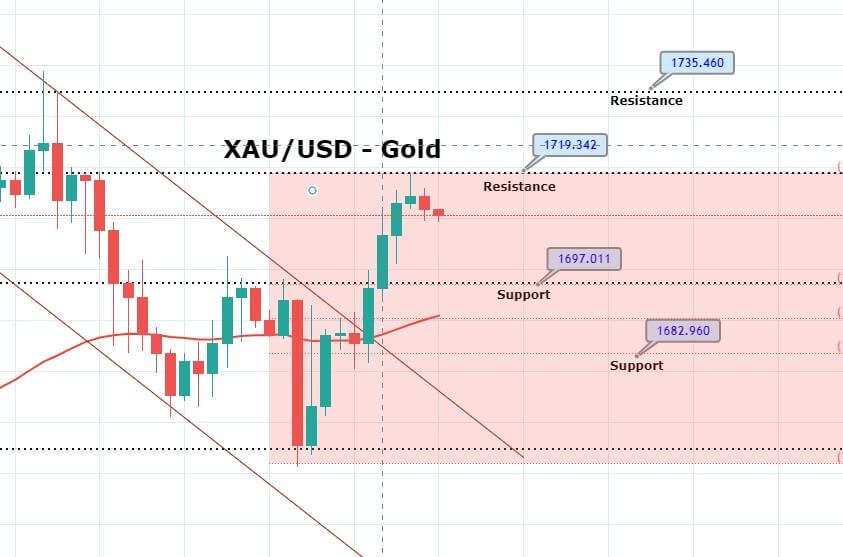
During the Asian session, the precious metal gold was trading at 1,713 area. Technically, gold has entered the overbought zone, and it may help show us a slight bearish retracement below 1,718 area until 23.8% Fibonacci retracement level of 1,705 before showing further bullish trends in the market.
During the Asian session, the precious metal gold was trading at 1,713 area. Technically, gold has entered the overbought zone, and it may help show us a slight bearish retracement below 1,718 area until 23.8% Fibonacci retracement level of 1,705 before showing further bullish trends in the market.
During the Asian session, the precious metal gold was trading at 1,713 area. Technically, gold has entered the overbought zone, and it may help show us a slight bearish retracement below 1,718 area until 23.8% Fibonacci retracement level of 1,705 before showing further bullish trends in the market.
Overall, the fundamental side of the market is suggesting a bullish bias for gold as it’s price soared as much as 1.9% a day before. Most of the bullish bias was seen in the wake of sentiments of additional fiscal and monetary stimulus measures amid massive economic collapse due to stay-at-home and business abandonment orders around the world to restrict the spread of the novel coronavirus.
On the 4 hour timeframe, the precious metal gold has formed a bearish engulfing candle, which is suggesting odds of selling trend in the market below the 1,718 area. Since the overall trend seems bullish, we will try to capture quick sell in gold. Let’s open a sell trade at 1712.52 with a stop loss around 1720.02 and take a profit at 1705.02.
The EUR/CHF is trading in a selling channel, having dropped from 1.0520 level heading to test the triple bottom support zone of 1.0509. The demand for safe-haven appears to have increased due to the increased number of coronavirus cases around the globe. The strength of the single currency Euro is also keeping the pair supported. Most of the selling in the single currency euro rise in the wake of the dovish ECB monetary policy stance in the wake of the COVID19 crises.
The EUR/CHF is trading in a selling channel, having dropped from 1.0520 level heading to test the triple bottom support zone of 1.0509. The demand for safe-haven appears to have increased due to the increased number of coronavirus cases around the globe. The strength of the single currency Euro is also keeping the pair supported. Most of the selling in the single currency euro rise in the wake of the dovish ECB monetary policy stance in the wake of the COVID19 crises.
The EUR/CHF is trading in a selling channel, having dropped from 1.0520 level heading to test the triple bottom support zone of 1.0509. The demand for safe-haven appears to have increased due to the increased number of coronavirus cases around the globe. The strength of the single currency Euro is also keeping the pair supported. Most of the selling in the single currency euro rise in the wake of the dovish ECB monetary policy stance in the wake of the COVID19 crises.
The single currency euro exhausted following the European Central Bank, which announced more stimulus to accommodate the coronavirus impact. The ECB endorsed new stimulus measures to support the euro-region economy to deal with the increasing damage of the coronavirus disease.
The EUR/CHF has developed a descending triangle pattern on the 4-hour timeframe which is supporting the pair at 1.0509 along with resistance around 1.0528. On the 4 hour timeframe, a bearish breakout of 1.0509 can lead the pair towards 1.0490 and even lower. As we see, the 50 periods EMA gave a hard time to EUR/CHF, which faced strong resistance around 1.0525. Considering selling bias, we have entered the selling trade at 1.05159 with a stop loss at 1.05659 and take profit at 1.04659.
Entry Price: Sell at 1.05159
Take Profit 1.04659
Stop Loss 1.05659
Risk/Reward 1.00
Profit & Loss Per Standard Lot = -$516.5/ +$516.5
Ethereum was trading inside a triangular consolidation after the drop made on Sunday and Morning. The price has been respecting the 200-hour SMA. This morning ETH made a good candle on an increasing volume that broke the triangle to the upside and cut above the 50-hour SMA. Subsequent candles moved the price above the $175 level in which is now holding. On the 4H timeframe the asset moves in what is an upward channel, which the price action still respects. Finally, the MACD confirms the bullish phase.
The CADJPY cross, in its 4-hour chart, illustrates a consolidation structure after the price developed an impulsive bullish movement from the March 18th low at 73.803, which finished when the cross topped at 78.479 on March 25th.
The consolidation structure realized by CADJPY looks like a corrective formation in three-waves, which could bounce from the current zone that coincides with the 61.8% of Fibonacci retracement of the previous impulsive movement.
A buy-side position would trigger from the current area. In our conservative bullish scenario, we expect a bounce that could reach the previous high at 77.04 as a psychological resistance.
The bullish scenario will be invalid if the price drops and closes below the level 74.75.
The GBP/USD prices are on a bearish mode, falling from 1.2400 level to 1.23700 area. Overall, the pair was supported around 1.2400 zones, but since this level is already violated, the Cable has strong odds of falling further until the 1.2290 area.
The GBP/USD prices are on a bearish mode, falling from 1.2400 level to 1.23700 area. Overall, the pair was supported around 1.2400 zones, but since this level is already violated, the Cable has strong odds of falling further until the 1.2290 area.
The GBP/USD prices are on a bearish mode, falling from 1.2400 level to 1.23700 area. Overall, the pair was supported around 1.2400 zones, but since this level is already violated, the Cable has strong odds of falling further until the 1.2290 area.
Sterling is getting weaker on the back of Brexit trade negotiations, which have been resumed. These should include another dimension to British Pound trading over the following weeks, with one economist saying markets should “fear” an initial July 01 deadline.
The United Kingdom and Eurozone have until July 01 to allow to prolong the transition phase, which is expected to run out by year-end to reach a free-trade plan. In case, no such extension is granted, economists warn the Pound could come below significant pressure throughout the second half of 2020.
Technically, the GBP/USD pair is trading at 1.2350, and it’s a good thing as we already entered the market at 1.2383 level. The reason behind entering selling trade is the breakout of the sideways trading range of 1.2400 – 1.2500, which got triggered after the release of worse than expected employment report from the United Kingdom. We have placed take profit 1.2323 with a stop loss of around 1.2443.
The EUR/JPY is trading bearish at 116.450, having violated the support level of 116.600 level. Holding below this strong resistance can extend selling bias until 115.650 areas in the coming days. It’s the COVID 19, which is consistently impacting the exchange rate of the EUR/JPY pair.
The EUR/JPY is trading bearish at 116.450, having violated the support level of 116.600 level. Holding below this strong resistance can extend selling bias until 115.650 areas in the coming days. It’s the COVID 19, which is consistently impacting the exchange rate of the EUR/JPY pair.
The EUR/JPY is trading bearish at 116.450, having violated the support level of 116.600 level. Holding below this strong resistance can extend selling bias until 115.650 areas in the coming days. It’s the COVID 19, which is consistently impacting the exchange rate of the EUR/JPY pair.
The Spanish government will offer to its European Union allies that they produce a 1.5 trillion euro ($1.63 trillion) rescue fund supported through perpetual debt to help countries worst-hit by the coronavirus trauma. With an increased number of finance, the single currency Euro may weaken. Alongside this, the Japanese yen is facing slight support in the wake of safe-haven appeal.
Technically, the EUR/JPY has violated a narrow range, which was extending support at 116.600 level. Below this, selling bias remains strong, and it can lead the EUR/JPY pair until 115.450. On the 4 hour timeframe, EUR/JPY seems to violate the descending triangle support level of 116.600, and this can lead the pair towards an initial target level of 115.450. The MACD is holding below 0, suggesting bearish bias among traders. While the 50 periods, EMA continues to support the selling trend in the pair.
Gold, in its 2-hour chart, shows an intraday recovery after the bearish sequence started on April 14th when the price found sellers at $1,747.47 per ounce.
Once the price soared above the upper line of the ascending channel and sellers pulled-down the precious metal, Gold began to develop a downward movement. This sequence looks like the third wave of Subminuette degree identified in green.
If our intraday analysis is correct, the recovery observed on Monday’s session should reach the zone between 38.2% and 50% of the third wave.
On the other hand, the RSI oscillator bounced and didn’t surpass the level 60, which make us foresee further declines.
The sell-side position will activate at the psychological level at $1,700 per ounce. As a conservative scenario, we expect a re-test of the previous low at $1,670, which would correspond to the fifth wave of Subminuette degree in green.
Finally, our bearish setup will be invalid if the price soars and closes above $1,725 per ounce.
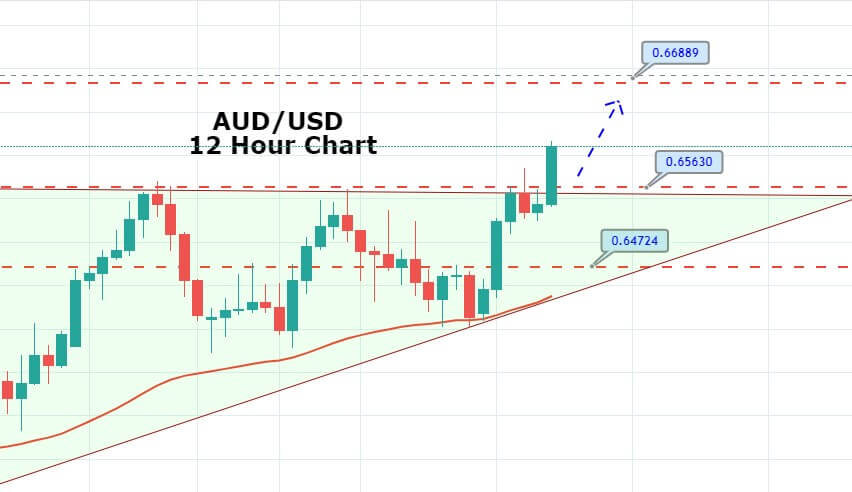
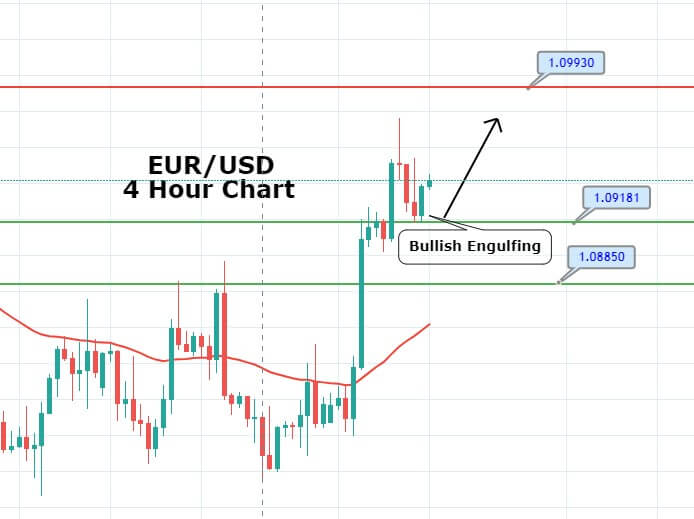
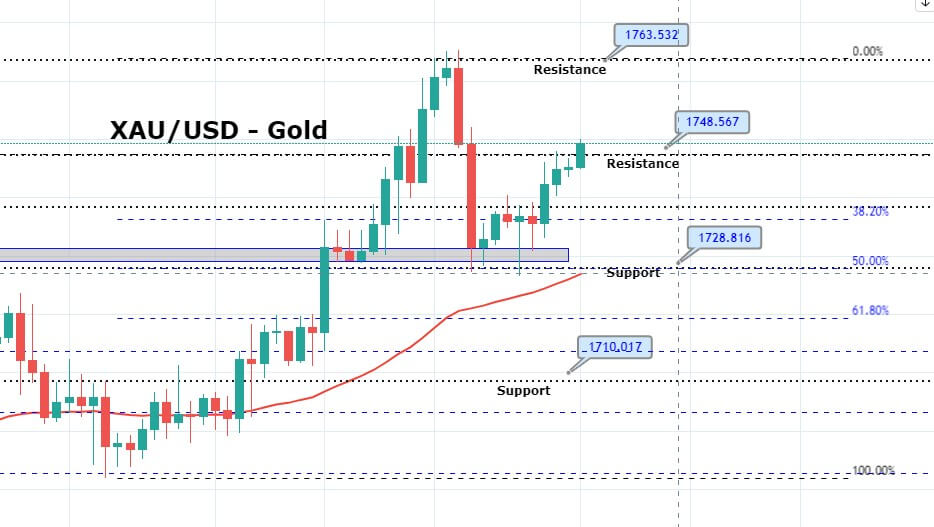
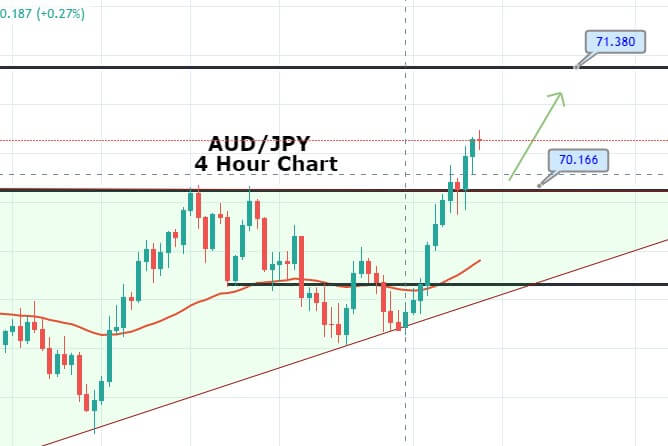
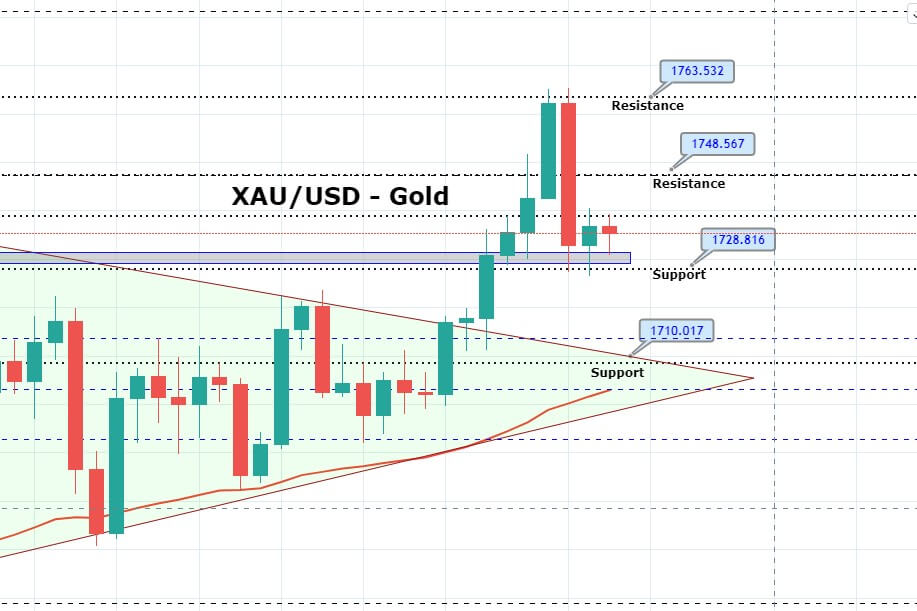
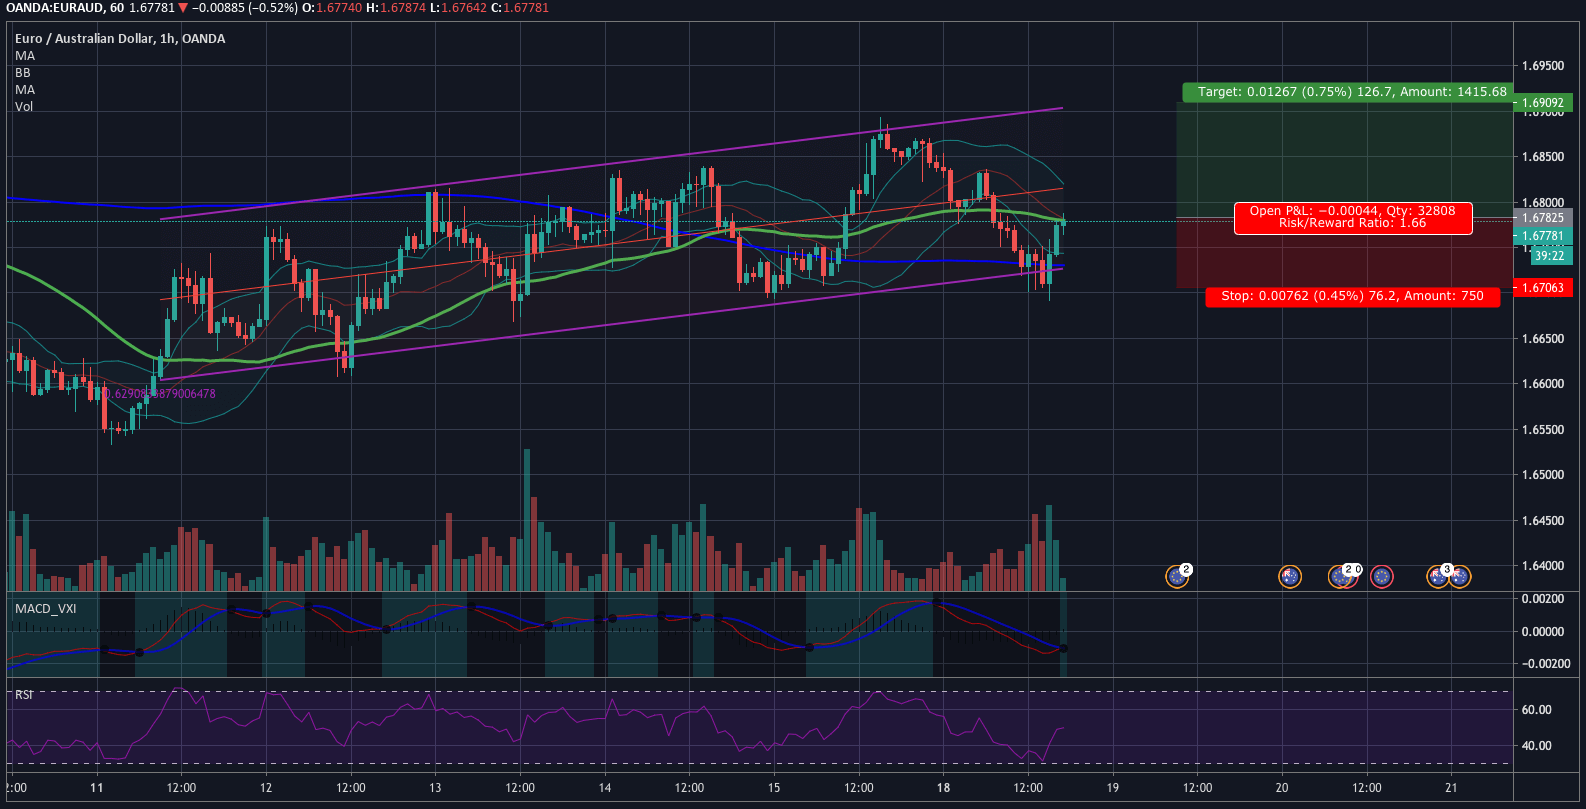
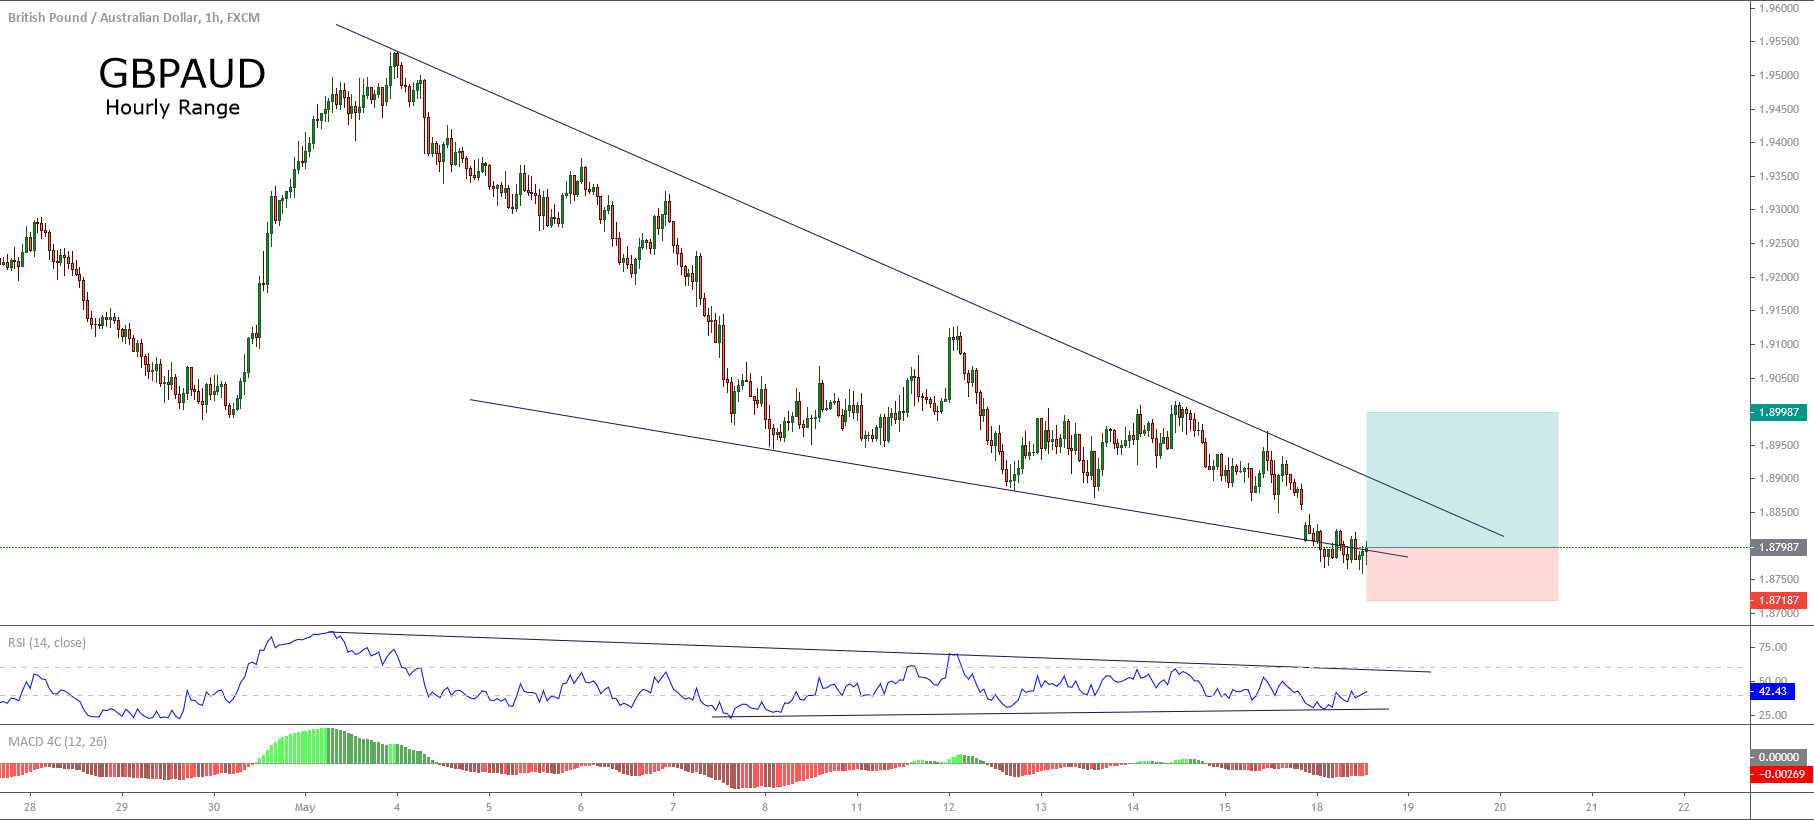


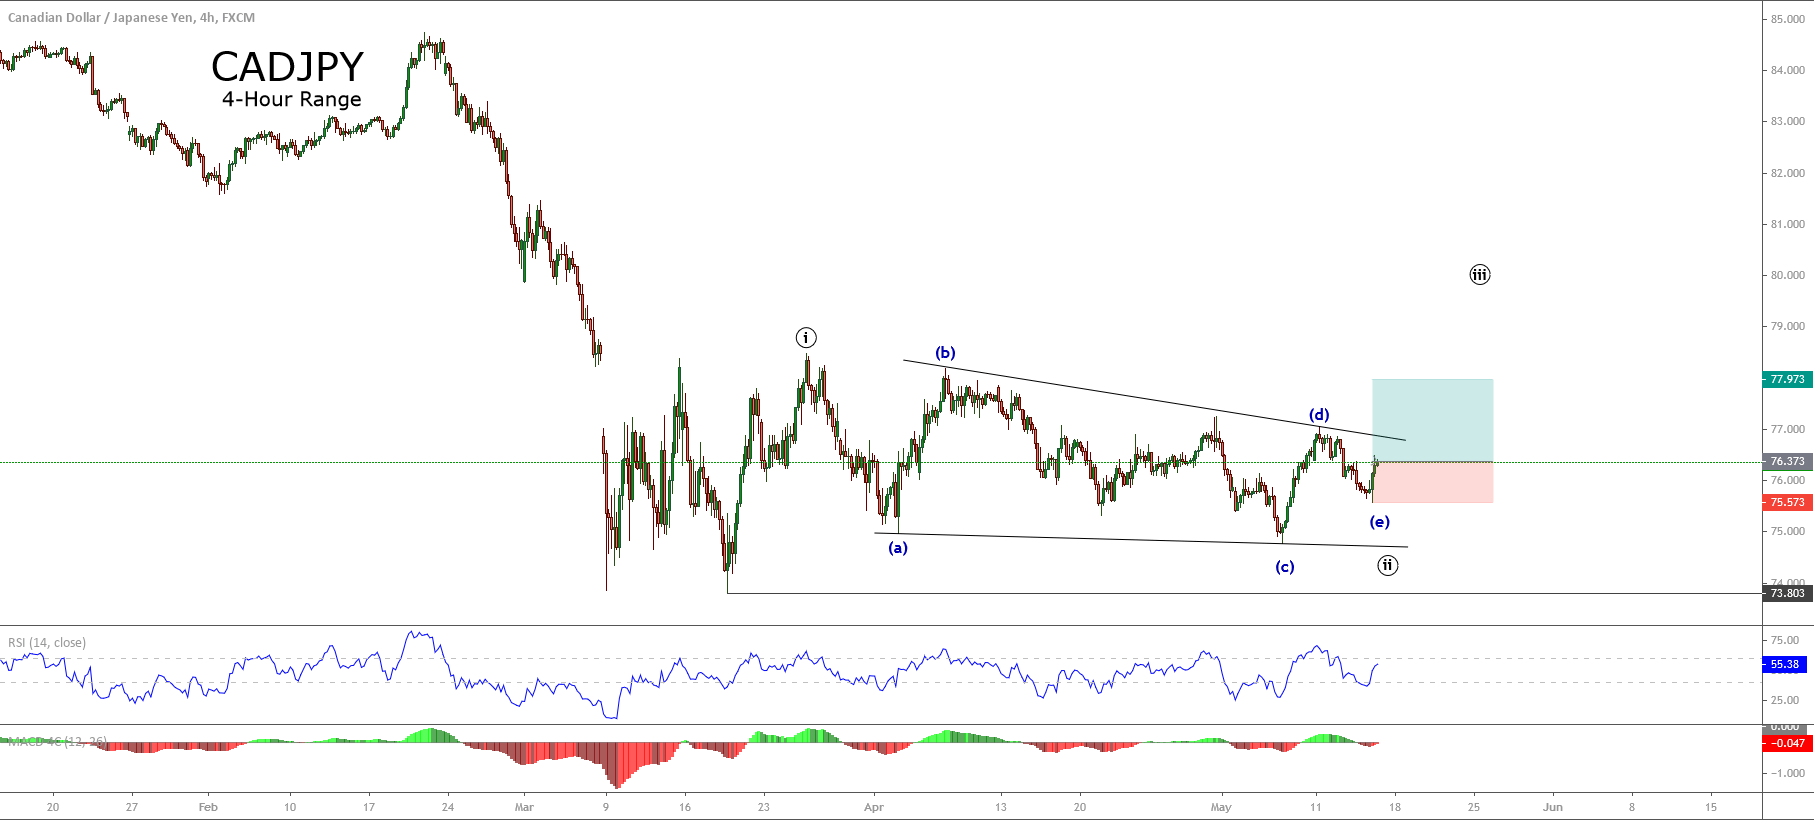
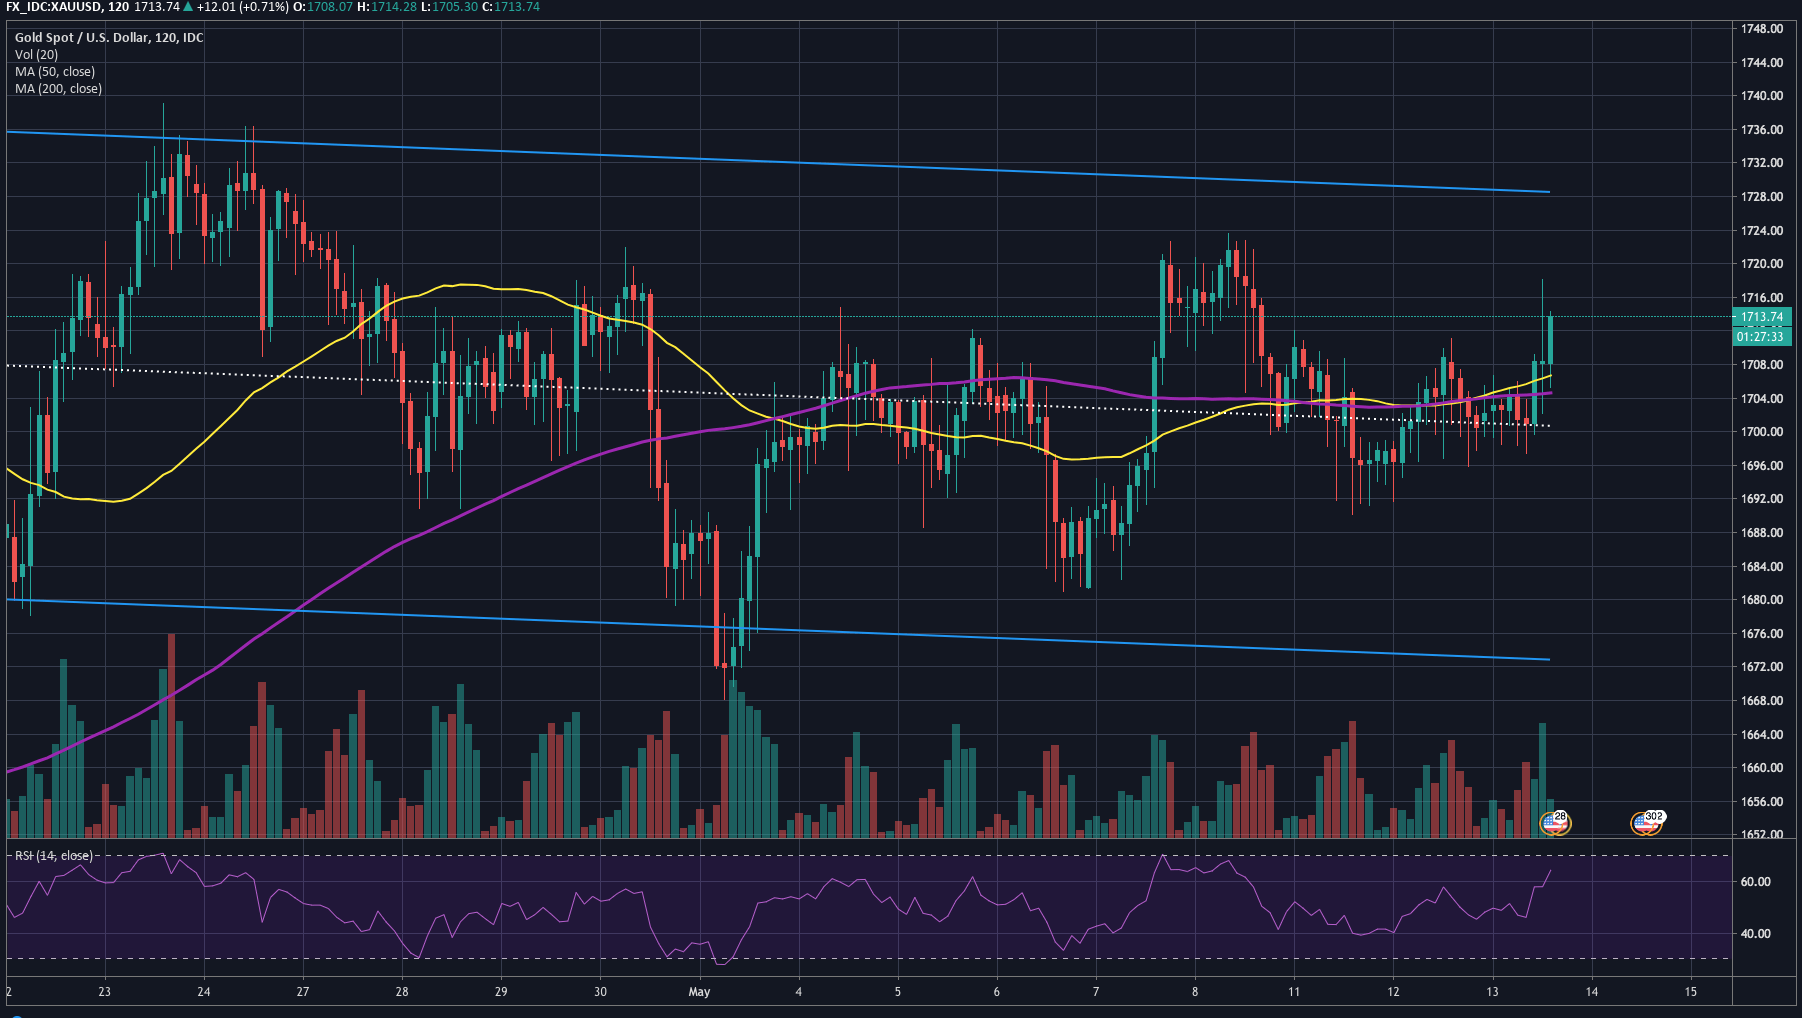
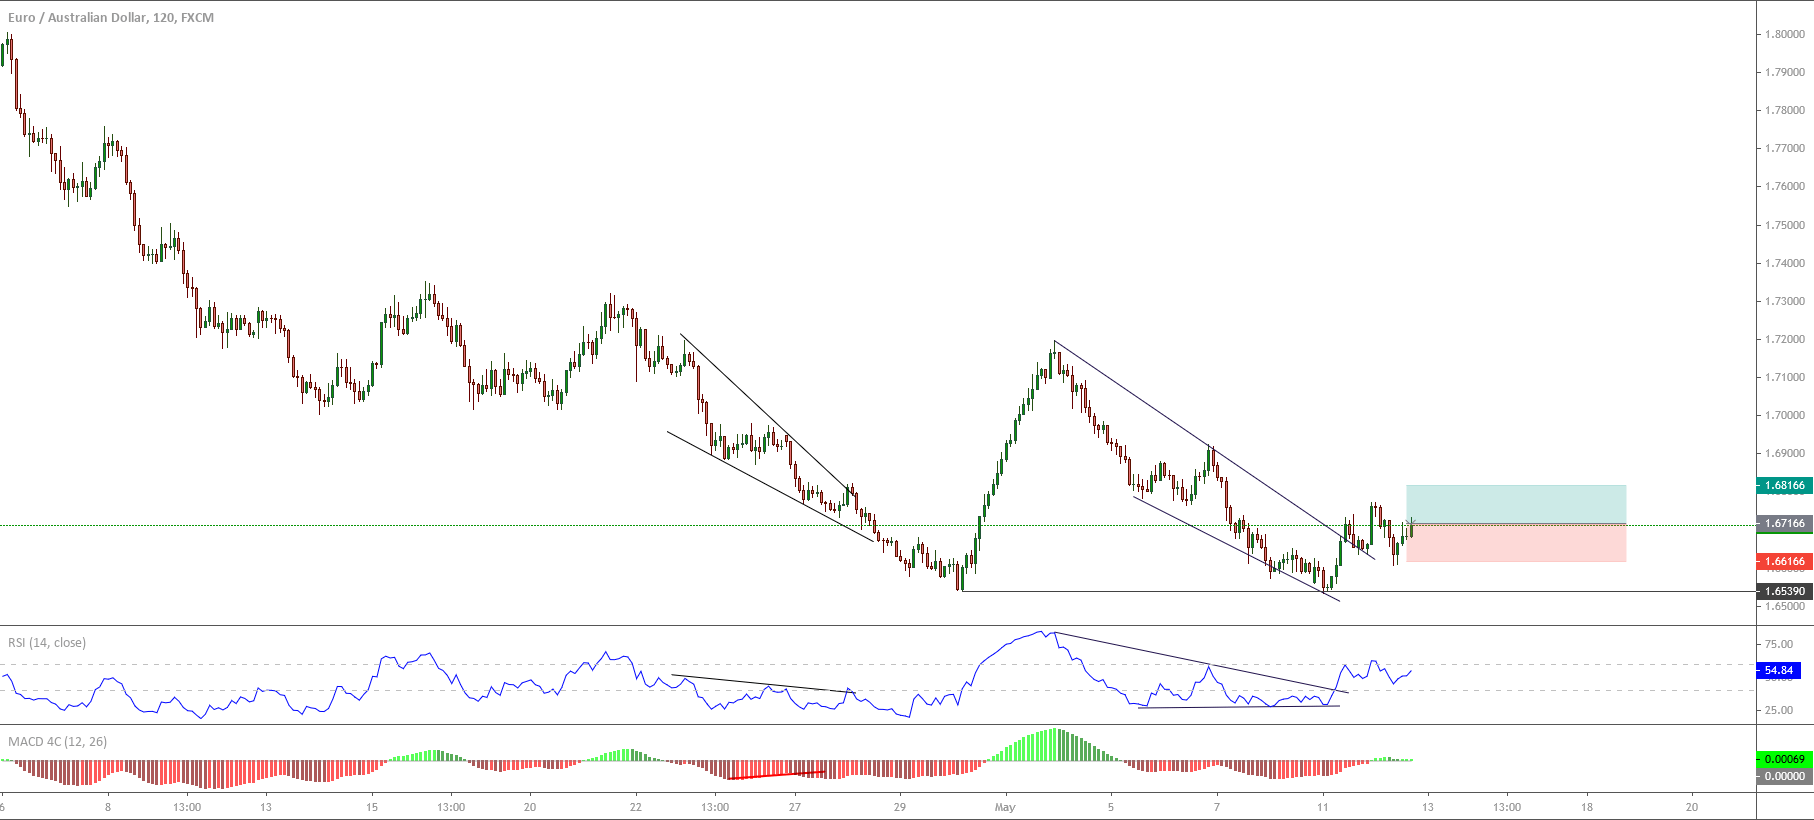
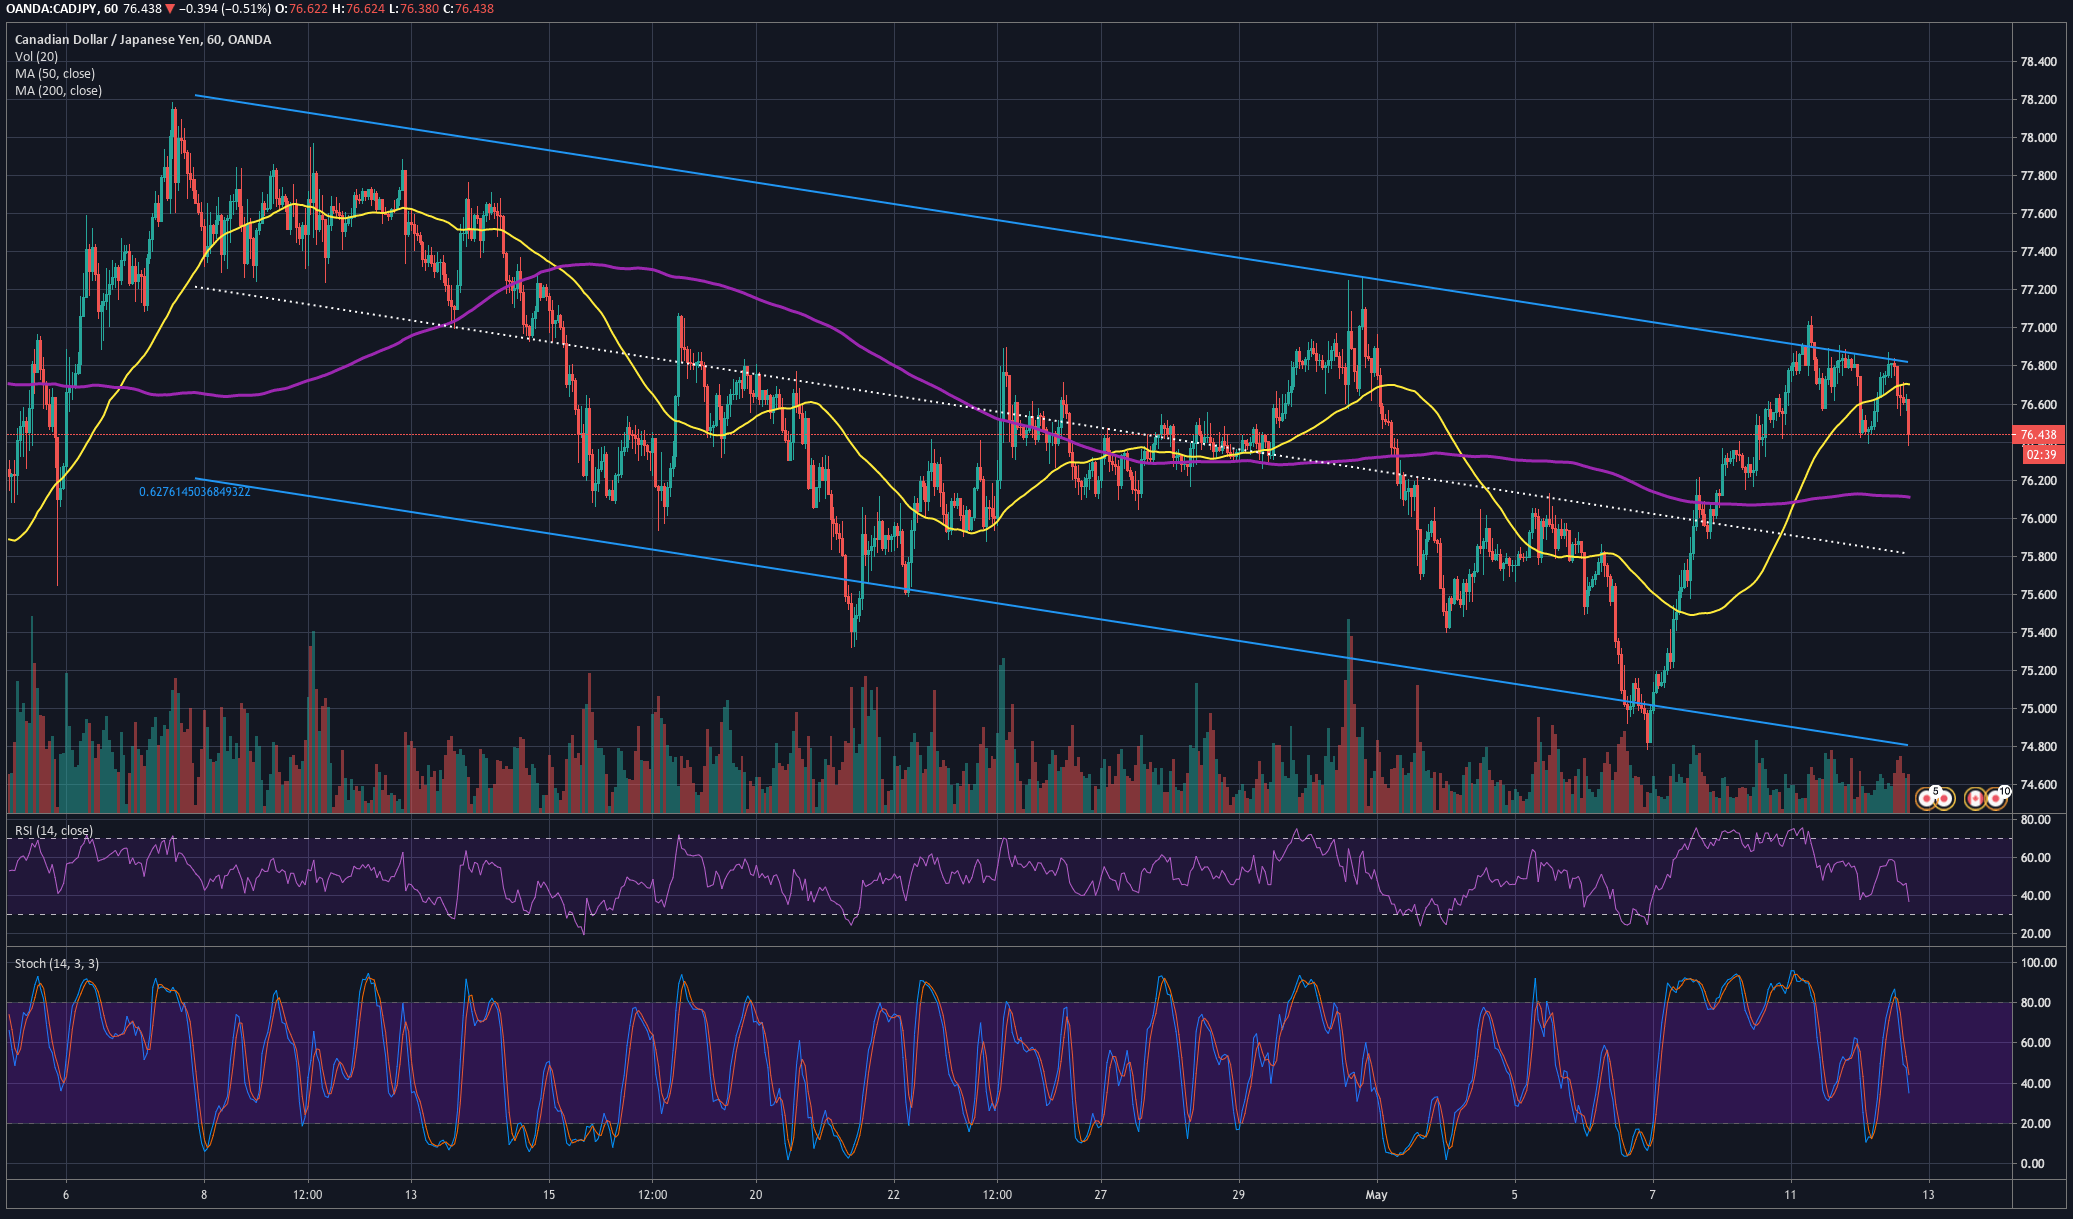
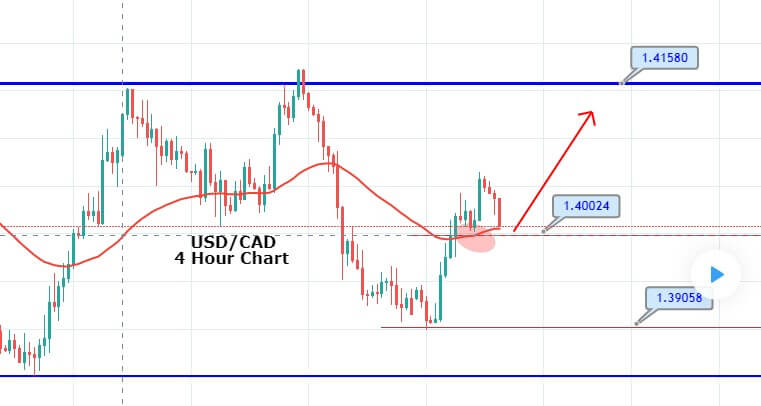
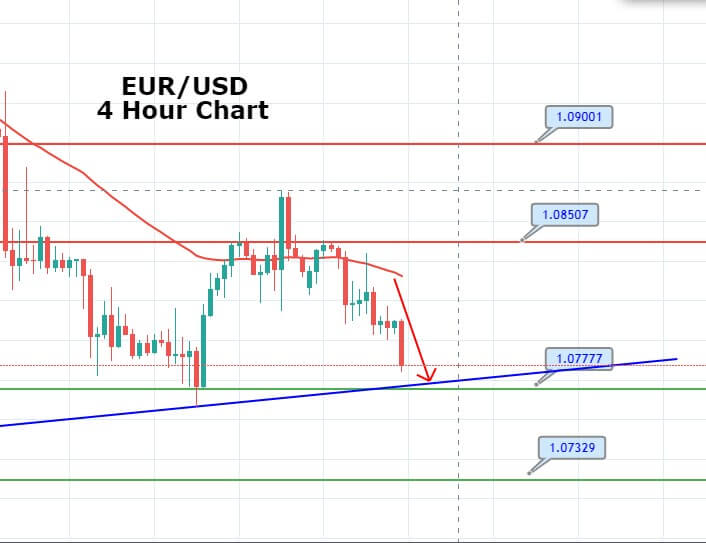
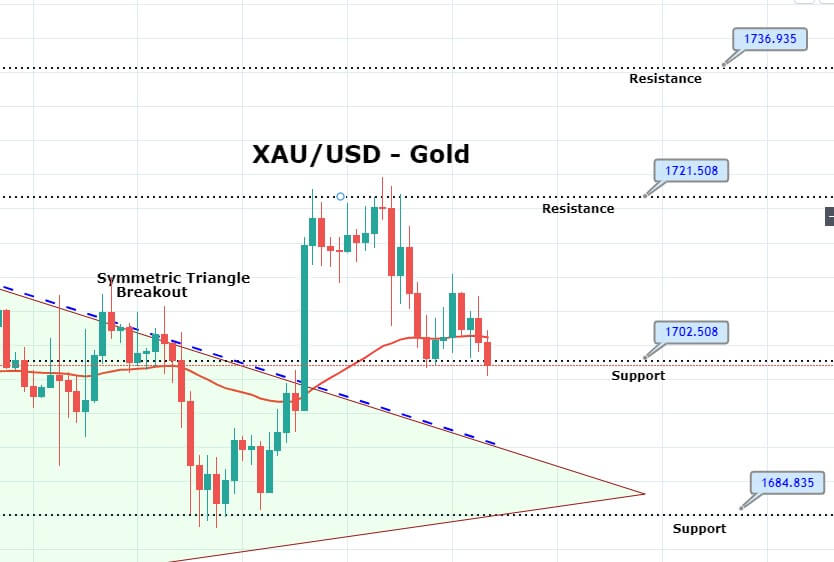
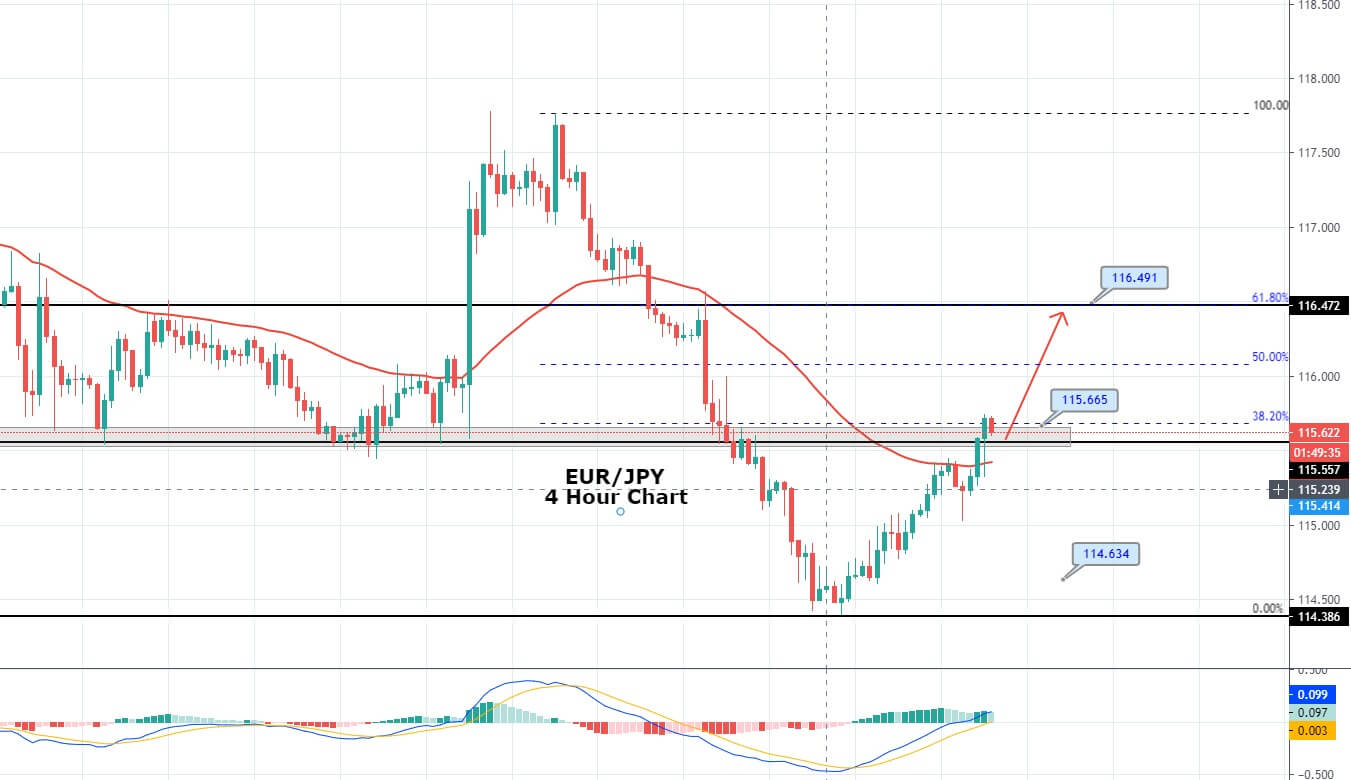
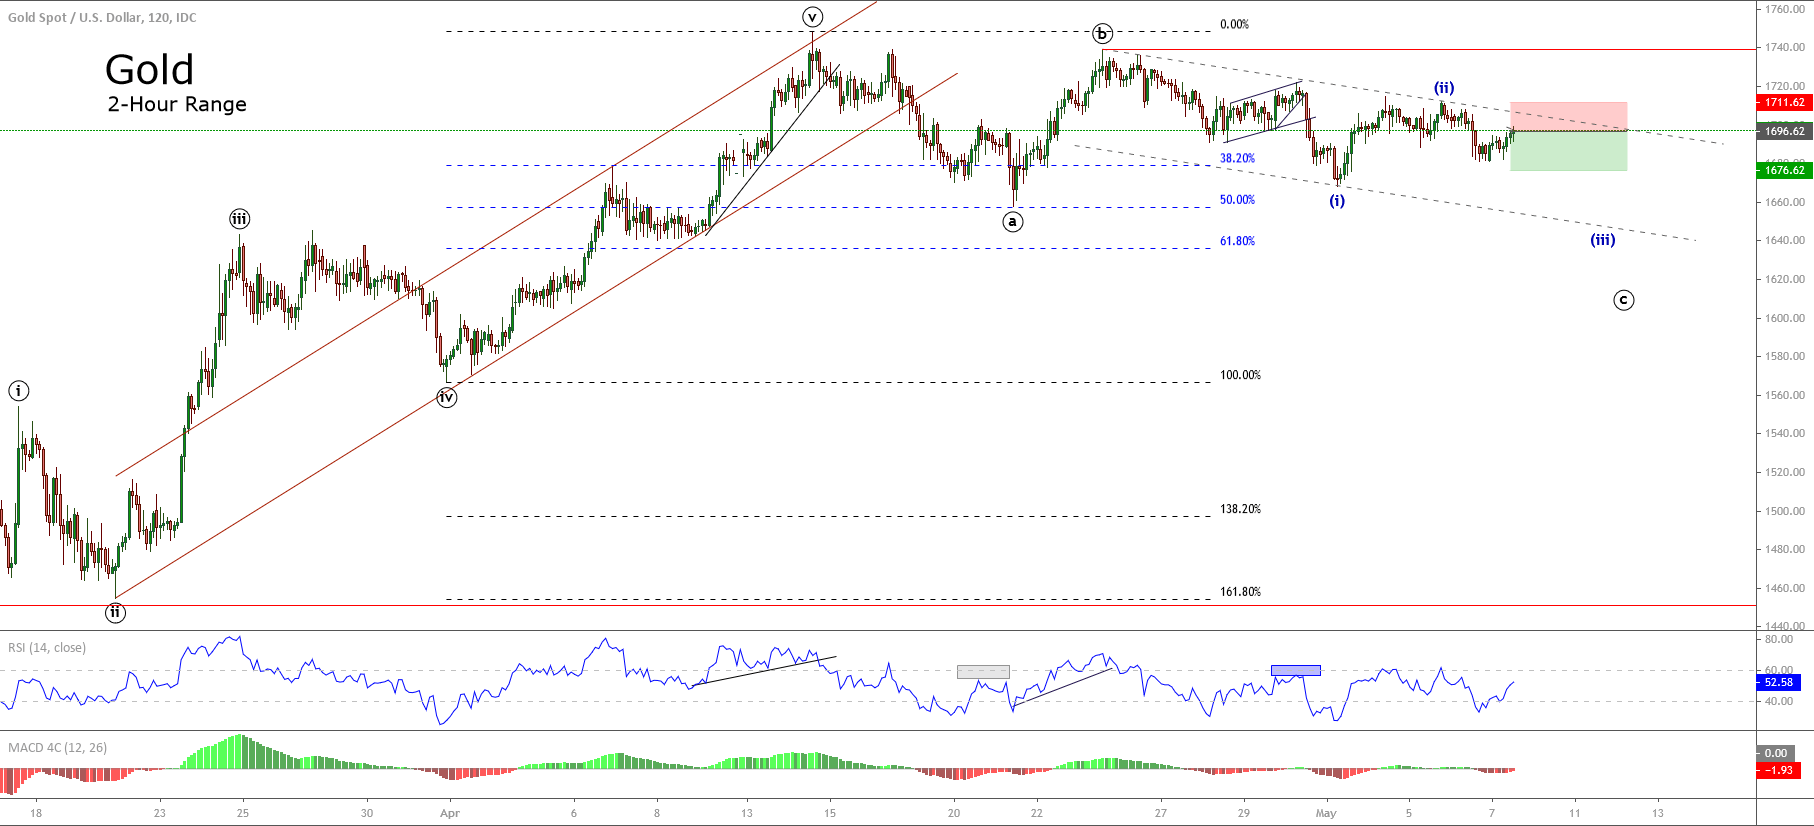
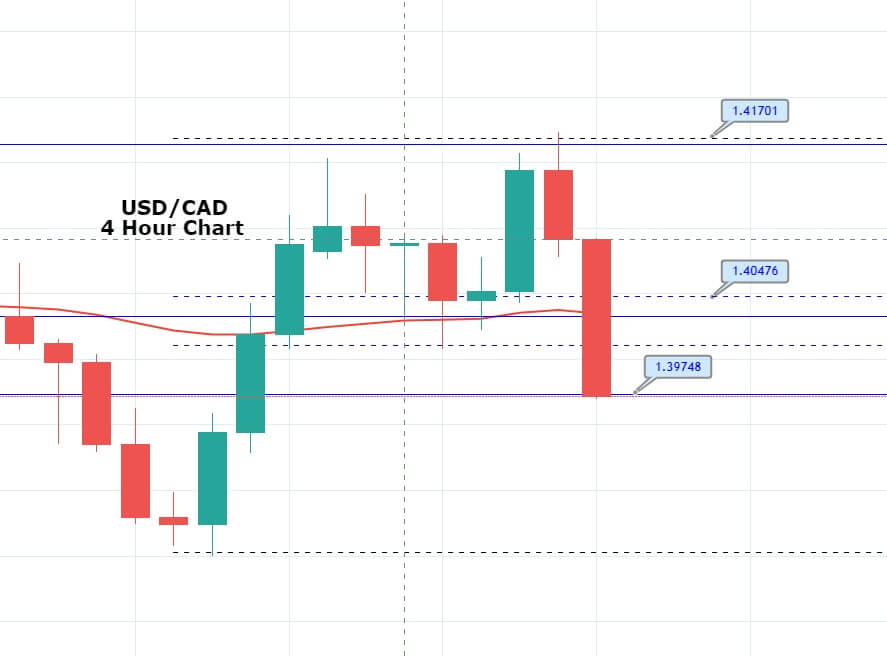
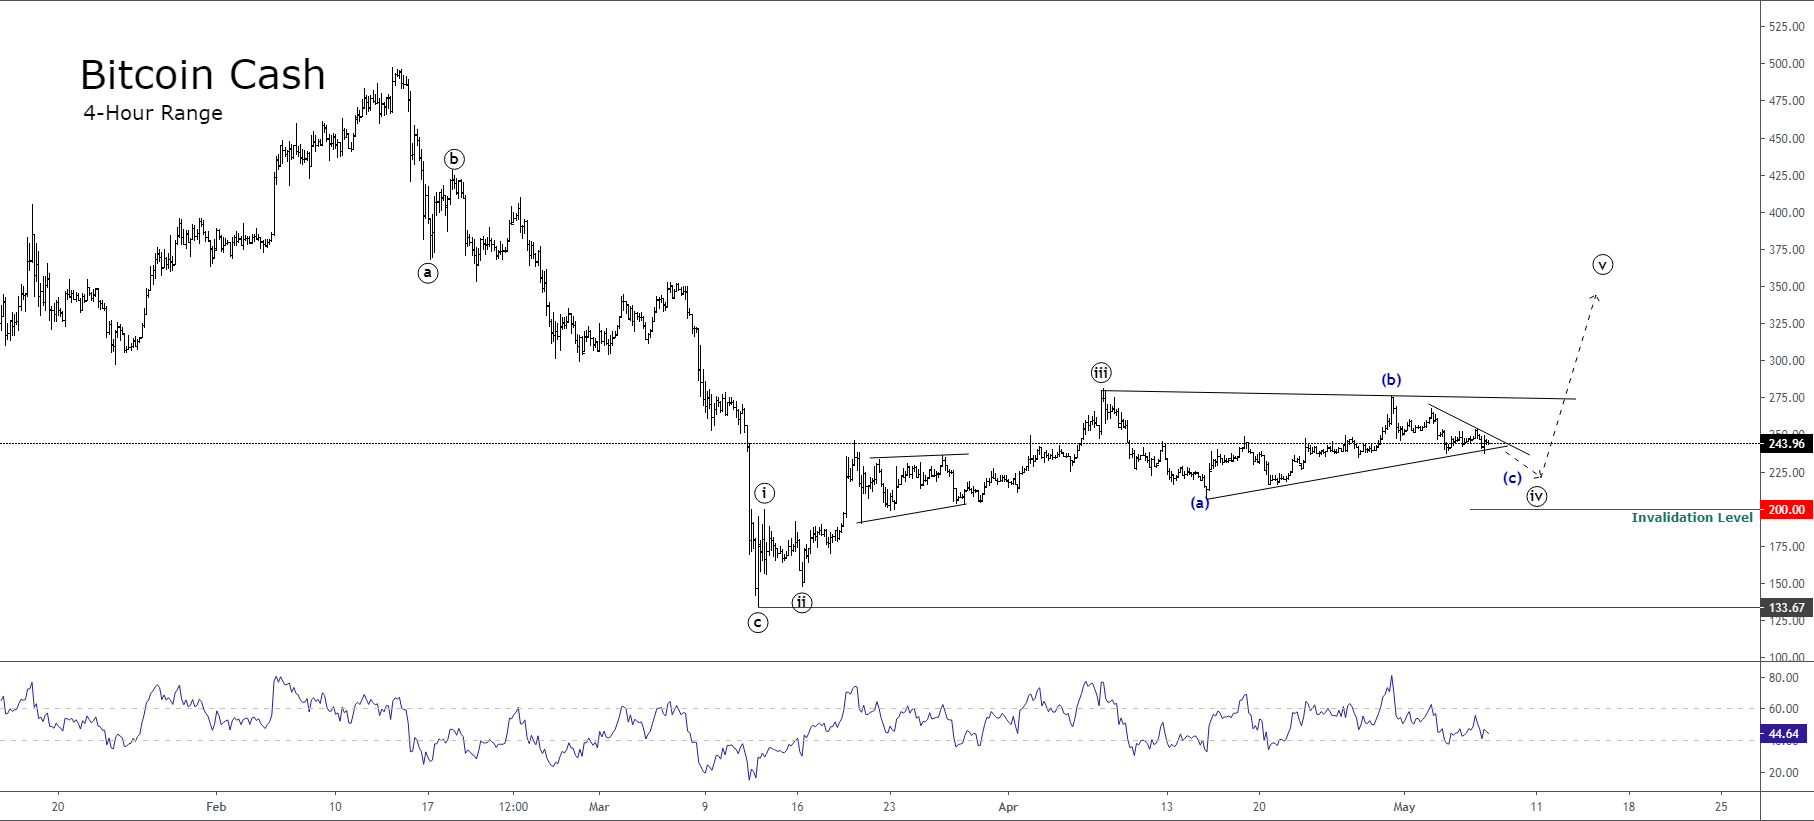
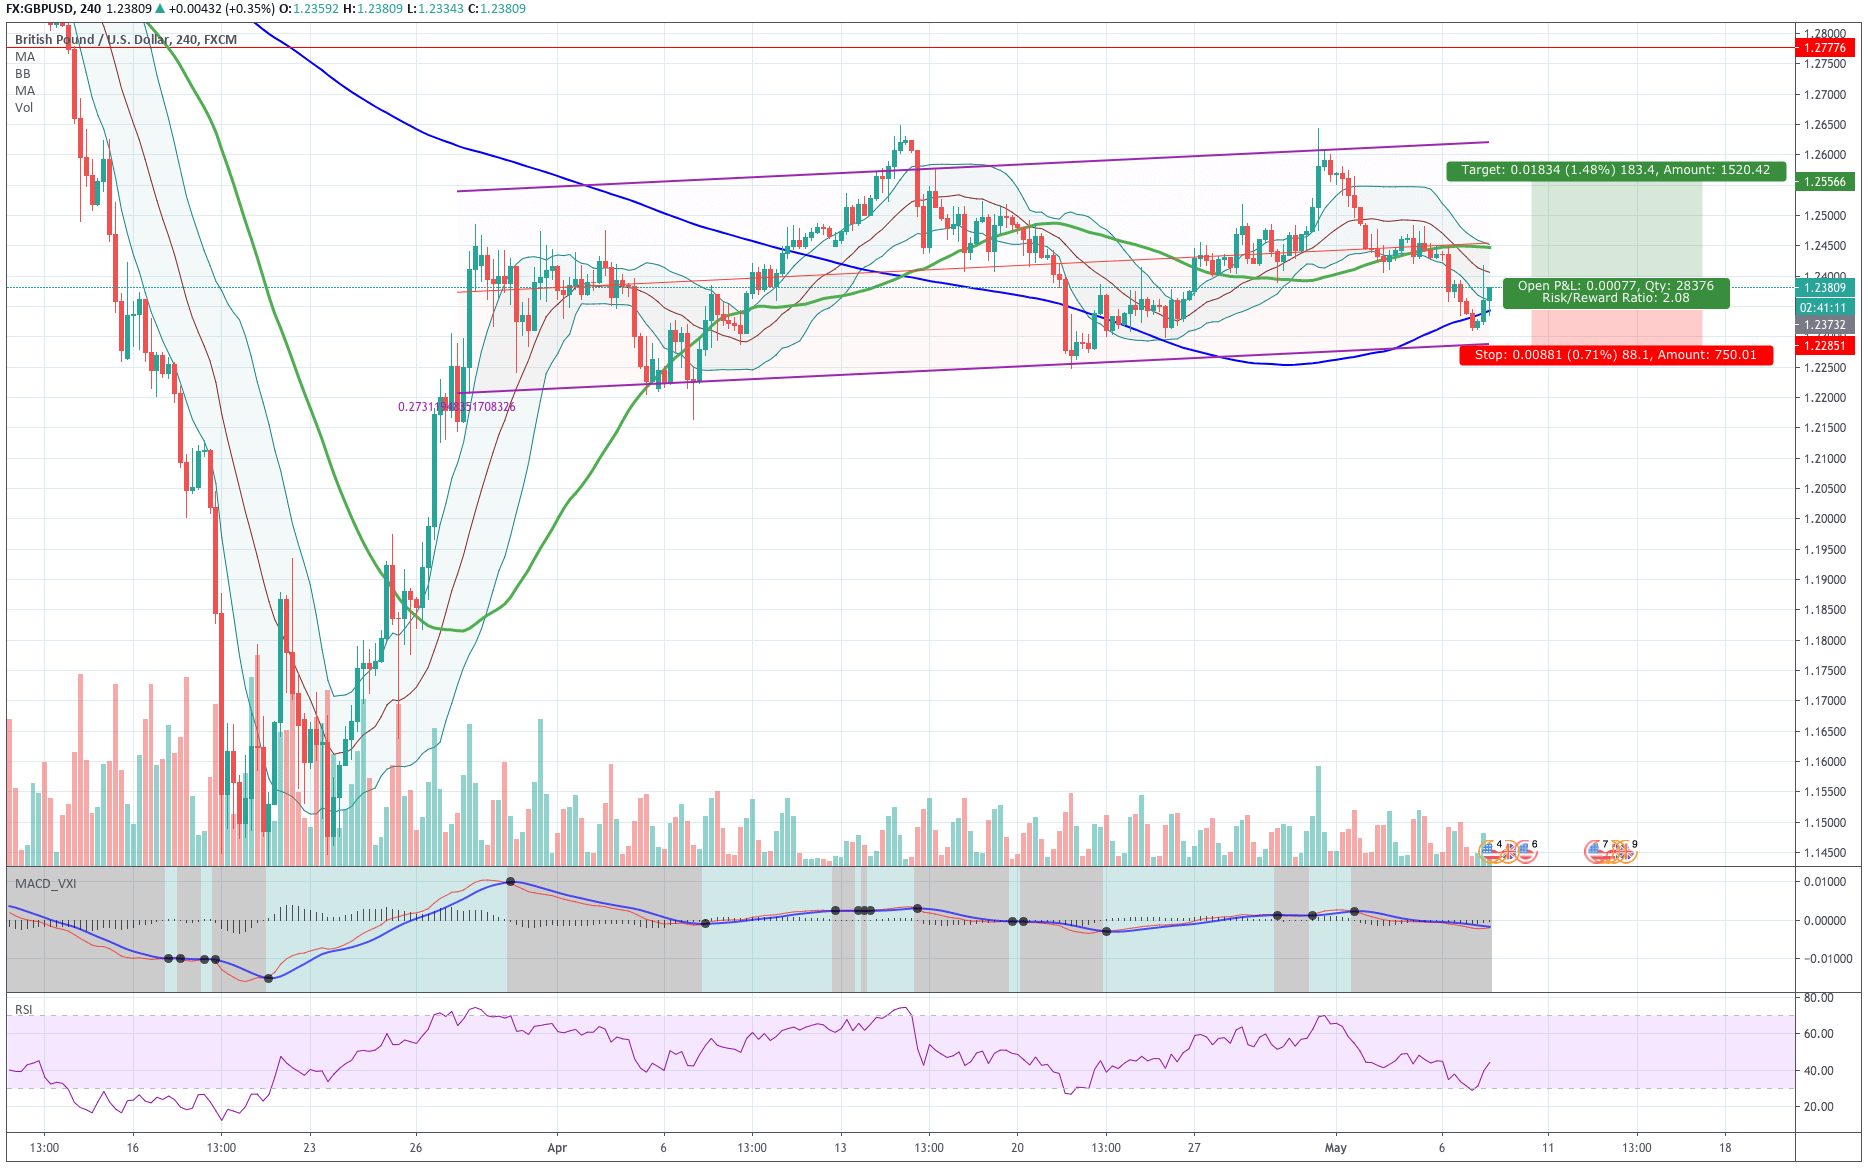
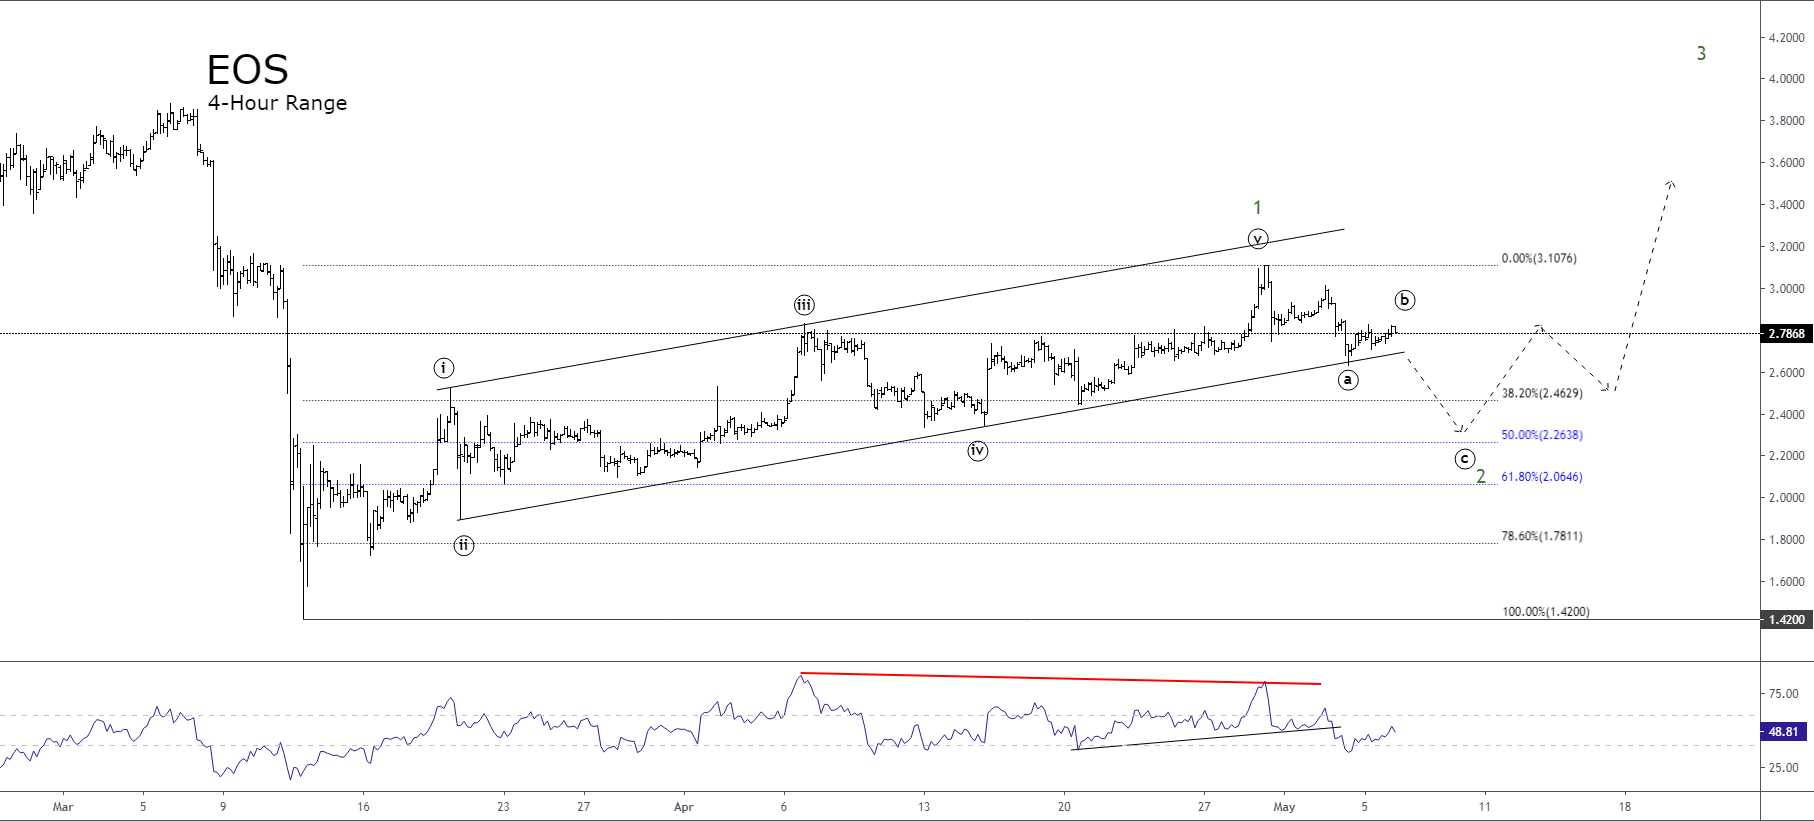

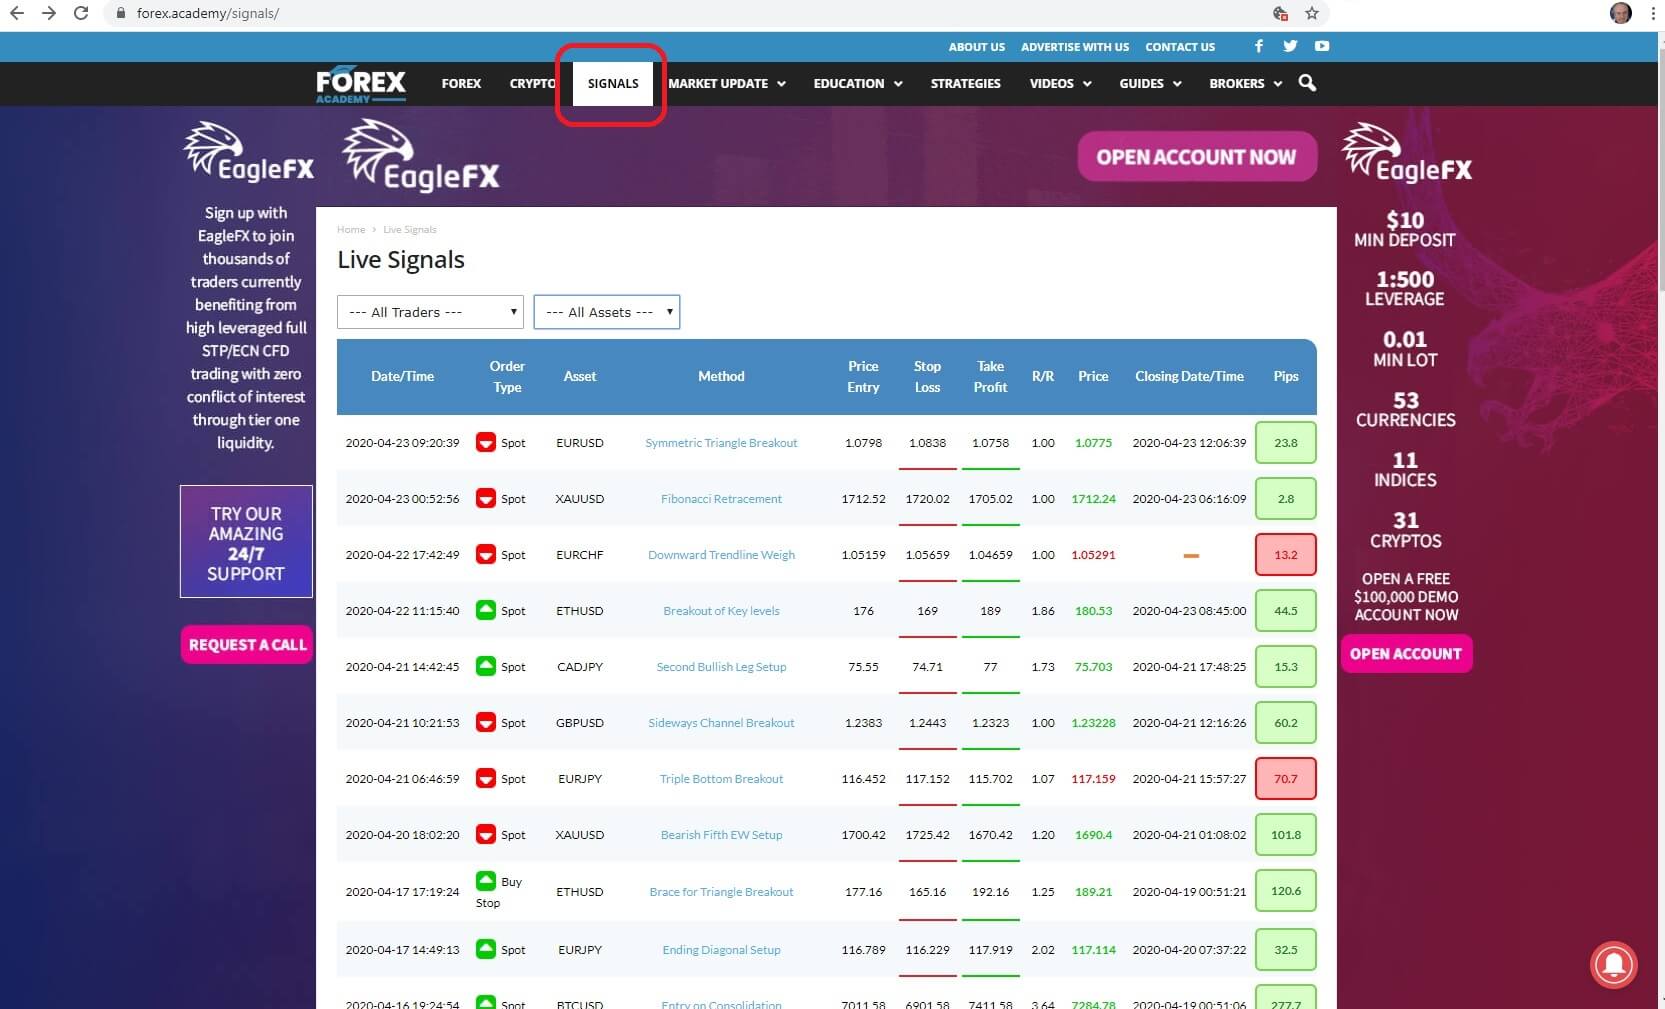
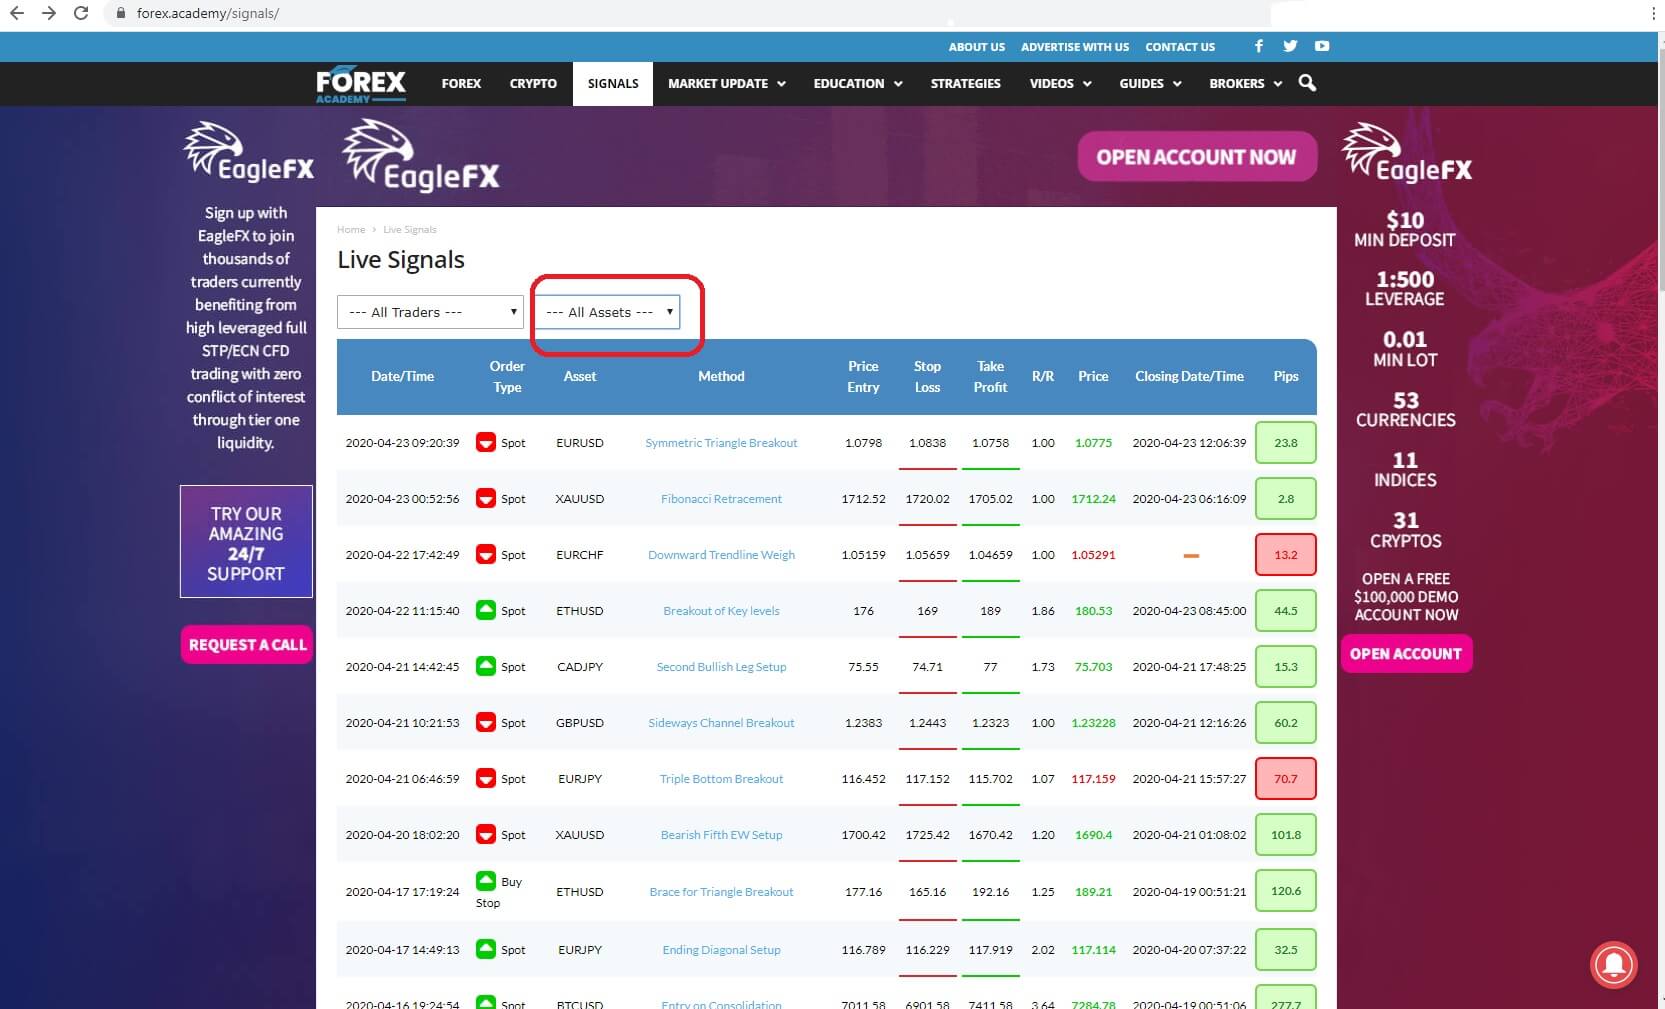
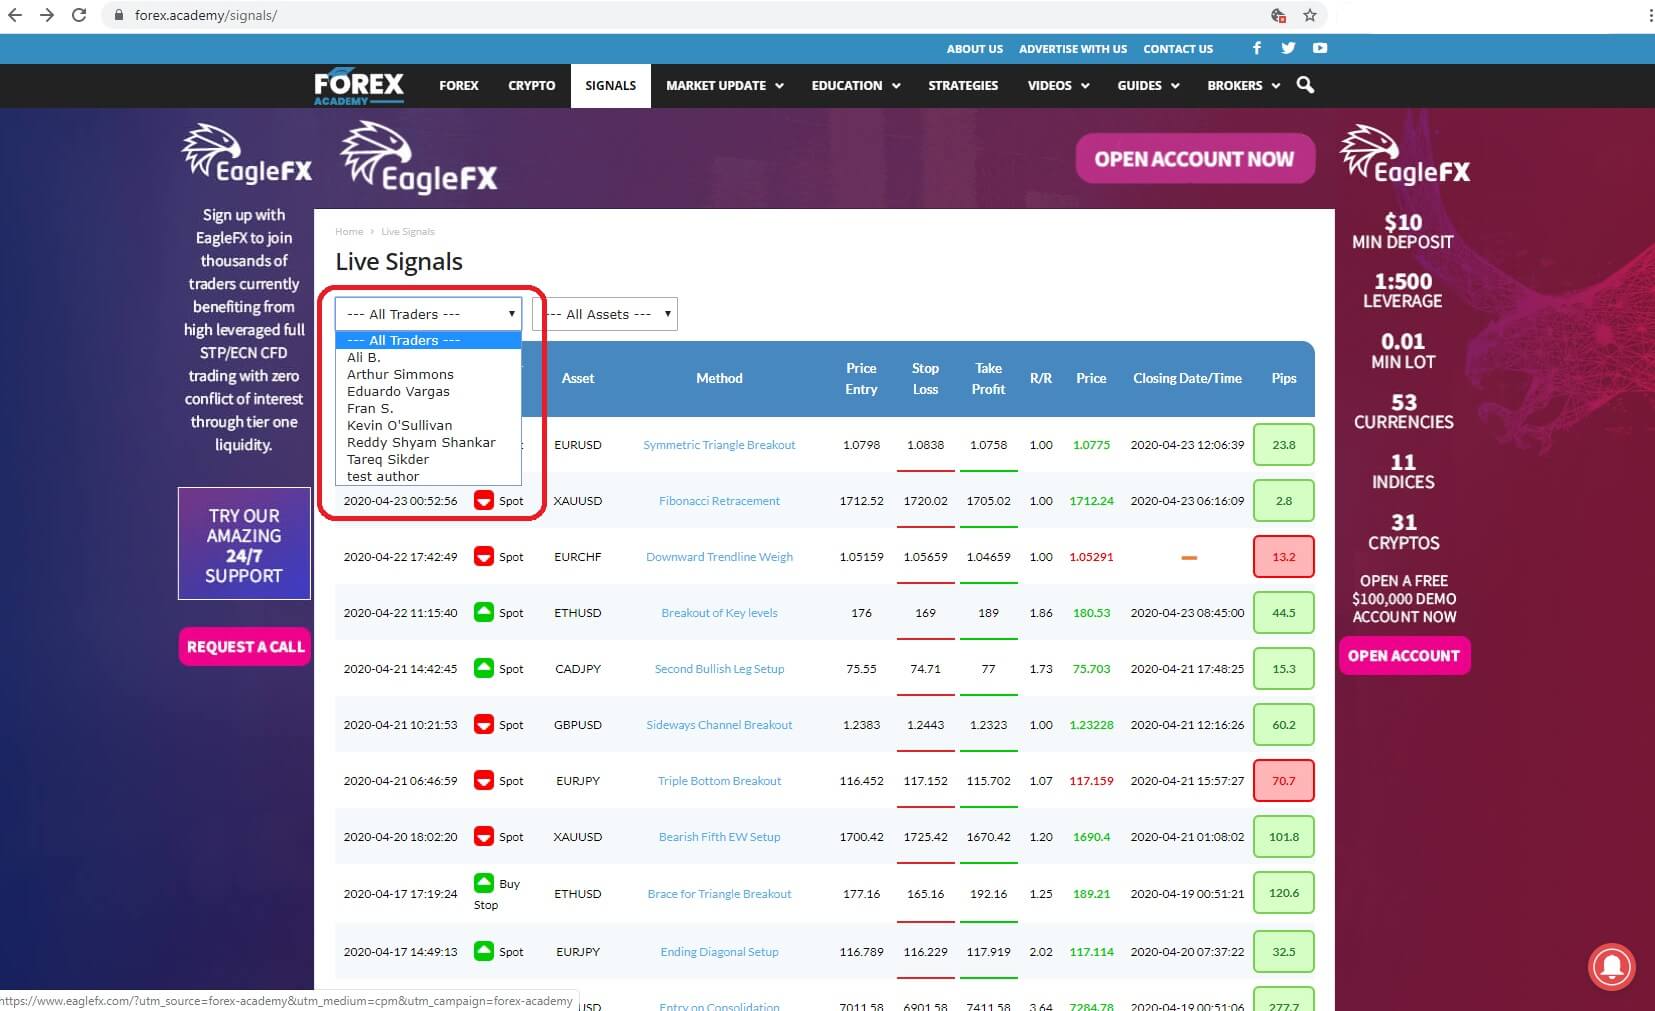

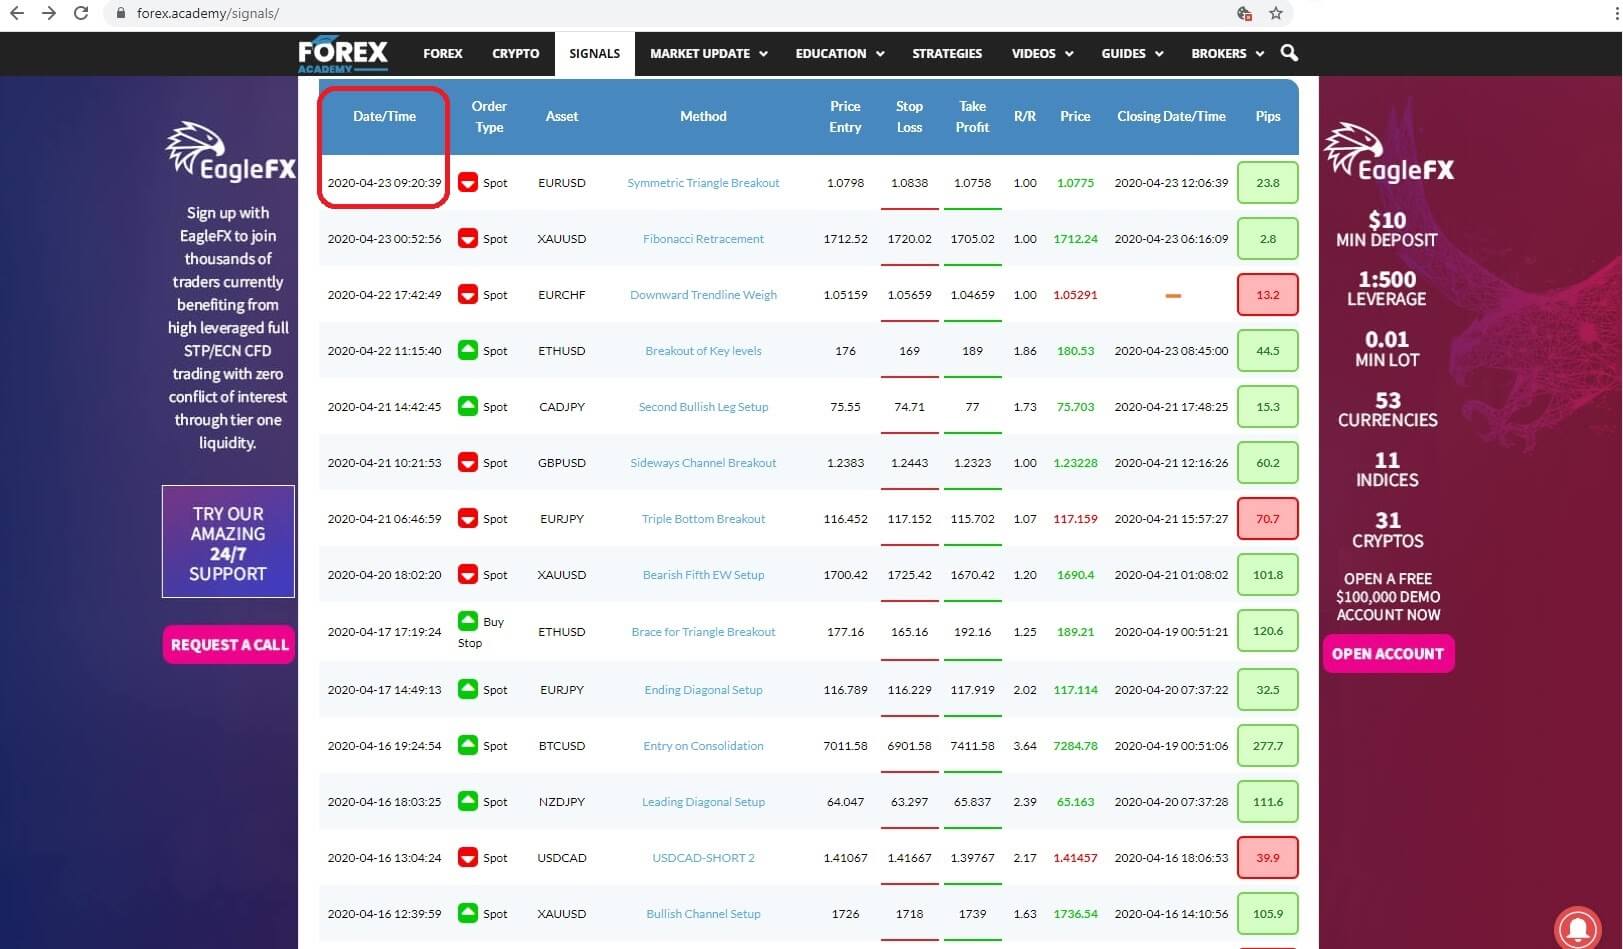 The date the trade was listed: Insert 2:
 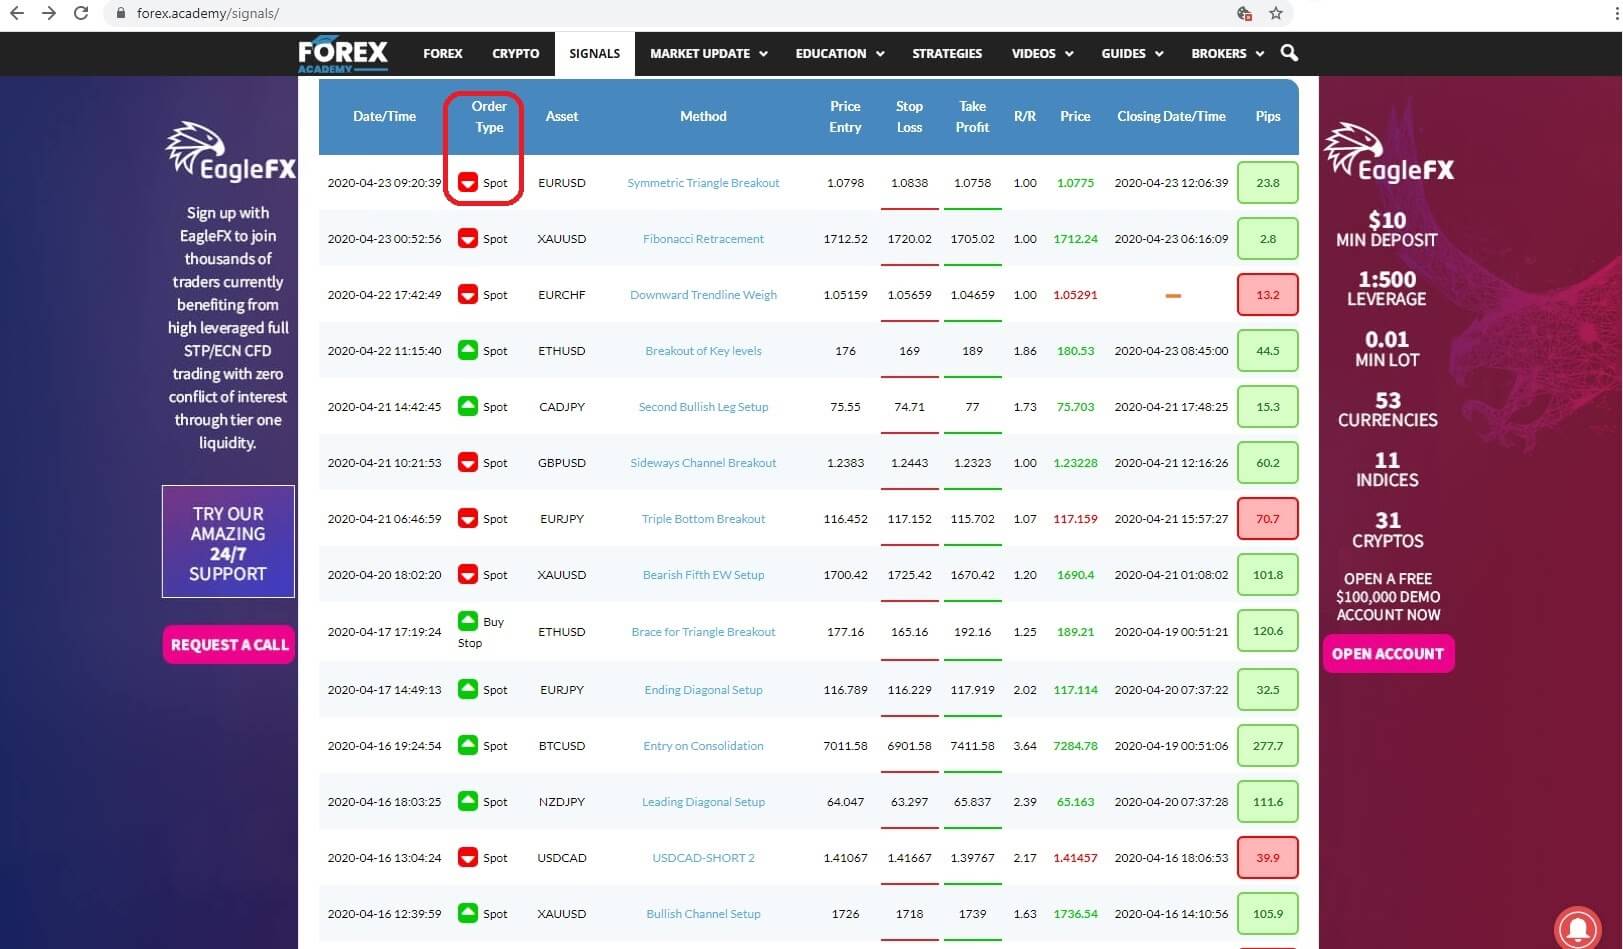 The type of order, which could be an instant execution, or spot trade, or a limit order including a buy limit or stop buy order or a sell limit or stop sell order, Insert 3:
 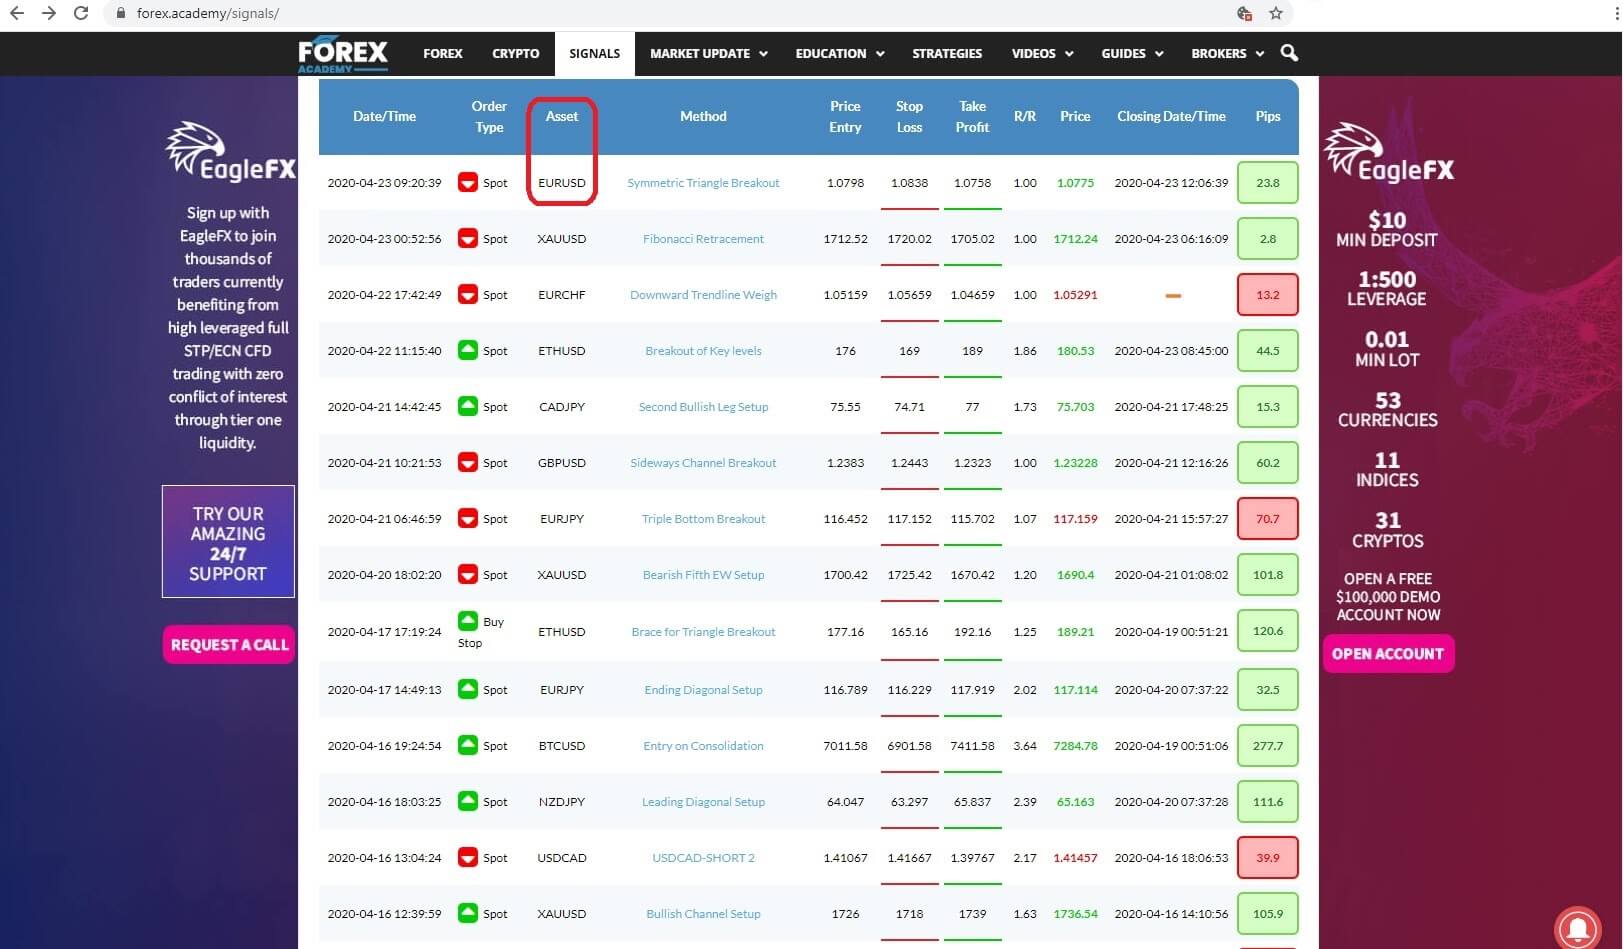 the type of asset, which could be a number of major or cross FX pairs and gold and bitcoin. Insert 4:
 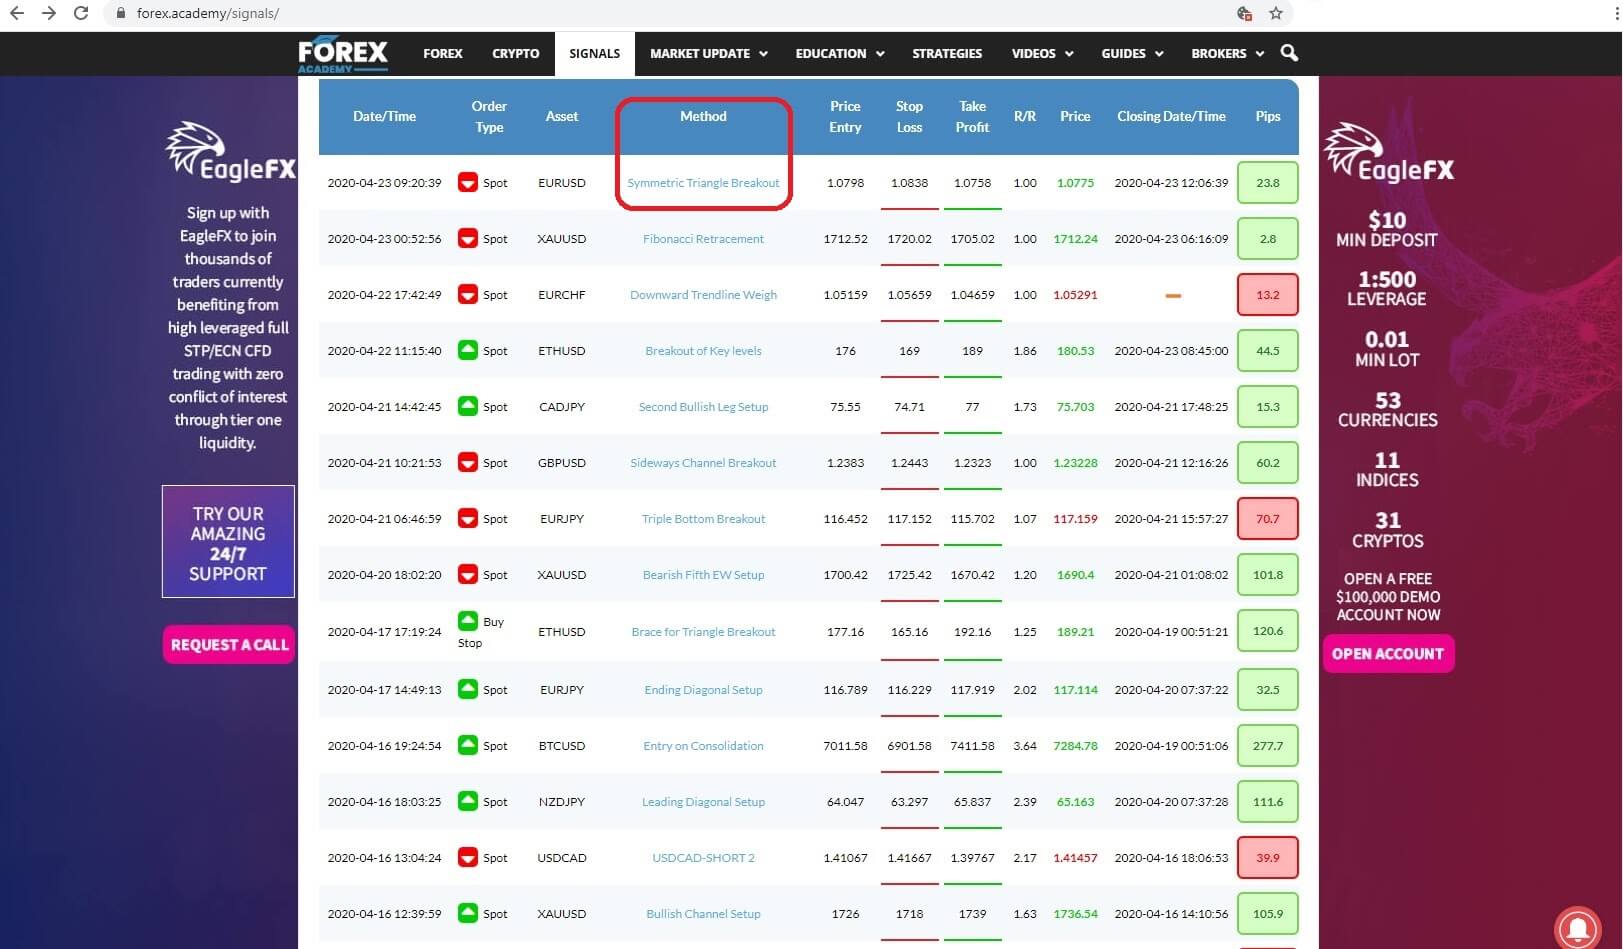 the method where the each trader gives a detailed analysis of the thinking behind each trade, which, incidentally, most other signal providers do not offer, and where we will come back later in this video to take a more detailed look, Insert 5:
 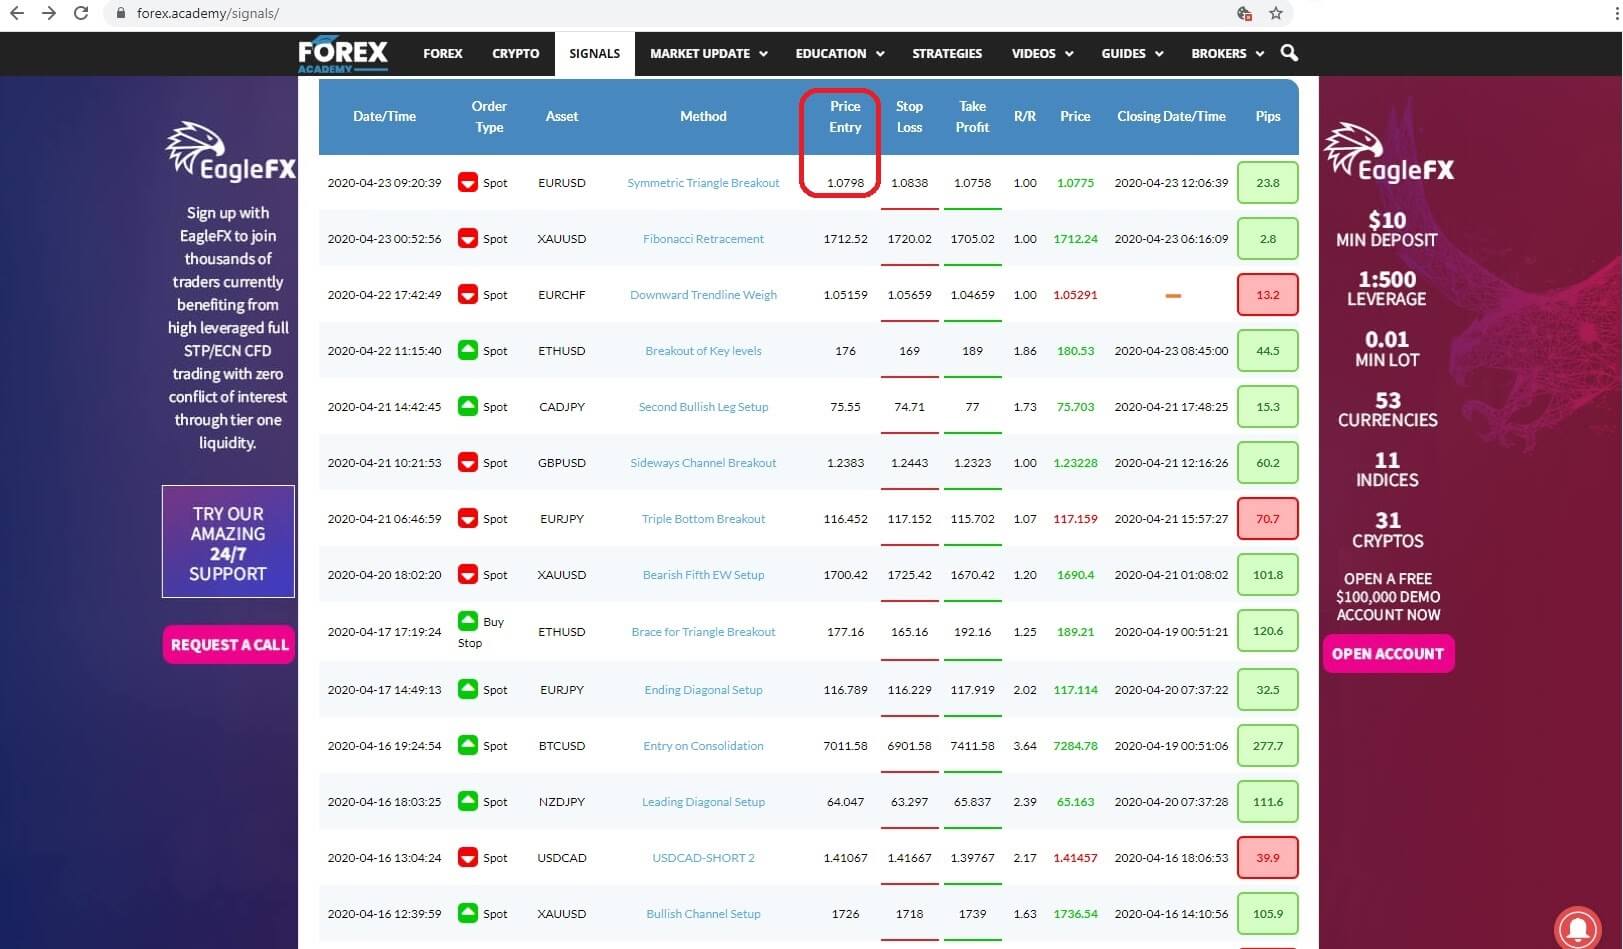 the entry price for the trade, Insert 6:
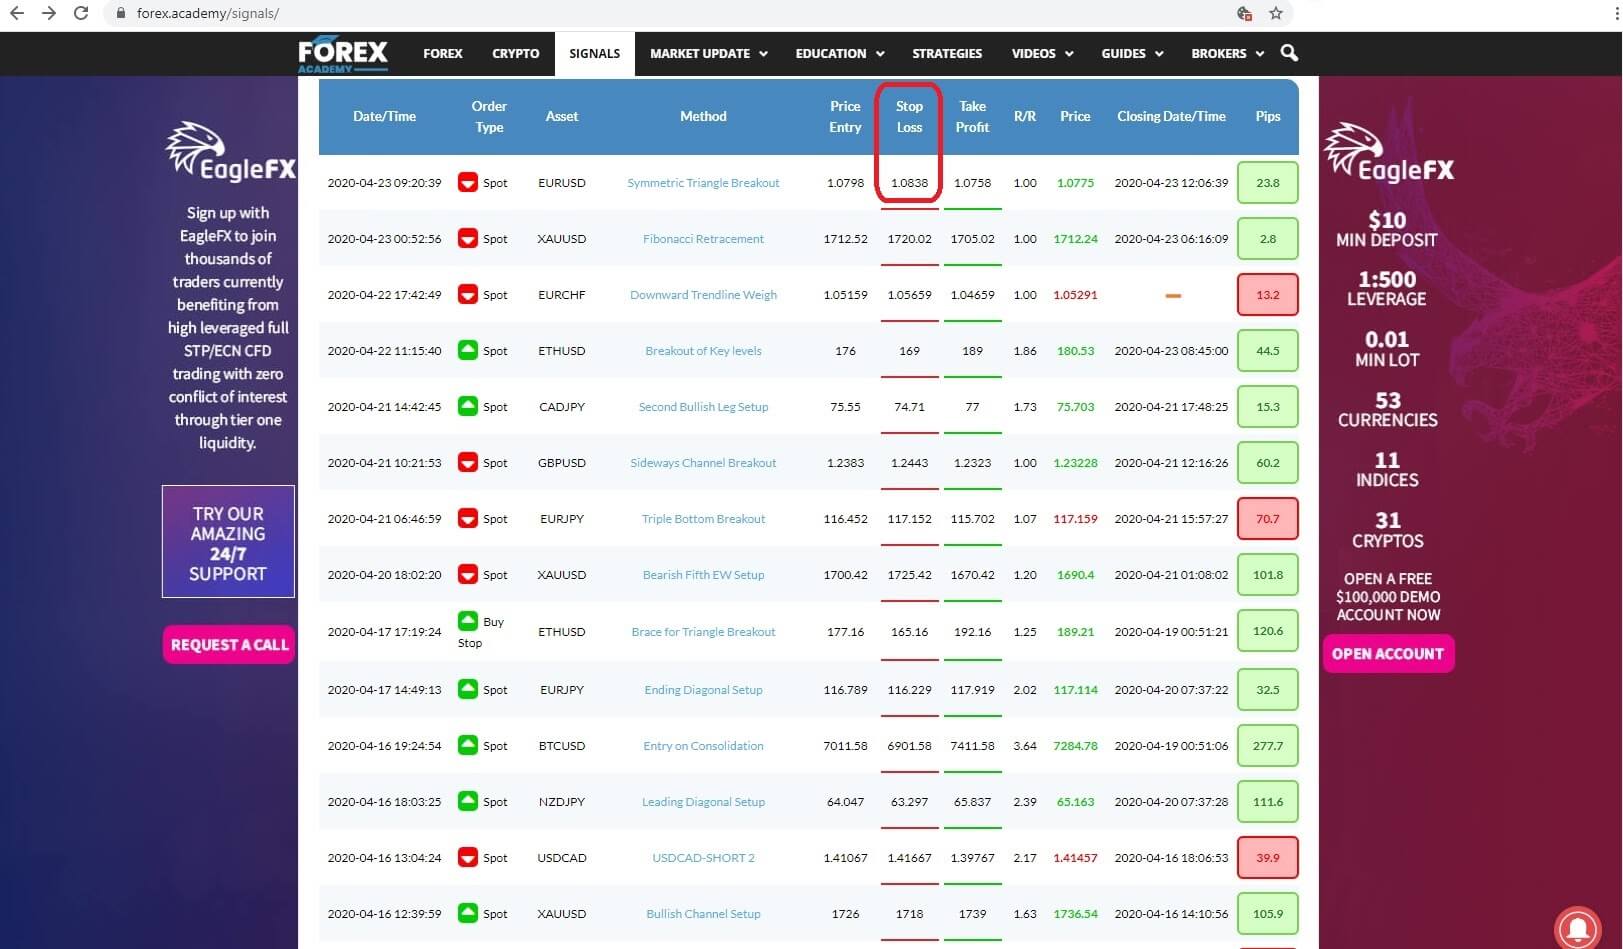 the stop loss for the trade, Insert 7 :
 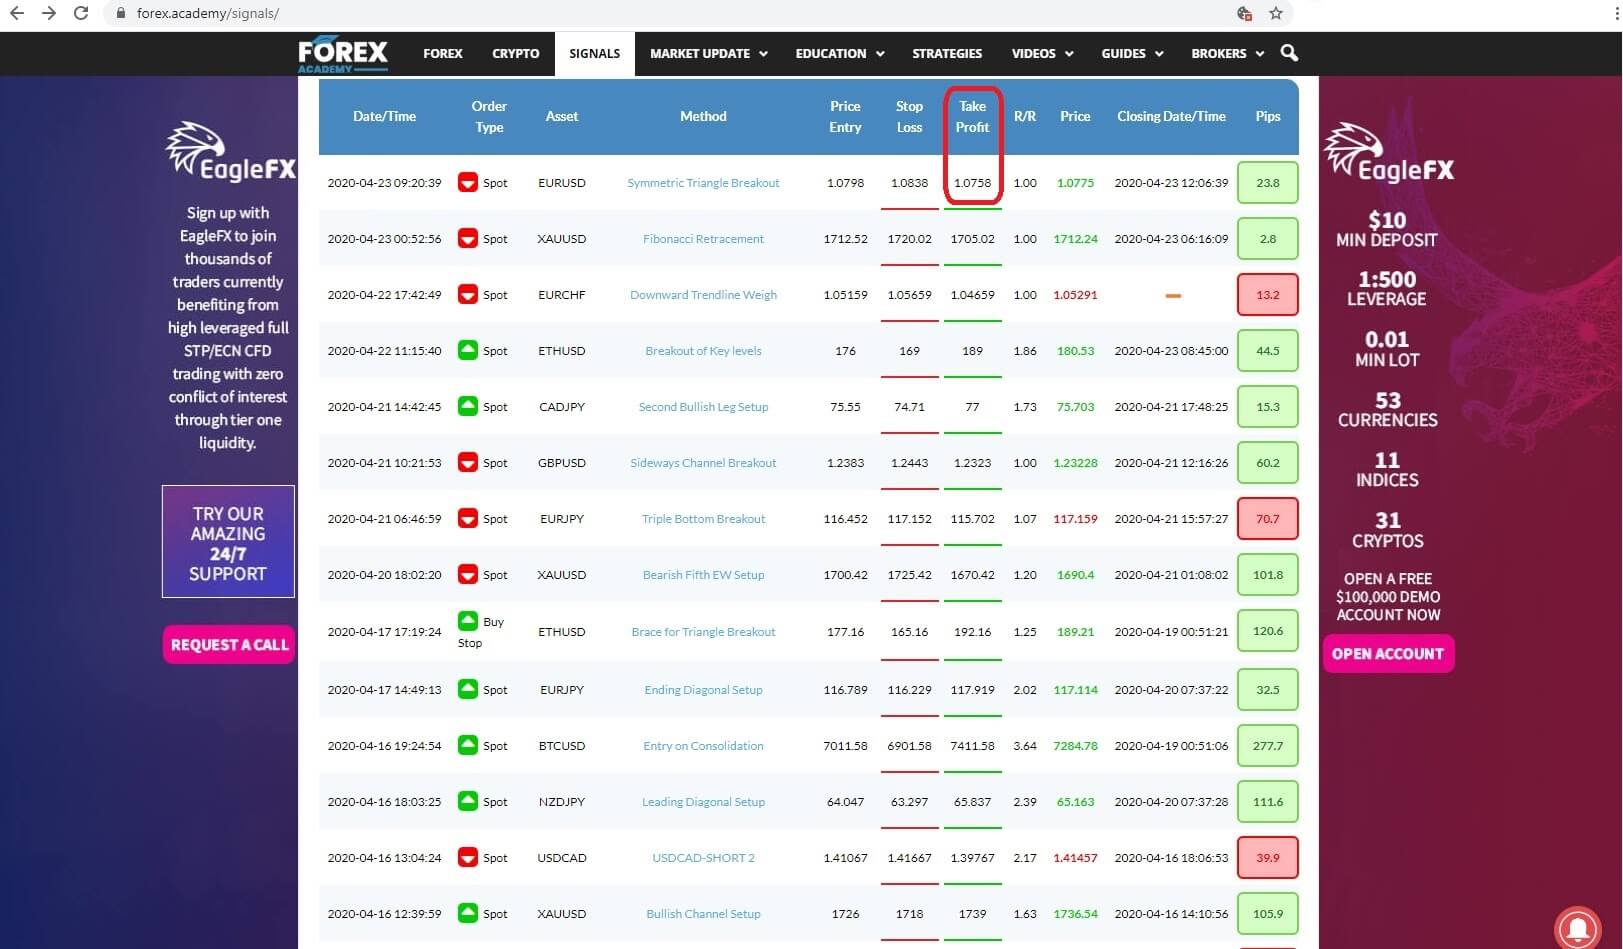 the take profit level, Insert 8,
 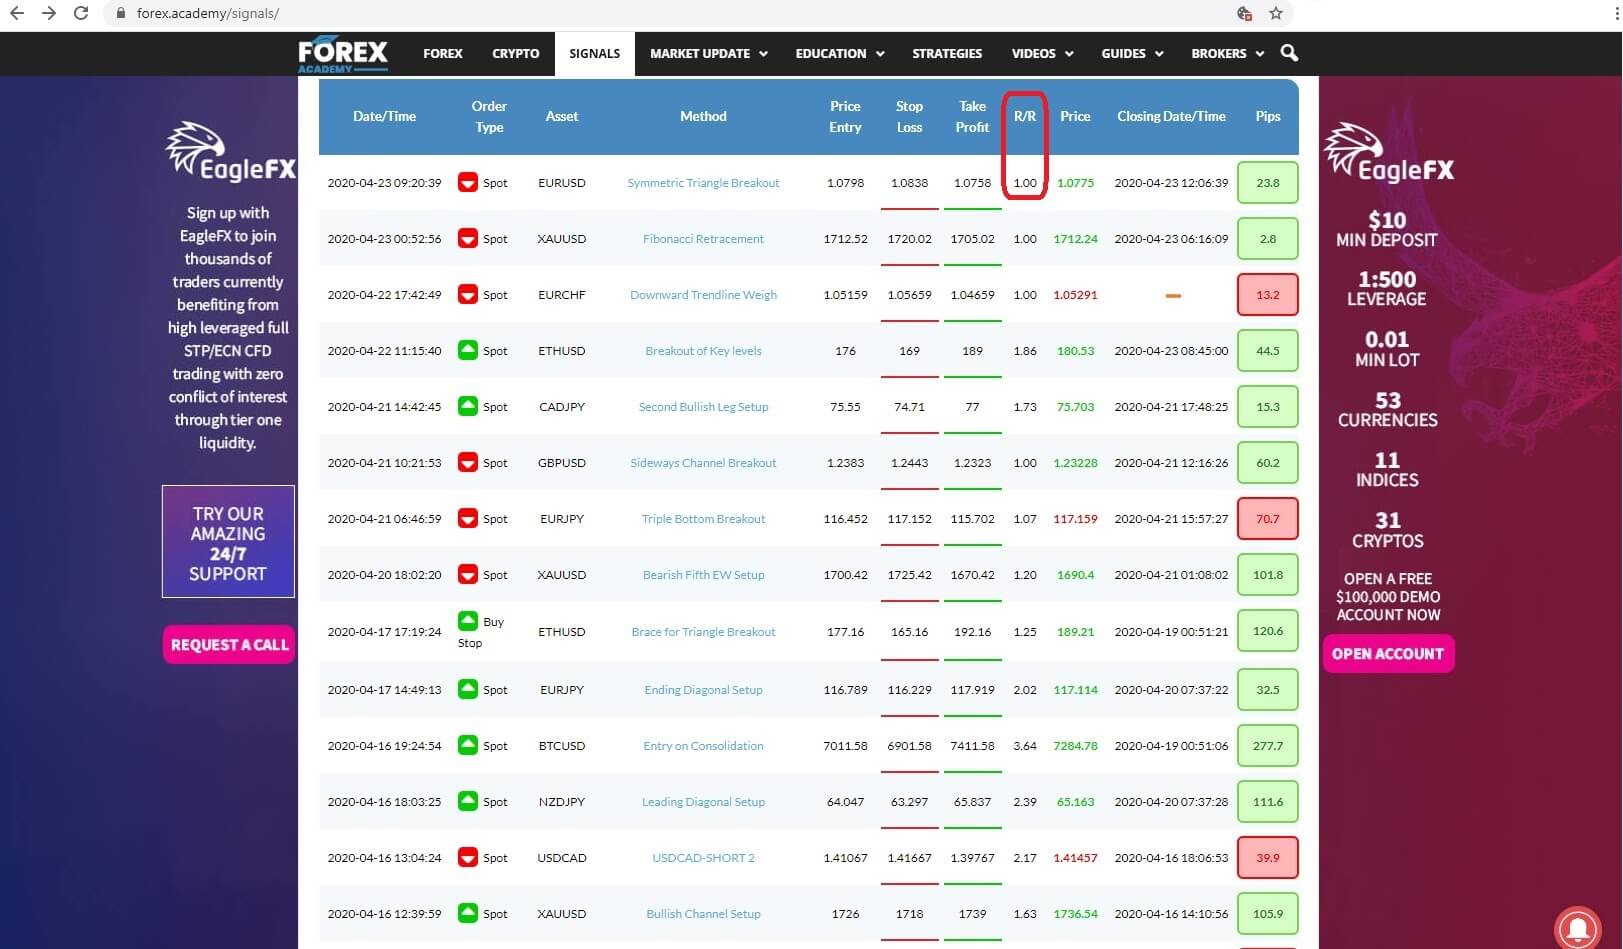 The risk to reward level, Insert 9:
  the price level at close; Insert 10:
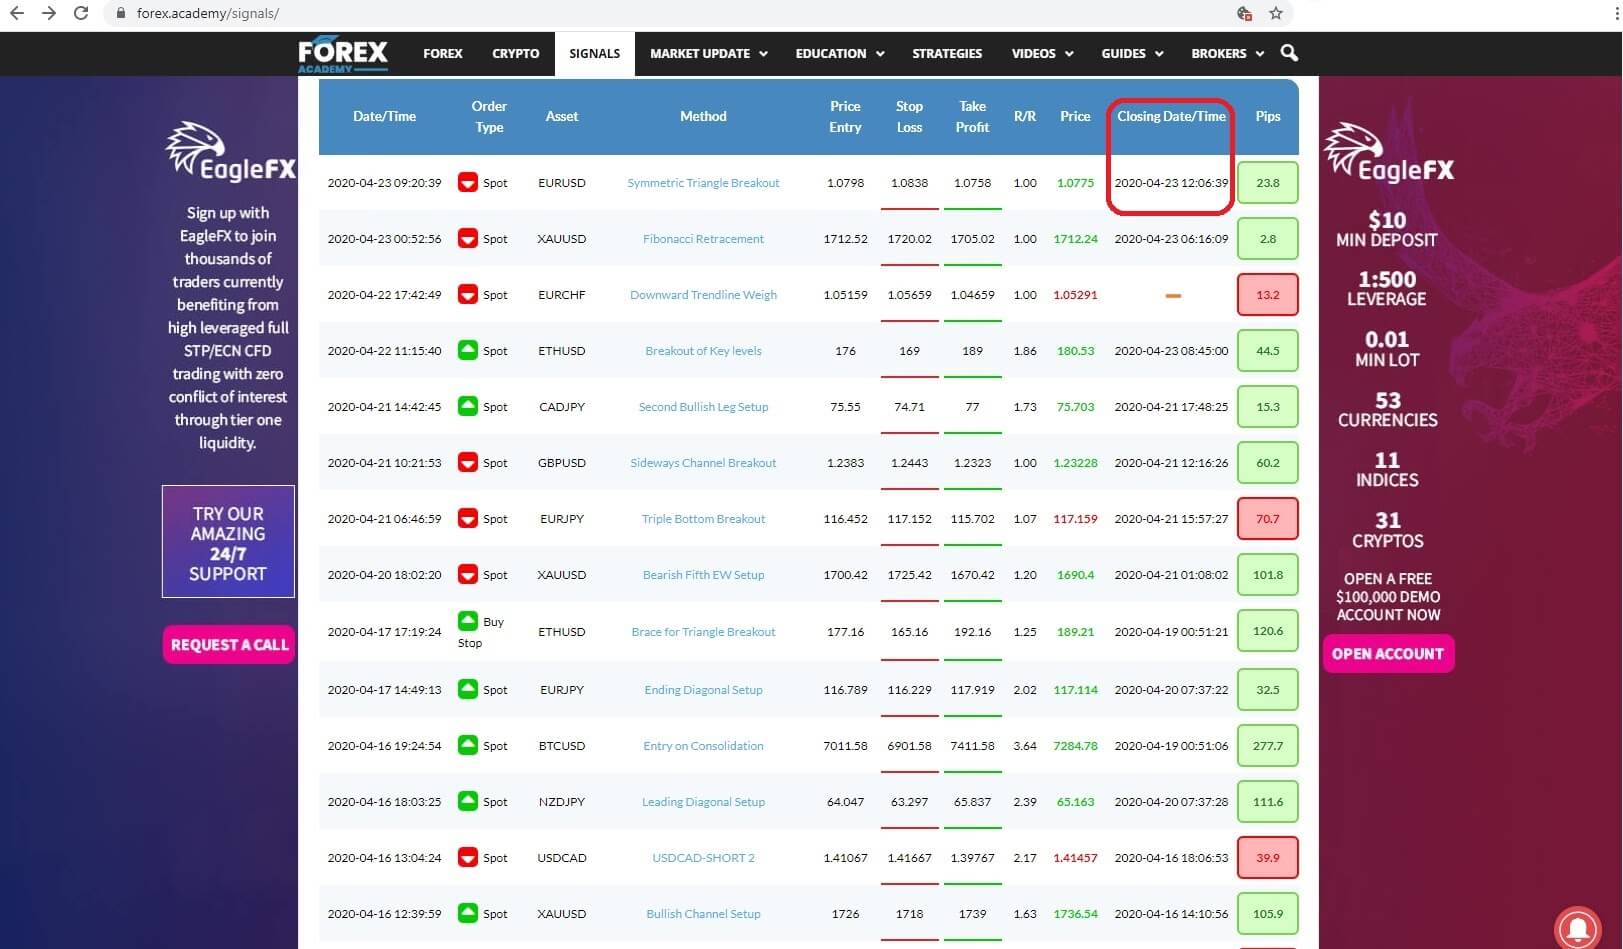
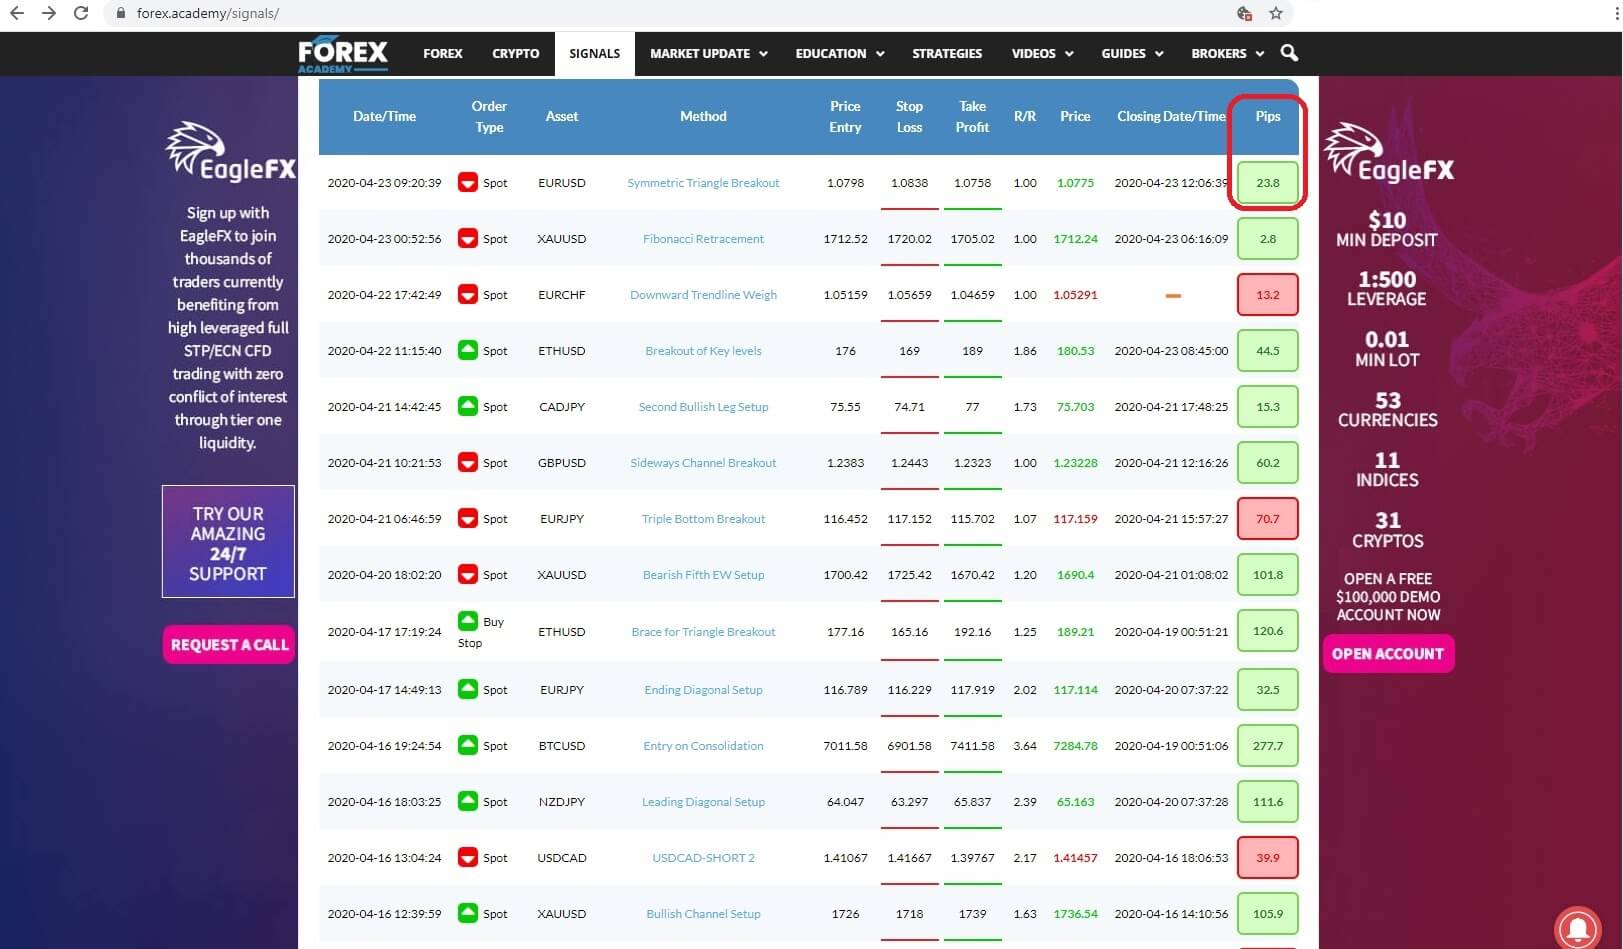 the amount of pips won or lost or in the event of an open trade the fluctuating level of pips in play.