Categories
Forex Signals

Gold on a Bullish Run Amid Safe Haven Appeal – Update on Signal! 

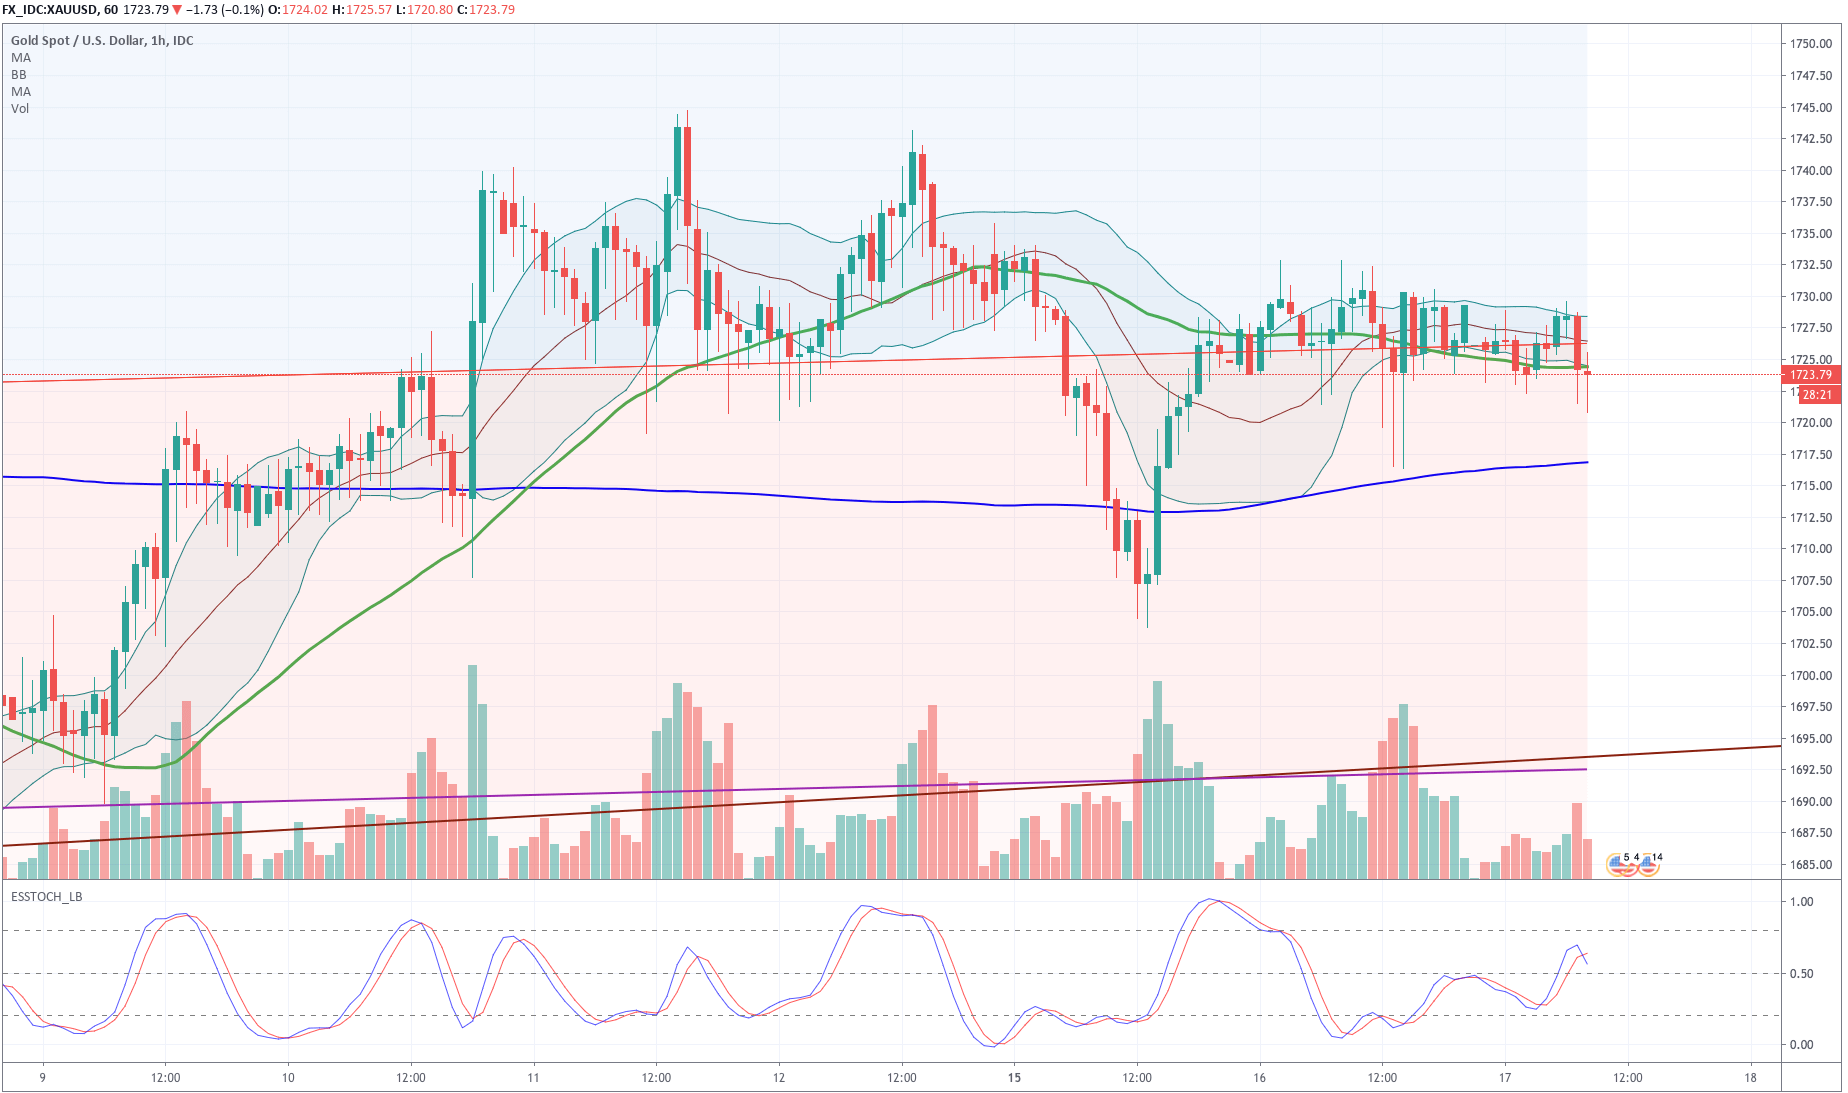
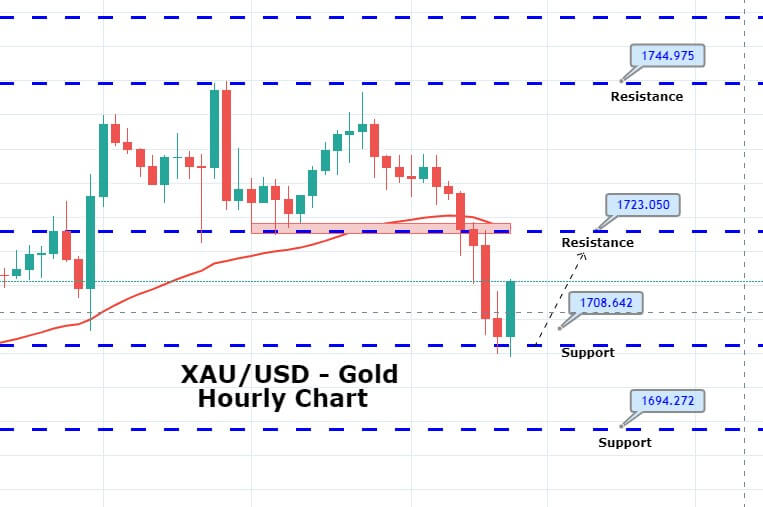
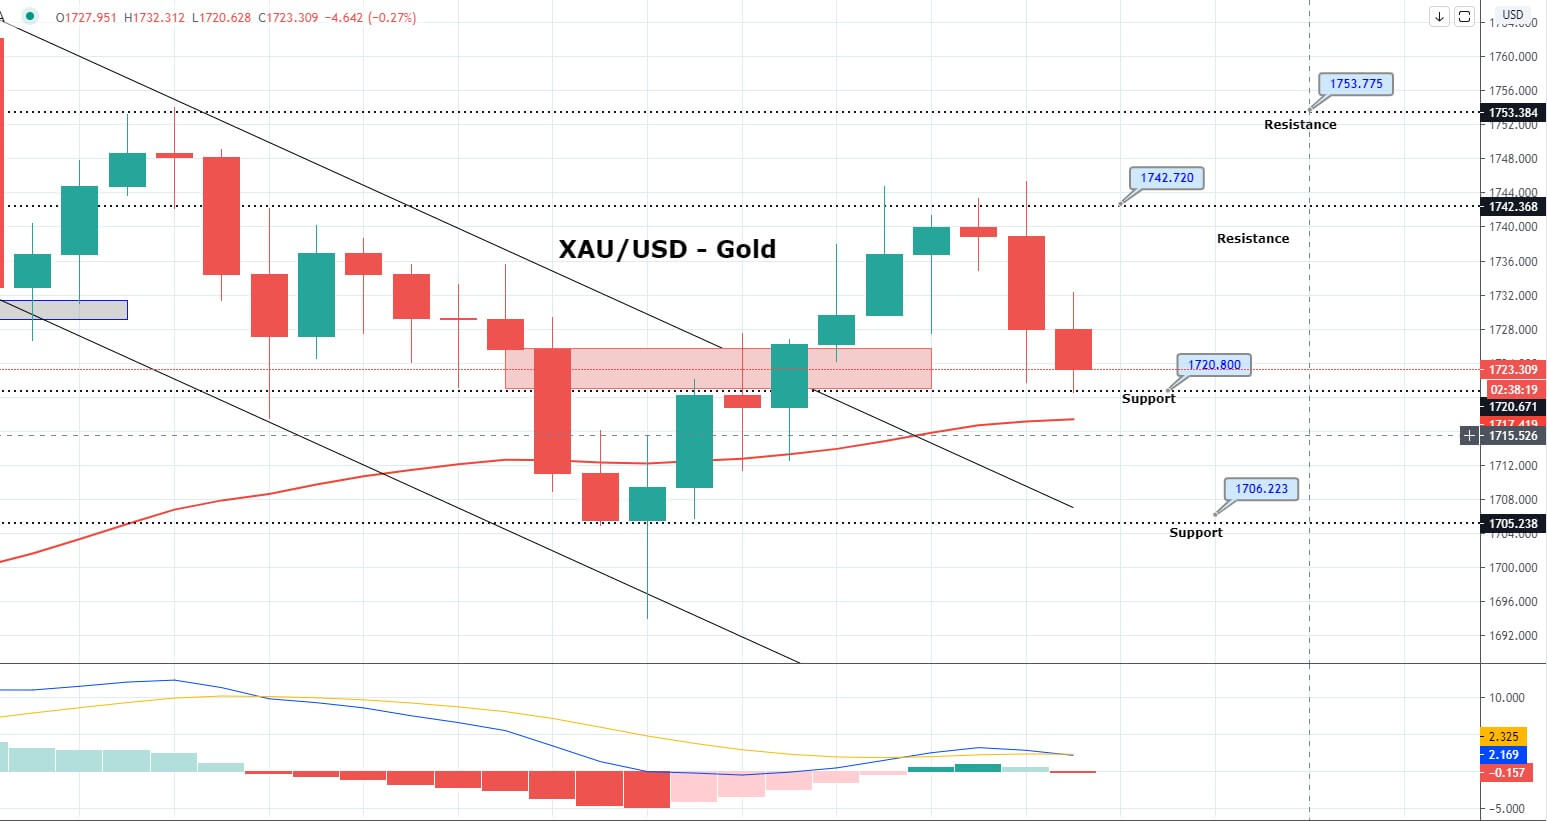
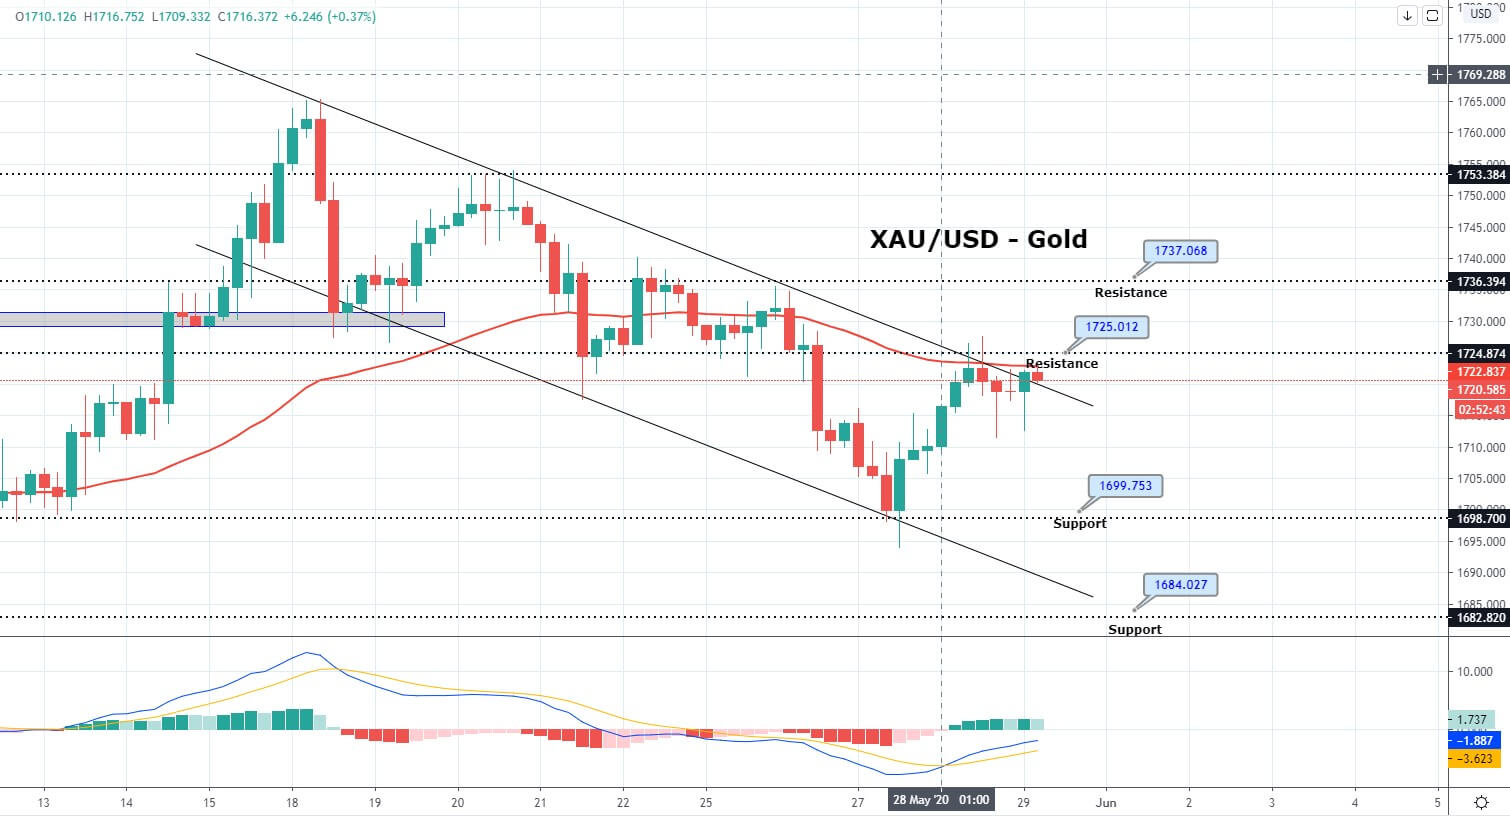
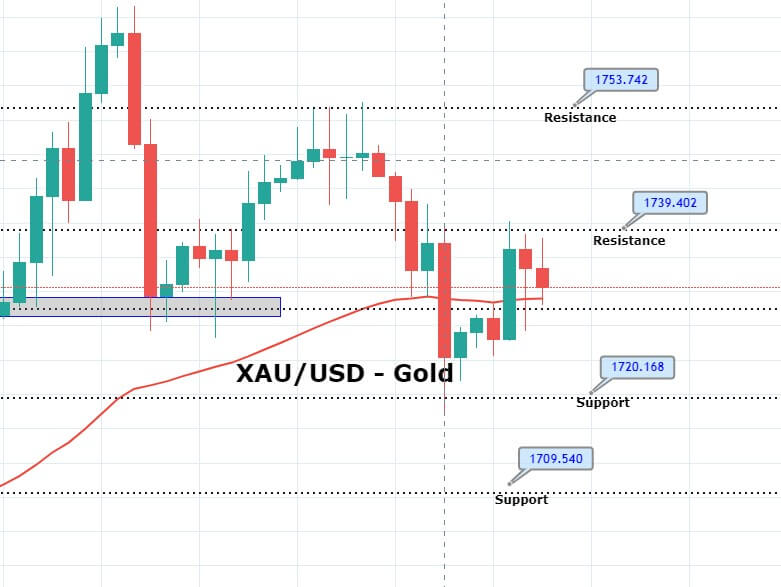
During Friday’s early Asian trading session, the safe-haven-metal prices still consolidate into the overnight confined range around the 1,725 level, mainly due to mixed trading sentiment in the market. However, the bullish trend in the yellow-metal remains as long as it trades above the $1700 level. The prices of gold dropped sharply yesterday from the high of 1738, mainly after the upbeat U.S. data and positive reports from China that they overcame the coronavirus outbreak. 

As of now, the reason for the modest gains in the gold prices could be attributed to the fears of the second wave of COVID-19 and geopolitics tensions. At the press time, the yellow metal is currently trading at 1,726.16 and consolidates in the range between the 1,721.59 – 1,727.41.

As we are all well aware that the weekly jobless claims report showed an improvement compared to the previous week’s figures. However, the minor declines were backed by the pace of re-openings across the U.S. Weekly first-time unemployment claims dropped by 58,000 to 1.508 million in the week ended June 13, which provided some support to the risk sentiment.

The fears over the coronavirus resurgence remain on the card as Beijing reported 25 new COVID-19 cases on Thursday, while the Xinfadi market now faced almost 200 cases so far, which overshadowed the optimism over the ‘under control’ situation, as said by the Chinese official on Thursday.  

Despite US-China having political differences, both sides recently showed a willingness to keep talking on the trade deal, which exerted some positive impact on the risk sentiment and becomes one of the major factors that holds a lid on any further gains in the gold prices.


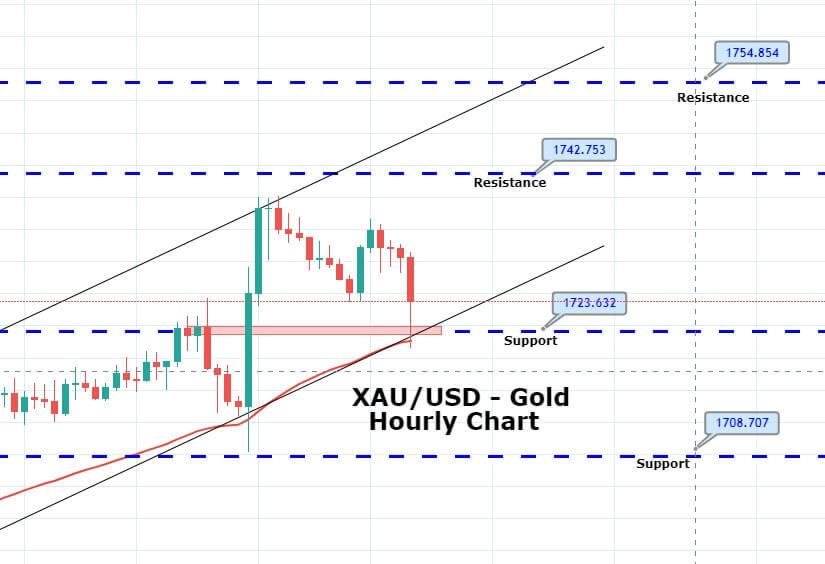
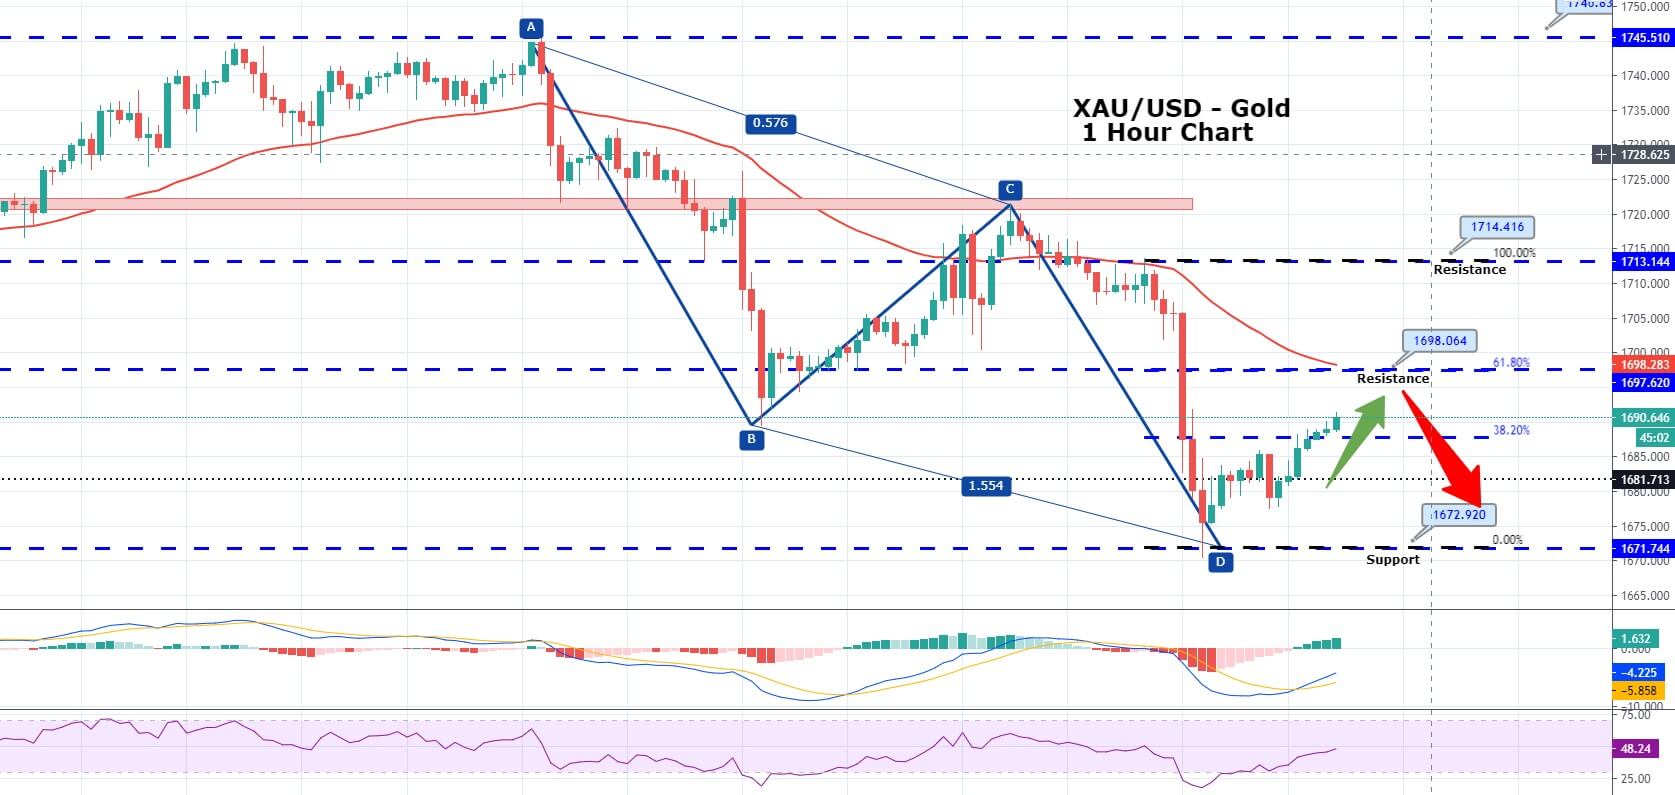
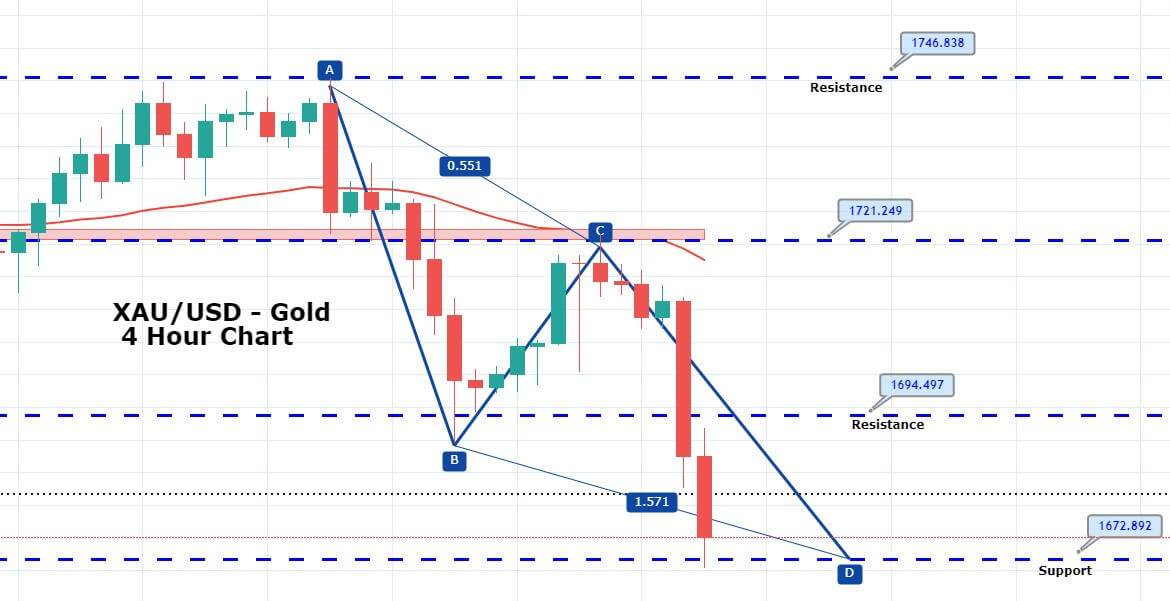
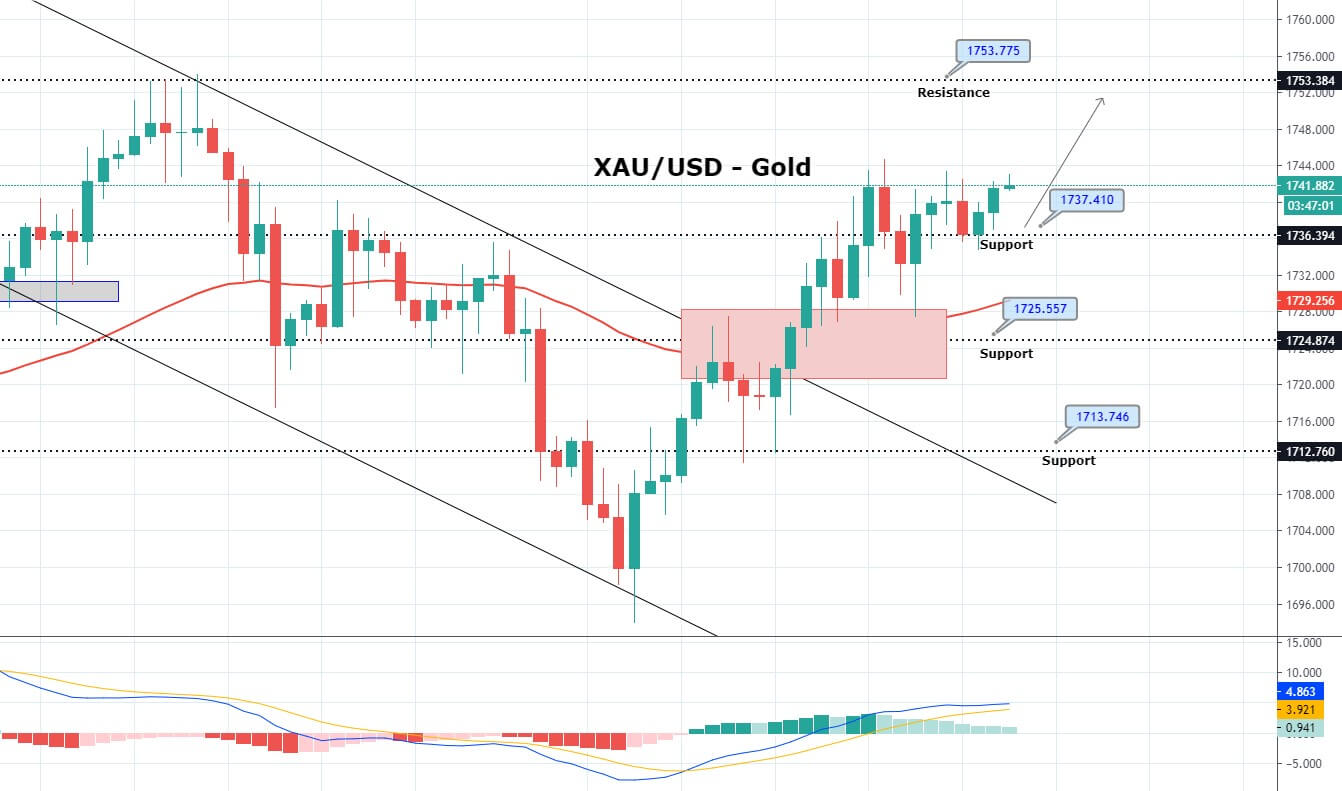
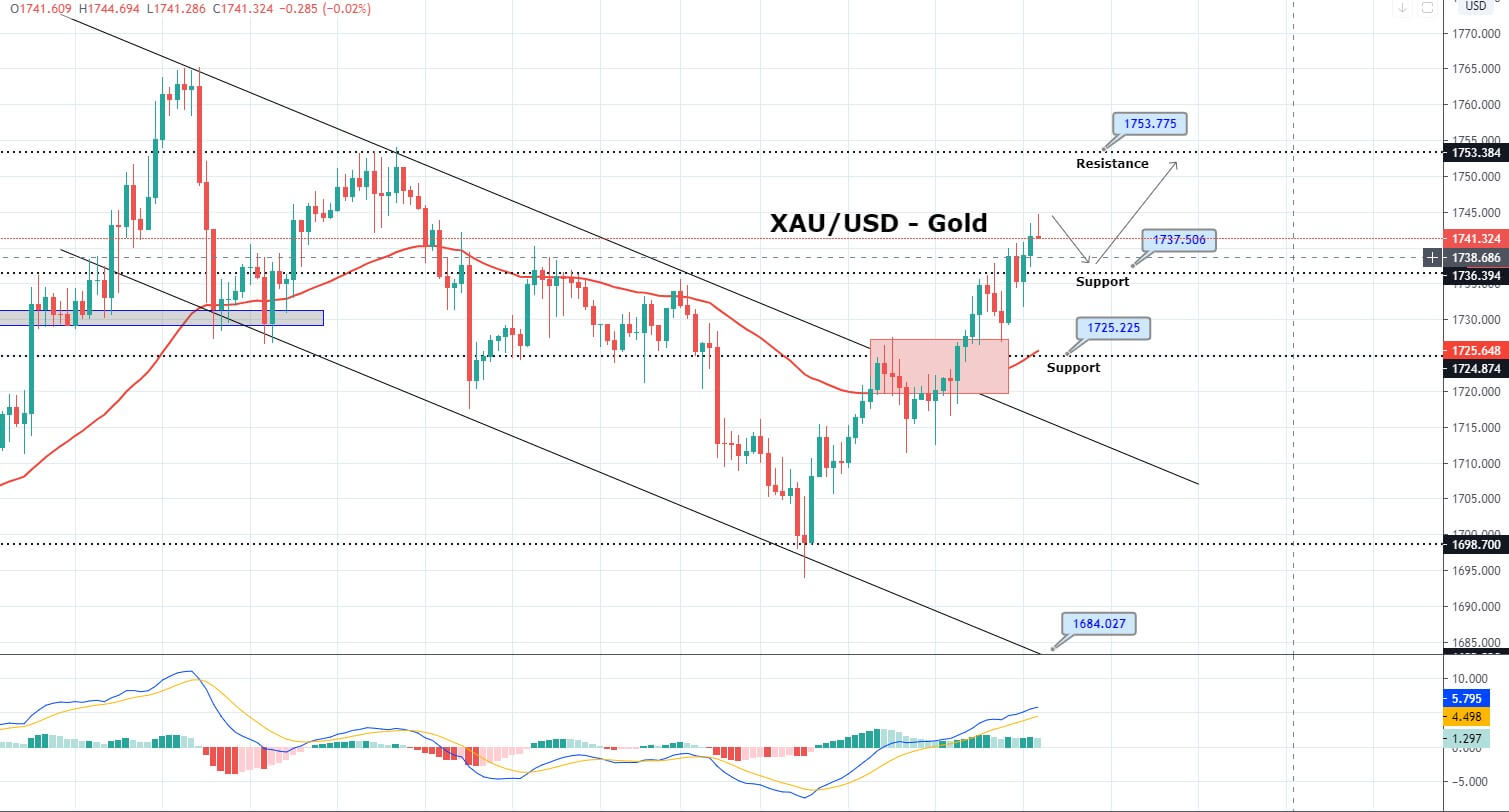
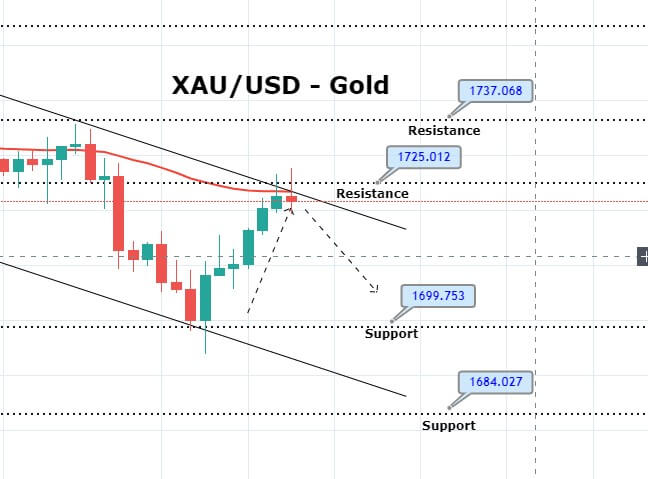
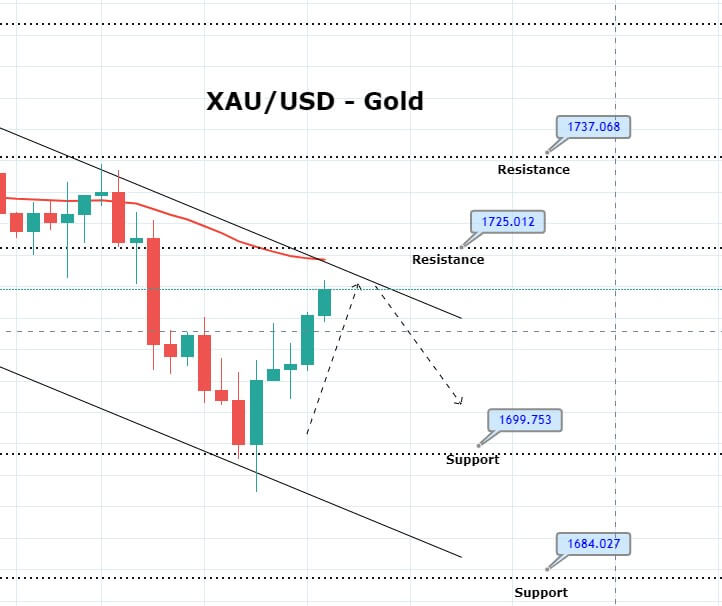
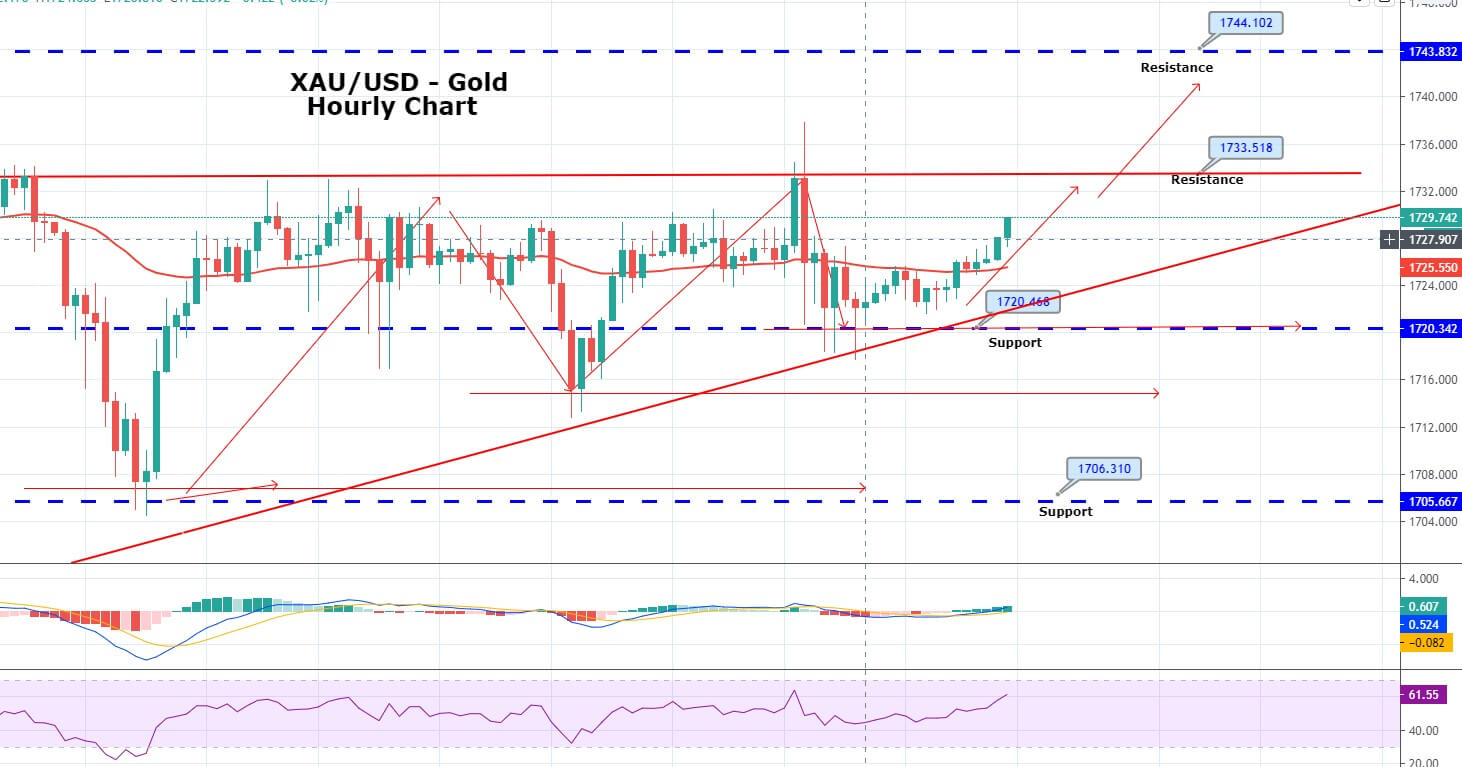
The yellow metal gold is currently trading with a bullish bias, crossing above a substantial resistance area of 1,731. Above this, bullish bias can be seen until the next resistance level of 1,733 and 1,737. While the closing of candle or violation of 1,731 will extend buying until the next target level of 1,744. Consider this, we took a buy trade at 1,729 level today. 


Entry Price – Buy 1729.06        

Stop Loss – 1723.06        

Take Profit – 1735.06

Risk to Reward – 1

Profit & Loss Per Standard Lot = -$600/ +$600

Profit & Loss Per Micro Lot = -$60/ +$60

Categories
Forex Signals

EURAUD Advances in a Potential Inverted H&S Pattern

Description

The EURAUD cross in its hourly timeframe illustrates an advance in a corrective structure that looks like a potential inverted H&S pattern.

The price action reveals sideways bias, bounded in the lower side by the June 03rd low at 1.6033, in where the cross found buyers at 1.6033. On the upper side, the price topped at 1.6586 on June 12th, from where the price started to develop a downward sequence. 

From the EURAUD hourly chart, we observe that the corrective move retraced to the zone of 1.6221, which coincides with the previous swing of June 10th. This movement warns us about a potential institutional activity of buy-side incorporations.

On the other hand, the price action reveals the advance in a formation that looks like an inverted head & shoulder pattern, which suggests the likely scenario of an upward movement. This pattern will activate if the cross jumps over level 1.6401, which coincides with the neckline. The technical target of this chartist pattern locates at 1.6616. Our invalidation level is placed below the low of the right shoulder at 1.6299. 

Chart

Trading Plan Summary

Categories
Forex Signals

AUDUSD Develops a Descending Channel

Description

The AUDUSD pair in its 2-hour chart exposes a corrective descending structure, which began once the Aussie topped at 0.7064 on June 18th. 

The Aussie Dollar started a rally on May 15th when the price found fresh buyers at 0.6402. The accelerated movement experienced by the pair looks like an extended wave. Once the price action topped at 0.7064, the AUDUSD pair started to move mostly downward, breaking below the accelerated trendline and fell until the mid-term trendline. After this decline, the recovery realized a lower high, which carries us to project a descending trendline. 

On the other hand, the RSI oscillator reflects a drop until level 22.18, corresponding to the breakdown that the Aussie developed once topped at 0.7064. The RSI reading leads us to observe that the price should be entering on a bearish cycle.

For the following trading sessions, we expect further declines, which could visit the area of 0.6682, corresponding to the next swing high developed by the AUDUSD pair. The invalidation level of our bearish scenario locates at 0.6927.

Chart

Trading Plan Summary

Categories
Forex Signals

EUR/JPY Downward Channel Drives Green Pips – Qucik Update on Signal!

The EUR/JPY extended its previous session losing streak and dropped below 119.785 level, mainly due to increased safe-haven demand of Japanese yen. The reason for the EUR/JPY pair declines could also be attributed to the risk-off market sentiment underpinning the safe-haven Japanese yen and contributing to the currency pair gains. 

At this particular time, the EUR/JPY pair is trading at 119.795 and consolidating in the range between 120 – 119.700. However, the risk-off market sentiment was bolstered by the concerns over the second wave of coronavirus infections and geopolitical tensions, which exerted some downside pressure on the risk sentiment, which benefitted the Japanese yen’s perceived safe-haven status.

Besides, there are still no results from any vaccine trials that could stop the deadly disease from spreading as Texas showed a record high jump in the hospitalization likewise, Florida, Arizona, and Oklahoma also showed further cases. Apart from this, Japan’s virus figures rose to the highest since May 30. Whereas, the tension between the US-China was further bolstered by the fresh report that the Group of Seven (G7) leaders, including the U.K., urged China to reconsider their security law to Hong Kong.

Today’s talk between US-China, the top diplomat Jiechi showed aggressive reactions to U.S. Secretary State Mike Pompeo for the U.S. interference in Hong Kong issues, which initially exerted some downside pressure on the risk-tone and contributed to the losses of EUR/JPY. 

The EUR/JPY pair edged lower near one-month lows set last week, albeit lacked any strong follow-through selling and staged a modest intraday bounce of around 20-25 pips from the 119.70 regions.


Daily Support and Resistance    

S1 106.32

S2 106.81

S3 107.12

Pivot Point 107.31

R1 107.61

R2 107.8

R3 108.29

Technically, the EUR/JPY is trading with a bearish bias, having violated the next support level of 120.500 level, which is now working as a resistance. Downward trendline also supports selling bias, and this opens further room for selling until 119.180 level. The RSI and MACD levels are staying in a selling zone, which may further lower the EUR/JPY prices. Thus, we opened a quick sell trade below 120 level during the early U.S. session, which hit the take profit, closing us a nice amount of pips today. Good luck! 

Categories
Forex Signals

Gold Sideways Trading Continues – Watchout Quick Trade Setup!

The safe-haven asset failed to break its previous session’s confined trading range near below $1,730 level but erased its some losses from an intraday low mainly due to the risk-off market sentiment triggered by the fresh US-China tension. The second wave of coronavirus (COVID-19) also fueled the risk-off market tone, which eventually provided some support to the gold prices. At the moment, the yellow-metal press is currently trading at 1,724.06 and consolidating in the range between 1,717 and 1,730.07.

At the US-China front, the top diplomat Jiechi warned U.S. Secretary State Mike Pompeo that China strongly opposed the U.S. interfering in Hong Kong, G7 statement on Hong Kong initially exerted some downside pressure on the risk-tone and contributed to the modest gold gains. In the meantime, the Dragon Nation showed a demanding attitude while saying that the U.S. should handle Taiwan related issues carefully and properly. Apart from this, China also said that the U.S. should respect China’s counter-terrorism efforts in Xinxiang.

Moreover, the reason for the risk-off market sentiment could also be attributed to the intensifying second wave of coronavirus. It should be noted that the U.K.’s second vaccine trials seemed failed to provide any notable result to stop the deadly disease from spreading as Texas showed a record high jump in the hospitalization; likewise, Florida, Arizona, and Oklahoma also showed further cases. Apart from this, Japan’s virus figures rose to the highest since May 30. 

It’s worth recalling that the Dragon Nation recently impose strict measures on air travel as well as used all the possible ways, including renewed lockdown restriction to stop the deadly disease from spreading. 

Moreover, the risk-off market sentiment was further bolstered by the geopolitical tensions between North and South Korea, as well as between India and China, which also had some positive impact on the gold prices. In the meantime, the Asian Development Bank (ADB) trimmed its 2020 growth forecast for Asia from 2.2% to 0.1% also, weighed on the market’s trading sentiment.

As in result, the U.S. 10-year Treasury yields still reported losses around 0.70% while the Asian stocks reported moderate losses by the press time. At the USD front, the broad-based U.S. dollar maintained its earlier gains and stayed above 97 levels mainly due to the growing concern over the spike in COVID-19 cases in China and the U.S. which eventually turned out to be one of the key factors that kept a lid on any additional gains in the gold. Whereas, the U.S. Dollar Index that tracks the greenback against a basket of other currencies moved 0.12% to 97.028 by 11:40 PM ET (4:40 AMGMT).

Looking forward, the traders will keep their eyes on the qualitative catalysts for near-term direction. In the meantime, the virus headlines and geopolitical headlines will be the key to watch.


Daily Support and Resistance    

S1 1689.13

S2 1706.35

S3 1716.85

Pivot Point 1723.57

R1 1734.07

R2 1740.79

R3 1758.01

The yellow metal gold is currently trading with a mixed bias, holding below a substantial resistance area of 1,731. Beneath this, bearish bias can be seen until the next support region of 1,717 and 1,714. While the closing of candle or violation of 1,731 will extend buying until the next target level of 1,744. Good luck! 

Categories
Forex Signals

Increased Safe Haven Appeal Weighs on USD/CHF – Quick Update on Signal! 

The USD/CHF pair seems to be trading sideways within a narrow trading range of 0.9520 – 0.9510 aimed at increased risk sentiment. The reason for the soured risk sentiment could be attributed to the statement that the Dragon Nation recently imposed strict measures on air travel to stop outbreak 2.0 and planned to impose further lockdown restrictions as the new coronavirus cases rose above 557 far. 

On the other hand, Japan, the U.S., and Germany also reported fresh cases that eventually fueled the concerns of pandemic wave 2.0 and exerted some downside pressure on the risk sentiment and benefited the safe-haven Swiss Franc.

On the other hand, the Indian and China faced some critical crisis, and both parties suffered losses in the fight at a disputed Himalayan border area, which also exerted additional burden on the risk-off momentum. The tensions between the border of North Korea and South Korea also escalated and added to the risk-off market sentiment.

The broad-based U.S. dollar took bids on the day at the USD front, mainly after the U.S. retail sales rose more than expected from 7.9% in May to 17.7%. The U.S. dollar was further supported by the new risk-off market sentiment triggered by the intensified odds of pandemic wave 2.0. However, the U.S. dollar strength provided some support to the USD/JPY pair to recover its early-day losses. The market traders will keep their eyes on the release of the U.S. housing market data, Building Permits, and using Starts. As well as, the Fed Chair Jerome Powell’s second day of testimony will be key to watch, which might influence the USD price dynamics and produce some meaningful trading opportunities around the USD/CHF pair.


The USD/CHF is facing an immediate resistance of around 0.9520 level, and closing of recent Doji candle below 0.9520 suggests the chances of selling in the pair. On the higher side, resistance is likely to be found around 0.9640 level; however, the downward trendline is placing a bearish pressure on the USD/CHF pair today. Let’s consider selling below 0.94861 today. 


Entry Price – Sell 0.94861    

Stop Loss – 0.95261    

Take Profit – 0.94461

Risk to Reward – 1

Profit & Loss Per Standard Lot = -$400/ +$400

Profit & Loss Per Micro Lot = -$40/ +$40

Categories
Forex Signals

GBPAUD Moves in an Expanding Triangle

Description

The GBPAUD price in its hourly chart exposes the progress in an ascending expanding triangle, which began on the low of June 05th at 1.8060 when the cross found fresh buyers.

The overlapped upward sequence boosted until 1.8452 reached on June 12th when the cross found resistance at the zone of previous June 02nd high reacting mostly bearish starting a corrective movement in a three-wave sequence.

The end of the three-wave corrective sequence found support on June 16th at 1.8148 from where the price action revealed the bullish incorporation of institutional participants, which on Wednesday trading session dragged the price to the zone of 1.8176 in where the price started to show bullish incorporations.

Considering the Elliott wave theory’s alternation principle, we expect a rally that should boost the price to fresh higher highs in the following trading sessions.

A buy-side position will activate at 1.8200 as psychological support; our short-term target locates at 1.8380, this level coincides with the previous high of June 16th, representing an intraday resistance. If the bullish momentum surpasses this resistance, we will expect further raises. The invalidation level of the scenario locates at 1.8110.

Chart

Trading Plan Summary

Categories
Forex Signals

AUD/USD Soars Amid Symmetric Triangle Pattern & 50 EMA Crossover! 

The AUD/USD pair was closed at 0.68886 after placing a high of 0.69766 and a low of 0.68332. Overall the movement of AUD/USD pair remained bearish throughout the day. The decreased risk appetite after increasing fears of the second wave of coronavirus in China and renewed lockdown restrictions to hold the spread of the virus again in Beijing. 

This weighed on risk perceived Australian dollar and dragged the AUD/USD pair. The Reserve Bank of Australia on Tuesday issued its monetary policy report and provided a relatively positive outlook of the economy than its major counterparts. Furthermore, Governor Philip Lowe and the committee said that the Australian economy was facing the biggest economic contraction since the 1930s, and it was possible that the downturn would be shallower than earlier expected.

RBA affirmed that the target of 3-year yields would be maintained until progress towards full employment and inflation target of the central bank was made. Bank also acknowledged that the infection rates were declining in many countries, and if this were to continue, it could have made the global recovery faster.

On the data front, the Housing Price Index for the quarter decreased from 2.5% forecast to 1.6% and weighed on Aussie. The weaker Australian dollar moved the pair AUD/USD in reverse direction on Tuesday. On the other hand, better than expected economic data from the United States pulled the pair further on the downside. The Retail Sales for May surged by 17.7% on Tuesday from the expected 7.9% and supported the US dollar.

Strong US dollar weighed on AUD/USD pair and pair lost its previous day’s gains and ended its day with a bearish candle. On the other hand, the escalating tensions between India and China over the disputed border after a fight between both nation’s soldiers also weighed on a china-proxy currency – Aussie.


The AUD/USD is supported above 0.6850 level, and closing of recent Doji candle above 0.6850 is suggesting the chances of buying in AUD/USD. On the higher side, resistance is likely to be found around 0.6960 level. Bullish bias seems dominant today.

Entry Price – Buy 0.68865

Stop Loss – 0.68465    

Take Profit – 0.69265    

Risk to Reward – 1

Profit & Loss Per Standard Lot = -$400/ +$400

Profit & Loss Per Micro Lot = -$40/ +$40

Categories
Forex Signals

Gold: Moving South Below the 50-Period SMA

XAUUSD had a bounce off its lows that began on Jun 15 at 13:00 the bounce re3ached the $1730 level and began to move sideways, making lower lows. The last interaction made an evening star with a large bearish candlestick. We think this is a good short setup to scalp with a target at the current 200-hour SMA for a nice and fast reward. The R/r factor is just 1 but the odds of the pair going south are very high, which makes the trade appealing. We see also that the Stochastics made a crossover to near the middle of the range, suggesting an increased bearish momentum.

Trade Setup:

Entry: 1,724.64

Stop-loss: 1,734.64

Take profit: 1,714.64

Reward/Risk: 1

Risk: 100 pips which is $1000 per XAUUSD Lot, or $10 on a micro-lot. The reward is identical as the R/r =1


Categories
Forex Signals

USDCHF Intraday Upward Breakout

Description

The USDCHF pair in its 2-hour chart shows an intraday upward breakout, which leads us to expect a short-term rally.

The price action unveils a bullish reaction from the June 11th low at 0.9376, from where the price fueled raising until 0.9553 in three internal moves. 

The breakout observed in the Tuesday 16th trading session, and confirmed by the RSI oscillator carries us to expect a new upward leg as a wave (c) developed in five internal segments. This potential ascending move could boost to USDCHF until 0.9603 in where the pair could complete its third leg.

The invalidation level of this upward scenario locates at 0.9437.

Chart

Trading Plan Summary

Categories
Forex Signals

Crude Oil Breaks Above Descending Triangle Pattern – Checkout My Sell Limit! 

The WTI crude oil has violated the descending triangle pattern, which was providing resistance at 37.20 area. Above this level, we may see the WTI prices heading north towards the next resistance area of 39.37. It seems like the demand for crude oil is gaining in the wake of positive sentiment over the COVID19 vaccine. 

The U.K.’s human is going to start the testing of the second vaccine to control the coronavirus outbreak, which exerted some positive impact on the market risk-tone and crude oil as well. The human tests are backed by 41 million pounds ($52 million) in U.K. funding along with another 5 million pounds of donations, including contributions from the public. 

On the negative side, the coronavirus cases rose above 8 million globally by Monday, with infections rising in Latin America. Whereas, the United States and China are dealing with fresh outbreaks, which gradually undermining the trader’s confidence about the V-shape recovery and turned out to be one of the key factors that kept a lid on any additional gains in the crude oil.

Bullish sentiment around the crude oil was mainly supported by the optimism over the adherence to the OPEC and its allies (OPEC+) output cut deal by its members. Even, the OPEC+ pact optimism overshadowed the worries over the second-wave of coronavirus and its impact on the global economic recovery.


The investors will keep their eyes on Thursday’s OPEC-led monitoring panel to be led by OPEC as it analyzes producer countries’ success in complying with the cuts. The crude oil supply forecasts from the American Petroleum Institute (API) and the U.S. Energy Information Administration (EIA), due later in the week, will be key to watch.

 Daily Support and Resistance

S1 30.52

S2 33.59

S3 35.65

Pivot Point 36.67

R1 38.72

R2 39.75

R3 42.83

Since we are late to join the party and crude oil has already come so far after breaking 37.20 level, we should look for selling trade somewhere around 39.40 or 40.65 level. Both of these levels are going to be work as double top levels and may help investors capture a quick retracement during the U.S. session. Goold luck!  

Categories
Forex Signals

EURNZD Moves in a Short-Term Ascending Channel

Description

The EURNZD cross in its hourly chart exposes a short-term ascending channel that looks following the price action since the June 09th low at 1.71896, from where the cross started to develop a higher high and lower high sequence.

The June 11th high at 1.76530, which surpassed the previous swing high at 1.75890 from June 04th, the short-term picture changed the bias from bearish to bullish.

The RSI oscillator, which supports the change in our market sentiment, found support in the zone of level 40, which lead us to weight the bullish bias for the potential next move.

A bullish position will activate if the price soars above the last intraday swing at 1.7520, from where we expect an upside until the round level at 1.7605. However, we don’t foresee a rally over the upper long-term descending trendline in brown.

Our bullish scenario will be invalid if the price drops below 1.7475

Chart

Trading Plan Summary

Categories
Forex Signals

EUR/USD Breaks Above Downward Channel – Who’s Up for Buy Signal? 

During the European session, the EUR/USD pair flashed red and dropped to 1.1230 before bouncing off towards the 1.1270 level. The broad-based U.S. dollar just started to erase its early-day losses and gained some bullish traction due to the risk-off market sentiment, which also exerted some downside pressure on the currency pair. 

The Tokyo reported numbers of COVID-19 cases rose by 47, the highest level since May 05. In the meantime, the Dragon Nation has closed markets once again due to the increase in the virus cases around the Xinfadi food market in the Southern Fengtai district. Almost 20 above U.S. states reported a rise in new cases, which eventually exerted downside pressure on the risk sentiment.

The reason for the risk-off market sentiment could also be attributed to the possibility of renewed lockdowns to curb the spread, which eventually undermined the prospects for a sharp V-shaped economic recovery. The risk-off market sentiment finally pushed the U.S. dollar higher, at least for now, and became a key factor that kept the lid on any gains in EUR/USD pair. 

The trader did not give any significant attention to the report that the Eurozone’s economic powerhouse expected to see its contribution to the European Union’s (E.U.) budget rise by 42%, or EUR13 billion (11.7 billion pounds) annually, over the coming years as per Reuters.

It’s worth recalling that currency pair dropped by 0.64% on Thursday, mainly after the Fed-induced reality check undermined hopes of a V-shaped economic recovery and weighed heavily on the global stock markets, which means it’s probably a time traders may start doing profit-taking in the pair. 


Technically, the EUR/USD pair is trading in the oversold zone, which is one of the strongest reasons investors have to trigger profit-taking in their sell trades and enter a buy trade. The EUR/USD pair has violated the downward channel at 1.1270 level and, at the same time, forming a bullish engulfing candle on the 4-hour timeframe. The leading indicator MACD is also showing a bullish crossover, which suggests more buying in the pair. Let’s consider taking a buy trade as per the below trade plan.

Entry Price – Buy 1.12783    

Stop Loss – 1.12383    

Take Profit – 1.13183    

Risk to Reward – 1

Profit & Loss Per Standard Lot = -$400/ +$400

Profit & Loss Per Micro Lot = -$40/ +$40

Categories
Forex Signals

XAU/USD Enters Oversold Zone – Brace for Quick Long Trade!  

The safe-haven-metal prices rose slightly to $1,731 before falling to intraday low pf at 1,708 level due to the risk-off market sentiment triggered by the second wave of coronavirus (COVID-19) outbreak which tends to underpin the safe-haven assets like gold. On the other hand, the traders did not give any significant attention to the upbeat comments from the Dallas Federal Reserve President Robert Kaplan. 

At the coronavirus front, the Tokyo reported numbers of COVID-19 cases rose by 47, the highest level since May 05. In the meantime, the Dragon Nation has closed markets again after the increase in the virus cases around the Xinfadi food market in the Southern Fengtai district. Almost 20 above U.S. states reported a rise in new cases, which eventually exerted downside pressure on the risk sentiment.

Moreover, the rise in cases would weaken the extreme optimism about a potential V-shaped recovery. The reason for the heavy risk sentiment could also be attributed to the intensifying fears of protest in America. Whereas, the Federal Reserve chairman Jerome Powell broadly expected to repeat the depressing picture of the U.S. economy in his semi-annual policy report to Congress later this week which initially weighed on the risk sentiment. 

The futures tied to the S&P 500 reported losses by a 1.3% decline on the day during the early trading session. In the meantime, major Asian indices like Japan’s Nikkei and South Korea’s Kospi also flashed red while the Stocks felt the pull of gravity mainly due to fears of the second wave of the coronavirus outbreak. 

The reason behind the yellow-metal gains could also be attributed to the broad-based U.S. dollar weakness. Despite the risk-off market sentiment, the greenback reported losses on Monday morning in the Asian trading session while the U.S. Dollar Index that tracks the greenback against a basket of other currencies slipped 0.22% to 97.11, which is supported gold previously. For now, the market participants will keep their eyes on the Fed and the virus updates for fresh impulse. Moreover, China’s May month data dump, comprising Industrial Production and Retail Sales, will also be key to watch.


Technically, the precious metal gold prices fell to 1,707 level, entering into the oversold zone. That’s where we decided to enter a buy position in gold. Closing of the recent candle with long wicks on both sides is suggesting indecision among traders and is suggesting odds of bullish correction/retracement in gold. On the higher side, gold has the potential to go after 1,723 level. 

Entry Price – Buy 1710.78    

Stop Loss – 1704.78    

Take Profit – 1716.78

Risk to Reward – 1

Profit & Loss Per Standard Lot = -$600/ +$600

Profit & Loss Per Micro Lot = -$60/ +$60

Categories
Forex Signals

AUD/USD Bearish Engulfing Signals Selling Bias – Brace for Quick Short Trade!  

The AUD/USD pair was closed at 0.68540 after a high of 0.70039 and a low of 0.68392. Overall the movement of AUD/USD pair remained bearish throughout the day. The risk perceived Aussie posted losses on Thursday in risk-off market sentiment, which was caused by the gloomy outlook of the US economy by Federal Reserve in its monetary policy meeting. The FED in its report said that the impact of coronavirus could last for a more extended period of time than Fed expected, and recovery would also be slower than expected.

The GDP contraction expectations also increased to 6.5% for this year, along with the unemployment rate expectations towards 9.3%. Risk- appetite disappeared after that announcement from the market, and investors started buying safe-haven currency US dollars. The higher demand for the US dollar exerted pressure on AUD/USD pair, and hence par started to fall on Thursday. On the data front, at 6:00 GMT, the MI Inflation Expectations from Australia were reported as 3.3% in May compared to April’s 3.4%.

On the American front, the jobless claims decreased to 1.542M from 1.550 M of forecast and supported the US dollar. The PPI for May also surged to 0.4% against 0.1% of expectations and added in the strength of the US dollar, which eventually dragged the currency pair AUD/USD on the downward track to post daily losses.

Furthermore, the Australian Prime Minister, Scott Morrison, said that he would not be intimidated by the coercion moves from Beijing. Australia’s export trade to China is huge, with around a third of everything Australia export goes to China. The relationship between China and Australia was disturbed after Morisson called for an international inquiry on the origin of coronavirus, which was first reported in China. In response to what Beijing slapped tariffs on Australian Barley, ad threatens to do more, which ultimately affected Aussie demand in the market.


On the US-China front, the tension remained there with the recent criticism on Federal Reserve’s latest monetary policy decision by China that the massive liquidity stimulus by Fed will increase the debts of the US government and also the world’s debt. In response to this, the US Vice President Mike Pence said that the US would remain tough on a trade deal, which raised fears about a potential trade war between the two biggest economies.

The increased tension between the US & China weighed on Aussie due to its relationship with the second-largest economy. China-Proxy Aussie got some pressure after the increased fears of US-China tussles and moved the pair AUD/USD lower on Thursday.

We are taking a selling trade below a double top resistance area of 0.6900 level; below this, the AUD/USD pair is likely to drop, especially due to bearish engulfing candle, which can be seen in the chart above. The more substantial bearish bias can lead AUD/USD pair lower towards the next support level of 0.6845 level today. 

Entry Price – Sell 0.68796    

Stop Loss – 0.69196    

Take Profit – 0.68396    

Risk to Reward – 1

Profit & Loss Per Standard Lot = -$450/ +$450

Profit & Loss Per Micro Lot = -$45/ +$45

Categories
Forex Signals

Investors Triggers Profit Taking In USD/CAD – Let’s Short for Quick Profit! 

The USD/CAD Currency Pair Hit The Fresh Session High Around 1.3500 Marks Due To Combination Of Factors. The USD/CAD pair was closed at 1.36295 after placing a high of 1.36317 and a low of 1.33969. Overall the movement of USD/CAD remained bullish throughout the day.

USD/CAD on Thursday rose from ashes like a phoenix after trading lower for past days due to general commodities weakness. The WTI crude oil dropped about 8% lower on Thursday and dragged commodity-linked Loonie with itself, which afterward pushed the USD/CAD pair higher.

The selling bias of crude oil was due to the fresh prediction of the long road towards economic recovery by the Federal Reserve, which exerted downside pressure on the oil market. Decreased crude oil prices pushed the currency pair USD/CAD in an upward direction to post daily gains.

On the other hand, the US dollar strength also added in the upward trend of USD/CAD after the better than expected US economic data and risk-off market sentiment. The reason behind the risk-off market sentiment was the gloomy outlook of the US economy from the Fed in its monetary policy meeting report on Wednesday. Fed promised to maintain the interest rates at its current level of 0-0.25% near zero until 2022.

On Thursday, the economic docket, the Unemployment Claims from last week, decreased to 1.542M from 1.550M of expectations and supported the US dollar. The PPI for May also reported an increase to 0.4% from the 0.1% of expectations and added support to the US dollar.

The strength of the US dollar from positive macroeconomic data and risk-off market sentiment gave a boost to its buying and raised its bars on the board against its rival currencies, including CAD. The heavy buying of the US dollar added in the upward trend of USD/CAD pair, and hence, the pair rose above 1.3600 level on Thursday.


The USD/CAD prices are trading with a bearish bias of around 1.3580, falling from 1.3660 level. The MACD and RSI were in overbought range, and the pair has closed three black crows are driving bearish movement in the market. Let’s consider taking sell to target 38.2% Fibonacci retracement at 1.3570 level today. 

Entry Price – Sell 1.35903    

Stop Loss – 1.36303    

Take Profit – 1.35503    

Risk to Reward – 1

Profit & Loss Per Standard Lot = -$400/ +$400

Profit & Loss Per Micro Lot = -$40/ +$40

Categories
Forex Signals

Gold Signal Closed In Profit – Quick Update Today! 

The safe-haven-metal prices failed to maintain its previous day gains and dropped to $1,730 from $1,740, the highest since June 02 while representing 0.35% losses on the day as the broad-based U.S. dollar recently took a U-turn from the multi-day low backed by the fresh US-China tussle and contributed to the yellow-metal losses as they both have an inverse relationship. On the other hand, the risk-off market sentiment triggered by fresh conflict between US-China turned out to be one of the key factors that kept a lid on any additional losses in the gold.  

At the USD front, the broad-based U.S. dollar drew bids on the day as investors lose their confidence about sharp economy recovery after details came from the U.S. Federal Reserve’s policy meeting the day before. The U.S. economy will collapse 6.5% this year, and the unemployment rate will be 9.3% by the end of the year, as per the Fed quarterly projections. The reason for the upticks in the U.S. dollar could also be attributed to the fresh on-ging tussle between the United States and China, which eventually fueled the risk-off market sentiment. 

The U.S. dollar was dropped to the lowest since March 10 instantly after the U.S. central bank hit a dovish tone the previous day. Wherein the U.S. Federal Open Market Committee (FOMC) decided to keep the benchmark rate unchanged. In the meantime, U.S. President Donald Trump’s cheer the Fed’s action.

Apart from this, the risk-off market sentiment was further bolstered by the fears of the coronavirus (COVID-19) second wave. The reason behind the risk-off market sentiment could also be associated with the report of the OECD latest Economic Projections. Wherein the report indicated the downside fears for the global economy due to the coronavirus (COVID-19).

Looking forward, the US-China tussle will gain market attention due to the light calendar and become worth watching for a near-term direction. At the data front, the U.S. Weekly Jobless Claims and Producer Price Index for May will be key to wait for new moves in the pair.


The yellow metal gold was on a bullish break due to the dovish FOMC strategy, where FED stated interest rates are expected to linger on hold until 2022. While they are expecting deflation in GDP, the weaker dollar is encouraging buying in gold; consequently, we may see gold prices flying higher until 1,745 in the coming days. Exactly before this, the overbought gold may sink a bit unto 1,726 range to achieve retracement. So, the immediate support for gold exists at 1,726 and 1,718 levels, while resistance visits at 1,738 and 1,745. So it was a good idea to close at in profit around 1,736 level as the market reversed right after that. 

Entry Price – Buy 1733.15    

Stop Loss – 1728    

Take Profit – 1740.15

Risk to Reward – 1

Profit & Loss Per Standard Lot = -$450/ +$600

Profit & Loss Per Micro Lot = -$45/ +$600

Categories
Forex Forex Indicators Forex Market Analysis Forex Price Action Forex Signals

EURAUD Reveals Strength Signals (UPDATE)

In our previous market analysis corresponding to EURAUD cross (read here,) we commented that the price action revealed potential raises, supported by the price action and confirmed by the RSI oscillator.

Trade Update

In the current update, we distinguish that the EURAUD cross soared until 1.64 level, from where the price found resistance in the dynamic resistance corresponding to the upper line of the ascending channel. Likewise, the RSI oscillator moves over level 70, which warns us about the intraday overbought.

With the advance over 120 pips in our previous setup, this situation carries us to consider the risk reduction or partially close the long position placed previously.

What’s Next?

For the next path, EURAUD could retrace until the blue box in the area of 1.6357, which could act as a pivot zone from where the price could find fresh buyers expecting to incorporate additional positions in the long side. If the price action does not experience the retracement forecasted, this is signal strong bullish sentiment in the EURAUD cross.

Categories
Forex Signals

EURAUD Reveals Strength Signals

Description

The EURAUD cross exposes in its 2-hour chart a short-term ascending move, developing a sequence of lower highs from the June 03rd low at 1.6033. 

During this trading week, we observe the last upward movement that EURAUD realized from the trading session corresponding to recent Monday 08th low at 1.6065 until Tuesday 09th high at 1.63495, which was elapsed in a small portion of time that the descending sequence from the previous week high at 1.63659. This context convinces us that institutional market participants could be interested in moving the price to the bull-side.

On the other hand, the bounce over level 40 observed in the SI oscillator leads us to conclude that the EURAUD cross is turning its bias from bearish to bullish.

Our outlook foresees a buy-side positioning from the current zone (1.6261) with a potential bullish target at 1.6532. This zone corresponds to the last pivot zone from where the EURAUD found support and then penetrated, creating a new lower low that carried down the price until the June 03rd low at 1.60332.

The invalidation level of our bullish scenario locates at 1.6139.

Chart

Trading Plan Summary

Categories
Forex Signals

EUR/USD Ascending Triangle Pattern Ready to Breakout! 

The EUR/USD is trading slightly bullish and took bids around above the 200-week simple moving average (SMA) of 1.1360 level mainly due to the broad-based U.S. dollar weakness ahead of U.S. Federal Reserve policy meeting.The EUR/USD is trading at 1.1355 and consolidates in the range between the 1.1332 – 1.1370. However, the Fed’s monetary policy statement is scheduled at 1800 GMT and will be followed by a press conference from Chairman Jerome Powell.

During the early hours, the Eurostat report showed that the eurozone economy weakened by 3.6% quarterly in the first quarter. But this slightly better than expected figures failed to impressed shared currency investors.

At the Fed front, the central bank will likely keep interest rates unchanged at a record low and expected to indicate a sharp contraction in the economic activity this year and near-zero interest rates for a few years. However, the reason for the sharp contraction in the economic activity could be attributed to the pandemic, which has put the U.S. and the global economy into recession while the market has already priced in all situations. Therefore, the dismal predictions might not be able to weaken the U.S. dollar.

At the USD front, the broad-based U.S. dollar remains pressured near the lowest since early-March as traders awaiting details from the U.S. Federal Reserve policy meeting, which is scheduled to happen later in the day. It should be noted that the Fed can announce measures to control the recent increase in bond yields, which will likely push the dollar down further. Whereas, the U.S. Dollar Index that tracks the greenback against a basket of other currencies moved slightly by 0.01% to 96.332 by 11:36 PM ET (4:36 AM GMT).


EUR/USD is consolidating in a narrow trading range of 1.1370 – 1.1276 level, and right now, it seems to break out of this trading range. On the lower side, the next target level seems to be 1.1185. Currently, the pair is facing immediate support around 1.1274 level, and closing of candles below this level may lead the EUR/USD prices further lower towards 1.1185 level, which is extended by the 50 EMA level. On the higher side, resistance holds at 1.1315 level today.

Entry Price – Buy 1.13492    

Stop Loss – 1.13042        

Take Profit – 1.13942    

Risk to Reward – 1

Profit & Loss Per Standard Lot = -$450/ +$450

Profit & Loss Per Micro Lot = -$45/ +$45

Categories
Forex Signals

USD/JPY Helps Us Secure Early Morning Gains – Quick Update! 

The USD/JPY pair is trading with a bearish bias around 107.350 in the wake of increased haven appeal and weaker U.S. dollar. Today, the key focus will be on the FOMC monetary policy decision, which is scheduled to be announced later this Wednesday. The Fed is widely anticipated to keep interest rates unchanged at the end of a two-day meeting. 

Investors will closely watch the accompanying policy statement and the Fed Chair Jerome Powell’s comments about the future policy outlook for taking fresh clues. In the meantime, Wednesday’s release of the latest U.S. consumer inflation figures will likely influence the USD price dynamics and produce some short-term trading opportunities during the early North American session.


The USD/JPY fell dramatically to violate the narrow trading range of 109.800 – 109.255, and now it’s trading somewhere around 107.900. On the 4 hour timeframe, the USD/JPY is likely to find support at 107.900, and below this, the upward trendline may extend support around 107.600 level. The Japanese currency pair has already crossed below 50 EMA, favoring selling bias in the pair today. Let’s consider taking selling trades below 108.50 today.

Entry Price – Sell 107.650    

Stop Loss – 108.055    

Take Profit – 107.250

Risk to Reward – 1

Profit & Loss Per Standard Lot = -$400/ +$400

Profit & Loss Per Micro Lot = -$40/ +$40

Categories
Forex Signals

Gold Prices on a Bullish Run – U.S. China Tensions in Play! 

On Tuesday, the safe-haven extends its previous session bullish moves and soars to 1,715 level after dipping to $1,698, mainly due to the broad-based U.S. dollar bearish bias ahead of the U.S. Federal Reserve policy meeting. The gold’s bullish bias could also be attributed to the risk-on market sentiment backed by the growing optimism over a sharp V-shaped economic recovery from the coronavirus pandemic, which recently dominated the US-China tussle. The yellow-metal prices are currently trading at 1,715 and consolidate in the range between the 1,700 – 1,725. However, the geopolitical tensions in Korea, Libya, and concerning China turned out to be the key factors that is keeping a lid on any additional losses in the gold, at least for now.

The conflict between the United States and China remain on the aggressive track as Trump administration continues to urge for the bill to sanction Chinese policymakers involved in Xinjiang human rights violation. The Dragon Nation did not give any major heed to the Trump administration’s recent push to remove the punitive tariff on the American lobsters, which eventually exerted some downside pressure on the risk sentiment during the initial Asian on the day.

The earlier heavy risk-tone could also be attributed to North Korea’s decision to leave all inter-Korean communication from the South, and the tensions in Libya weigh on the risk sentiment earlier.

Apart from the US-China tussle, China’s Ministry of Culture and Tourism declared a warning against Australia’s travel caused by the increasing racist attacks. On the flip side, the China-India war is getting worse and remains on the cards as China recently put the Rising Star in command of forces in border face-off against India.


Daily Support and Resistance

S1 1663.08

S2 1679.26

S3 1688.42

Pivot Point 1695.45

R1 1704.6

R2 1711.63

R3 1727.82

On the technical side of the market, the precious metal gold is heading north, and it may target the next resistance level of 1,720 level. Bullish trend continuation and breakout of 1,720 levels can lead to higher gold prices until the next target level of 1,732. The MACD histograms are becoming bigger and bigger, demonstrating an upward trend in gold while the precious metal has just crossed above 50 periods EMA which also supports buying. Let’s consider taking buying trades over 1,710 to target 1,722. Closing of candles and sign of bearish reversal below 1,722 will help us capture a quick sell trade in gold today. Let’s wait and watch. Good luck! 

Categories
Forex Signals

AUD/USD Ascending Triangle Breakout – Quick Update on Trading Signal! 

The AUD/USD currency pair flashed green and succeeded to break the hurdle above 0.7000 while taking rounds around the 0.6995 level. However, the uptick upticks in the currency pair could be attributed to the broad-based U.S. dollar selling bias. The upticks in the pair were further bolstered by the risk-on market sentiment backed by the multiple factors, which eventually underpinned the risker assets like the Australian dollar. 

The risk-on market sentiment was bolstered by the headline NFP, which showed that the U.S. economy unexpectedly registered 2.509 million jobs in May as compared to the forecasted figure, which pointed a fall of 8 million jobs. The improvement in the jobless rate, which just dropped to 13.3% as against a big jump expected by 19.8% from 14.7% in April, also added in the risk appetite in the market.

Moreover, the upbeat trading sentiment could also be attributed to the hopes for a sharp V-shaped recovery for the global economy, which ultimately underpinned the perceived riskier of Aussie and contributed to the currency pair’s gains. Elsewhere, the risk-on market sentiment was further bolstered by the expectations that the worst part of the coronavirus pandemic was over.

At the USD front, the broad-based U.S. dollar erased its previous session gains and reported losses on the day as investors withdrew their money from the safe-haven assets after the U.S. released a better-than-expected employment report on Friday which eventually contributed to the pair’s gains. Whereas, the U.S. dollar index, which tracks the greenback against a basket of six other currencies, was largely flat at 96.888, having dropped nearly 3% over the last month.


On the negative side, the Australian dollar was recently pressurized by the worsening relationship between close trade partners China and Australia. Although, the Dragon Nation blamed Australia for supporting racial discrimination against Asians, which exerted some downside pressure on the Aussie currency.

Technically, the Aussie has formed an ascending triangle pattern which was supporting the AUD/USD pair around 0.6970 along with resistance at 0.7002. Bullish trend continuation can trigger buying until 0.7040 level today. The RSI and MACD are in support of buying, while the 50 EMA is also suggesting a bullish trend in Aussie. 

Entry Price – Sell 0.7009        

Stop Loss – 0.6969    

Take Profit – 0.7049    

Risk to Reward – 1

Profit & Loss Per Standard Lot = -$450/ +$450

Profit & Loss Per Micro Lot = -$45/ +$45

Categories
Forex Signals

Gold Prices on a Bullish Run – Quick Update on Trading Signal! 

The safe-haven-metal prices remain depressed under the lowest level of more than a month around $1,680, mainly due to the risk-on market sentiment in the wake of better-than-expected U.S. employment report. The reason for the upbeat trading sentiment could also be attributed to the news about the merger of drug majors AstraZeneca and Gilead, which eventually exerted some downside pressure on the safe-haven assets. 

At the press, the yellow metal prices are currently trading at 1,692.55 and has already violated the consolidated range of 1,677.67 and 1,689.86. However, the on-going US-China tussle and broad-based U.S. dollar weakness turned out to be the key factors that kept a lid on any additional losses in the gold prices, at least for now.

The Friday released U.S. employment data indicated that the negative impact of coronavirus on the economy could be short-lived or temporary, and this data also hinted that the economies could recover quickly, which recently boosted the market trading sentiment and kept the safe-haven asset under pressure. At the data front, the headlines U.S. Nonfarm Payrolls (NFP) increased 2.5 million against expectations of -8 million. Moreover, the Unemployment Rate also added to the optimism by 13.3%, against the 19.8% forecast.


As a result, the overall market mood turned positive and sent Wall Street higher after the job report was released. It’s worth mentioning that the U.S. 10-year Treasury yields added almost 7-basis points (bps) to 0.893% at the end of Friday’s closing.

Apart from the U.S., China released May month trade figures while reporting the biggest trade surplus despite the coronavirus crisis. The $62.93 billion of Trade Surplus, against $39 billion forecasts, probably boosted by the medical experts. Details suggest that the Exports have been down 3.3%, against -7.0% market agreement, whereas Imports declined slowly below -9.7% expected to -16.7%.

Technically gold has completed the ABCD pattern from 1,721 to 1,672 level. Closing of candles above 1,672 has driven bullish correction in gold, and it’s still soaring north to test the psychological trading level of 1,700 mark. The 50 EMA is likely to extend resistance around 1,698 level, and below this, the selling bias can be seen. But until this level is met, we can stay bullish in the XAU/USD trades. 

Entry Price – Buy 1686.66    

Stop Loss – 1680.66    

Take Profit – 1696.66    

Risk to Reward – 1.67 

Profit & Loss Per Standard Lot = -$600/ +$1000

Profit & Loss Per Micro Lot = -$60/ +$100

Categories
Forex Signals

Gold Slips Sharply Amid Stronger NFP Figures – Quick 100 Pips in Secured! 

The precious metal gold prices fell sharply from 1,694 level to 1,671 level on the release of U.S. NFP figures. Earlier today, the gold was supported as the concerns between the United States and China getting worse day by day and not showing any sign of slowing down, rather U.S. Secretary of State Mike Pompeo showed love about Nasdaq’s move on listing rules for Chinese companies. 

The US-China tussle was further bolstered by U.S. President Donald Trump’sTrump’s comments that the Chinese government has continually violated its promises to the U.S. and many other countries which exerted some downside pressure on the risk sentiment and turned out to be one of the major event that kept a lid on any gains in crude oil. Despite this, the U.S. Trade Representative Robert Lighthizer said that he feels “”excellent”” about phase one trade deal with the Dragon nation.

The recent dip in the gold prices came over stronger U.S. dollar. Total nonfarm payroll employment grew by 2.5 million in May, and the unemployment rate decreased to 13.3%, which drove sharp buying in the U.S. dollar, and dramatic selling in the gold prices. 


Technically gold has completed the ABCD pattern from 1,721 to 1,672 level. Closing of candles above 1,672 can drive bullish correction until 1,687 level before driving further selling until 1,660. We are already out of gold trade and secured 100 pips; however, check out the trade idea below. 

Entry Price – Sell 1702.86        

Stop Loss – 1710.86        

Take Profit – 1692.22

Risk to Reward – 1.20

Profit & Loss Per Standard Lot = -$800/ +$1000

Profit & Loss Per Micro Lot = -$80/ +$100

Categories
Forex Signals

USD/CAD Breaks Lower – Quick Update on Sell Signal! 

During Friday’s European trading session, the USD/CAD currency pair flashing red and dropped below the key 1.3500 psychological marks due to the selling bias in the broad-based US dollar triggered by the optimism about a sharp V-shaped recovery for the global economy. The modest upticks in the crude oil prices underpinned the demand for the commodity-linked currency the loonie and exerted some downside pressure on the currency pair. At this particular moment, the USD/CAD currency pair is currently trading at 1.3485 and consolidates in the range between the 1.3459 – 1.3513.

The reason for the risk-on market sentiment could be attributed to the growing optimism over a sharp V-shaped economic recovery from the coronavirus pandemic, which recently dominated the US-China ongoing tensions and made the broad-based US dollar weaker. US President Donald Trump’s comments further bolstered relationships between the world’s two largest economies that the Chinese government has continually violated its promises to the US and many other countries. 

At the USD front, the broad-based US dollar erased its early-day modest gains and dropped to 96.600, mainly due to the risk-on market sentiment which ultimately exerted some downside pressure on the currency pair. Whereas, the US dollar index drops 0.22% to a new three-day low of 96.46, having stopped the overnight bounce near 96.80.


At the crude oil front, the modest upticks in crude oil prices strengthened demand for the commodity-linked currency the Candian dollar and further contributed to the weaker tone in the USD/CAD currency pair. However, the Oil prices regained some traction due to the hopes that major oil producers (OPEC+) will extend the production cuts when they meet on Saturday. It remains to see if the USD/CAD pair continues to attract some buying near a technically significant moving average or ace further seeling bias to confirm a fresh near-term bearish breakdown. Looking forward, Friday’s monthly jobs report from the US (NFP) and Canada will be a key watch. We have entered a sell trade below 1.3469 level, and now it’s expected to lead the pair further lower towards the area of 1.3345. 

Entry Price – Sell 1.34615    

Stop Loss – 1.35115    

Take Profit – 1.34115

Risk to Reward – 1.00

Profit & Loss Per Standard Lot = -$500/ +$500

Profit & Loss Per Micro Lot = -$50/ +$50

Categories
Forex Signals

EURCAD Piercing Pattern and Breakout

EURCAD has been moving in a slightly descending channel, here shown as a linear regression channel.  The last iteration of the Price drove it from the top of it to near the bottom. There, it made a double bottom figure and headed up again. After being rejected by the central regression line (dotted line), the Price retraced slightly, then, four hours ago, The Price made a piercing candlestick followed by a large candlestick that went above the last high.

A trade can be made with the entry at 1.5191, a stop below the recent low (1.5110), and a profit target neat the last high of 1.5374. for a reward/risk ration of over 2.

The technical factors ate in favor of the trade. The price moves above the +1 sigma line of the Bollinger bands, and the bands are heading up. Also, the Stochastic oscillator has triggered a buy signal near the oversold level.

The Setup

Buy Entry: 1.5191

Stop-loss:1.5110 or lower

Take-profit: 1.5374

Reward/Risk: 2

Dollar risk: $575 on one lot. $57.5 on a mini lot, and $5.75 on a micro lot

Dollar reward: $1,150 on a lot.

It is recommended not to go above 1 percent of your balance in a single position. Thus, traders should not take more than two micro lots for every $1000 in their trading account.

Categories
Forex Signals

USD/CAD Choppy Session Continues – Brace for Breakout! 

The USD/CAD was closed at 1.34942 after placing a high of 1.35722 and a low of 1.34798. Overall the movement of USD/CAD remained bearish throughout the day. The USD/CAD pair posted losses for the 3rd consecutive day on Wednesday amid the weakness on the US dollar due to risk-on market sentiment. The reopening of economies has boosted the expectations of faster economic recovery and provide confidence to the investors that central banks and governments were there to underpin the global economy.

The US Dollar Index, which measures the value of the US dollar against the basket of six currencies, fell to its lowest since mid-March at 97.19, which ultimately dragged the USD/CAD pair with itself.

Meanwhile, the Bank of Canada held its interest rates at 0.25%, which BoC said is as low as it will go. According to Bank, the Canadian economy appeared to have avoided the worst-case scenario of the COVID-19 pandemic.

The Bank also started a number of debt & bond-buying programs in order to make sure that there will be enough cash in the system. Bank announced on Wednesday that it was still buying government bonds to make sure banks have enough money to lend to creditworthy borrowers. Bank also stated that the measures taken to reduce the coronavirus crisis’s effect on improving market conditions were having their intended effect. The Bank said that it was ready to adjust these programs if the market conditions suggest so.

According to the Bank, the effect of coronavirus has likely peaked, and the expectations of second-quarter contraction could be 10-20% rather than the predictions made beforehand. On the US front, despite upbeat market data, the US dollar remained under pressure due to increased risk-on sentiment, which added in the downfall of the USD/CAD pair on Wednesday. On the crude oil front, the WTI Crude prices surged above $38 level and supported commodity-linked currency Loonie. 


The negative figure of crude oil inventories from the United States as -2.1M rose Crude oil prices and helped Loonie to find traction in the market. The strong Loonie dragged the pair USD/CAD further, and hence pair dropped for the 3rd consecutive day. However, the upbeat economic data from the United States about the ADP Non-Farm Employment Change and ISM Non-Manufacturing PMI gave strength to the US dollar and kept a lid on additional losses of pair USD/CAD.

Daily Technical Levels

Support Resistance

1.3457 1.3552

1.3420 1.3610

1.3362 1.3647

Pivot point: 1.3515

On the technical side, the USD/CAD is trading sideways within a narrow trading range of 1.3550 – 1.3485. Breakout of this range will drive further trends in the USD/CAD pair. The bearish breakout of 1.3485 support level can open up further room for selling until the next support area of the area of 1.3395. The bullish breakout of 1.3550 level can lead the USD/CAD prices to be higher until 1.3625 and 1.3700 level, which marks 38.2% and 61.8% Fibonacci retracement levels. Let’s keep an eye on 1.3485 level to stay bullish or bearish below this level today. Good luck! 

Categories
Forex Signals

EURAUD – Expecting Fresh Bullish Incorporations

Description

The EURAUD cross in its hourly chart exposes an intraday upward sequence, which began at 1.60334, in where the price reacted mostly bullish, developing five internal moves that violated the descending trendline prevailing from the past week.

For the following trading sessions, we expect a limited retrace between levels 1.6177 and 1.6145, from where the price could find fresh buyers waiting to place their limit long positions. 

Our bullish scenario considers the potential retrace until 1.6177 from where the price could find fresh buyers, which could allow us to incorporate in a new rally with a potential bullish target at 1.6394.

The bullish scenario will be invalid if the price plummets and closes below 1.6077.

Chart

Trading Plan Summary

Categories
Forex Signals

Sellers Loom in the NZD/USD Pair – Fibonacci Retracement Expected! 

The NZD/USD pair is trading bearish at 0.6375 level in the wake of profit-taking in New Zealand. The growing optimism about the easing of lockdown restrictions in most of the countries fueled the hopes for the sharp V-shaped recovery for the global economy, which eventually undermined the safe-haven U.S. dollar. The reason for the selling bias in the U.S. dollar could be associated with the absence of any conflicting news from the US-China, which ultimately boosted the market’s risk sentiment.

As in result, the broad-based U.S. dollar was sold during the day and pushed the currency pair further lower. Whereas, the U.S. Dollar Index, which tracks the greenback against a basket of six other currencies, stood at 97.362, down 0.3%, fell to levels last seen in the middle of March.

Apart from this, the risk-on market sentiment was further bolstered by the positive news that U.S. President Donald Trump stepped back from its previous day’s decision to use Federal militaries to halt the on-going protests near White House. Consequently, the dollar can gain support and drive the selling trend in the NZD/USD pair.


Technically, the NZD/USD prices are holding in the overbought zone at 0.6387, and soon we can expect bearish bias in the pair. The 50 EMA is holding around 0.6233, which signifies that technically the prices should be trading around 0.6233 level. The MACD has also started closing smaller histograms, which are also suggestings that NZD/USD prices can go after 38.2% Fibonacci support, which holds around 0.63256 level. 

Entry Price – Sell 0.63986

Stop Loss – 0.63978

Take Profit – 0.63586

Risk to Reward – 1.00

Profit & Loss Per Standard Lot = -$400/ +$400

Profit & Loss Per Micro Lot = -$40/ +$40

Categories
Forex Signals

AUD/USD Enters Overbought Zone – Brace for Retracement

The AUD/USD was closed at 0.68969 after placing a high of 0.68985 and a low of 0.67747. Overall the movement of AUD/USD pair remained bullish throughout the day. The AUD/USD pair extended its previous day’s gains and continued it’s 3 days bullish rally for another day and moved above 0.68900 level on Tuesday on the back of the risk-on market sentiment. The risk-sensitive Aussie gained a lot from the increased risk appetite of the market on Tuesday.

Apart from that, RBA gave an optimistic outlook and stated that the pandemic’s global state was improving. These optimistic comments from the Reserve Bank of Australia also helped Aussie gain traction against the US dollar.

The Bank stated that over the past months, the infection rates were declined in many countries, and the easing of restrictions was also reported from across the globe. If this activity continued, then recovery for the global economy was on its way, which was already supported by large fiscal packages and the significant easing in the monetary policies from central banks.

The Bank stated that the Australian economy was facing its biggest contraction since the 1930s, but there were some signs of encouragement as the rate of new infections was declined, and there are possibilities that the depth of downturn will be less than the expected. Restrictions were also eased, and the working hours were increased, which would lead towards consumer spending and recovery of the economy.

Furthermore, RBA chose not to purchase further bonds and remained at the same level towards bond-buying, which was decided in the last meeting.

Aussie gained traction in the market after positive hopes from RBA, and it was already on the wings due to substantial risk appetite in the market. Combined support from these factors added in the Australian dollar’s daily gains against the US dollar, and the pair AUD/USD rose above 0.6898 level.

Furthermore, on the data front, at 6:30 GM, the Current Account Balance from Australia showed a surplus of 8.4B against the forecasted 6.3B and supported the strength of Aussie. The Company Operating Profits for the quarter were also increased to 1.1% against 0.0% expected and supported Aussie. The US dollar was weak across the board due to risk-on market sentiment after easing lockdowns from across the globe and increased local tensions due to protests added in the gains of AUD/USD pair.


Technically, the AUD/USD prices are in the overbought zone at 0.6900, and soon we can expect bearish bias in the pair. The 50 EMA is left far behind at 0.6580, which clearly signifies that technically the prices should be trading around 0.6580 level. The MACD has also started closing smaller histograms, which are also suggestings that Aussie prices can go after 38.2% Fibonacci support.

Entry Price – Sell 0.69227    

Stop Loss – 0.69627    

Take Profit – 0.68827    

Risk to Reward – 1.00

Profit & Loss Per Standard Lot = -$400/ +$400

Profit & Loss Per Micro Lot = -$40/ +$40

Categories
Forex Signals

Gold Violated Upward Channel – Stronger Dollar to Drive Sell-off! 

The safe-haven-metal prices failed to stop its previous day losing streak and dropped to $1,725.96 while representing 0.12% losses on the day as the US President Donald Trump did not use military power to stop the riots which fueled the risk-on market sentiment and pushed investors to withdraw their money from the safe-haven assets. 

The reason for the risk-on market sentiment could also be attributed to the slight optimism surrounding the coronavirus vaccine and the hopes of the economic restart, which also exerted some downside pressure on the yellow metal. The gold is currently trading at 1,726.49 and consolidating in the range between 1,721.04 and 1,732.12.

The tensions in the United States are showing the sign of slowing down mainly after the news that US President Donald Trump’s stepped back from its previous day’s decision to use Federal militaries to stop the on-going protests near White house, which eventually boosted the risk-on market sentiment. Moreover, the risk-on tone was further bolstered by the key US medical officer’s cautious optimism regarding the coronavirus (COVID-19) vaccine. As a result, the US 10-year Treasury yields gain 1.8 basis points (bps) to 0.697% while stocks in Japan, Australia, and China also report gains.

Looking forward, the market participants will keep their eyes on the US ISM Non-Manufacturing PMI, Factory Orders, and ADP Employment Change data. The US-China tussle and protest updates will not lose their importance.


Gold is still consolidating in a sloping trading area of 1,743 – 1,724, though it’s facing a hard time to violate beneath 1,724 level to touch 1,714 level. Closing of candles beneath 1,724 level today can force selling bias unto 1,717 and 1,714, particularly on the announcement of better than expected ADP non-farm payroll from the USA while resistance exists at 1,729 today.

Entry Price – Sell 1721.44    

Stop Loss – 1727.44    

Take Profit – 1715.44    

Risk to Reward – 1.00

Profit & Loss Per Standard Lot = -$600/ +$600

Profit & Loss Per Micro Lot = -$60/ +$60

Categories
Forex Signals

EUR/JPY On A Bullish Run – Quick Update on Trading Signal! 

The EUR/JPY is trading with a bullish bias at 121.400 after placing a high of 121.556. Overall the movement of EUR/JPY remained bullish throughout the day. The pair EUR/JPY started its week on the front foot as the Japanese yen faced pressure despite the increased protests across the US, which lead most of the investment into the European markets. 

Tens of thousands of protesters returned to the streets of cities around the US despite curfew orders on Monday. The protests were against the killing of George Floyd, a black man in police custody. Angry protests continued nationwide a week after George Floyd’s death.

On the data front, at 4:50 GMT, the Capital Spending for the quarter from Japan was increased by 4.3% against the declined forecast of 5.1% and gave strength to JPY. At 5:30 GMT, the Final Manufacturing PMI for May came in line with the expectations of 38.4 from Japan.

The stronger than expected data from Japan gave strength to the Japanese Yen and added in the downward pressure of the EUR/JPY pair, but the release of Spanish Unemployment Change from the Eurozone extended solid support the EUR/JPY, pushing it higher to highs of 121.600.


Technically the EURJPY is extending higher towards resistance area of 121.760, which is extended bu Fibonacci extension level of 227.20%. The recent bullish candles in the EUR/JPY supported the buying trend along with massive histograms, which are closing over 0, supporting bullish bias. Therefore, we decided to go long at 120.116 with a stop loss of around 119.616 and take profit at 120.616. 

Entry Price – Buy 120.116 

Stop Loss – 119.616 

Take Profit – 120.616

Risk to Reward – 1.00

Profit & Loss Per Standard Lot = -$465/ +$465

Profit & Loss Per Micro Lot = -$46.5/ +$46.5

Categories
Forex Signals

Safe Haven Boosts Gold – Who’s Up for Bullish Trade? 

The precious metal gold is trading with a bullish bias around 1,742 area, bouncing off above start support level of 1,736 level on the 4-hour chart. Most of the buying is fundamentally driven as the broad-based U.S. dollar is experiencing a sell-off on the day as investors turned into the safe-haven assets due to the latest retaliation between the U.S. and China. 

China stops the purchases of American soybeans and other U.S. agricultural goods. The reason for the weaker U.S. dollar could be attributed to the second wave of coronavirus. Moreover, the gains were further bolstered by the intensifying protest in dozens of U.S. cities over the death of George Floyd, which exerted some bullish impact on the safe-haven U.S. dollar and kept the gold prices under pressure. While 

Protesters occupying the area near the White House against the alleged killing of Minnesota’s George Floyd. As in result, U.S. President Donald Trump showed a willingness to use all the possible ways like “military or social” to take the situation under control. The absence of major data/events also contributed to the bullion’s profit-booking moves. Looking forward, due to the light calendar, the traders will keep their eyes on the qualitative catalysts for fresh impulse.


At this point, gold is likely to close three white soldiers ion 4-hour candles, which may lead the gold prices further higher until 1,749 area. On the higher side, gold’s immediate resistance holds at 1,742, and closing of above this level will confirm the bullish signal. On the higher side, we have placed buy trade at 1743.32 with a take profit at 1749.32 along with a stop loss around 1737.32    

Entry Price – Buy 1743.32    

Stop Loss – 1737.32    

Take Profit – 1749.32    

Risk to Reward – 1.00

Profit & Loss Per Standard Lot = -$600/ +$600

Profit & Loss Per Micro Lot = -$60/ +$60

Categories
Forex Signals

AUD/USD Take Bids Over 0.6830 Marks – RBA Left Rate Unchanged!

The AUD/USD currency pair flashed green and drew bids around above 0.6840 marks after the Reserve Bank of Australia (RBA) left monetary policy unchanged, which boosted the Aussie dollar and contributed to the currency pair’s gains. The Australian central bank gave optimistic comments about the domestic financial system while saying that the downturn’s intensity will be less than earlier expected, which also exerted some bullish impact on the Aussie. 

On the other hand, the fresh declines in the broad-based U.S. dollar in the wake of optimism about the global economic recovery from the COVID-19 virus also kept the currency pair higher. The AUD/USD is trading at 0.6820 and consolidating in the range between 0.6775 and 0.6817. Australia’s first quarter (Q1) Current Account Balance and Company Gross Operating Profits printed positive figures during the early-Asian session.

Despite the U.S.-China tensions and civil unrest in many U.S. cities, the broad-based U.S. dollar erased its some earlier gains as the safe-haven currencies including the U.S. dollar have few friends in the market during this time possibly due to the optimism over the global economic recovery from the COVID-19 virus which eventually provided some support to the currency pair. 

On the other hand, the on-going cautious mood surrounding the trading market turned out to be one of the major event that kept a lid on any additional gains in the currency pair, at least for now. However, the cautious sentiment in the market could be attributed to the civil drama in the U.S. over the alleged killing of Minnesota’s George Floyd. As in result, the U.S. President Donald Trump agreed to use all the necessary measures like “military or social” to stop the protests and riots. In the meantime, the Dragon Nation availed these headlines as an opportunity to criticize U.S. President Trump. 

The leader of Hong Kong, Carrie Lam, accused the United States on Tuesday of applying double standards in their response to protests in Washington as compared to their response to protests in Hong Kong. She also warned that Washington’s plan to place trade restrictions on financial hub would only hurt themselves.


The AUD/USD pair is trading distinctly upward near 0.6854 zones, particularly after making a bullish engulfing candle on the 4-hour timeframe. The AUD/USD pair has disrupted an upward channel, which is also supporting bullish bias in the pair over 0.6810 level. Over this level, the AUD/USD has the potential to approach the subsequent resistance level of 0.6910. 

Entry Price – Buy 0.6837    

Stop Loss – 0.6787    

Take Profit – 0.6887    

Risk to Reward – 1.00

Profit & Loss Per Standard Lot = -$500/ +$500

Profit & Loss Per Micro Lot = -$50/ +$50

Categories
Forex Signals

Gold Violates Triple Top Pattern – Quick Update on Buy Signal! 

The yellow metal gold prices surged above $1735 and continued its two days upward rally and posted gains for 3rd consecutive day. The demand for the safe-haven asset increased at the end of the week due to increased uncertainty in the market after the comments of the chairman of the Federal Reserve & the President of the United States on Friday.

The Federal Reserve Chairman, Jerome Powell on Friday defended an aggressive action to shield the U.S. economy from the coronavirus pandemic crisis and said that the central bank was days away from launching its Main Street Lending Program.

Powell added that Americans must feel safe and confident while shopping, eating at restaurants, or visiting public places without risking of catching infection for quick economic recovery, and that can only be done after tracking the spread of the virus, which has become more important measure than economic data. 


Taking a look at the technical side of the market, the XAU/USD is trading at 1,741 after having violated the 1,737 resistance level, which is now working as a support for gold. Above this level, gold still has odds of trading bullish until the next target level of 1,749/51. The leading indicator, such as MACD and 50 periods EMA are suggesting chances of bullish trend continued until the next target level of 1,752.  

Entry Price – Buy 1743.01    

Stop Loss – 1737.01    

Take Profit – 1749.01        

Risk to Reward – 1.00

Profit & Loss Per Standard Lot = -$600/ +$600

Profit & Loss Per Micro Lot = -$60/ +$60

Categories
Forex Signals

NZD/USD Ascending Triangle Pattern in Play – Quick Update on Signal! 

The NZD/USD currency pair flashed green and rose to 0.6230 level, mainly due to weaker crude oil prices, which undermined the commodity-linked currency the loonie and exerted some bullish impact on the currency pair. While, the broad-based U.S. dollar is selling bias rolled out to be one of the key determinants that held a lid on any additional gains in the currency pair, at least for now. As in result, the currency pair remained confined in a three-day-old trading range. 

The declines in the crude oil prices could be long-term as the Possible U.S. actions could include trade sanctions on China, which will likely influence the demand of oil that has been slowly recovering from the easing of lockdown restrictions all over the world and will also keep the Canadian Dollar weak.

Despite the on-going tension between the United States and China relation, which was caused by China’s national security laws for Hong Kong during the previous week, the U.S. dollar reported losses on the day. The weakness of U.S. Dollar was possibly due to the recent optimism about a possible COVID-19 vaccine and hopes of a global economic recovery. The decreased demand for safe-haven U.S. dollar eventually turned out to be one of the key factors that kept a lid on any additional gains in the pair. Whereas, The U.S. Dollar Index that tracks the greenback against a basket of other currencies slipped 0.09% to 98.258.


Taking a look at the technical side of the market, the NZD/USD pair has formed an ascending triangle pattern supporting the pair around 0.6190 along with resistance around 0.6230 level. On the higher side, a continuation of the upward channel may lead the NZD/USD prices further higher until 0.6260 level, but the recent breakout has turned out to be fake. However, the pair is still holding over 50 EMA support, which is a hope for the pair. 

Entry Price – Buy 0.6214    

Stop Loss – 0.6154    

Take Profit – 0.6274    

Risk to Reward – 1.00

Profit & Loss Per Standard Lot = -$600/ +$600

Profit & Loss Per Micro Lot = -$60/ +$60

Categories
Forex Signals

XAU/USD Trades Bullish Amid Trade Tensions – Update on Buy Signal! 

The safe-haven-metal prices took bids and rose to $1,721 while represented 0.15% gains on the day due to the risk-off market sentiment in the wake of intensifying tussle between the United States and China over Hong Kong. As well as, the US dollar selling bias also boosted the yellow-metal. At the press time, the safe-haven-metal prices are currently trading at 1,720.83 and consolidating in the range between 1,712.92 and 1,722.94. However, investors are cautious about placing any position ahead of an expected announcement by President Donald Trump on China later in the day.

It should be noted that the futures tied to the S&P 500, Wall Street’s benchmark index, was down 0.6%. Asian stocks also flashed red with Australia’s S&P/ASX 200 index leading the way lower with a 1.11% decline. 

As we all well aware that China has imposed the controversial security law on Hong Kong to curb the City’s autonomy earlier this week. In return, the US had warned that they would impose bans on China if China moves ahead with this law. So, the law has been implemented now, and all eyes are on President Trump’s actions ahead.


The XAU/USD prices are now holding below 1,725 level, which is extending resistance to gold, but the close of recent bullish engulfing candle is suggesting chances of further buying in gold. The downward channel seems to get violated now, and it’s keeping the gold in a bullish mode. We can try to capture a quick buy trade in gold in order to secure profit until 1,728 level. The RSI is also taking an upward turn and may cross below 50 to supported selling bias. 

Entry Price – Buy 1722.93    

Stop Loss – 1716.93    

Take Profit – 1729.93    

Risk to Reward – 1.17

Profit & Loss Per Standard Lot = -$700/ +$800

Profit & Loss Per Micro Lot = -$70/ +$80

Categories
Forex Signals

XAU/USD Trades Bullish Amid Trade Tensions – Update on Sell Signal! 

The yellow metal gold traded sharply bullish to hold around 1,720 area. Most of the buying in gold was safe haven driven, leading the gold prices towards the highs of 1,726. Below this, the XAU/USD is likely to close a doji candle, which suggests odds of bearish bias retracement in gold.

The risk appetite was still there in the market after the news of potential vaccine and drug for coronavirus. A company named Merck & Co., famous for its work on developing vaccines for Ebola, said on Tuesday that it was working on a drug to cure the infection and two vaccines to prevent it.

This optimism that the world would leave coronavirus behind it and start its routine before the vaccine development added in the pair’s gains. Besides, the statement from the U.S. came in and intensified the US-China anxieties. A day before, the United States Secretary of State, Mike Pompeo, notified the U.S. Congress that the Trump administration no longer consider Hong Kong as autonomous from mainland China which is also hiking safe-haven appeal in gold.


The XAU/USD prices are now holding below 1,724 level which is extending resistance to gold. It’s a downward channel which is keeping the gold underpressure around this level. We can try to capture a quick sell trade in gold in order to secure a correction until 1,713 level. The RSI is also taking a downward turn and may cross below 50 to supported selling bias. 

Entry Price – Sell 1721.14    

Stop Loss – 1728.14    

Take Profit – 1713.14

Risk to Reward – 1.14

Profit & Loss Per Standard Lot = -$700/ +$800

Profit & Loss Per Micro Lot = -$70/ +$80

Categories
Forex Signals

BTCUSD: Consolidation after double bottom

Bitcoin made a high-volume bullish candle after a double bottom touching the lower edge of its bullish channel. After bouncing off of its 200-SMA has created a consolidation channel in which you see two engulfing candles, after a bounce from the 50% level of the initial bull candlestick.

On the other hand, the Stochastic RSI indicator is in its lower side of the range, ready to make a crossover to upper levels. Thus, instead of waiting for the $9,300 break, we could test the strength of the market and make a spot order at the current levels with a relatively tight stop 100 pips under the current level and see if the strength shown continues.

The channel shown is a linear regression channel, with the edges separated + and – two sigmas from the real regression line. Thus a bounce off the -2-sigma edge means a value buy and a progression towards the consensus, or fair price, which is represented by the regression line shown in dotted gray/red. This action is a high probability event in this kind of mean-reverting market, such as is happening with Bitcoin. Moreover, the trade goes with the main upward trend. Thus the target is set conservatively below that level, at 9,740.

The levels

Buy entry: 9,203

Invalidation level: 9042

Profit Target: 9,741

Risk: $100 on each BTC purchased

Reward: $540 on each BTC purchased

Reward/Risk: 3.34

Categories
Forex Signals

XAU/USD Soars Amid Renew US-China Tensions – Update on Buy Signal! 

The yellow metal gold traded sharply bullish to hold around 1,719 area. Most of the buying in gold was safe haven driven, which lead the gold prices towards the high’s of 1,719 level. 

The statement from the U.S. came in and intensified the US-China anxieties. A day before, the United States Secretary of State, Mike Pompeo, notified the U.S. Congress that the Trump administration no longer consider Hong Kong as autonomous from mainland China.

Consequently, the demand for safe-haven assets got boosted as the U.S. withdraw preferential trade and financial standing that the previous British colony has owned since it was handed to China in 1997. It suggests all U.S. tariffs on China would spread to Hong Kong as well. It would also make a trip to the U.S. for Hong Kong citizens more complicated and would likely cause the departure of many refugees residing and operating in Hong Kong.

The XAU/USD prices traded sharply bullish soaring from 1,710 level to place a high around 1,719 level. The resistance level of 1,723 will be eyed now extended by a downward channel and can be seen on the 4-hour timeframe. The XAU/USD’s support is likely to be found around 1,710 and 1,702. Consider taking buying trades over 1,716 today. 


Entry Price – Buy 1716.63    

Stop Loss – 1710.63    

Take Profit – 1722.63    

Risk to Reward – 1

Profit & Loss Per Standard Lot = -$500/ +$500

Profit & Loss Per Micro Lot = -$500/ +$500

Categories
Forex Signals

GBPJPY Bearish Engulfing after double top at the upper edge of the descending channel

GBPJPY has been moving in a descending channel since April 10. The action created a lot of volatility, driving prices back and forth from top to bottom of the channel. The last iteration drove its price to surpass the upper limit, a +2 sigma event, which means the pair was overpriced if we compare it with what we may call the fair price, which is the linear regression channel, the red mid-line.

After the double top, a large bearish engulfing candle was drawn, confirming the reversal signal; thus, we can set up a short trade with entry at the current level, an invalidation point beyond the last top and a target at the projected linear regression point. The Reward/risk ratio of 2 is a conservative value that will ensure our long-term profitability.

Key levels:

Short-Entry:132.175

Take.profit:130.575

Stop-Loss: 132.965

Reward Ratio: 2.03

Risk:735 USD per lot, 73.5 USD per mini-lot.

Reward: 1,491USD per lot, 149 USD per mini-lot.

Position sizing: 2% Risk equals 3 micro-lots for every $1,000 balance in the trading account.

Categories
Forex Signals

GBP/USD Dropped From Two-Weeks High – Broad-Based US Dollar Strength! 

The GBP/USD currency pair failed to extend its previous day gains and dropped from the near 2-weeks high to 1.2320, mainly due to broad-based US dollar strength in the wake of risk-off market sentiment as tensions between the US-China are getting worse day by day. Whereas, the buyers failed to cheer the latest optimism about drug treatment for famous coronavirus (COVID-19). The GBP/USD is trading at 1.2323 and consolidating in the range between 1.2310 and 1.2348.

The reasons for the currency pair’s bearish sentiment could also be attributed to the latest allegations against the Tories about ignoring the lockdown guidance and distributing the virus funds to their own areas instead of supporting the more inferior parts of England, which eventually weighed on the GBP and contributed to its daily losses.

On the positive side, the currency pair’s previous bullish sentiment was bolstered by optimism about the usage of the famous Remdesivir drug for coronavirus patients. In the meantime, the report came that the drug appears to shorten recovery time for people with the virus was being made available on the National Health Services (NHS).

It should also be noted that the Remdesivir is an anti-viral medicine that was used against Ebola, and UK regulators have said that there was enough evidence to approve the use of this drug in selected COVID-19 patients.


The GBP/USD prices traded sharply bullish soaring from 1.2200 level to place a high around 1.2360 level. The resistance level of 1.2360 is extended by an upward channel, which can be seen on the 4-hour timeframe. The GBP/USD’s support is likely to be found around 1.2289 and 1.2165. Consider taking buying trades over 1.2292 and selling below the same level today.

Entry Price – Sell 1.23018    

Stop Loss – 1.23468    

Take Profit – 1.22518    

Risk to Reward – 1.11

Profit & Loss Per Standard Lot = -$450/ +$500

Profit & Loss Per Micro Lot = -$45/ +$500

Categories
Forex Signals

CADCHF Breakout of Triangle Pattern – Who’s Up for Buy Position? 

The CAD/CHF pair is trading with a bullish bias at 0.7020 level, having violated the resistance level of 0.7000 level. It seems like the improved crude oil prices and reduced demand for safe-haven swiss franc is brining buyers for the CAD/CHF pair. 

The increased hopes for a quick global economic recovery emerged after a potential vaccine trial for COVID-19 was reported on Tuesday, which increased the risk appetite in the market. The new developments in Brexit talks, which were reported earlier in the day, showed that the EU was ready to give up its demand for access to the UK’s fishing water added in the risk appetite. Adding in the risk-sentiment was also the easing of restrictions across the globe fromCOVID-19 lockdown, weighed on US dollar.


The CAD/CHF broke out of the ascending triangle pattern, providing resistance at 0.7000 level. A bullish breakout of this level is likely to lead the pair prices towards the next resistance level of 0.7066 as the MACD and RSI both are supporting an upward trend. At the same, the bullish engulfing around 0.7005 level has also driven a strong bullish sentiment for the pair. 

Entry Price – Buy 0.70174    

Stop Loss – 0.69724    

Take Profit – 0.70674    

Risk to Reward – 1.11

Profit & Loss Per Standard Lot = -$450/ +$500

Profit & Loss Per Micro Lot = -$45/ +$500

Categories
Forex Signals

Safe Haven Gold Slips – Downward Channel In Play! 

Gold prices were closed at $1710.53 after placing a high of $1735.38 and a low of $1708.78. Overall the movement of gold remained bearish throughout the day. Gold prices followed its previous day’s trend and continued to fall on Tuesday and reached near the level of $1700 support on the back of increased risk appetite in the market. The Risk-on market sentiment was caused by the reopening of the US economy from the coronavirus induced lockdowns.

From the American side, the US dollar remained under pressure against the Euro as the consumer confidence from the Conference board dropped to 86.6 against the expected 87.1 and weighed on the US dollar. The broad-based US dollar weakness pushed the already increasing XAU/USD prices lower on Wednesday.


The XAU/USD broke out of the descending triangle pattern, providing support at 1,718, and now it’s trading bearish at 1,706. The recent bearish trend in gold came in response to a downward channel supporting bearish bias among traders.

Entry Price – Sell 1708.81    

Stop Loss – 1715.81    

Take Profit – 1698.81    

Risk to Reward – 1.43

Profit & Loss Per Standard Lot = -$700/ +$1000

Profit & Loss Per Micro Lot = -$70/ +$100

Categories
Forex Signals

AUDJPY Advances in an Ascending Wedge

Description

The AUDJPY cross, in its 8-hour chart, shows the price action advancing in an ascending wedge pattern, which suggests the bearish continuation of the previous bearish trend.

Until now, the Oceanic cross completed four waves of Subminuette degree identified in green. For the following trading sessions, we expect a limited upside, which could develop a thrust as a false breakout completing the ascending wedge pattern.

Our conservative scenario considers a sell-side position if the price breaks and closes below the last low at 69.941. The potential bearish target locates at the end of wave iv in green at 67.680.

The bearish scenario will be invalid if the price soars and closes above 71.460.

Chart

Trading Plan Summary

Categories
Forex Signals

Gold Choppy Sessions Continues – Wait for Breakout! 

The safe-haven-metal prices regain its bullish traction and rose from a one-week low of $1,717.34 to $1,734.05, mainly due to the risk-off market sentiment in the wake of US-China intensified tussle and coronavirus (COVID-19) second wave fears. On the other hand, the U.S. dollar also draws safe-haven bids and managed to limit any additional gains in the gold prices. At this moment, the safe-haven-metal prices are currently trading at 1,734.97 and consolidating in the range between 1,724.50 and 1,735.55.

The reasons behind the gold pullback could be attributed to the tussle between the world’s top two economies, which was further bolstered by China’s indirect warning to the U.S., from the 13th National People’s Congress. As a Chinese speaker for the National People’s Congress, Zhang Yesui, said that China would strongly take its stand against the U.S. accuses and firmly defend its interest if the U.S. takes any action to ease the dragon nation’s core interests. 

Apart from this, China’s ruling Communist Party has set a controversial national security law in motion for Hong Kong separation. This law would be able to ban foreign interference, terrorism, and external interference aimed at collapsing the central government, which eventually fueled concerns about a major US-China tussle and sent the gold prices higher.

On the other hand, fresh upticks in the yellow metal are also driven by the report that showed the Asian major dropped its economic growth target, 6-6.5% for GDP in 2019. This eventually increased the market uncertainty because the world’s 2nd biggest economy faced much disappointment from the GDP, which pushed investors into the safe-haven metal.

At the coronavirus front, the second wave of coronavirus kept the market risk sentiment under pressure and urged the global policymakers to rethink their reopening of the economies. However, U.S. President Donald Trump recently clearly said he would not shut down the economy during the second round of the virus.

The U.S. dollar continued to draw the haven demand on the back of the US-China tussle. As in result, investors turned to the safe-haven dollar, which kept the global stocks under pressure. Whereas, The U.S. Dollar Index that tracks the greenback against a basket of other currencies was up 0.19% to 199.593 by 11:44 PM ET (4:44 AM GMT). However, the U.S. dollar bullish bias turned out to be one of the major factors that kept a cover on any further gains in the gold prices.

As a result, the U.S. 10-year Treasury yields continued to report losses near 0.70%, while Japan’s NIKKEI struggled for direction around 20,560 by the press.

Looking ahead, the U.S. dollar price action and risk tone will continue to influence the gold trades. However, the near-term sentiment around the yellow-metal may remain strengthened by the huge stimulus announcing globally to control the virus’s impact.


Daily Support and Resistance

S1 1676.16

S2 1702.89

S3 1715.19

Pivot Point 1729.63

R1 1741.93

R2 1756.36

R3 1783.1

Gold slipped sharply from 1,740 level to 1,717 support level, which was extended by the upward trendline on the 4-hour timeframe. Bullish trend continuation may drive buying until 1,745 level and even higher towards 1,754 level while bearish breakout of 1,717 can open further room for buying until 1,708 level. Odds of bullish bias remains strong today. Good luck! 

Categories
Forex Signals

EUR/GBP Breaks Upward Trendline – Quick Update on Sell Trade! 

The EUR/GBP pair continues to exhibit selling bais since European session as it’s prices fell from 0.8900 level to 0.8943 level on the back of weaker Euro and stronger GBP. The risk-off market sentiment was further bolstered by Trump’s action to impose restrictions on the use of China technology Huawei. In the meantime, the U.S. started an investigation about the origin of COVID-19, which also weighed on the market risk sentiment. 

The very harsh word from both sides, investors turned to the safe-haven dollar, which kept the EUR/USD currency pair under pressure. This eventually also puts the EUR/GBP pair under selling pressure. Whereas, The U.S. Dollar Index that tracks the greenback against a basket of other currencies was up 0.19% to 199.593 by 11:44 PM ET (4:44 AM GMT). 

At the coronavirus front, the number of reported coronavirus cases increased to 177,212, with a total of 8,174 deaths reported so far. Whereas, the claims rose by 460 in Germany on Friday against yesterday’s +745 while the death toll rose by 27, as per the German disease and epidemic control center, Robert Koch Institute (RKI).


For now, the EUR/GBP pair is holding bellow 0.8960 level after violating the upward trendline. Now the pair is also crossing below 50 EMA, which suggests chances of selling trend in the EUR/GBP pair. On the lower side, we may see the European cross pair heading south to test the next support area of 0.8900. 

Entry Price – Sell 0.89454    

Stop Loss – 0.89854

Take Profit – 0.88954    

Risk to Reward – 1.25

Profit & Loss Per Standard Lot = -$486.8/ +$608.5

Profit & Loss Per Micro Lot = -$48.8/ +$60.8

Categories
Forex Signals

GBP/USD Crosses Below 50 EMA – Brace for a Sell Position! 

The GBP/USD currency pair failed to stop its 3-day losing streak and dropped to 1.2212 and represented 0.09% losses on the day as the BOE Governor Andrew Bailey’s recent indication about negative rates weighed on the Cable. Moreover, the reason for the pair declines could also be attributed to the broad-based U.S. dollar strength in the wake of intensifying US-China tussle. The GBP/USD is trading at 1.2220 and consolidating in the range between 1.2201 and 1.2239. However, the traders will be cautious to place any strong position ahead of the U.K. Retail Sales data.

At the data front, the U.K. Retail Sales data is scheduled to release at 06:00 GMT on the day, which is expected to drop 16% MoM in April, following -5.1% seen in March. Total retail sales are expected to drop 22.2% during the entire year in the reported month, down from -5.8% booked previously.

In the meantime, core retail sales are also expected to represent the coronavirus (COVID-19) impact with -15.0% MoM and -18.2% YoY figures. However, the data is expected to spread disappointment as the survey period is linked to the virus-led lockdown. Generally, high figures will be seen as positive or bullish for the GBP, while a low reading will be seen as negative or bearish.


The GBP/USD continues to trade within the same technical levels, which we discussed a day before. The Cable is facing resistance around 1.2269 level, and it continues to develop doji and bearish engulfing candles below 1.2269 zones, which has driven a bearish retracement in the Cable. On the lower side, the Sterling may find support against the U.S. dollar around 1.2170 level. The MACD and 50 EMA are supporting selling bias in the pair. 

Entry Price – Sell 1.22073    

Stop Loss – 1.22473    

Take Profit – 1.21573    

Risk to Reward – 1.25

Profit & Loss Per Standard Lot = -$400/ +$500

Profit & Loss Per Micro Lot = -$40/ +$50

Categories
Forex Signals

USD/CAD Ascending Triangle Breakout – Brace for a Buy Position! 

The USD/CAD pair was closed at 1.39549 after placing a high of 1.39701 and a low of 1.38908. Overall the movement of USD/Cad pair remained bullish throughout the day.

At 17:30 GMT, the ADP Non-Farm Employment Change in April reported a job loss by 226.7K and weighed on Canadian Dollar. The New Housing Price Index (NHPI) for April exceeded the expectations of -0.1% and came in positive as 0.0% and supported Canadian Dollar. Mixed data from Canada failed to give an impact on the USD/CAD pair on Thursday.

Meanwhile, the WTI Crude Oil Prices surged to $34.6 on Thursday amid increased demand after easing of lockdown from all over the world. Increased oil prices gave strength to commodity-linked Loonie, which kept a lid on additional gains of USD/CAD pair.


On the technical front, the USD/CAD prices have violated the ascending triangle pattern, which can be seen in the chart above. The pattern was supporting the pair at 1.3935, along with resistance at 1.3965 level. On the higher side, the USD/CAD prices are holding above 1.3970 now, and these may go towards 1.4018 now. The MACD and 50 EMA are also in support of the bullish trend. 

Entry Price – Buy 1.39654    

Stop Loss – 1.39254

Take Profit – 1.40254    

Risk to Reward – 1.12    

Profit & Loss Per Standard Lot = -$400/ +$500

Profit & Loss Per Micro Lot = -$40/ +$50