Categories
Forex Signals

Gold Prices on a Bullish Run – Is It Going after 1,770? 

The safe-haven-metal prices extended its 4-day winning streak and rose to the fresh 7.5-year high of $1,760 level since November 2012 while representing 0.90% on the day, although the Federal Reserve’s President Jerome Powell rejected negative rate once again. However, the reason for the gold upticks could be attributed to the renewed tension between the US-China trade tussle. Whereas, the dollar index, which tracks the value of the greenback (gold’s biggest nemesis) against majors, is also sidelined near 100.34. At this moment, the yellow-metal prices are currently trading at 1,761.78 and consolidate in the range between the 1,743.02 – 1,764.73.

The central bank repeatedly showed disagreeability to using negative interest rates to respond to the economic impact of the coronavirus pandemic, Federal Reserve’s President Jerome Powell said CBS during a 60-minute interview held over the weekend. 

Despite this, the gold rose to multi-month highs mainly due to the White House trade advisor Peter Navarro said during his this week interview that China sent hundreds of thousands of passengers on aircraft to Milan, New York and around the world through planning to spread the virus after hiding it from all over the world for almost 2-months.

In the meantime, the reasons for the intensified trade tension could also be attributed to the statement to blocking chip supplies to Huawei Technologies. On the other hand, the uptick in the stocks, which usually have an inverse relationship with gold, also failed to erase gains in yellow-metal.

Whereas, the Federal Reserve Chair Powell said that both the Central bank and Congress should help the economy recover from the virus outbreak recession. As markets were pricing negative rates earlier this month, President Trump called them a gift enjoyed by other countries. However, Powell destroyed expectations for negative rates on Wednesday. Elsewhere, Bank of England (BOE) Governor Andrew Bailey and Bank of Japan (BOJ) Governor Haruhiko Kuroda on Thursday hinted that their focus is on bond purchases and other lending programs to keep borrowing costs low and recover the economy from the virus outbreak recession crisis.


Gold – Technical Outlook

Support Resistance 

1758.2 1771.4

1750 1776.4

1745 1784.6

Pivot Point 1763.2

Gold prices continue to trade on a bullish run, and it seems to head towards the next resistance level of 1,770. Overall this marks a 138.2% Fibonacci retracement level, which holds around 1,780 level. On the lower side, the precious metal gold may find support at 1,756 area and 1,738 area while the continuation of a bullish trend may lead to gold prices towards previously suggested target levels of 1,770. The 50 EMA and MACD both are supporting bullish bias for gold. Let’s keep an eye on 1,763 now to stay bearish below and bullish above this level. Good luck! 

Categories
Forex Indicators Forex Signals

How Do Forex Robots Actually Work?

What’s this about trading robots? Do they work? Are robots bad? Many questions are those that usually roll in the head when you hear the word “robot”. In the article I write today, I will try to expose what is this about Forex robots and everything that affects them, as well as some myths and realities. Let’s discuss…

How Do Forex Robots Work?

Before you start talking about how they work, do you know what a Forex robot is? A robot is nothing more or less than a few lines of code with clear rules of entry and exit to the market that are executed automatically. All this applied to the Forex market would simply be an automated strategy that buys and sells in the currency market. They are also called EA (Expert Advisor).

When I told you what it is, I explained how they work. But hey, can you make money with robots, or are they a scam? The performance or results of these automated strategies will depend on these previous strategies and their supervision, so if they are not profitable from the start, no matter how much they are automated they will not be. But if the strategy that is programmed is good, the result may be better.

Key Advantages

One of its great advantages is to be able to quantify the performance of the strategy that has been programmed. With a programmed strategy, you can perform a backtest and evaluate how that strategy has behaved before. If you have done discretionary or manual trading you will surely have tried different systems without having statistics or results of whether they have worked or not in the past. Come on, you’ve been playing with your money without knowing if what you were doing was profitable or not. Think for a moment, if you don’t quantify, how are you gonna know you’re making progress?

You need objectivity in making decisions when you make decisions. Otherwise, your results will be affected by your interpretation and here you have a good extra factor to make a mistake. How are you going to correct it? Systems or robots allow an objective market approach.

As you know, the accuracy of execution when trading is key. When you trade manually, you analyze wait for the moment and execute the order. When the process is automated, the order is released in less than a second without hesitation or analysis, or thoughts.

Another advantage more than considerable is that to execute the operations you do not have to leave your eyes looking at graphics for hours. You can do it uninterruptedly over time, even if you’re not in front of the screen. If you’re on a trip for a week or you have to do anything to stop you from being there, your operation may be running simultaneously. Be very clear, however, that they must be monitored and that the creation of automated systems requires time and work.

Closely related to the previous one, with robots you can trade in different assets simultaneously. Manually we are limited in this aspect. So you can diversify without problems.

And yes, the psychological approach. As you know, in this trading, psychology is important and it affects a lot. When the strategies are done in an automated way you reduce the psychological component quite a lot since your buying and selling decisions are not biased by your psychology. I say it’s reduced because you have to know that when robots have a negative or positive performance it will still affect you. But the main difference is that the results affect your psychology and not your decisions as it usually happens when operating in a discretionary manner.

Key Disadvantages

Although the advantages are clear, there are disadvantages. Most of the robots that are marketed on the Internet are based on martingales, grid. that reflect very good results and almost perfect performance curves but one day they break. Why? Because of the aggressive risk management rules they use. If you don’t think so, try downloading some for free and look at their results over a long period of time.

Why does this happen? Creating a good, cost-effective automated system is not easy. Programming a martingale or grid is not easy. So before you buy any robot, make sure they don’t use these techniques and that there’s no one hiding under a brand that can disappear tomorrow.

As for disadvantages when trading with robots something important is any technical failure that may arise and cause it not to run well. It is advisable to use VPS (a private virtual server) if this failure can affect your operation. I explain what a VPS is in this video:

Although it’s something that’s never happened to me yet, it is something that can happen. But it is as if the Internet connection fails. Also, failures or errors when programming the strategy (before executing it in real test it in demo or with very little capital).

Disadvantages are anything you might think might affect something that’s running remotely. Many such tasks already exist in different areas today.

What are the Limits of Robots?

We could say that robots do not work (always). I mean, there are systems that work perfectly for many years, but the vast majority die first. So? The solution is to have clear rules to disable these robots. If you don’t have an established plan, what are you going to do if your robot keeps losing money? Learn how to manage them.

Another limitation when using automated strategies is the over-optimization of parameters. What is that? Adjust your variables so that past results are very good. What’s the problem here? That we don’t know what’s going to happen on the market tomorrow, so it’s very likely that that robot won’t work well with new data when you apply it. Solution? Create a strategy and then validate it. Not the other way around. Remember that it is not about looking for perfect results, it is about getting real results.

Robots do not do magic, they have an added value with respect to manual trading that is quite clear, but it is something that you connect and you sit down to see how you drop the money. To take advantage of them is to be intelligent, but to ignore limitations is to be naive.

How to Choose A Forex Robot?

We talked about an important point earlier. Avoid using robots that apply aggressive risk management. If you’re going to choose a robot, spend some time contacting the person who created it, their background.

Don’t buy on pages you don’t know, in fact, I would tell you not to buy a robot as such but have expert supervision. As we’ve already seen, robots need to be managed. Be sure that you are able to learn to do all this by yourself in a simple way. You also have other alternatives in portals like Darwinex.

How to Program a Forex Robot

Today there are many tools to do so. From my experience, don’t get complicated and use those that allow you to start with a short learning curve. Some tips to create a good robot:

Set clear market entries and exits.

These things have to be made as easy as possible. You don’t need a thousand lines to make it work. Use the rule that your logic fits in a post it.

  • Always use stop-loss unless you don’t use any leverage.
  • Do it on assets that have liquidity so as not to pay a surcharge.
  • Schedule them to run in hours where there is volume on the market.

The Best Account Types

The most suitable accounts for trading with robots are the same as for manual trading. Accounts with low spreads, direct market execution, and adjusted swaps. Forex brokers are many, but with these features no longer so many. It is important that no use standard accounts or the behavior on the outcome curve you are going to get will be very different.

The Best Forex Robots

The best robots are the ones you know and create. Those that you can build in a simple way and also do different tests of robustness to know first hand their weaknesses and strengths.

For me, there are no good robots or bad robots. There are robots that work and there are robots that don’t work. I try to apply those who do and discard those who stop. I use more than a hundred strategies that I monitor daily and follow up. In this way everything is dynamic and although there are always strategies that do not work over a limited period of time, which is involved is that there are others that generate more than those.

Manual Trading or Robots?

Within the world of investment and trading, there are defenders of manual trading versus robots and vice versa. To say that manual trading doesn’t work seems very bold to me. In case a person hasn’t worked, why won’t it work?

After all, a robot can be a manual trading system that runs automatically. Provided that there are clear rules and a methodology, it is clear that both can be valid. Now, a forex robot has a number of advantages over manual trading that it doesn’t have. If we have the ability and the judgment that a person can have and the means to carry it out through robots, why not use both?

Categories
Forex Signals

How to Correctly Evaluate Forex Signals Prior to Using Them

Trading signals are becoming big business, really big business. People come into trading these days looking for the easy option and often signals are that. They can be both automated, whereby you simply sign up and that is it, they will do all the trading for you, simply copying the exact same trades as another account. The other option is a more manual style of signals, these signals are there a trader will put them up somewhere, like on a site or in a chat channel, you then need to copy them manually into your account, putting in the trade and the stop losses yourself, a little more work but you have a lot more control over your trades and accounts.

With so many different options out there, there are of course some good signals provided, but also some not so good ones, ones where if you were to follow them, there is a very high chance that you will probably lose most of your money. How do we know which is which though? From the outside, they all look pretty similar, it is someone giving a signal and you are either automatically copying it or manually copying it. Either way, you aren’t doing the hard work. So we need to work out how we can tell whether they are good signals or not, and that is what we are going to be looking at today, how we can evaluate the forex signals that we are looking at before we are actually using them.

Results

The first thing that will be obvious to us is the results of the signals, this is something that we need to be wary of, think about it, if a signal was making a lot of bad trades, would they advertise this? We would highly doubt this. Instead, they would either hold off on showing new results, freezing the results page with the most recent winning trades, they may also simply take out any losing trades from the results, or for the even more dishonest signal providers, they may make up the results entirely. This is something that some of the more shady ones do who only have the intention of stealing your money and not providing you with a good signal service.

One way of getting around this is to look for signal providers that have their results hosted on an independent site, there are various sites out there that can host accounts with their data streams coming directly from the brokers and accounts. This gives you a little extra reassurance that the results are real, but just be aware that some of the really sneaky ones can still manipulate the results, even on one of these verified sites through creating multiple accounts or managing to change the results that are sent to the site.

History

While the current results are great to see, it is also important to work out how they have done in the past, one thing to avoid is a signal provider that is not giving their history, this is most likely due to the fact that they have not done so well, and so they do not wish to show those results. The history of the results is what lets you know how long they have been going and also how consistent they are as signal providers. Once again, these can easily be manipulated and modified so you need to be aware of what is real and what is not, and which ones seem to be a little too good to be true.

Price

Price is a big thing for a lot of people, and it is for signal providers also. There are a number of different payment styles available, where is the one-off payment where a single charge is made for lifetime signals, the subscription model where you pay monthly or yearly for access to the signals, and a profit share, this is where you are expected to pay a percentage of your profits art the end of the month. All three methods have their pros and cons, but which you prefer to use will be up to you.

You also have to look at what the rice actually is, if you are paying $100 a month for a signal that is putting out a single trade signal per month then it is not exactly worth it, you will be spending more money on the signal than you will be making from the trades that it is putting out.

Trade Frequency

Consider how often the signal provider actually gives signals, there is no point in paying for a signal that is only putting out one or two trades a month, this simply won’t make you enough to cover the costs, and the work being put in may not be worth it. You also need to consider those that are putting out too many too, if a signal provider is putting out 10+ trades per day, then this may mean that they are simply throwing out loads of trades in the hope that the majority of them become profitable, both of these styles are ones that you want to avoid, instead looks for ones that are giving out the right amount of trades for the sort of strategies that they are using.

Communication

How are they communicating or is there even a way to get in contact with them? If you have questions, how will you ask them? It is important that there are ways to get in contact with the person that is giving out the signals, they need to be there in order to offer support for those using their signals. If there is not any way to get in touch with them, they are probably not serious about building up their signal or userbase, which probably means that they are not serious about their signals. This is a red flag for us and we would never join one without a way of contacting the provider. If they have methods to contact them, try asking a question or two before signing up, to ensure that they are around and willing to offer.

Other Requirements

You should also consider any other potential requirements that the signal provider sets, some of them put things in place like you needing to use a specific broker under their affiliate link, things like that can be ok, but we prefer to avoid them as it can lead to potential issues, especially as they may be able to manipulate things this way. If they try to put requirements on your accounts or you as a trader, then we would always use a little extra caution.

Those are some of the ways that you can evaluate a forex signal prior to actually using them. As with anything when it comes to money, you will need to ensure that you are aware of what you are doing and who you are giving money to, there are some fantastic signal providers out there, but also some awful ones.

Categories
Forex Signals

USD/JPY Double Top Pattern Set to Drive Selling – Signal Update! 

The USD/JPY pair is trading with a bullish bias at 104.350, and violation of this level is likely to lead the USD/JPY pair until the 104.745 level. On the lower side, the USD/JPY may find support at the 104.198 level. We can expect USDJPY to bounce off upon the 104.198 level today. On the 4 hour timeframe, the USDJPY pair is likely to close a doji candle below 104.368 level. If this happens, we may see a bearish correction in the USD/JPY pair. 


Entry Price – Sell 104.22

Stop Loss – 104.62

Take Profit – 103.82

Risk to Reward – 1:1

Profit & Loss Per Standard Lot = -$400/ +$400

Profit & Loss Per Micro Lot = -$40/ +$40

Fellas, now you can check out forex trading signals via Forex Academy mobile app. Follow the links below.

iPhone Users: https://apps.apple.com/es/app/fasignals/id1521281368

Andriod Users: https://play.google.com/store/apps/details?id=academy.forex.thesignal&hl=en_US

Categories
Forex Signals

EUR/GBP Downward Channel to Provide Sell Opportunity! 

On the 4 hour timeframe, the EUR/GBP pair is trading with a selling bais at 0.8850 level, facing immediate support at 0.8825 level. On the lower side, the EUR/GBP pair may find support at 0.8825 area, whereas violation of this can extend selling bias until the 0.8782 mark. The MACD and RSI support a selling bias, along with a downward channel that we can see on the four hourly timeframes. Here’s a trading plan for today…


Entry Price – Sell 0.88668

Stop Loss – 0.89068

Take Profit – 0.88268

Risk to Reward – 1:1

Profit & Loss Per Standard Lot = -$400/ +$400

Profit & Loss Per Micro Lot = -$40/ +$40

Fellas, now you can check out forex trading signals via Forex Academy mobile app. Follow the links below.

iPhone Users: https://apps.apple.com/es/app/fasignals/id1521281368

Andriod Users: https://play.google.com/store/apps/details?id=academy.forex.thesignal&hl=en_US

Categories
Forex Signals

USD/CAD Enters Overbought Zone – Quick Trade Idea! 

The USD/CAD pair was closed at 1.28019 after placing a high of 1.28224 and a low of 1.26851. Since January 11 on Wednesday, amid the US dollar’s broad-based strength and declining crude oil prices, the currency pair rose to its highest. The US Dollar Index measures the greenback’s value against the basket of six major currencies settled above 90.50 level and supported the US dollar. The US dollar gained traction in the market ahead of the US Federal Reserve monetary policy decision and its safe-haven status.

The risk-averse market mood driven by the rising fears about the negative impact of the lockdown restrictions provided support to the safe-haven US dollar. The US dollar strength remained intact even after the Federal Reserve policy announcement on Wednesday and pushed the currency pair USD/CAD higher on board.

The US Federal Reserve kept its interest rates near zero and asset purchase program at the same pace of $120 billion per month. The Bank stated that the US economic recovery remains moderate throughout the month. The economic path was dependent on the progress made in the pandemic and the vaccination program. These comments from the US Central bank and its Chairman gave strength to the local currency greenback that ultimately added gains in the currency pair USD/CAD on Wednesday.

On the data front, at 18:30 GMT, the Core Durable Goods Orders for December increased to 0.7% against the projected 0.5% and supported the US dollar that added further gains in the USD/CAD pair. In December, the Durable Goods Orders weakened to 0.2% against the projected 1.0%, weighed on the US dollar, and capped further upside momentum in the USD/CAD pair.

On the other hand, there was no macroeconomic data from the Canadian side, and on the West Texas Intermediate (WTI) crude oil front, the oil remained under pressure due to rising prices of the US dollar. The crude oil fell to $51.84 on Wednesday and weighed on the commodity-linked currency Loonie, which ultimately pushed the already rising USD/CAD pair. 


Entry Price – Sell 1.2879

Stop Loss – 1.2930

Take Profit – 1.2810

Risk to Reward – 1:1

Profit & Loss Per Standard Lot = -$400/ +$400

Profit & Loss Per Micro Lot = -$40/ +$40

Fellas, now you can check out forex trading signals via Forex Academy mobile app. Follow the links below.

iPhone Users: https://apps.apple.com/es/app/fasignals/id1521281368

Andriod Users: https://play.google.com/store/apps/details?id=academy.forex.thesignal&hl=en_US

Categories
Forex Signals

AUD/USD Get Ready for Bullish Correction – Buy Signal Update! 

The AUD/USD pair was closed at 0.76630 after placing a high of 0.77636 and a low of 0.76432. The AUD/USD pair reversed its direction on Wednesday and started posting losses for the day due to rising US dollar demand and risk-averse market sentiment. The risk-sensitive Australian dollar suffered on Wednesday as the risk-off market environment started to emerge over the rising concerns of the negative impact of current lockdown restrictions in many nations. The total number of coronavirus cases worldwide reached 100 million and was rising day by day that raised global economic concerns despite the vaccine rollout. These concerns added to the risk-off market sentiment and weighed on the risk perceived Aussie that ultimately dragged the AUD.USD pair on the downside on Wednesday.

The risk-averse market sentiment was also supported by the latest announcement from AstraZeneca and Pfizer, who reported a production difficulty and said that there would be a delay in vaccine delivery that ultimately raised the economic recovery concerns that were connected with the vaccination process. Meanwhile, the US and China’s rising disruptions were also supporting the risk-off market sentiment and weighing on the AUD/USD pair on Wednesday. The US President Joe Biden’s nominee for ambassador to the United Nations, Linda Thomas Greenfield, stressed the importance of US re-engagement with the 193-member world body to challenge China’s efforts to drive an authoritarian agenda.

Beijing has been challenging the traditional US leadership and pushing for greater global influence. The tension between the two superpowers reached its highest in the United Nations last year over the coronavirus pandemic. Greenfield stated that the US broadly has to re-engage with its allies and opponents as she criticized the Trump administration, particularly on its failed efforts to get North Korea to surrender its nuclear weapons program and for trying to “go it alone”.

She also added that Washington needed to pay its dues to the world body (UN). The United States that used to be the largest UN contributor, is currently in arrears about $2 billion for the peacekeeping budget and about $600 million for the regular budget. The fight for greater global influence between China and the US has weighed heavily on the global economy during Trump’s tenure and if the same continued during Biden’s presidency, then the global economy could suffer more. These concerns kept supporting the risk-averse market sentiment and pushed the US dollar that ultimately weighed on AUD/USD pair on Wednesday.

On the data front, at 18:30 GMT, the Core Durable Goods Orders for December improved to 0.7% against the predicted 0.5% and supported the US dollar, and added further losses in AUD/USD pair. In December, the Durable Goods Orders dropped to 0.2% against the predicted 1.0% and weighed on the US dollar.

From the Australian side, at 04:30 GMT, the MI Leading Index for January dropped to 0.1% against December’s 0.7%. At 05:30 GMT, the quarter’s CPI raised to 0.9% against the forecasted 0.7% and supported the Australian dollar that capped further losses in AUD/USD pair. The Trimmed Mean CPI for the quarter remained flat with the expectations of 0.4%. The NAB Business Confidence in December came in as 4 against the previous 13. 

Meanwhile, the US dollar’s strength due to the Federal Reserve monetary policy decision on Wednesday also kept the pair AUD/USD under pressure. The Fed kept its interest rates at the same level near zero and also maintained its asset purchase program at $120 billion per month. 

However, the US central bank said that the economic path was totally dependent on the pandemic progress and the vaccination program. This also supported the US dollar and weighed on AUD/USD pair.


Daily Technical Levels

Support Resistance

0.7688 0.7776

0.7635 0.7809

0.7601 0.7863

Pivot point: 0.7722

Entry Price – Buy 0.76188

Stop Loss – 0.75788

Take Profit – 0.76588

Risk to Reward – 1:1

Profit & Loss Per Standard Lot = -$400/ +$400

Profit & Loss Per Micro Lot = -$40/ +$40

Fellas, now you can check out forex trading signals via Forex Academy mobile app. Follow the links below.

iPhone Users: https://apps.apple.com/es/app/fasignals/id1521281368

Andriod Users: https://play.google.com/store/apps/details?id=academy.forex.thesignal&hl=en_US

Categories
Forex Signals

AUD/USD Bearish Bias Continues – Sell Signal In Play!

The AUD/USD pair was closed at 0.77473 after placing a high of 0.77540 and a low of 0.76686. After placing losses for 2 consecutive sessions, AUD/USD pair rose on Tuesday amid the turnaround of risk appetite in the market sentiment. The risk-sensitive Australian dollar gained traction on Tuesday after the positive vaccine news took hold of the market. The European equities, US stocks, and Bond yields rose during European trading hours amid the risk appetite in the market driven by attesting vaccine developers’ announcement.

Moderna and Pfizer announced that they were investigating work on the booster vaccine shots that will provide immunity even against the new variants like the one that emerged in UK, Brazil, and South Africa and promised to deliver them by 6-12 months. Whereas Johnson & Johnson also announced to release its vaccine data later this week and was very hopeful that their data will be robust and game-changer. As J7J has claimed that its vaccine will provide full immunity in a single shot, unlike other current vaccines that provide 90-95% immunity.
The rising risk sentiment because of the positive vaccine news gave strength to the risk perceived Aussie and supported the upward momentum in AUD/USD pair on Tuesday.

On the data front, at 19:00 GMT, the Housing Price Index from the US for November improved to 1.0% against the predicted 0.9% and supported the US dollar that capped further gains in AUD/USD pair. The S&P/CS Composite -20 HPI for the year also improved to 9.1% against the predicted 8.8% and supported the US dollar. At 19:59 GMT, the Richmond Manufacturing Index for January weakened to 14 against the predicted 18 and weighed on the US dollar and added gains in AUD/USD pair. At 20:00 GMT, the CB Consumer Confidence in January improved to 89.3 against the predicted 88.9 and supported the US dollar.

Despite strong macroeconomic data from the US, the US dollar failed to gain traction on Tuesday as the US Dollar Index fell by 0.2% on the day against the basket of major currencies. The decline in the US dollar could be attributed to the rebound in risk sentiment in the market. The weakness of the US dollar also helped AUD/USD pair to post gains for the day.

However, the AUD/USD pair’s gains were somehow capped as the tensions between the US & China escalated at the South China Sea. After the warning from Chinese President Xi Jinping, who said that if global leaders will try to intimidate or threaten others, then a new Cold War could begin and urged them to be united in the face of coronavirus pandemic. These developments weighed on China-proxy Aussie and capped further upside in AUD/USD pair on Tuesday.


Daily Technical Levels
Support Resistance
0.7677 0.7744
0.7646 0.7780
0.7610 0.7810
Pivot Point: 0.7713

Entry Price – Buy 0.7719
Stop Loss – 0.7759
Take Profit – 0.7679
Risk to Reward – 1:1
Profit & Loss Per Standard Lot = -$400/ +$400
Profit & Loss Per Micro Lot = -$40/ +$40
Fellas, now you can check out forex trading signals via Forex Academy mobile app. Follow the links below.
iPhone Users: https://apps.apple.com/es/app/fasignals/id1521281368
Andriod Users: https://play.google.com/store/apps/details?id=academy.forex.thesignal&hl=en_US

Categories
Forex Signals

NZD/USD Sell Signal Update – Quick Outlook! 

The NZDUD pair is trading at 0.7229 level, gaining immediate support around the 0.7224 mark. A bearish breakout of 0.7224 level can extend selling until 0.7214 and 0.7201. Conversely, a breakout of 0.7240 can lead the NZDUSD pair towards 0.7280.


Entry Price – Sell 0.72255

Stop Loss – 0.72655

Take Profit – 0.71855

Risk to Reward – 1:1

Profit & Loss Per Standard Lot = -$400/ +$400

Profit & Loss Per Micro Lot = -$40/ +$40

Fellas, now you can check out forex trading signals via Forex Academy mobile app. Follow the links below.

iPhone Users: https://apps.apple.com/es/app/fasignals/id1521281368

Andriod Users: https://play.google.com/store/apps/details?id=academy.forex.thesignal&hl=en_US

Categories
Forex Signals

USD/CAD Violates Upward Channel – Sell Signal Update!

The USD/CAD pair was closed at 1.27434 after placing a high of 1.27789 and a low of 1.26871. The USD/CAD pair continued its bullish movement for the 3rd consecutive session on Monday and reached above 1.27700 level amid the broad-based US dollar strength despite the risk-off market sentiment and the rising crude oil prices on the day.

The greenback gathered strength against its rivals after a sharp decline in EUR/USD pair triggered by the disappointing German Ifo Business Climate on Monday. The US Dollar Index climbed above 90.30 with the initial marker reaction and made the US dollar stronger on board, ultimately pushing the USD/CAD pair higher.

Another reason behind the rising US dollar prices was the speculations that the $1.9 trillion stimulus package proposed by Joe Biden is expected to face rejection by Democrats and Republicans in the Senate as they were not in favor of more spending just after a month in massive expenditures of $900 billion. The hopes that the US’s massive stimulus package will be delayed due to a difference of opinion gave strength to the US dollar that pushed the rising USD/CAD prices on Monday.

Meanwhile, the USD/CAD pair traders ignored the rising West Texas Intermediate crude oil prices on Monday. The crude oil prices rose by 1.5% on the day and supported the commodity-linked currency Loonie that ultimately capped further upside in the USD/CAD pair’s rising prices.

However, On Monday, Canada marked the anniversary of the first case of coronavirus that was identified in the country. After a year of living with the pandemic, Canada dealt with the increasing spread of new and more contagious variants. Canada reported six new cases of the UK variant of coronavirus and 3 cases of the South Africa variant of coronavirus on Monday, up from 4 and 1.

The rising number of new variant cases of coronavirus infections in Canada raised fears for the nationwide lockdown to curb the spread of this variant and raised threats for an economic recovery that ultimately weighed on the Canadian Dollar and added in the gains of USD/CAD pair on Monday. On the US front, the coronavirus deaths and cases per day in the US dropped markedly over the past couple of weeks but were still running at alarmingly high levels. The government’s top infectious disease expert Dr. Anthony Fauci said that improvement in numbers around the country appears to be the result of natural peaking and then plateauing after a holiday surge rather than an effect of the rollout of vaccines that began in mid-December. This diminishing rate of cases and deaths in the US added to the US dollar’s strength and supported the upward momentum in the USD/CAD pair on Monday.


Daily Technical Levels

Support Resistance

1.2715 1.2738

1.2703 1.2749

1.2693 1.2761

Pivot Point: 1.2726

Entry Price – Sell 1.27067

Stop Loss – 1.27467

Take Profit – 1.26667

Risk to Reward – 1:1

Profit & Loss Per Standard Lot = -$400/ +$400

Profit & Loss Per Micro Lot = -$40/ +$40

Fellas, now you can check out forex trading signals via Forex Academy mobile app. Follow the links below.

iPhone Users: https://apps.apple.com/es/app/fasignals/id1521281368

Andriod Users: https://play.google.com/store/apps/details?id=academy.forex.thesignal&hl=en_US


Categories
Forex Signals

AUD/USD Three White Soldiers – Downward Channel Set to Break! 

The AUD/USD closed at 0.77128 after placing a high of 0.77471 and a low of 0.76824. AUD/USD pair remained flat throughout the day as it ended its day at the same level it started its day with on Monday. The AUD/USD pair advanced higher during the European trading hours but reversed its gains in the second half of the day on the back of US dollar strength and the risk-off market sentiment. The risk perceived Aussie suffered when the rising global number of deaths and coronavirus cases raised fears for global economic recovery and surged the appeal for a safe-haven.

As the banks were closed due to Australia Day Holiday on Monday, the currency pair AUD/USD left with the US dollar market valuation. The US Dollar Index (DXY) climbed to 90.51 on Monday however struggled to remain there and preserve its bullish momentum. The rising greenback prices added weight to the AUD/USD pair, and the pair started to lose its early daily gains. The US dollar was also strong on board as the rival currencies, including Euro and British Pound, were weak on the day. As well, the prospects of the massive stimulus of $1.9 trillion in coronavirus relief fund were also fading in the market over the speculation of bill facing rejection at Senate. Senate has already passed a bill of 900 billion US dollars in the previous month, and there is very little possibility that they would agree to pass trillions of dollars in spending after a short passage of time.

These hopes also kept the US dollar stronger and continued weighing on the AUD/USD pair on Monday. Meanwhile, the risk-off market sentiment also kept the pair under pressure on the day. The rising number of coronavirus cases and death rate across the globe due to new variants of COVID-19 raised fears of nationwide lockdown in many countries that ultimately raised the question of global economic recovery and supported the risk-off market sentiment.

The risk-sensitive Aussie suffered in risk-off market sentiment and started to decline that ultimately dragged the pair AUD/USD further on the downside, and the pair closed its day on the same level it started its day with, giving flat movement for the day. On the data front, at 19:00 GMT, CB Leading Index from China raised in December to 1.2% against the previous 1.1% and supported the China-proxy Australian dollar, and capped further downside in AUD/USD pair.


Daily Technical Levels

Support Resistance

0.7706 0.7723

0.7698 0.7732

0.7688 0.7741

Pivot Point: 0.7715

The AUD/USD is trading at 0.7733 level, having formed three white soldiers on the two-hourly timeframe. On the higher side, the pair may find an immediate resistance at the 0.7745 level. Continuation of an upward trend can extend buying trend until 0.7745 level. A bullish breakout of 0.7745 level is also expected to trigger further buying until the next target level of 0.7776 level. The MACD is exhibiting a bullish crossover on the two-hourly timeframes, and the downward channel seems to get violated. I will be looking to take a sell trade if the Aussie manages to stay below the 0.7745 level. Good luck! 

Categories
Forex Signals

Oversold USD/CHF Exhibiting a Bullish Correction 

The USD/CHF pair is trading bearish at 0.8862 level, and the continuation of an upward trend can extend buying trend until the next target level of 0.8874 level. So far, the pair has completed 38.2% Fibonacci retracement at 0.8874 level. Since the 10 & 20 periods, EMA supports bullish bias along with the MACD and RSI levels. On the higher side, a continuation of an upward trend can lead the USD/CHF pair towards the next target level of 0.8892. Check out a trading plan below: 


Entry Price – Buy 0.88715

Stop Loss – 0.88315

Take Profit – 0.89115

Risk to Reward – 1:1

Profit & Loss Per Standard Lot = -$400/ +$400

Profit & Loss Per Micro Lot = -$40/ +$40

Fellas, now you can check out forex trading signals via Forex Academy mobile app. Follow the links below.

iPhone Users: https://apps.apple.com/es/app/fasignals/id1521281368

Andriod Users: https://play.google.com/store/apps/details?id=academy.forex.thesignal&hl=en_US

Categories
Forex Signals

EUR/JPY Enters Overbought Zone – Brace to take Sell Trade! 


The EUR/JPY is trading with a bearish bias at 126.285 level, holding mostly below the triple top resistance level of 126.400 level. Continuation of a selling trade can extend bearish bias until the 126 and 125.750 mark. The EUR/JPY pair’s strong selling bias is extended by 10 & 20 periods EMA seen on the hourly timeframe. Below these levels, the EUR/JPY may continue trading bearish and offer us quick 30/40 pips during the U.S. session today. Check out a trading plan below: 


Entry Price – Sell 126.11

Stop Loss – 126.51

Take Profit – 125.71

Risk to Reward – 1:1

Profit & Loss Per Standard Lot = -$400/ +$400

Profit & Loss Per Micro Lot = -$40/ +$40

Fellas, now you can check out forex trading signals via Forex Academy mobile app. Follow the links below.

iPhone Users: https://apps.apple.com/es/app/fasignals/id1521281368

Andriod Users: https://play.google.com/store/apps/details?id=academy.forex.thesignal&hl=en_US

Categories
Forex Signals

AUD/USD Sideways Trading Continues – Downward Channel in Play!

The AUD/USD pair was closed at 0.77101 after placing a high of 0.77696 and a low of 0.77017. After rising for three consecutive days, AUD/USD pair dropped on Friday as the US dollar was seen stronger on the week’s ending day. As well, the rising demand for safe-haven and risk-off market sentiment also weighed on the AUD/USD pair.

The risk-sensitive Aussie came under fresh pressure after the new variants of coronavirus from Britain and South Africa prompted many countries to impose further restrictions to curb the virus’s spread and raise economic recovery concerns. The US imposed travel bans from Brazil, UK, South Africa, and 26 countries from European Union to protect Americans from new variants of coronavirus. The new variants were said to be more deadly as the death rate across the UK reached its highest level in the world on Wednesday. The US has also seen a rise in the mortality rate as the total infection cases reached 25 million.
This worsened coronavirus pandemic concerns for the global economic recovery and raised the need for safe-haven and risk-off market sentiment that ultimately weighed on the risk-perceived Aussie. The weakness of the Australian dollar added to the losses of the AUD/USD pair on Friday.

On the data front, at 19:45 GMT, the Flash Manufacturing PMI improved to 59.1 against the predicted 56.6 and supported the US dollar that added more pressure on AUD/USD pair. The Flash Services PMI also improved to 57.5 against the predicted 53.3 and supported the US dollar that weighed on AUD/USD pair. At 20:00 GMT, the Existing Home Sales also improved to 6.76M against the predicted 6.55M and supported the US dollar that ultimately added more losses in the AUD/USD pair. From the Australian side, at 03:00 GMT, the Flash Manufacturing PMI for January raised to 57.2 against the previous 55.7 and weighed on Aussie that added more pressure over AUD/USD pair. The Flash Services PMI dropped to 55.8 against the previous 57.0 and weighed on the Australian dollar. At 05:30 GMT, the Retail Sales for December dropped to -4.2% against the forecasted -1.5%, weighed on the Australian dollar, and dragged the AUD/USD pair even lower.

Another reason behind the decline of the AUD/USD pair on Friday was the US dollar’s strength driven by the rising prices of US Treasury yields. The US Dollar Index that measures the value of the greenback against the basket of six major currencies rose by 0.1%on Friday and reached 90.243 level that ultimately gave strength to the greenback and added further pressure on the AUD/USD pair.

The US Dollar was weak in the past days as the hopes for a massive stimulus package from Joe Biden was expected. After taking his office, Biden has proposed a $1.9 trillion relief aid package to help the economy through the pandemic crisis, and now traders have mostly ignored it as it has already been priced in, and that is why the US dollar kept on rising on Friday and weighing on AUD/USD pair.


Daily Technical Levels
Support Resistance
0.7740 0.7780
0.7720 0.7802
0.7699 0.7821
Pivot point: 0.7761

The AUD/USD pair has violated the support level of 0.7745 level, and it’s holding below the same resistance level right now. On the lower side, the AUD/USD may extend the selling trend until the 0.7706 and 0.7676 level. The recent bearish engulfing candles are supporting selling bias in the AUD/USD pair. We should consider taking a selling trade below the 0.7745 level today. Good luck!

Categories
Forex Signals

Gold Closed 28 Pips – Brace for a Breakout Trade!

During Monday’s Asian trading session, the yellow metal prices failed to maintain their overnight bullish streak. They edged lower around the $1,855 level mainly due to the risk-on market sentiment, which tends to weaken the safe-haven yellow-metal prices as investors continuing a retreat from the safe-haven asset after renewed progress in U.S. stimulus measures.

Despite the ever-increasing infections of the covid strain outside the epicenter of Britain and South Africa, the market trading sentiment managed to stop its overnight negative performance and started to flash green on the day amid renewed hopes for additional U.S. fiscal stimulus measures. These hopes were triggered instantly after the incoming chairman of the U.S. Senate Budget Committee said that Democrats would use a rare procedural tactic to pass major parts of a Covid-19 relief package if Republicans refuse to move on the measure. In addition to this, the optimism over the rollout of vaccines for the highly infectious coronavirus disease was also exerting a positive impact on the market trading sentiment. As a result, the S&P 500 Futures print 0.20% intraday gains by press time of Asian session on the day.

At the USD front, the broad-based U.S. dollar failed to stop its long bearish bias and dropped further on the day as demand for the safe-haven assets declined amid progress toward agreeing on U.S. fiscal stimulus. Conversely, the declines in the U.S. dollar could be short-lived or temporary as the fresh COVID-19 worries and weak European economic data helps the safe-haven assets to stop t its bearish rally.


Gold traded in line with our forecast to test the support area of 1,850 level, but soon it started forming candles upward, supporting bullish reversal in the precious metal. Thus, we decided to close the trade manually with +28 pips. Soon we will open another position in gold to secure the next trade; let’s stay tuned. Good luck!

Categories
Forex Signals

EUR/JPY EMA Crossover Underpin Buying – Quick Update on Signal! 

The EUR/JPY is trading with a bullish bias at 126.285 level, holding mostly over the triple top resistance become support level of 126.169 level. Continuation of a selling trade can extend bullish bias until the 126.560 mark. The pair is also gaining support amid 10 & 20 periods EMA supporting bullish trend continuation in the market. The MACD and RSI are supporting an upward momentum in the EUR/JPY pair. On the hourly chart, we can see the pair has closed bullish engulfing, which may help support the EUR/JPY pair’s buying trend. Check out a trading plan below: 


Entry Price – Sell 126.274

Stop Loss – 125.874

Take Profit – 126.674

Risk to Reward – 1:1

Profit & Loss Per Standard Lot = -$400/ +$400

Profit & Loss Per Micro Lot = -$40/ +$40

Fellas, now you can check out forex trading signals via Forex Academy mobile app. Follow the links below.

iPhone Users: https://apps.apple.com/es/app/fasignals/id1521281368

Andriod Users: https://play.google.com/store/apps/details?id=academy.forex.thesignal&hl=en_US


Categories
Forex Signals

GBP/USD Sell Trade Continues – Three Sell Signals! 

The GBP/USD pair continues trading sideways between a narrow trading range of 1.3740 – 1.3703 level. On the lower side, a bearish breakout of 1.3703 level can extend the selling trend until the next support level of 1.3679 level. Conversely, the bullish crossover of 1.3740 can extend buying trend until the 1.3775 level. Let’s keep an eye on the 1.3700 level today.


Entry Price – Sell 1.36592

Stop Loss – 1.36992

Take Profit – 1.36192

Risk to Reward – 1:1

Profit & Loss Per Standard Lot = -$400/ +$400

Profit & Loss Per Micro Lot = -$40/ +$40

Fellas, now you can check out forex trading signals via Forex Academy mobile app. Follow the links below.

iPhone Users: https://apps.apple.com/es/app/fasignals/id1521281368

Andriod Users: https://play.google.com/store/apps/details?id=academy.forex.thesignal&hl=en_US


Categories
Forex Signals

AUD/USD Violates Upward Channel – Selling Setup Looms 

https://t.me/forexsignalsFA

The AUD/USD closed at 0.77647 after placing a high of 0.77819 and a low of 0.77387. AUD/USD pair rose for the third consecutive session on Thursday amid the rising risk-sentiment in the market and the broad-based US dollar weakness. The US dollar was weak on Thursday due to increased hopes for a large stimulus package worth $1.9 trillion from the US’s new Democratic government. Joe Biden, who took office on Wednesday, signed many executive orders to help the US economy cope with the coronavirus pandemic crisis.

The smooth transition supported the risk sentiment at the White House, and it supported the risk-sensitive currency Aussie that ultimately added in the upward momentum of the AUD/USD pair. On the other hand, the US dollar index that measures the value of the US dollar against the basket of six currencies fell by 0.2% to 90.04 level and weighed on the greenback that ultimately added in the gains of AUD/USD pair.

Meanwhile, at 05:00 GMT, the MI Inflation Expectations for December came in as 3.4% against November’s 3.5% on the data front. At 05:30 GMT, the Employment Change from Australia remained flat at 50.0K. The Unemployment Rate from Australia for December dropped to 6.6% against the forecasted 6.7% and supported the Australian Dollar that added further gains in AUD/USD pair. 

From the US side, at 18:30 GMT, the Philly Fed Manufacturing Index for January improved to 26.5 against the predicted 11.2 and supported the US dollar that capped further upside in AUD/USD pair. The Unemployment Claims from last week were reduced to 900K from the predicted 930K and supported the US dollar. For December, the Building Permits improved to 1.71M against the predicted 1.60M and supported the US dollar. The Housing Starts from December also improved to 1.67M against the predicted 1.56M and supported the US dollar that limited the AUD/USD pair’s gains. 

Despite the strong macroeconomic data and less than expected unemployment claims from the US, the AUD/USD pair continued posting gains on Thursday as investors’ focus remained over the rising hopes for further stimulus measures from the US government and the US dollar’s weakness.

The AUD/USD pair was also rising because of the expansion in China’s GDP in the fourth quarter of 2020 by 6.5%. It made the country one of the few in the world to register positive growth for the year and supported the China-proxy Aussie that ultimately added gains in AUD/USD pair.


Daily Technical Levels

Support Resistance

0.7716 0.7780

0.7677 0.7803

0.7653 0.7843

Pivot Point: 0.7740

The AUD/USD pair has violated the support level of 0.7724 level, and it’s holding below the same resistance level right now. On the lower side, the AUD/USD may extend the selling trend until the 0.7696 level. The recent bearish engulfing candles are supporting selling bias in the AUD/USD pair. We should consider taking a selling trade below 0.7724 level today. Good luck! 


Categories
Forex Signals

Gold Supported Over Double Bottom – Brace for a Breakout Setup! 

During Friday’s Asian trading session, the safe-haven-metal failed to extend its previous-day winning streak and drew some offers near the $1,860 level as the Biden administration’s plans of huge spending to stimulate the U.S. economy undermined the safe-haven yellow-metal prices aggressively. It is worth recalling that the yellow metal refreshed a 2-week high on the previous day amid the weaker U.S. dollar, but the upticks were short-lived and temporary as the stimulus hopes and upbeat U.S. jobs data started to probe the gold bulls afterward. Besides this, the optimism over a possible coronavirus vaccine also played its major role in weakening the safe-haven yellow-metal prices. 

On the different page, the downbeat comments from U.S. President Joe Biden over the coronavirus condition, as well as the recently appointed US Centers for Disease Control and Prevention (CDC) Director’s fresh doubts over the availability of vaccines, were seen as the key factors that could help the yellow-metal prices to limit its deeper losses. Meanwhile, the heightened trade/political war between the U.S. and China could also play its positive role in supporting the safe-haven yellow metal.

Across the pond, the broad-based U.S. dollar bearish bias, triggered by the prospects of massive fiscal spending in the U.S., was also seen as one of the key factors that cap losses for the yellow metal as the price of gold is inversely related to the price of the U.S. dollar. As of writing, the yellow metal prices are currently trading at 1,862.74 and consolidates in the range between the 1,860.15 – 1,870.87.

Looking forward, the market traders will keep their eyes on preliminary readings of January’s activity numbers from the U.K., the U.S., and Europe for fresh directions. In addition to this, the updates about the U.S. stimulus package will also be key to watch. 


Daily Support and Resistance

S1 1834.44

S2 1851.21

S3 1860.76

Pivot Point 1867.99

R1 1877.54

R2 1884.76

R3 1901.54

Entry Price – Sell 1857.76

Stop Loss – 1863.76

Take Profit – 1850.26

Risk to Reward – 1:1

Profit & Loss Per Standard Lot = -$400/ +$400

Profit & Loss Per Micro Lot = -$40/ +$40

Fellas, now you can check out forex trading signals via Forex Academy mobile app. Follow the links below.

iPhone Users: https://apps.apple.com/es/app/fasignals/id1521281368

Andriod Users: https://play.google.com/store/apps/details?id=academy.forex.thesignal&hl=en_US


Categories
Forex Signals

Bearish Bias Dominates USD/CAD – EMA Extends Resistance  

The USD/CAD pair is trading with a selling bias at 1.2619 level, facing an immediate resistance around 1.2630 level. The USD/CAD pair is stuck in between a narrow trading range of 1.2630 – 1.2612 level on the two-hourly timeframes. On the lower side, a bearish breakout of 1.2612 level can extend selling bias until the next support level of 1.2580 level. Conversely, an upward crossover of 1.2630 can send the USD/CAD pair further higher until the 1.2665 level. The MACD and RSI are in support of the selling trend today. 


Entry Price – Sell 1.26125

Stop Loss – 1.26525

Take Profit – 1.25725

Risk to Reward – 1:1

Profit & Loss Per Standard Lot = -$400/ +$400

Profit & Loss Per Micro Lot = -$40/ +$40

Fellas, now you can check out forex trading signals via Forex Academy mobile app. Follow the links below.

iPhone Users: https://apps.apple.com/es/app/fasignals/id1521281368

Andriod Users: https://play.google.com/store/apps/details?id=academy.forex.thesignal&hl=en_US

Categories
Forex Signals

USD/JPY Violates Triple Bottom – Sell Signal Update! 

The USD/JPY continues to trade sideways in between a wide trading range of 104.340 – 103.560. The USD/JPY has formed a sideways channel on the 4-hour timeframe, and it has the chance of leading the pair towards the next resistance level of 104.800 upon the breakout of 104.810. The 50 periods EMA supports the bullish trend, and we may have odds of taking a buying trade over the 103.570 level today. Good luck! 


Entry Price – Sell 103.385

Stop Loss – 103.785

Take Profit – 102.985

Risk to Reward – 1:1

Profit & Loss Per Standard Lot = -$400/ +$400

Profit & Loss Per Micro Lot = -$40/ +$40

Fellas, now you can check out forex trading signals via Forex Academy mobile app. Follow the links below.

iPhone Users: https://apps.apple.com/es/app/fasignals/id1521281368

Andriod Users: https://play.google.com/store/apps/details?id=academy.forex.thesignal&hl=en_US

Categories
Forex Signals

AUD/USD Upward Bias Continues – Upward Channel Supports! 

The AUD/USD currency pair maintained its previous session bullish bias and hit the intra-day high around above mid-0.7700 level mainly due to the all-time high gains in S&P 500 futures, which lent strong support to the perceived risk currency Australian dollar and contributed to the currency pair gains. The market trading sentiment was being supported by the hopes for additional U.S. fiscal stimulus measures and optimism over the rollout of COVID-19 vaccines. Moreover, the currency pair gains were further bolstered by the broad-based U.S. dollar bearish bias, which was triggered by multiple factors. 

Across the pond, the buying interest around the currency pair got an additional boost following the release of better-than-expected domestic employment details. On the negative page, the long-lasting coronavirus woes and Sino-US tensions remain on the card, which might cap the pair’s upside momentum. The AUD/USD currency pair is currently trading at 0.7771 and consolidating in the range between 0.7742 – 0.7778.

The global risk sentiment was being supported by hopes over the more aggressive fiscal spending under Joe Biden’s presidency, which will boost economic growth. Biden expressed a plan to inject $1.9 trillion into the struggling U.S. economy during his first hours as the new U.S. President. Besides this, the optimism over a potential vaccine/treatment for the highly infectious coronavirus also played its heavy role in supporting the market trading sentiment. The Oxford scientists showed a willingness to make a new formula-vaccine to combat emerging strains. Meanwhile, the World Health Organization (WHO) also supports the faster rollout of the covid vaccines. These positive developments put a bid under the U.S. stocks, lifting major indices higher, which was seen as one of the key factors that undermining the safe-haven greenback.

As in result, the broad-based U.S. failed to gain any bid and remained pessimistic on the day. Apart from this, the losses in the U.S. dollar were further sparked by the optimism over the rollout of vaccines for the highly contagious coronavirus disease. Hence, the losses in the U.S. dollar becomes the key factor that kept the currency pair higher. The U.S. Dollar Index that tracks the greenback against a bucket of other currencies dropped by 0.19% to 90.300 by 11:26 PM ET (4:26 AM GMT).

Across the pond, the buying interest around the currency pair got an additional boost following the release of better-than-expected domestic employment details. On the data front, the Aussie unemployment rate dropped to 6.6% in December. These figures were below consensus estimates, pointing to a downtick to 6.7%, and marked the lowest level since April. Meanwhile, the economy added 50,000 jobs during the reported month. Conversely, the slowdown in full-time employment may hold buyers from placing aggressive bets.

Across the Atlantic, the intensifying coronavirus woes keep challenging the upbeat market performance and become the key factor that kept the lid on any additional gains in the AUD/USD currency pair. Also, capping the gains could be the long-lasting tussle between the U.S. and China, which is picking up the pace day by day as China recently declared a list of 28 U.S. individuals, most of whom are Trump team members, to be sanctioned.

Looking forward, the market traders will keep their eyes on updates from the Biden administration. Meanwhile, the European Central Bank’s (ECB) monetary policy and U.S. Unemployment Claims will also be key to watch. In addition to this, the risk catalyst like geopolitics and the virus woes will not lose their importance. 


Daily Support and Resistance

S1 0.7662

S2 0.7703

S3 0.7724

Pivot Point 0.7743

R1 0.7765

R2 0.7783

R3 0.7823

Entry Price – Buy 0.77758

Stop Loss – 0.77358

Take Profit – 0.78158

Risk to Reward – 1:1

Profit & Loss Per Standard Lot = -$400/ +$400

Profit & Loss Per Micro Lot = -$40/ +$40

Fellas, now you can check out forex trading signals via Forex Academy mobile app. Follow the links below.

iPhone Users: https://apps.apple.com/es/app/fasignals/id1521281368

Andriod Users: https://play.google.com/store/apps/details?id=academy.forex.thesignal&hl=en_US

Categories
Forex Signals

A Prop Traders’ Take on Expert Advisors

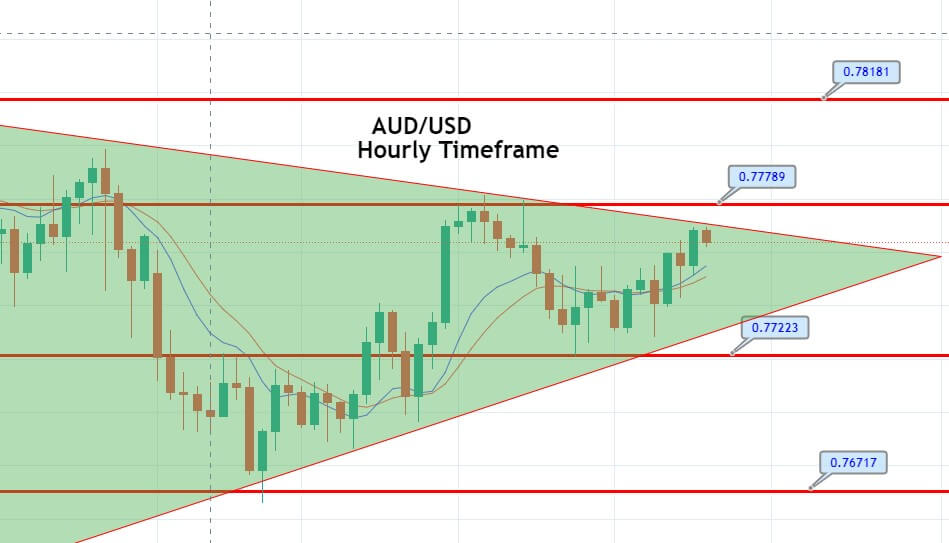
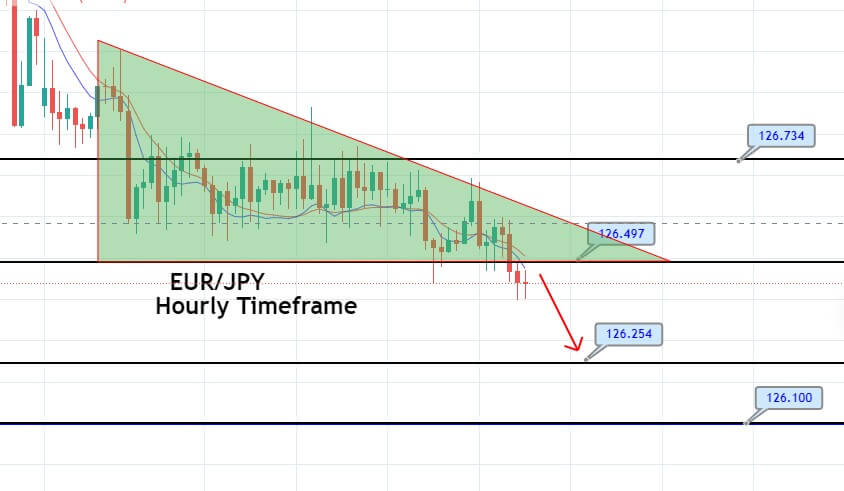
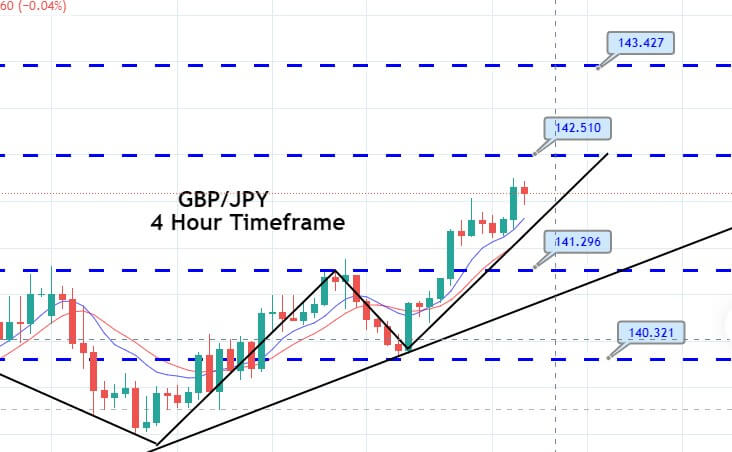
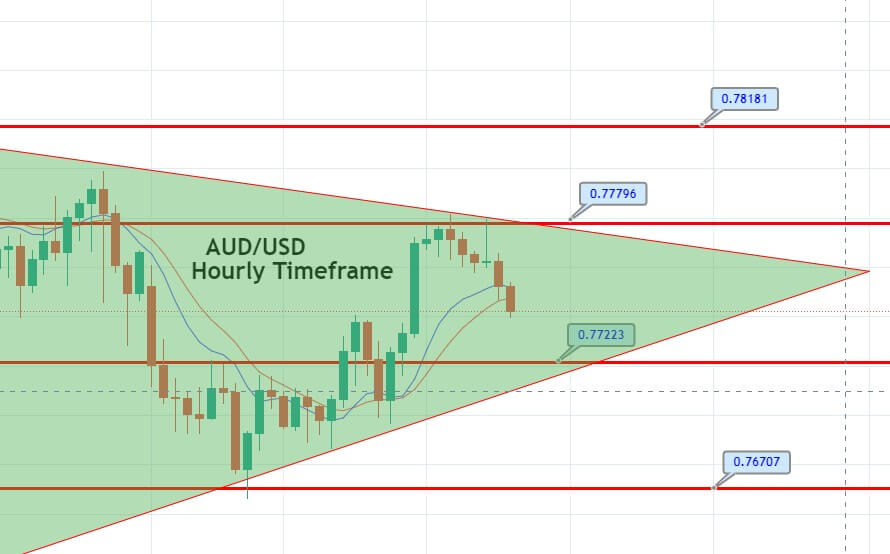
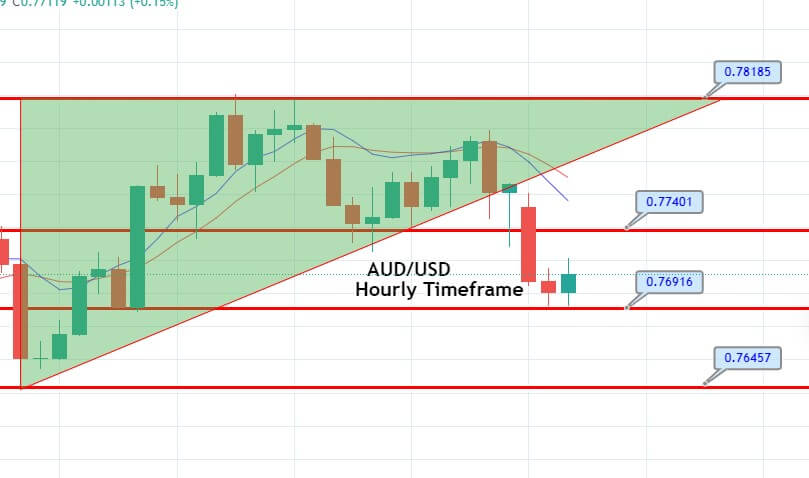
As trading in the currency market may be a completely dissimilar experience for different traders, a single piece of advice may also apply differently across different people’s careers. If you feel that a specific set of instructions is not working out for you, while others seem to be doing quite well following the exact same steps, understand that there are more things at play aside from technical suggestions and tools.

Money management, trading mindset, and overall psychology sometimes seem to be the main determinants of one’s success, which are only topped up by their pristine routine and theoretical knowledge. In fact, some experts assume that whichever way you decide to go about with a specific currency, be that long or short, is by far less important in comparison to an individual’s money management skills. Naturally, traders may want to take all preventative measures to increase their chances of succeeding while decreasing their losses. Some other specifics of forex trading, such as entry points, can thus be perceived as an additional vehicle that could help traders ensure smooth trading in the spot forex market.

Even more importantly, the understanding that the means to becoming a successful trader are naturally diverse, which further implies that traders can always discover a new, easier method that could land them more pips than ever before. Due to supporting the maintenance of an inquisitive approach, this article covers the topic of expert advisers in an attempt to assess and present some important conclusions regarding this matter and provide forex traders with more opportunities to expand their vision concerning this market.

Forex expert advisors, or in other words robots, stand for a program created for the purpose of managing a trade more efficiently and earning more money as a result. Once plugged in any trading or charting software connected to a trader’s account (Metatrader 4 as the most widely used today), an expert advisor is meant to give signals and guide individuals throughout the trade on the basis of the program. The programmers behind these algorithms which are aimed at directing traders in their trades create codes that serve as a business plan. As code writing is a lucrative business, many seem to be interested in creating these programs and selling them for a particular fee despite not really knowing much about the market itself, which is unfortunately quite often the case.

As the aim of every trader is to establish a continual flow of income, this solution may seem like a perfect fit for anyone who is less impressed by the challenges of sitting long hours at the computer trying to grasp the essence of this market. Owing to high demand for any driver that could bring money with less effort, expert advisors have grown to become a large industry as they are now sought by many currency market participants. 

While market enthusiasts who can navigate the programs to their benefit may certainly exist, anyone attempting to secure their financial stability via code is advised to exercise caution. The best approach to discovering and using an expert advisor (or EA) includes properly conducted research and testing as any rash, blind purchase on a random website may turn out to be quite costly in the end, both literally and figuratively. Any product advertised online will typically have a carefully structured description that was designed in a way to appeal to a potential customer, so the manner in which a product is advertised does not necessarily confirm its effectiveness and efficiency. Many traders sharing their experiences with these robots online have seen the dark side of this business, as they claim to have tried a wide range of different EAs before disappointment sparked their interest in understanding the market and the tools better.

Some prop traders even seem entirely certain that finding a valid robot to manage people’s trades effortlessly on their behalf is rather arduous work, further stressing the importance of carrying out detailed research that would prevent any misfortunate outcomes from happening. The likelihood of getting hold of a good EA is, therefore, not impossible, yet the task itself is just incredibly challenging. Should you, however, be able to get your hands on one such good EA, a number of prop traders would assume that your battle for securing a stable money flow would then be over, as your program would in that case be providing you with stable wins in a row. 

The chapter of expert advisers then truly requires traders to challenge and analyze any EA that they come across, especially because, as discussed above, many codes have been written by programmers who possess little knowledge of the nature of forex trading. Whereas some experts in this market did think about atomizing their algorithms, they decided not to go along because they realized that the technical side is precisely that – a side or one side of the story, and how any trade they have ever entered required a fair share of intellectual work as well. Programs simply cannot account for this aspect of human existence or ability, which significantly reduces any program’s chance of being a sole tool for traders to rely on.

In addition to the human factor described above, there is another aspect of the spot forex market that a program of this sort is highly unlikely to track or take into consideration. As many traders already know, the currency market often undergoes many changes, so we go from periods of consolidation to quite volatile market moves, sentiment-caused reactions, and the impact of news events, among others. Unfortunately, these programs are often only designed to work properly under one such market condition, which could make any trader believe it is a work of art, but only for a while, that is until the market changes its modus operandi.

Many traders primarily seek this product so as to avoid the strenuous process of learning that naturally slows down the time span required to start making money from trading currencies. The desire to escape the reality of doing a job we dislike, living in underdeveloped countries, becoming rich quickly or any other reason that involves the need to rush things for that matter inevitably reduces traders’ odds of making their forex trading career take off. These are some of the main causes of failure in this market and most probably the sole reason behind the longevity of this robot industry. Prop traders, who are incredibly well versed in all aspects of the forex market, often describe the EA industry as a game for luring impatient individuals into falling for a scamp, may it be for at least a few months before they turn around and accept the sobering reality.

The pool of traders who display insatiable hunger for success never seems to be able to dry up, so in order for you to take necessary precautions and protect your finances, you should note down several key steps to follow before signing any contracts or paying some of your money. One of the first and most important points to consider includes results, as this is essential data that many companies omit in their product descriptions.

Actual numbers and tangible results are vital and they ought to back up any convincing story used for advertising a program of this kind. It is interesting how these same products are still sold despite the lack of quantitative information that traders should seek prior to the purchase. If you just quickly investigate these companies with your browser now, you would be able to discover that traders are mainly asked to trust the program and the selling company rather than form their opinion based on some real evidence. 

Aside from evidently refraining from supporting their claims with numbers, these EA selling companies also often use quite manipulative tactics to blur traders’ vision and trap them quickly before they figure out the true nature of the product. These sly maneuvers frequently entail adding a spreadsheet with numbers that have no realistic grounds. The companies often insert the data that they create freely and present them as real evidence of a product’s quality. So, should you see any factual information concerning the number of pips produced in a month, you should really think twice and seek to find more information about the company and the product.

In spite of their fraudulent nature, these companies seem to be in the clear when it comes to penalties and punishment. The fact that such companies can simply get away with these activities can be connected to their country of establishment, which are typically either quite far away or do not need to obey international law.

Playing with numbers is unfortunately only one of many different manners the robot industry can trick traders – for example, any such program can be created in such a way that traders are presented with some unbelievably good, blow-out-of-the-proportions data, when in fact the money management was just tweaked to exaggerate any wins. What is more, these programs can also be developed so as to only show you the wins, while any losses are simply not included in the calculation. While the information on the wins may even prove to be legitimate, the number of hidden losses may substantially exceed the wins. 

Some sellers may decide to show you a top-winning robot based on having a large number of accounts and different robots running on each of them. Some others may try to lure you with a promise of earning a staggeringly high number of pips which is simply impossible in reality. These linguistic games also include presenting information on an impressive return that is, unfortunately, a product of overleveraging, which only tells you that the risk of your account being wiped out has increased instantaneously. These tricks are numerous, yet the companies will see your account go down and it is not them who will have to worry about the consequences, which is why every trader needs to make sure that he/she obtains all the information in advance.

Strategies such as Martingale, for example, make traders double up every time they lose until they finally win, which is followed by a break-even, offering them to keep all their wins. Alas, if this approach led to anything good in the long term, people would not be losing their houses in casinos. In addition, some other sources that once used to be credible, such as MyFXBook – a website used for tracking results, are no longer classified as trustworthy due to alterations done intentionally to get to traders. Therefore, anything offered so freely, disguised under the “genuinely altruistic” or “highly efficient” tag, has probably been compromised for the purpose of amassing a fortune on the basis of your misfortune. 

 As invested and deep researchers of all matters pertaining to the spot forex market, prop traders are likely to leave room for finding an EA that actually works well and does not conceal any valuable information. Nevertheless, even if you believe that you have found “the one you have been looking for,” give yourself the benefit of properly (forward) testing it before you actually invest real money.

The best and the safest way to acquire in-depth knowledge about your program of choice is to use your demo account and really invest your time and effort into assessing this product over a longer period of time. Traders may need a minimum of one month before they are able to see how these expert advisors operate, which is why extending this testing process to a few more months, without feeling scared of investing since fake money is used, may be the wisest decision before committing to tying your real account to one of these programs.

The percentage of dissatisfied customers is said to be extremely high among the group of traders who have purchased and used these programs in the past. The one way you can protect yourself against the robot industry’s creative tricks is to carry out extensive research and maintain a degree of suspicion regardless of the testimonials or results that the related companies may present on their websites. Should you decide to indulge and purchase one of the EAs whose advertisement you found to be credible, you should definitely demo test it and track the results for a period of one month at least. Only once you have accumulated the results you are satisfied with can you actually move on to plugging the EA into your real account, and rather invest small before confirming the previous success with your real money.

Lastly, in spite of the ease that the possession of such a program could bring about, these quick solutions, and most importantly the need for the psychological hunger to progress fast, may not be the road worth taking long-term. Rather choose to be a good trader in control of your account than hope for wins and rewards will follow naturally. In case you find an EA that works long term, if it adapts to new market conditions, if it has sound risk management implementation, use it as much as you can but still be ready for sudden losses your account should endure. When all is said and done, the search for a great EA could be as time-consuming as making your own manual trading algorithm minus the trading experience, which is irreplaceable. 

Categories
Forex Signals

Three White Soldiers Underpins EUR/JPY – Buying Signal Update! 

Join F.A. Telegram Channel: https://t.me/forexsignalsFA

The EUR/JPY pair is trading sharply bullish around 126.350 level, having formed three white soldiers on the two-hourly timeframes. The leading indicators are the suggesting buying trend in the pair, which may lead the EUR/JPY pair towards 126.245. On the lower side, the EUR/JPY is likely to find support at the 125.799 level. Let’s stay bullish above 126.00 level today. Checkout the EUR/JPY trade plan below and also follow FA Trading Signal Channel on Telegram. 


Entry Price – Buy 126.036

Stop Loss – 125.636

Take Profit – 126.436

Risk to Reward – 1:1

Profit & Loss Per Standard Lot = -$400/ +$400

Profit & Loss Per Micro Lot = -$40/ +$40

Fellas, now you can check out forex trading signals via Forex Academy mobile app. Follow the links below.

iPhone Users: https://apps.apple.com/es/app/fasignals/id1521281368

Andriod Users: https://play.google.com/store/apps/details?id=academy.forex.thesignal&hl=en_US


Categories
Forex Signals

AUD/USD Bearish Engulfing Candle – Is It Good Time to Sell?

Join F.A. Telegram Channel for Free Trading Signals: https://t.me/forexsignalsFA

During Tuesday’s early European trading session, the AUD/USD currency pair snapped its previous two-day losing streak and caught some fresh bids around above 0.7700 level mostly due to the recent upticks in S&P 500 index, which tend to underpin the perceived risk currency Australian dollar and contributes to the currency pair gains. Hence, the market trading sentiment was being supported by the optimism over the rollout of COVID-19 vaccines and hopes for additional U.S. fiscal stimulus measures. 

Across the pond, the broad-based U.S. dollar bearish bias, triggered by multiple factors, also played its major role in strengthening the currency pair. In contrast to this, the long-lasting coronavirus distress globally keeps questioning the market’s upbeat mood, which could cap gains for the currency pair. At this time, the AUD/USD currency pair is currently trading at 0.7710 and consolidating in the range between 0.7672 – 0.7725.

The market trading sentiment has been gaining positive traction since the day started and was being supported by the optimism over the rollout of COVID-19 vaccines and hopes for additional U.S. fiscal stimulus measures. As per the latest report, the U.S. President-elect Joe Biden is prepared to take office on January 20, pushing for the $1.9 trillion stimulus package already outlined last week. In the meantime, the Treasury Secretary nominee Janet Yellen is also expected to push the government to “act big” with its next coronavirus relief package when she testifies before the Senate later on Tuesday. Hence, the prevalent upbeat market mood underpinned the Australian dollar’s perceived risk currency and contributed to the currency pair gains.

At the USD front, the broad-based U.S. dollar failed to gain any positive traction during the early European trading hours amid risk-on market sentiment. Apart from this, the greenback losses could also be associated with the low-interest record rates’ expectations. Conversely, the expectations of a larger government borrowing recently triggered a fresh leg up in the U.S. Treasury bond yields, which might help the U.S. dollar limit any meaningful downside. However, the losses in the U.S. dollar pushed the currency pair higher. The U.S. Dollar Index that tracks the greenback against a bucket of other currencies dropped by 0.11% to 90.653 by 11:03 PM ET (4:03 AM GMT). 

On the bearish side, the long-lasting worries about the continuous surge in new COVID-19 cases challenging the upbeat market sentiment and turned out to be one of the key factors that kept the lid on any additional gains in the currency pair. Furthermore, the cautious sentiment ahead of President-elect Joe Biden’s inaugural ceremony also probes the bulls.

In the absence of high impact economic events from the U.S., the U.S. Treasury Secretary nominee Janet Yellen’s testimony will influence the USD price dynamics. Meanwhile, the broader market risk sentiment could produce some short-term trading opportunities around the currency pair.


Daily Support and Resistance

S1 0.7606

S2 0.7642

S3 0.7662

Pivot Point 0.7679

R1 0.7698

R2 0.7715

R3 0.7752

The AUD/USD is trading at 0.7709 level holding below an immediate resistance level of 0.7725. The recent closing bearish engulfing candles can trigger odds of selling bias in the AUD/USD pair. However, we are not taking a sell trade yet, as the 50 periods EMA and MACD is staying in a bullish zone. Let’s keep an eye on the 0.7722 level as selling can be expected below this level along with buying over the 0.7722 mark. Good luck! 


Categories
Forex Signals

AUD/JPY Gains Support Over Double Bottom – Is It Worth Holding Sell Trade?

The AUD/JPY pair traded bearish, falling from 79.77 level to trade low at 79.50. On the lower side, the AUD/JPY may find support at the 79.50 level, and a bearish breakout of this level can extend selling bias until the 79.14 level. The 10 & 20 periods EMA are supporting selling bias, along with the 50 MACD and RSI indicators. Let’s follow a trading plan below:

Daily Support and Resistance

S1 0.7547

S2 0.7632

S3 0.7668

Pivot Point 0.7717

R1 0.7753

R2 0.7802

R3 0.7887


Entry Price – Sell 79.678

Stop Loss – 80.078

Take Profit – 79.278

Risk to Reward – 1:1

Profit & Loss Per Standard Lot = -$400/ +$400

Profit & Loss Per Micro Lot = -$40/ +$40

Fellas, now you can check out forex trading signals via Forex Academy mobile app. Follow the links below.

iPhone Users: https://apps.apple.com/es/app/fasignals/id1521281368

Andriod Users: https://play.google.com/store/apps/details?id=academy.forex.thesignal&hl=en_US


Categories
Forex Signals

AUD/USD Symmetric Triangle Breakout – Brace for Selling! 

The AUD/USD failed to stop its previous session bearish moves and hit the one-week around well below 0.7700 level. The cautious sentiment ahead of U.S. President-elect Joe Biden’s office term, as well as the lack of major data/events and a long weekend in the U.S., played their major in undermining the market trading sentiment. The AUD/USD currency pair is currently trading at 0.7669 and consolidating in the range between 0.7659 – 0.7711.

The market trading sentiment failed to stop its last-weeks bearish moves and remains discouraged during the early Asian session as the condition of the second wave of coronavirus infections in Europe and the U.S. getting worse, which pushed the authorities to keep imposing back to back restrictions over activities in efforts to control the spread of the virus. Apart from this, the renewed inability to pass the U.S. fiscal package also weighed on the risk sentiment, which eventually weakened the perceived riskier Australian dollar and contributed to the currency pair gains. Apart from this, the reason for the market risk-off mood could also be associated with the ever-increasing US-China tussle, which puts further pressure around the market sentiment and contributes to the currency pair gains.

This, in turn, the broad-based U.S. dollar succeeded in extending its previous session gains and took some further bids during the early European session as investors still prefer the safe-haven assets in the wake of risk-off market sentiment. However, the U.S. dollar gains seem rather unaffected by the worsening coronavirus (COVID-19) conditions in the U.S. or the disappointing U.S. data. The gains in the U.S. dollar becomes the key factor that kept the currency pair under pressure. The U.S. Dollar Index that tracks the greenback against a bucket of other currencies rose by 0.05% to 90.800 by 10:46 AM ET.

In the absence of the major data/events on the day, the market traders will keep their eyes on the BOE Gov Bailey Speaks along with the Candian Housing Starts data. In the meantime, the coronavirus saga developments could play a key role in influencing the market risk sentiment and the USD price dynamics. 


Daily Support and Resistance

S1 0.7547

S2 0.7632

S3 0.7668

Pivot Point 0.7717

R1 0.7753

R2 0.7802

R3 0.7887

The AUD/USD pair is trading with a selling bias at 0.7665 level, especially after violating the support area of 0.7722 level. Closing of candles below 0.7722 level can extend selling bias until 0.7650 and 0.7610 level. Checkout our trading plan for today.  

Entry Price – Sell 0.76734

Stop Loss – 0.77134

Take Profit – 0.76334

Risk to Reward – 1:1

Profit & Loss Per Standard Lot = -$400/ +$400

Profit & Loss Per Micro Lot = -$40/ +$40

Fellas, now you can check out forex trading signals via Forex Academy mobile app. Follow the links below.

iPhone Users: https://apps.apple.com/es/app/fasignals/id1521281368

Andriod Users: https://play.google.com/store/apps/details?id=academy.forex.thesignal&hl=en_US


Categories
Forex Signals

GBP/USD Supported Over Double Bottom – Buy Signal Update! 

The GBP/USD is trading at 1.3692, and it has closed a Doji candle on the four hourly timeframes, and it may extend a bearish correction in the GBP/USD pair. On the lower side, the support stays at 1.3636 and resistance at 1.3692 and 1.3720 today. The GBP/USD pair’s 10 & 20 periods EMA is supporting bullish bias in the Sterling. The MACD and RSI support bullish bias; therefore, bullish bias dominates over the 1.3646 level today.


Entry Price – Buy 1.36606

Stop Loss – 1.36206

Take Profit – 1.37006

Risk to Reward – 1:1

Profit & Loss Per Standard Lot = -$400/ +$400

Profit & Loss Per Micro Lot = -$40/ +$40

Fellas, now you can check out forex trading signals via Forex Academy mobile app. Follow the links below.

iPhone Users: https://apps.apple.com/es/app/fasignals/id1521281368

Andriod Users: https://play.google.com/store/apps/details?id=academy.forex.thesignal&hl=en_US

Categories
Forex Signals

AUD/NZD Upward Channel Underpinds – Bullish Setup in Play! 

The AUD/NZD pair is trading with a bullish bias at 1.07901 level, facing immediate support at 1.07820 level. On the higher side, the pair may find resistance at the 1.07990 level, and a bullish crossover of 1.0799 level can extend the buying trend until the 1.0810 level. The MACD is closing histograms over 0, suggesting bullish bias in the AUD/NZD pair. In any case, the pair can drop until the 1.0782 level before extending further higher. Here’s a trade plan…


Entry Price – Buy 1.07861

Stop Loss – 1.07461

Take Profit – 1.08261

Risk to Reward – 1:1

Profit & Loss Per Standard Lot = -$400/ +$400

Profit & Loss Per Micro Lot = -$40/ +$40

Fellas, now you can check out forex trading signals via Forex Academy mobile app. Follow the links below.

iPhone Users: https://apps.apple.com/es/app/fasignals/id1521281368

Andriod Users: https://play.google.com/store/apps/details?id=academy.forex.thesignal&hl=en_US

Categories
Forex Signals

AUD/USD Bullish Bias Continues – Symmetric Triangle Plays!

On Thursday, the AUD/USD trades bullish at 0.7767, and an upward violation of the 0.7778 mark is likely to extend the bullish trend until the next target of the 0.7818 mark. Whereas the support holds around the 0.7722 mark. The RSI and MACD are suggesting bullish sentiment; thus, we have begun a buying trade at the 0.7750 mark. 

The prevailing risk-off market mood also weighed on the risk-sensitive Australian dollar that ultimately added further pressure over the AUD/USD pair. On Tuesday, the daily death toll in the United States from the coronavirus hit a record of 4327 as the Trump administration attempted to fast-track the roll-out of vaccinations across the country. The US has the highest toll in the world from the coronavirus with a total of above 3lacs deaths, and it has also reported the highest number of infections with 22,959,610 confirmed cases of coronavirus. 

Despite lockdown and restrictive measures, these rising cases of coronavirus added to the risk-off market sentiment in the market and weighed on the risk perceived by Aussie that ultimately added pressure on the declining AUD/USD pair. Furthermore, the mixed signals from some of the US Federal Reserve members on how much longer policy can stay so accommodative also dragged the treasuries and supported the demand in US dollar that ultimately added in the losses of AUD/USD pair.


Entry Price – Sell 0.77599

Stop Loss – 0.77199

Take Profit – 0.77999

Risk to Reward – 1:1

Profit & Loss Per Standard Lot = -$400/ +$400

Profit & Loss Per Micro Lot = -$40/ +$40

Fellas, now you can check out forex trading signals via Forex Academy mobile app. Follow the links below.

iPhone Users: https://apps.apple.com/es/app/fasignals/id1521281368

Andriod Users: https://play.google.com/store/apps/details?id=academy.forex.thesignal&hl=en_US

Categories
Forex Signals

EUR/JPY Violates Descending Triangle Pattern – Quick Sell Setup! 

The EUR/JPY is trading with a bearish bias at the 126.497 level, violating the support level of 126.497, which now is working as a resistance for the EUR/JPY pair. On the lower side, the EUR/JPY pair may find support at the 126.250 level, and further support can be expected at 126.100. The MACD value has crossed below 0, supporting selling bias as histograms are being formed under zero. The recent bearish engulfing candle on the hourly timeframe suggests strong odds of selling the EUR/JPY pair. Let’s consider selling trades in the EUR/JPY today. 


Entry Price – Sell 126.45

Stop Loss – 126.85

Take Profit – 126.05

Risk to Reward – 1:1

Profit & Loss Per Standard Lot = -$400/ +$400

Profit & Loss Per Micro Lot = -$40/ +$40

Fellas, now you can check out forex trading signals via Forex Academy mobile app. Follow the links below.

iPhone Users: https://apps.apple.com/es/app/fasignals/id1521281368

Andriod Users: https://play.google.com/store/apps/details?id=academy.forex.thesignal&hl=en_US

Categories
Forex Signals

GBP/JPY Violates the Ascending Triangle Pattern – Bullish Signal Update! 

The GBP/JPY pair trades with a bullish bias at 142.090 level ever since it has violated the triple top resistance level of 141.296. On the higher side, the GBP/JPY pair soar until the next target level of 142.510. The GBP/JPY pair’s technical side is supporting strong bullish bias as the 10 & 20 periods EMA are in support of the buying trend. Here’s a quick trade plan…


Entry Price – Buy 141.942

Stop Loss – 141.944

Take Profit – 142.342

Risk to Reward – 1:1

Profit & Loss Per Standard Lot = -$400/ +$400

Profit & Loss Per Micro Lot = -$40/ +$40

Fellas, now you can check out forex trading signals via Forex Academy mobile app. Follow the links below.

iPhone Users: https://apps.apple.com/es/app/fasignals/id1521281368

Andriod Users: https://play.google.com/store/apps/details?id=academy.forex.thesignal&hl=en_US

Categories
Forex Signals

AUD/USD Symmetric Triangle Pattern – Potential Sell Trade!

The AUD/USD closed at 0.77738 after placing a high of 0.77772 and a low of 0.76865. The AUD/USD pair recovered on Tuesday after the US dollar came under fresh pressure due to the US’s rising political risks.
The risk-sensitive Aussie gained traction on Tuesday despite the rising risk-off mood in the market. The risk sentiment suffered on Tuesday as the FBI told that it had received information indicating armed protests were being planned at all 50 state capitols and Washington. These comments also weighed on the US dollar that ultimately added to the AUD/USD pair’s rising prices on Tuesday.

On the other hand, the greenback was weak during Tuesday as the US Dollar Index that measures the value of the US dollar against the basket of six major currencies fell to 90.20 level and supported the upward momentum in AUD/USD pair. The risk-off market sentiment was also supported by the rising number of coronavirus cases and the increased tougher restrictions across the world to curb coronavirus spread. Meanwhile, the 10-year US Treasury yields were up by almost 2% on Tuesday, suggesting that DXY’s downside will remain limited if yields continued to rise.

On the data front, there was no macroeconomic data to be released from Australia. While From the US side, at 16:00 GMT, the NFIB Small Business Index for December fell to 95.9 against the expected 100.1 and weighed on the US dollar that ultimately added in the gains of AUD/USD pair. At 20:00 GMT, the JOLTS Job Openings for November rose to 6.53M against the anticipated 6.42M and supported the US dollar that capped further gains in AUD/USD pair. At 20:02 GMT, the IBD/TIPP Economic Optimism came in line with the anticipations of 50.1.

From China, the M2 Money Supply for the year dropped to 10.1% against the forecasted 10.7% and weighed on China-proxy Aussie that capped further upside in AUD/USD pair. The New Loans from China raised to 1260B against the forecasted 1250B and supported China-proxy Aussie that added AUD/USD pair gains.

On Tuesday, Donald Trump’s administration said that it gave millions of coronavirus vaccine doses that it had been keeping back for second shots and encouraged states to offer them to all Americans above age 65 or with persistent health conditions. These comments added in the risk sentiment and supported risk perceived Aussie that ultimately added the AUD/USD pair’s upward momentum.


Daily Technical Levels
Support Resistance
0.7650 0.7756
0.7605 0.7817
0.7544 0.7862
Pivot point: 0.7711

The AUD/USD pair jas formed a symmetric triangle pattern, supporting a selling bias in the pair. On the 2 hour timeframe, the Aussie is likely to find support at the 0.7722 level along with a resistance level of 0.7776. The MACD and RSI support selling bias, whereas the 10 & 20 periods EMA are suggesting selling bias. The AUD/USD is showing a bearish crossover on the two-hourly timeframes, supporting a selling bias. Let’s consider taking a sell trade below 0.7760 today. Good luck!

Categories
Forex Signals

EUR/GBP Violates Descending Triangle Pattern – Sell Signal In Play! 

The EUR/GBP pair is trading with a bearish bias at a 0.8930 level, having violated the support level of 0.8940. The Euro seems to get weaker as the European countries have tightened measures to fight coronavirus after a brief relaxation over the Christmas and New Year period. They have re-imposed lockdowns, closed shops and offices, and introduced laws to make it easier for governments to impose further restrictions to battle the pandemic. 

These new lockdown measures across Europe to fight the second wave of coronavirus raised the fears of a double-dip recession in the Eurozone that added weight on the single currency Euro and capped further upside in the EUR/USD pair on Tuesday.

The Sterling is gaining strength as Bailey said that there were many issues with cutting interest rates below zero, and such a move could hurt banks. After these comments from Bailey, the British Pound gained traction and raised that ultimately pushed the EUR/GBP pair lower.

Meanwhile, The Deputy Governor of Bank of England, Ben Broadbent, said on Tuesday that Britain’s coronavirus pandemic was likely to have a limited long-run impact on inflation and has led to less short-term downward pressure on prices than might have been expected from the slump in headline economic output.

On the technical side, the EUR/GBP has violated the support level of 0.8940, and now it’s likely to extend the selling trend until it reaches 0.8873. The MACD and RSI are in support of selling; thus, we have entered the selling trade in the EUR/GBP pair. Here’s a trading plan…


Entry Price – Sell 0.89138

Stop Loss – 0.89538

Take Profit – 0.88738

Risk to Reward – 1:1

Profit & Loss Per Standard Lot = -$400/ +$400

Profit & Loss Per Micro Lot = -$40/ +$40

Fellas, now you can check out forex trading signals via Forex Academy mobile app. Follow the links below.

iPhone Users: https://apps.apple.com/es/app/fasignals/id1521281368

Andriod Users: https://play.google.com/store/apps/details?id=academy.forex.thesignal&hl=en_US


Categories
Forex Signals

AUD/USD Completes 38.2% Fibonacchi Retracement – Trade Idea! 

The AUD/USD pair was closed at 0.76953 after placing a high of 0.77604 and a low of 0.76658. AUD/USD pair dropped on Monday amid the rising US dollar prices and the improved risk-off market sentiment in the market. The risk-sensitive Australian dollar suffered due to the rising risk-off market sentiment after the world’s second-largest economy entered into restrictions as the number of coronavirus cases rose rapidly. China saw almost 18 new imported infections from overseas, and on Monday, the country in northeastern Heilongjiang province moved into lockdown after reporting new coronavirus infections. It weighed on the risk sentiment that ultimately plunged the risk-sensitive Aussie and dragged the pair AUD/USD on the downside.

The China proxy-Aussie suffered more due to its trading relationship with China as the country imposed strict anti-virus measures in the Hebei province due to rising coronavirus cases. It also harmed the risk-sensitive currency Aussie that ultimately added losses in AUD/USD pair. On the data front, at 05:00 GMT, the MI Inflation Gauge for December from Australia raised to 0.5% in comparison to November’s 0.3%. At 05:30 GMT, the Retail Sales for November from Australia raised to 7.1% against the forecasted 7.0% and supported the Australian dollar that capped further downside in the AUD/USD pair.

Meanwhile, the data from China also impacted the prices of the AUD/USD pair. In December, the CPI from China raised to 0.2% against the expected 0.0% and supported China-proxy Aussie. The PPI from China came in as -0.4% against the expected -0.7% and supported the China-proxy Australian dollar that ultimately limited the AUD/USD pair’s rising prices.

The US dollar was also strong on the board as the US treasury yields continued to rise on Monday. The US Dollar Index was also up to 90.50 level on Monday, followed by declining to the two-year lowest level last week and supporting the AUD/USD pair’s downward momentum on Monday. Aussie traders will remain reluctant to place a buying position in AUD/USD pair as the market sentiment was deteriorated due to the rising coronavirus cases around the globe that would hurt the risk-sensitive Aussie.


Daily Technical levels

Support Resistance

0.7700 0.7755

0.7679 0.7789

0.7645 0.7811

Pivot Point: 0.7734

The AUD/USD pair has bounced off over the 0.7690 level, forming a bullish engulfing candle on the 2-hour timeframe. It may bounce off to trade until the 0.7740 level, where 10 & 20 periods EMA are likely to extend resistance at 0.7740. On the lower side, the AUD/USD may find support at the 0.7690 level. A bearish breakout of 0.7690 level can extend the selling trend until the next support area of 0.765 level today. Good luck! 


Categories
Forex Signals

GBP/USD Hit Take Profit – Downward Trendline in Play!

35679 and a low of 1.34507. The GBP/USD pair lost ground on Monday and dropped to a fresh 2-weeks lowest level amid the broad-based US dollar strength. The GBP/USD witnessed some selling for the fourth consecutive session on Monday and extended its retracement slide from 33-months highs. The momentum dragged the GBP/USD pair further below as the strong rally in the US Treasury bond yields supported the US dollar. The greenback recovered from nearly three-year lowest level after the treasury yields rally amid the hopes of additional US fiscal stimulus measures. Investors started pricing in the prospects for a more aggressive US fiscal spending in 2021 after the Democratic sweep in the US Senate runoff elections in Georgia.

The Cable has traded in line with our forecast and closed our position in 47 green pips profit. At the moment, the GBP/USD pair may find resistance at the 1.3589 level that’s extended by a downward trendline on the 2 hourly timeframes. Let’s wait for the GBP/USD pair to reach 1.3630 resistance before getting any additional trade today. Good luck! 

Support Resistance

1.3496 1.3553

1.3475 1.3589

1.3439 1.3611

Pivot Point: 1.3532


Entry Price – Sell 1.36436
Stop Loss – 1.36836
Take Profit – 1.36036
Risk to Reward – 1:1
Profit & Loss Per Standard Lot = -$400/ +$400
Profit & Loss Per Micro Lot = -$40/ +$40
Fellas, now you can check out forex trading signals via Forex Academy mobile app. Follow the links below.
iPhone Users: https://apps.apple.com/es/app/fasignals/id1521281368
Andriod Users: https://play.google.com/store/apps/details?id=academy.forex.thesignal&hl=en_US

Categories
Forex Signals

Gold Violates Daily High – Brace to Capture Buying Trade! 

The yellow metal managed to stop its overnight losses and drew some fresh bids around above mid-$1,800 level as the prevalent downbeat market trading sentiment, triggered by the worsening coronavirus (COVID-19) conditions Sino-US tussle, underpinned the safe-haven metal prices. Though, the equity market losses were further bolstered after the Chinese planned to extend the Hong Kong crackdown after the arrests of nearly 50 democrats during last week, which in turn, provided some additional support to the yellow metal prices. 

In the meantime, the chatters surrounding that the U.K. is considering to increase hardships for Chinese companies, via tightening laws on imports, which in turn, added further pressure on the market trading sentiment and underpins the precious metal. In contrast to this, the U.S. President-elect Joe Biden’s pledge to announce trillions of dollars in new COVID-19 relief measures keep easing doubts over the global economic fallout, which becomes the key factor that kept the lid on any additional gains in the yellow metal prices. Meanwhile, the jump in global vaccinations could also help the equity market to limit its losses. The yellow metal prices are currently trading at 1,856.94 and consolidating in the range between 1,841.51 – 1,858.30.

The global markets trading sentiment failed to stop its overnight negative performance and remained sour amid Sino-US-UK tensions and growing coronavirus fears. At the COVID-19 front, the number of global cases has exceeded 90.87 million as of Jan. However, approximately 22.6 million cases were only marked in the U.S., with over 22,000 American has died from the virus during the previous week. Considering the current condition of the virus, the authorities from more countries, such as Europe and China, tighter their lockdown measures, which positively impacted the yellow-metal prices. 

Besides the virus woes, the reason for the bearish trading sentiment could also be associated with the long-lasting US-China tussle, which is continuously picking pace as the US Trump administration plans more sanctions. On the other side, China has shown its dislike over U.S. interference in matters relating to Hong Kong and Taiwan. In addition to the U.S., the U.K. has also increased hardships for Chinese companies via tightening laws on imports. However, the fears of a full-fledged trade/political war between the U.S., U.K., and China have been weighing on the market trading sentiment and were seen as major factors that kept the gold prices higher.


Entry Price – Buy 1857.14

Stop Loss – 1851.14

Take Profit – 1864.64

Risk to Reward – 1:1

Profit & Loss Per Standard Lot = -$400/ +$400

Profit & Loss Per Micro Lot = -$40/ +$40

Fellas, now you can check out forex trading signals via Forex Academy mobile app. Follow the links below.

iPhone Users: https://apps.apple.com/es/app/fasignals/id1521281368

Andriod Users: https://play.google.com/store/apps/details?id=academy.forex.thesignal&hl=en_US


Categories
Forex Signals

EUR/USD Downward Channel in Play – Sell Signal Update!

The strength in the U.S. dollar also dragged the EUR/USD pair lower to the 1.2175 level. For the moment, the EUR/USD is gaining support at the 1.2175 level, and below this, it can dip further until the 1.2130 level. On the higher side, the pair may face resistance at the 1.2216 level. The RSI and MACD support bullish correction, and these may cause a bounce off in the EUR/USD pair until the 1.2216 level. Below 1.2216, we can again see a dip in EUR/USD.


Entry Price – Sell1.21603
Stop Loss – 1.22003
Take Profit – 1.21103
Risk to Reward – 1:1
Profit & Loss Per Standard Lot = -$400/ +$400
Profit & Loss Per Micro Lot = -$40/ +$40
Fellas, now you can check out forex trading signals via Forex Academy mobile app. Follow the links below.
iPhone Users: https://apps.apple.com/es/app/fasignals/id1521281368
Andriod Users: https://play.google.com/store/apps/details?id=academy.forex.thesignal&hl=en_US

Categories
Forex Signals

AUD/USD Violates Ascending Triangle – Double Bottom Support! 

The AUD/USD closed at 0.77665 after placing a high of 0.77984 and a low of 0.77280. The currency pair AUD/USD remained flat throughout the day on Friday and closed its day at the same level it began its day with as the risk rally pushed the pair higher and the US dollar strength dragged the pair AUD/USD lower at the same time. 

The risk-sensitive Aussie just went with the flow and boosted by rallying equities and persistent hopes that the economic chaos triggered by the coronavirus pandemic was on its final stage. The risk sentiment in the market was also supported by the latest announcement from the UK on Friday. The UK announced that it’s medical regulatory has approved a third vaccine for coronavirus made by Moderna for emergency use authorization. 

The rising risk sentiment was also supported by the decreasing political risk in Washington related to power transition. The US President Donald Trump has agreed to a transition of power, and this has raised the risk sentiment in the market and supported the upward momentum in AUD/USD pair in the early trading session. However, the AUD/USD pair’s gains were lost in the late trading hours on Friday after the US Dollar became strong across the board. The greenback was high on Friday, with the US Dollar Index above the 90.00 level for the first time this week. The US treasury yields on the 10-year note were also high on Friday, with 3% up for the day and 21% up for the week. All these factors added to the US dollar demand that ultimately weighed on AUD/USD pair and forced the pair to lose its early daily gains.

On the data front, from the US side, at 18:30 GMT, the Average Hourly Earnings for December raised to 0.8% against the predicted 0.2% and supported the US dollar that added further weight to AUD/USD pair. In December, the Non-Farm Employment Change plunged to -140K against the predicted 60K and weighed on the US dollar. During December, the Unemployment Rate plunged to 6.7% against the predicted 6.8% and supported the US dollar that added further AUD/USD pair losses. At 20:00 GMT, the Final Wholesales Inventories for November came in as 0.0% against the predicted -0.1% and weighed on the US dollar.

The AUD/USD pair remained flat throughout Friday amid the mixed market sentiment and left the investors to await the publication of the final reading of November Retail Sales from Australia while China will provide an update on inflation that will also remain under close observation by AUD/USD investors. 

On Thursday, China will release its December Trade Balance that may also impact AUD/USD pair. The US’s CPI data on Wednesday and Retail Sales on Thursday will also affect the AUD/USD pair’s momentum in upcoming days.


Daily Technical Levels

Support Resistance

0.7700 0.7755

0.7679 0.7789

0.7645 0.7811

Pivot point: 0.7734

The AUD/USD pair has bounced off over the 0.7690 level, forming a bullish engulfing candle on the 2-hour timeframe. It may bounce off to trade until the 0.7740 level, where 10 & 20 periods EMA are likely to extend resistance at 0.7740. On the lower side, the AUD/USD may find support at the 0.7690 level. A bearish breakout of 0.7690 level can extend the selling trend until the next support area of 0.765 level today. Good luck! 

Categories
Forex Signals

AUD/USD Ascending Triangle Pattern – NFP Figures Ahead! 

The AUD/USD pair was closed at 0.77661 after placing a high of 0.78171 and a low of 0.77661. After rising for two consecutive days, the AUD/USD pair dropped on Thursday amid the US dollar’s strength and rising safe-haven demand in the market.

The US Dollar Index (DXY) recovered from its 2-years lowest level and reached 89.85 and supported the greenback as the US treasury yield on a 10-year note also raised from 1% for the first time since March and supported the rising demand for the US dollar. The strength of the US dollar then added weight to AUD/USD pair on Thursday.

On the data front, at 05:30 GMT, the Building Approvals from November raised to 2.6% against the expected 1.9% and supported the Australian dollar that capped further losses in AUD/USD pair. The Trade Balance from Australia showed a surplus of 5.02B against the expected 6.45B and weighed n Australian dollars that ultimately added the AUD/USD pair’s losses. From the US side, at 17:30 GMT, the Challenger Job Cuts for the year in December increased to 134.5% compared to November’s 45.4%. At 18:30 GMT, the Unemployment Claims from last week fell to 787K against the projections of 798K and supported the US dollar that added further losses in AUD/USD pair. The Trade Balance from November showed a deficit of -68.1B against the projected -66.7B and weighed on the US dollar that capped further downside in AUD/USD pair. At 20:00 GMT, the ISM Services PMI rose in December to 57.2 against the projected 54.5 and supported the US dollar that added further losses in AUD/USD pair.

Meanwhile, the safe-haven demand rose after Donald Trump’s supporters stormed the US capitol in an attack. This was done after the US Congress certified Joe Biden’s victory in the presidential election. This attack resulted in four casualties and raised the safe-haven appeal that ultimately weighed on the risk perceived Australian dollar that added losses in AUD/USD pair.

Furthermore, the FOMC member and President of the Federal Reserve of Atlanta Raphael Bostic said that the US Federal Reserve might reduce its asset purchase program sooner than expected. These hawkish comments gave strength to the US dollar that added more AUD/USD pair losses on Thursday.


Daily Technical Levels

Support Resistance

0.7722 0.7816

0.7676 0.7864

0.7628 0.7910

Pivot Point: 0.7770

The AUD/USD pair trades with a bullish bias at the 0.7782 level, having formed an ascending triangle pattern on the hourly timeframe. On the higher side, the pair is likely to face resistance at a 0.7818 level, along with a support level of 0.7737. The AUD/USD pair may continue trading bullish as 50 periods EMA is extending support to Aussie around 0.7764 level. Good luck! 


Categories
Forex Signals

USD/CAD Forms Descending Triangle Pattern – Brace for a Breakout Setup! 

The USD/CAD pair was closed at 1.26879 after placing a high of 1.27334 and a low of 1.26633. The USD/CAD pair rose on Thursday due to a strong rebound of the US dollar and Canada’s negative economic data.

The US Dollar Index that measures the value of the greenback against the basket of six major currencies recovered from the 2-years lowest level and came back to 89.85 level on Thursday after rising for 0.35% and gave strength to the US dollar against its Canadian counterpart that eventually lifted USD/CAD pair on board. Wall Street’s main indexes were also high on Thursday, with Dow Jones gaining about 1.7% and NASDAQ gaining about 2.25% on Thursday.

The US treasury yield on a 10-year note was also raised on Thursday above 1% for the first time since March, which also gave strength to the US dollar and raised the USD/CAD pair. Whereas the Canadian dollar was weak onboard on the day despite trading softer against its US counterpart, the Loonie was also underperforming against most of its G10 peers. 

Markets continued pricing the prospects of much more spending from the US government over the coming months and years under the Democratic leader Joe Biden. This increased the expectations of higher US economic growth and higher inflation, hence why US stocks, nominal US bond yields, and US inflation break-evens were higher on Thursday.

On the data front, at 18:30 GMT, the Trade Balance from Canada for November showed a deficit of -3.3B against the expected -3.6B and supported the Canadian dollar that capped further upside in the USD/CAD pair. At 20:00 GMT, the Ivey PMI from Canada for December declined to 46.7 against the expected 53.1 and weighed on the Canadian dollar, which ultimately added strength to the USD/CAD pair’s bullish momentum.

From the US side, at 17:30 GMT, the Challenger Job Cuts for the year in December advanced to 134.5% compared to November’s 45.4%. At 18:30 GMT, the Unemployment Claims from last week were plunged to 787K against the estimated 798K and supported the US dollar that added gains in USD/CAD pair. The Trade Balance from November showed a deficit of -68.1B against the estimated-66.7B and weighed on the US dollar that capped further upside in the USD/CAD pair. At 20:00 GMT, the ISM Services PMI advanced in December to 57.2 against the estimated 54.5 and supported the US dollar that added further gains in the USD/CAD pair on Thursday.

On the other hand, the WTI crude oil prices surpassed the $51 per barrel on Thursday and gave strength to commodity-linked currency Loonie that lost most of the gains from the USD/CAD pair on Thursday in late trading hours.


Daily Technical Levels

Support Resistance

1.2653 1.2727

1.2621 1.2767

1.2580 1.2800

Pivot Point: 1.2694

The commodity currency pair USD/CAD is trading with a neutral bias at the 1.2692 level, facing immediate resistance at the 1.2742 level. The USD/CAD pair may find resistance at the 1.2742 level on the hourly timeframe, and closing of a candle below this level may trigger selling until the 1.2640 level. The MACD and RSI are suggesting buying trends, along with 50 periods EMA. I will be looking to take a sell trade around the 1.2745 level today. Good luck! 

Categories
Forex Signals

USD/CAD Downward Trendline to Provide Resistance – Sell Trade in Play! 

The USD/CAD pair was closed at 1.26766 after placing a high of 1.27234 and a low of 1.26297. Despite the continuous rise in crude oil prices, the USD/CAD pair posted gains on Wednesday amid the rebound in US dollar prices. After the two-day OPEC+ meeting, Saudi Arabia announced that they would be voluntarily cutting their output in February and March that will amount to 1 million barrels per day. West Texas Intermediate (WTI) ‘s barrel gained more than 5% and preserved its bullish momentum on Wednesday. The Crude oil prices reached $50.9 per barrel on Wednesday to their highest level in more than ten months and gave strength to commodity-linked Loonie that capped further upside in the currency pair USD/CAD pair.

The US Dollar recovered on Wednesday across the board amid the rising US treasury yields followed by the prospects of a Democratic win in US Senate elections. The US Treasury yield on a 10-year note raised more than 1% on Wednesday to its highest level since March and supported the recovery in the US dollar that ultimately added gains in the USD/CAD pair.

On the data front, From the US side, at 18:15 GMT, the ADP Non-Farm Employment Change for December plunged to -123K against the estimated 60K and weighed on the US dollar and capped further gains in the USD/CAD pair. At 19:45 GMT, the Final Services PMI for December also plunged to 54.8 against the estimated 55.2 and weighed on the US dollar that limited the upward momentum in the USD/CAD pair. At 20:00 GMT, the Factory Orders for November advanced to 1.0% against the estimated 0.7% and supported the US dollar that added further gains in the USD/CAD pair on Wednesday.

Meanwhile, the USD/CAD pair’s gains remained consolidated as the US dollar came under pressure after the prospects of a Democratic win in the US Senate elections increased. Wining the two seats in Senate by Democrats will give them control over both chambers of Congress that means they could get their agenda passed with the majority. The market participants kept betting over the prospects of larger stimulus measure after the victory of Democrats in runoff elections in Georgia and kept the US dollar under pressure that limited the gains in the USD/CAD pair on Wednesday. Market participants now await the release of meeting minutes from FOMC and the NFP report from the US that will release on Friday and Canada’s labor data.


Daily Technical Levels

Support Resistance

1.2619 1.2758

1.2568 1.2844

1.2481 1.2896

Pivot Point: 1.2706

The USD/CAD pair is trading with a bullish bias at the 1.2725 level, facing immediate resistance at the 1.2742 level. The USD/CAD pair may find resistance at the 1.2742 level on the hourly timeframe, and closing of a candle below this level may trigger selling until the 1.2640 level. The MACD and RSI are suggesting buying trends, along with 50 periods EMA. I will be looking to take a sell trade around the 1.2745 level today. Good luck! 


Categories
Forex Signals

AUD/USD Breaks Below Upward Channel – Quick Update on Sell Singal! 

The AUD/USD pair was closed at 0.78063 after placing a high of 0.78199 and a low of 0.77329. The AUD/USD pair continued its bullish momentum on Wednesday and extended its gains amid the anticipated Democratic win in the US Senate runoff elections in Georgia. 

The rally on Wall Street, surging oil prices, and news Australians could receive the coronavirus vaccination as early as February saw local shares up on Wednesday. The risk sentiment was supported by the mentioned factors and supported the risk-sensitive Australian dollar that ultimately added the AUD/USD pair’s upward momentum.

The prospects of a Democratic win in the US Senate elections and the Australian Government announcement that it would begin vaccinating people against coronavirus from next month added to the risk rally that ultimately supported the AUD.USD prices on Wednesday.

The two main Indexes of Wall Street, Dow Jones, and NASDAQ, rose on Wednesday by 1.55% and 0.51%, respectively, and pushed the market’s risk sentiment higher than supported the risk-sensitive AUD/USD pair’s upward momentum. Furthermore, the risk sentiment was also supported by the rising prices of crude oil on Wednesday amid the Saudi government announcement of increasing the output cut in February and March. It also supported the risk perceived by Aussie and added further in its bullish movement for the day.

On the data front, From the US side, at 18:15 GMT, the ADP Non-Farm Employment Change for December dropped to -123K against the predicted 60K and weighed on the US dollar that added further gains in AUD/USD pair. At 19:45 GMT, the Final Services PMI for December also declined to 54.8 against the predicted 55.2 and weighed on the US dollar that pushed the pair AUD.USD is higher on board. At 20:00 GMT, the Factory Orders for November rose to 1.0% against the predicted 0.7% and supported the US dollar that capped further gains in AUD/USD pair on Wednesday.


Daily Technical Levels

Support Resistance

0.7688 0.7806

0.7615 0.7851

0.7570 0.7924

Pivot Point: 0.7733

The AUD/USD pair has violated the upward channel at the 0.7780 level, and violation of this level has triggered a selling trend until the 0.7738 level. Our position is already in profit; we need to move our stop loss into the breakeven level. Check out a trade idea below. 

Entry Price – Sell 0.77578

Stop Loss – 0.77978

Take Profit – 0.77178

Risk to Reward – 1:1

Profit & Loss Per Standard Lot = -$400/ +$400

Profit & Loss Per Micro Lot = -$40/ +$40

Fellas, now you can check out forex trading signals via Forex Academy mobile app. Follow the links below.

iPhone Users: https://apps.apple.com/es/app/fasignals/id1521281368

Andriod Users: https://play.google.com/store/apps/details?id=academy.forex.thesignal&hl=en_US


Categories
Forex Signals

AUD/USD Plunges to Complete Retracement – Quick Trade Plan! 

The AUD/USD pair was closed at 0.77604 after placing a high of 0.7773 and a low of 0.76607. Despite the positive macroeconomic data from the US and the rising demand for safe-haven, the currency pair AUD/USD rose higher onboard amid the US dollar’s weakness. The greenback weakened after the beginning of the American session, and the US Dollar Index fell to its two-year lowest level at 89.44 on Tuesday ahead of the Georgia runoff election’s result. The Senate election will decide who will control the upper chamber of the US Congress. The incoming Democratic President, Joe Biden, will need the two seats to control the US Senate. The Republican Party has been controlling the US Senate since 2014, and if the Democratic Party wins this election, it would be beneficial for them.

On the data front, at 05:30 GMT, the ANZ Job Advertisements for December dropped to 9.2% against November’s 13.5% and weighed on the Australian Dollar that ultimately capped further gains in AUD/USD pair on Tuesday. From the US side, at 20:00 GMT, the ISM Manufacturing PMI from December rose to 60.7 against the anticipated 56.6 and supported the US dollar, and capped further gains in AUD/USD pair. The ISM Manufacturing Prices also surged to 77.6 against the predicted 66.0 and supported the US dollar that limited further AUD/USD pair gains. The Wards Total Vehicle Sales raised to 16.3M against the estimated 15.8M and supported the US dollar, ultimately limiting further gains in AUD/USD pair.

Meanwhile, the market’s risk appetite was declined as the number of coronavirus cases was increasing day by day throughout the globe. Since the pandemic started has reached 21M, the US count of total coronavirus cases is equal to the count of the next three countries, India, Russia, and Brazil. The UK also reported more than 60,000 cases in a single day on Tuesday that was the highest since the pandemic started, and imposed new tougher restrictions throughout the country. Moreover, Germany also extended its lockdown till the end of the month to control the rising number of coronavirus cases. All these developments added in the safe-haven appeal and weighed on the risk-sensitive Australian Dollar that failed to reverse the AUD/USD pair’s bullish movement on Tuesday.


Daily Technical Levels

Support Resistance

0.7688 0.7806

0.7615 0.7851

0.7570 0.7924

Pivot Point: 0.7733

The AUD/USD faced resistance at 0.7811 level and has dropped now to trade at 0.7776 level. On the lower side, the pair may find support at the 0.7738 level today. The MACD and RSI support bullish bias, while the 50 periods EMA is likely to extend support at the 0.7685 level. On the higher side, bullish breakout of 0.7811 level can trigger buying trade until 0.7864 level today. I will be looking to take a buy trade over the 0.7738 level today. Good luck! 

Categories
Forex Signals

USD/CAD Descending Triangle in Play – Quick Trade Idea! 

The USD/CAD pair was closed at 1.26689 after placing a high of 1.27909 and a low of 1.26556. The currency pair USD/CAD fell to its lowest since 2018 April on rising crude oil prices and the US dollar weakness. Despite Canada’s negative economic data and positive data from the US side, the currency pair USD/CAD still moved in the downward direction on Tuesday as investors’ focus was shifted on the OPEC meeting and Georgia’s runoff elections.

On the data front, at 18:30 GMT, the IPPI for November from Canada dropped to -0.6% against the expected -0.2% and weighed on the Canadian dollar that capped further losses in the USD/CAD pair. The RMPI for November also dropped to 0.6% against the expected 0.9% and weighed on the Canadian dollar that capped further losses in the USD/CAD pair on Tuesday. From the US side, at 20:00 GMT, the ISM Manufacturing PMI from December surged to 60.7 against the predicted 56.6 and supported the US dollar, and capped further losses in the USD/CAD pair. The ISM Manufacturing Prices also rose to 77.6 against the expected 66.0 and supported the US dollar that limited further losses in the USD/CAD pair. The Wards Total Vehicle Sales rose to 16.3M against the anticipated 15.8M and supported the US dollar that ultimately limited further losses in the USD/CAD pair.

The West Texas Intermediate (WTI) crude oil prices rose above $50 per barrel on Tuesday as Russia and the Organization of Petroleum Exporting Countries remained deadlocked over how much oil to produce from February. Russia and its neighbor Kazakhstan were both pressuring for the scheduled output increase of 500,000 barrels a day to come into effect, while OPEC, with what appears to be total unanimity, wanted to kept output at its present level due to short-term weakness in demand caused by the latest surge in coronavirus and imposed lockdowns in various countries.

The rising prices of crude oil gave strength to the commodity-linked currency Loonie and added weight on the currency pair USD/CAD. Meanwhile, Georgia’s runoff elections that will decide the US Senate’s future also kept the US dollar under pressure on Tuesday. The result of the elections is expected to announce on Wednesday, and investors were cautious ahead of it, and the selling pressure surrounding the greenback increased that ultimately weighed on the USD/CAD pair.


Daily Technical Levels

Support Resistance

1.2619 1.2758

1.2568 1.2844

1.2481 1.2896

Pivot Point: 1.2706

The USD/CAD’s technical side is trading at 1.2690, disrupting the support area of 1.2725 level, which is now working as a resistance for the USD/CAD pair. On the lower side, the support stays at the 1.2647 level, and a bearish breakout of this level can extend selling trend until 1.2591. Let’s wait for opening a sell trade below the 1.2725 level today. Good luck! 


Categories
Forex Signals

USD/CAD Bouncing off Over 1.2728 – Do We Have a Buying Trade?

The USD/CAD currency pair failed to stop its Asian session losing streak and remain depressed around the 1.2735 level, mainly due to the U.S. dollar weakness. However, the prevalent downtrend in the greenback is mainly tied to the Federal Reserve’s expectations would keep rates low for a prolonged period. Meanwhile, the optimism over a possible coronavirus vaccine and the probability of an additional U.S. financial aid package also played its major role in weakening the greenback, which adds further burden around the currency pair. 

In contrast to this, the prevalent downticks in the crude oil prices tend to weaken the commodity-linked currency the Loonie, which becomes the key factor that helps the currency pair to limit its deeper losses. As of writing, the USD/CAD currency pair is currently trading at 1.2736 and consolidating in the range between 1.2729 – 1.2792.

Despite the intensified Sino-US tussle and coronavirus (COVID-19) woes, the market trading sentiment managed to stop its previous session’s negative performance and started to flash green during the early European session on the day, possibly due to the fresh optimism over a potential vaccine/treatment for the highly infectious coronavirus. As per the latest report, the U.S. Food and Drug Administration (FDA) showed that almost 95% success ratio of the leading coronavirus vaccines after two doses. Moreover, the market trading sentiment got an additional lift from fresh hopes of the Democratic victory in the Georgian run-off, which sparked possibilities for additional fiscal support. Thereby, the prevalent upbeat market mood undermined the safe-haven assets, including the safe-haven U.S. dollar, and contributed to the currency pair losses.

As in result, the broad-based U.S. dollar failed to halt its overnight losing streak and remained bearish on the day. Meanwhile, the probability of an additional U.S. financial aid package and speculations that the Fed will keep interest rates lower for a longer period also exerted downside pressure on the greenback. The losses in the U.S. dollar kept the currency pair lower. Meanwhile, the U.S. Dollar Index that tracks the greenback against a bucket of other currencies dropped by 0.04% to 89.812 by 8:49 PM ET (1:49 AM GMT).

On the contrary, the crude oil failed to stop its early-day losing streak and remained depressed around below the $47.50 level on the day mainly due to the renewed concerns over the global economic recovery as the number of COVID-19 cases continues to increase in Europe, the U.S., and Japan. Across the pond, the reason for the losses in the crude oil prices could also be associated with Monday’s released downbeat China’s Caixin Manufacturing PMI data, which showed that the activity slowed in December. Hence, the decline in oil prices undermined demand for the commodity-linked currency the Loonie and became the key factor that helped the currency pair limit its deeper losses. 

Looking forward, the market traders will keep their eyes on the German Unemployment Rate, which is due at 08:55 GMT, and the US ISM Manufacturing, which is due for release at 15:00 GMT. The updates about the U.S. stimulus package and the virus will not lose their importance across the ocean. 


Daily Support and Resistance

S1 1.2691

S2 1.2706

S3 1.2713

Pivot Point 1.2722

R1 1.2729

R2 1.2738

R3 1.2754

The USD/CAD pair is trading with a bullish bias at the 1.2764 level, holding above a support level of 1.2728, and it may head higher until the next target level of 1.2798 level. On the hourly timeframe, the USD/CAD is holding over 50 EMA, which is supporting bullish bias in the Loonie, whereas the MACD is staying in a selling mode. Let’s consider taking sell trade below the 1.2793 level and buying over 1.2728. Good luck! 

Categories
Forex Signals

AUD/USD Heading North to Test Triple Top – Brace for Selling! 

During Tuesday’s European trading session, the AUD/USD currency pair succeeded to extend its previous session winning streak and caught some further bids around above 0.7700 level mainly due to the fresh upticks in S&P 500 futures, which tend to underpin the perceived risk currency Australian dollar and contributes to the currency pair gains. Hence, the market trading sentiment got support from the fresh hopes of the coronavirus vaccine and the U.S. covid stimulus.

Across the pond, the broad-based U.S. dollar selling bias, triggered by multiple factors, also played its significant role in supporting the currency pair. In contrast to this, the long-lasting coronavirus woes globally keep questioning the market’s upbeat mood, which becomes the key factor that kept the lid on any additional gains in the currency pair. The AUD/USD currency pair is currently trading at 0.7716 and consolidating in the range between 0.7661 – 0.7725.

Despite the prevalent burden of the coronavirus (COVID-19) resurgence, the market trading sentiment stopped its previous session bearish moves and started to flash green amid fresh optimism over a potential vaccine/treatment for the highly infectious coronavirus. As per the latest report, the U.S. Food and Drug Administration (FDA) showed that almost 95% success ratio of the leading coronavirus vaccines after two doses. Moreover, the global markets put high hopes of the Democratic victory in the Georgian run-off, which sparked additional fiscal support possibilities. Thereby, the prevalent upbeat market mood underpinned the Australian dollar’s perceived risk currency and contributed to the currency pair gains.

On the bearish side, the intensifying worries about the continuous surge in new COVID-19 cases kept challenging the upbeat market sentiment and became one of the key factors that kept the lid on any additional currency pair gains. As per the latest report, Japan saw a record number of COVID-19 cases in recent days, which in turn, Prime Minister Yoshihide Suga said that he would consider declaring a fresh state of emergency in the Tokyo area. Across the ocean, the U.K. Prime Minister Boris Johnson also gave warnings over the possibility of tougher lockdown restrictions in the U.K.

Looking forward, the market traders will keep their eyes on the German Unemployment Rate, which is due at 08:55 GMT, and the US ISM Manufacturing, which is scheduled for release at 15:00 GMT. Meanwhile, the updates about the U.S. stimulus package will be key to watch. Furthermore, the risk catalyst like geopolitics and the virus woes, not to forget the Brexit, will not lose their importance. 


Daily Support and Resistance

S1 0.7656

S2 0.7679

S3 0.7692

Pivot Point 0.7703

R1 0.7716

R2 0.7726

R3 0.775

The AUD/USD pair is trading at the 0.7719 level, heading further higher, and it may find resistance at the 0.7740 level. The 50 periods EMA supports the pair at the 0.7695 level as the MACD also suggests a strong buying trend. On the lower side, the pair may find support at the 0.7684 level today. Let’s consider taking a buying above 0.7685 and selling below 0.7740 level today. Good luck! 

Categories
Forex Signals

EUR/JPY Crosses Below 50 Periods EMA – Sell Signal in Play!

The EUR/JPY is trading sideways at 126.564 – 126.105, having crossed below 50 periods EMA. On the higher side, the EUR/JPY may find resistance at the 126.450 level. The EUR/JPY is trading bearish amid a surge in safe-haven appeal. The reason for the bearish trend in the EUR/JPY as prices for crude oil fell, and gold surged.

One of the reasons behind increased safe-haven appeal can be linked with the dip in crude oil prices. Crude oil prices could also be associated with the previous day released downbeat China’s Caixin Manufacturing PMI data, which confirmed that the activity slowed in December. The gauge dropped to 53.00 in December from November’s 54.9, against the expected figures of 54.9. The government PMI also fell to 51.9 in December from 52.1 in November.

Despite the risk-off market sentiment, the broad-based U.S. dollar failed to gain any positive traction and edged lower on the day amid the probability of an additional U.S. financial aid package and speculations that the Fed will keep interest rates lower for a longer period. Apart from this, the optimism over a possible coronavirus vaccine urges investors towards riskier currencies and higher-yielding assets rather than the safe-haven asset, which eventually leads to further losses in the safe-haven U.S. dollar. However, the losses in the U.S. dollar kept the USD/JPY currency pair lower. As of now, the U.S. Dollar Index that tracks the greenback against a bucket of other currencies dropped by 0.04% to 89.812 by 8:49 PM ET (1:49 AM GMT).

On the contrary, the U.S. Food and Drug Administration (FDA) showed an approximately 95% success ratio of the leading coronavirus vaccines after two doses, which becomes the key factor that helps the currency pair limit its deeper losses.

The EUR/JPY is likely to find resistance at the 126.420 level; thus, we have opened a sell trade. Check out the trade setup below.


Entry Price – Sell 126.22

Stop Loss – 126.62

Take Profit – 125.82

Risk to Reward – 1:1

Profit & Loss Per Standard Lot = -$400/ +$400

Profit & Loss Per Micro Lot = -$40/ +$40

Fellas, now you can check out forex trading signals via Forex Academy mobile app. Follow the links below.

iPhone Users: https://apps.apple.com/es/app/fasignals/id1521281368

Andriod Users: https://play.google.com/store/apps/details?id=academy.forex.thesignal&hl=en_US

Categories
Forex Signals

Upward Channel Supporting Buying in Aussie – Get Ready for a Breakout Trade! 

The AUD/USD continues trading bullish at the 0.7740 level, heading further higher, but only if the Aussie gets to violate the 0.7740 resistance level. The dollar seems to get weaker amid a rising number of coronavirus cases despite the vaccine rollout raised fears and supported the appeal for safe-haven, but the dollar is getting weaker. Ultimately weighed on the risk-sensitive Aussie that added in the losses of the AUDUSD pair.

The currency pair AUD/USD posted losses for the day despite the US dollar’s weakness on Monday. The US dollar was weak across the board as the investors were cautious about putting any strong position in the market ahead of Tuesday’s Georgia’s Electoral runoff and Wednesday’s FOMC release of meeting minutes from December. Furthermore, the US caseload of coronavirus infections surpassed the 21,110,917 number and weighed on local currency as the country was worst-hit by the virus. 

Meanwhile, on the data front, at 06:45 GMT, the Caixin Manufacturing PMI from December dropped to 53.0 against the expected 54.7 and weighed on China-proxy Aussie that ultimately added losses in AUD/USD pair. 

At 10:30 GMT, the Commodity prices for the year from Australia came in as11.7% in December against the previous 2.5%. From the US side, at 19:45 GMT, the Final Manufacturing PMI from the US for December is projected to come as 56.3 against the previous 56.5 that could hurt the US dollar and limit further losses in AUD/USD pair. At 20:00 GMT, the Construction Spending for November is anticipated to fell to 1.1% against the previous 1.3% that could also hurt the US dollar and limit further losses in AUD/USD pair.

Daily Technical Levels

Support Resistance

0.7667 0.7732

0.7639 0.7771

0.7601 0.7798

Pivot Point: 07705

The AUD/USD consolidates in a narrow trading range of 0.7685 – 0.7740 level, and a bullish breakout of this range can trigger further upward trend until 0.7802 level, while on the lower side, the support continues to hold at 0.7686 level. A bearish breakout of 0.7686 level is likely to drive selling until the 0.7636 mark. Let’s brace for a breakout. Good luck! 


Categories
Forex Signals

Gold Breakout Ascending Triangle Pattern – Bullish Bias Dominates! 

During Monday’s Asian trading session, the precious metal managed to extend its early-day positive performance and remained bullish around above the $1,920 level as the sharp rise in global COVID-19 cases and the possibility of more countries imposing tighter restrictions tend to underpin the safe-haven yellow metal. Meanwhile, the broad-based U.S. dollar weakness, triggered by the market upbeat mood, also played its key role in underpinning the gold prices as the price of gold is inversely related to the price of the U.S. dollar. However, the market trading sentiment was being supported by the optimism surrounding the coronavirus (COVID-19) vaccine, Brexit headlines, and the U.S. covid aid package. 

In that way, the upbeat market sentiment was seen as one of the key factors that kept the lid on any additional gold gains. Furthermore, the upticks in the gold prices could also be attributed to the escalating US-China tussles, which eventually lend some support to the safe-haven yellow metal. As of writing, the yellow metal prices are currently trading at 1,923.70 and consolidating in the range between 1,893.81 – 1,925.35.

The market trading sentiment managed to extend its last week’s positive performance and stay positive on the day as the U.S. stocks futures’ bullish appearance tends to highlight the risk-on sentiment. Behind this positive performance was the optimism surrounding the coronavirus (COVID-19) vaccine, Brexit headlines, and the U.S. covid aid package. Across the ocean, the latest upbeat prints of Asian activity numbers from Japan, South Korea, Indonesia, and Taiwan for December also played its major role in underpinning the market trading sentiment. However, the positive tone around the market sentiment favors the gold buyers via U.S. dollar weakness.

As a result of the risk-on mood, the broad-based U.S. dollar failed to gain any positive traction and remained bearish on the day. Meanwhile, the losses in the U.S. dollar were further bolstered by the easy money policy of the U.S. Federal Reserve and central bankers elsewhere. It is worth mentioning that the U.S. Federal Reserve is set to release the minutes from its December meeting on Wednesday. In that way, the market players will be looking for more detail on making their forward policy guidance more explicit and the chance of a further increase in asset buying in 2021. Hence, the losses in the U.S. dollar becomes the key factor that helps the gold to stay bid as the price of gold is inversely related to the price of the U.S. dollar. 

Elsewhere, the upticks in the gold prices could also be attributed to the concerns over the coronavirus (COVID-19) and tussles between the U.S. and China. The coronavirus (COVID-19) cases continue to rise, with above 85 million COVID-19 cases as of Jan. 4, with over 20.6 million cases of them in the U.S. Apart from the U.S., Japan is also gaining attention amid the recent surge in the cases and the death toll. As per the latest report, Japan recorded more than 3,100 new cases overnight. While Tokyo reported 816 new infections, bringing the cumulative total to 62,590, the largest among the country’s 47 prefectures so far. This, in turn, the government of Japan is seeking expert advice on whether to declare a state of emergency in Tokyo and neighboring prefectures. 

Looking forward, the market traders will keep their eyes on Caixin Manufacturing PMI for December, which is expected to reprint 54.9. Meanwhile, the second readings of monthly PMIs from Europe, the U.K., and the U.S. can decorate the calendar ahead. In addition to this, the updates about the U.S. stimulus package will be key to watch. In the meantime, the risk catalyst like geopolitics and the virus woes, not to forget the Brexit, will not lose their importance. 


Daily Support and Resistance

S1 1863.1

S2 1879.13

S3 1888.81

Pivot Point 1895.17

R1 1904.84

R2 1911.2

R3 1927.24

On Monday, the gold is trading sharply bullish at the 1,925 level. Gold has disrupted the ascending triangle pattern at the 1,898 mark on the daily chart, and now gold is likely to encounter resistance at 1,933 and 1,965 marks. The buying trend can be seen in gold, but unfortunately, our trades are closed at stop loss. I will be looking to take another buying trade once gold retraces back to 1,913 level. Good luck!