Categories
Forex Daily Topic Forex Price Action

Double Top-Engulfing Combination and Trade Management

In today’s lesson, we are going to demonstrate an example of daily-H4-combination trading. The trade setup starts with a double top, and the trend-initiating candle comes out as a bearish engulfing candle. The price consolidates and produces another bearish engulfing candle closing below consolidation support. We find out what happens next and how we may manage the trade to get the best result out of it.

This is an H4 chart. The chart shows that the price produces a double top. At the second rejection, the reversal candle comes out as a bearish engulfing candle and drives the price towards the South with good bearish momentum. Upon finding its support, it consolidates for a while and produces another bearish engulfing candle. We know what the daily-H4 combination traders are to do here.

The daily-H4 combination traders may trigger a short entry right after the last candle closes by setting stop-loss above consolidation resistance and by setting take profit with 1R. Let us proceed to the next chart to find out what the price does after triggering the entry.

The next candle comes out as a bearish candle as well. It looks good for the sellers. It seems the price may not take too long to hit the target of 1R. Let us proceed to the next chart.

It does not look good for the sellers now. The last candle comes out as a bullish engulfing candle. It suggests that the price may get bullish and hit the stop loss. Since this is an H4 chart, traders are to manage their trades according to the candlestick. The entry is carrying a loss now. Traders have three options here.

  1. They may close the whole entry
  2. They may let the whole trade run
  3. They may close 50% of the entry

It depends on an individual trader how he likes to manage his trades. Some traders may want to keep the whole trade, and some may want to close the whole trade. There is a saying that cut your losses short and let your profit run. Thus, we may manage the trade by closing half of it and let the rest of it run. This is how we earn or lose 50% of the initial target. Let us see how it goes now.

The chart produces a spinning top and heads towards the downside. The last candle comes out a hammer, but it hits the target of 1R. This means the trade setup brings profit for the sellers. It may have gone another way round. Thus, in such a situation, taking out half of the trade offers us less profit but less loss as well in the end. It does not always happen. However, when it does, we may consider managing the trade by doing it so.

Categories
Forex Daily Topic Forex Price Action

The H1-15M Combination Trading in a Bearish Market

In today’s lesson, we are going to demonstrate an example of the H1-15M combination trading strategy offering a short entry. In one of our previous lessons, we demonstrated an example of a long entry. Let us see how it ends up offering us the entry.

This is an H1 chart. The chart shows that the price gets caught within two horizontal levels. The chart shows that the price after getting the last rejection has been heading towards the South. The sellers are to wait for a bearish breakout to go short in the pair.

Here it comes. The last candle breaches the level of support closing well below it. The H1-15M combination traders may flip over to the 15M chart to get a bearish reversal candle for triggering a short entry. Let us flip over to the 15M chart.

This is how the 15M chart looks. As expected, the last candle comes out as a bearish candle. If the next 15M candle comes out as a bearish candle closing below the last candle, the sellers may trigger a short entry. If the chart consolidates, the sellers are to wait for a 15M bearish reversal candle to take the entry. Let us find out what happens here.

The chart produces a bullish corrective candle. The sellers are to wait for a bearish reversal candle to go short in the pair. Usually, if the price makes a correction, it goes towards the breakout level and produces a reversal candle there. Let us find out where it produces a bearish reversal candle for the sellers.

The chart produces a bearish engulfing candle closing below consolidation support. The sellers may trigger a short entry right after the last candle closes. Stop Loss and Take Profit are to be set according to the H1 chart. Stop Loss is to be set above H1 horizontal resistance before the breakout, and Take Profit is to be set with 1R. Let us now find out how the entry goes.

This is the H1 chart. We see that the price heads towards the South with good bearish momentum and hits the target of 1R with ease. After producing the 15M bearish reversal candle, the price never looks back but goes towards the trend’s direction. This is what usually happens in the H1-15M combination trading. The price heads towards the trend’s direction without wasting time.

Do a lot of backtesting in your trading chart to find out some entries based on the H1-15M chart. Then, do some demo trading with the strategy before going live. It will help you be a better trader.


Categories
Forex Daily Topic Forex Price Action

When a Double Top and an Engulfing Candle Comes Together

In today’s lesson, we are going to demonstrate an example of a chart where the price heads towards the downside upon making a double top. At the second rejection, the chart produces a bearish engulfing candle. Usually, a combination of these two does not usually go wrong. The price does not make a deep consolidation afterward. However, it still heads towards the South with good bearish momentum. Let us have a look at how it happens.

This is a daily chart. The chart shows that the last candle comes out as a Shooting Star. The daily –H4 combination traders may consider it as a bearish reversal candle and flip over to the H4 chart.

The H4 chart shows that the price produces a double top. At the second bounce, the reversal candle comes out as a bearish engulfing candle. This combination may attract the sellers to look for short entries upon consolidation and getting bearish reversal candle.

The chart produces a bullish candle. It finds its resistance and produces a bearish engulfing candle closing below consolidation support. The sellers may trigger a short entry right after the last candle closes by setting stop-loss above consolidation resistance and take profit with 1R. Here is an equation that we may think about that. The price does not make a deep consolidation. Since the price is bearish upon a double top and an engulfing candle, most probably, it will make a strong bearish move. However, if you are in doubt, leave it out. Let us proceed to the next chart to find out what happens.

The next candle comes out as a doji candle. The price heads towards the Stop Loss, but it does not hit, though. It looks good for the sellers since the candle closes below the breakout level. Let us proceed to the next chart to find out what the price does.

The chart produces a long bearish candle and hits the target of 1R. Shallow consolidation may hold the price back a little to hit the target in a hurry. However, in the end, the sellers make some green pips with a combination of a Double Top and an Engulfing candle.

This trade setup does not meet all the requirements for combination breakout trading. The trend starts from a Double top resistance along with a bearish engulfing candle; it continues its bearish journey with more candles even after a shallow consolidation. This is what a combination of a Double Top/Bottom along with an engulfing candle can do. Thus, be keen on a chart if a trend starts with a combination of these two.

Categories
Forex Daily Topic Forex Price Action

The H1-15M Combination Trading Has a Lot to Offer

In today’s article, we are going to demonstrate a combination strategy. The combination is made of the H1 and the 15M chart. Since these two are busy intraday charts, thus a trader can find a good number of entries with this strategy. Let us now proceed and find out how it works.

The above image displays the H1 chart. The chart shows that the price gets caught within two horizontal levels. At the last bounce, the chart produces a bullish engulfing candle and heads towards the North. The sellers may wait for the chart to produce a bearish reversal candle at the level of resistance. On the other hand, the buyers are to wait for a breakout at the level.

The bull wins. A good-looking bullish candle breaches through the level of resistance, closing well above the level of resistance. Some traders may trigger a long entry right after the last candle closes. Some may initiate their long entries by setting limit order above the level of resistance. Every strategy has some advantages as well as disadvantages. Anyway, we are going to flip over to the 15 M chart to trigger an entry.

This is how the 15M chart looks. The last candle closes as a bullish candle too. This suggests that the bull has taken control. The H1-15M combination traders are to wait for the price to consolidate and produce a 15 M bullish candle to offer them a long entry.

The chart produces a bearish engulfing candle followed by a bullish engulfing candle. The buyers (H1-15M combination traders) may trigger a long entry now. The stop loss is to be set below the level of new support (breakout level), and take profit may be set with 2R. Let us proceed to the next chart to find out what the price does after triggering the entry.

This is the H1 chart. The chart shows that the price heads towards the North with good bullish momentum. The buyers achieve their 1R with ease. The point we may notice that the price never even comes back to the breakout level again after triggering the entry.

By using the H1-15M strategy, traders can get an excellent risk-reward. It offers a high winning percentage as well. In most cases, the price heads towards the trend’s direction with good momentum. On the contrary, the 15M chart may not always consolidate and produce the signal candle. Thus, traders may not get as many entries as they would like. However, since it is the H1-15M combination, it still offers a good number of entries per week in major pairs.

Categories
Forex Daily Topic Forex Price Action

Spot the Chart Accordingly before Triggering for an Entry

In today’s lesson, we are going to demonstrate an example of a chart, which may entice traders to take entry more than once. Some traders may get themselves engaged in taking entry. We find out why we price action traders skip taking those entries. Let us get started.

This is an H4 chart. The price makes a strong bearish move by producing three consecutive Marubozu bearish candles. The last candle comes out as a doji candle. The price may consolidate now. The sellers are to wait for a strong bearish reversal candle upon consolidation to go short in the pair. Let us proceed to the next chart.

The chart produces a bearish Marubozu candle again. As a reversal candle, it is a strong one. However, the price has not consolidated well. It has produced the bearish reversal candle upon having a shallow consolidation. Moreover, the last candle does not close below the level of support. Thus, the sellers may skip taking the entry but wait for the right time to come. The chart still looks good for the sellers.

The chart produces a bullish engulfing candle. The price may make a deeper consolidation this time. The sellers may keep their eyes on the chart again to go short in the pair. Let us proceed to the next chart to find out what happens next.

The price makes a deeper consolidation. Upon finding its resistance, it makes a bearish move. It seems that the price may make a breakout here. A question may be raised here whether the sellers on the H4 chart shall take the entry or not? We find out the answer in a minute. Meanwhile, let us proceed to the next chart.

The next H4 candle closes well below the level of support. The pair trades below the breakout level for one more candle as well. However, the sellers on the H4 chart may skip taking the entry. The reason behind that is the chart takes more than six candles (a day) to make the breakout. This level of support is a daily level of support now. Thus, the sellers may take the trading decision as far as the daily chart is concerned. If they take their trading decision by observing the H4 chart, it may not be that fruitful. The risk-reward may not be a good one. It may not end up being a daily breakout, but the price may come back in. Or, the daily chart may produce a bullish corrective candle next day, which makes the price hit the H4 sellers stop loss. Thus, in such cases, they might have to take losses only because the pair belongs to the daily chart. Thus, for better trading, traders shall take a closer look before taking entry on a chart to determine whether it favors their trading chart.

Categories
Forex Chart Basics Forex Daily Topic

Chart Combination Traders: Do Not Forget to Calculate This

In today’s lesson, we are going to demonstrate an example of the Daily-H4 chart combination, which may end up producing a trading signal. We find out soon whether it produces a trading signal or not in the end. Let us get started.

This is the daily chart. The chart shows that the price makes a strong bullish move. It seems that the price has found its resistance. The last candle comes out as a bearish engulfing candle. This suggests that the sellers in the intraday charts may get themselves engaged to look for short opportunities in the pair. Let us flip over to one of the major intraday major charts, the H4 chart.

The chart shows that the price makes a strong bearish move and produces a bullish engulfing candle followed by a bearish inside bar. However, the daily candle ends up being a bearish engulfing candle, thus the H4 sellers have an upper hand than the buyers.  Let us proceed to the next chart with some drawings in it.

The price bounces off at the red marked level. The sellers are to wait for the price to make a breakout at the level of support to go short in the pair. The last candle in this chart comes out as a bearish inside bar. The price may head towards the level of support and make the breakout. However, the sellers may have to wait since an inside bar is not a strong reversal candle. Let us find out what happens next.

The price heads towards the South and bounces off several times at the level of support. It does not make the breakout though. The last candle comes out as a bullish engulfing candle too. A bullish engulfing candle at the level of support indicates that the buyers may get themselves engaged in buying soon. Moreover, there are six H4 candles after that bearish engulfing daily candle (A trading day contains six H4 candles). The level of support has become daily support now. Thus, the H4 sellers must wait for the daily chart to produce another bearish candle before going short in the pair.

It is often seen that if an H4 candle breaks a daily support/resistance, the price does not head towards the breakout direction in a hurry. It often consolidates around the level, which sometimes makes traders lose money. The same thing shall be maintained in the H4-H1 chart combination as well. If an H1 candle does not make a breakout (after an H4 reversal candle) within next four H1 candles, the support resistance becomes H4 support/resistance. Traders shall wait for upcoming H4 candles to give them the price direction and trade.

Categories
Forex Daily Topic Forex Fibonacci

Draw Fibonacci Levels on Your Trading Chart

Fibonacci traders are to find out a good move, followed by a price correction. They keep their eyes on the 61.8% level with extreme attention. If the level of 61.8% produces a reversal candle, traders trigger for entry. Usually, the price goes up to the level of 161.8% if the price trends from 61.8%. This allows an excellent risk-reward to the traders as well. In today’s article, we are going to demonstrate an example of how the golden ratio of 61.8% plays such an important role in moving the market towards the trend. Let us get started.

The chart shows that it makes a bullish move upon producing a bullish engulfing candle. The price makes a downside correction and moves towards the North again. This time the price makes the move with good bullish momentum. The Fibonacci traders are to wait for the price to make a downside correction and draw Fibonacci levels to go long in the pair. Let us proceed to the next chart to find out whether it starts having downside correction or heads towards the North further.

This is an interesting move by the chart. It has a bearish gap, but the candle comes out as a bullish candle. Despite having an upper shadow, this is a bullish reversal candle. Let us find out how the price reacts upon getting such a bullish reversal candle.

The price heads towards the North with extreme bullish momentum. The bull outplays the bear. This is such a strong bullish move that the buyers would love to make full use of it. Do you notice something interesting? Yes, the price trends from the 61.8% zone. Let us draw the Fibonacci levels and see how it looks.

The chart shows that despite having a bearish gap, the chart produces a bullish candle within 61.8% zone and heads towards the North. It hits the level of 161.8% in a hurry as well. This is what the Fibonacci golden ratio level does almost all the time. There are different ways of trading and catch such a move. Some traders enter before the breakout, while some enter after the breakout at the highest high of the wave. Both have merits and demerits, which we will learn in our forthcoming Fibonacci lessons. Meanwhile, concentrate on your chart and practice drawing Fibonacci levels by pointing out the highest high and the lowest low. Start practicing this, so you get well acquainted with Fibonacci significant levels and how the price reacts to them. This will help you trade much better soon.

Categories
Forex Daily Topic Forex Fibonacci

Fibonacci Trading: The Golden Ratio

Fibonacci trading is one of the most prolific trading methods, which is widely used by Forex traders. Retracement length, Fibo levels as well as reversal candle are three factors that Fibonacci traders need to pay attention to. In today’s article, we are going to demonstrate an example of a chart, which makes an excellent bearish move after having a retracement. The length of retracement, the most significant Fibo level, and the reversal signal all play their part in this example. Thus, fasten your seat belt and read through.

The chart shows that it makes a strong bearish move and makes a breakout at long-held support. The price heads towards the South, searching for its support. The sellers are to wait for the price to have a retracement.

The price starts having retracement. It produces a bullish inside bar followed by another bullish candle. The sellers are to wait for the price to find its resistance and produce a bearish reversal candle. However, the Fibonacci traders are to wait for the price to produce a bearish reversal candle at a very particular level, which is the 61.8 level.

The chart produces a bearish engulfing candle closing well below the last bullish candle. The Fibonacci traders must draw the Fibonacci retracement levels to find out which level produces this reversal candle. If this is the level of 61.8, the Fibo sellers are going to go short in the pair.

The highest high is the level of 0.00, and the lowest low is the level of 100.0. The price has a retracement and produces a bearish engulfing candle right at Fibo level 61.8. Usually, when the level of 61.8 works as support/resistance, it drives the price towards the level of 161.8. This means the price may head towards the South and hit the level of 161.8 next. Let us proceed to the next chart and see what the price does here.

The price hits 161.8 level. It makes an upward correction on its way. However, it reaches the level at last. The last candle shows that it breaches the level of 161.8. The price may head towards the South further.

The level of 61.8 is called the Golden ratio. It is a super significant level as far as Fibonacci Retracement is concerned. The buyers in a buying market and the sellers in a selling market wait for the price to produce a reversal candle/signal candle to go long/short in a pair. Yes, there some equations for the traders to know and obey to be able to trade with Fibonacci retracement. Once they learn them well, Fibonacci trading can make them a handful.

Categories
Forex Daily Topic Forex Fibonacci

Fibonacci Retracement: A Magic Trading Tool

Financial traders rely a lot on a tool called Fibonacci Retracement. This shows the percentage of retracement that the price makes after making a strong bullish/bearish move. The percentage of retracement is very significant to the traders. There are some particular levels, where the price reacts heavily and creates a new trend. Thus, financial traders use Fibonacci Retracement tool to measure retracement length and find the potential whether it is going to create a new trend or not. The Forex traders love using the Fibonacci Retracement tool as well. Once we know how to draw it on the chart accordingly, we find out that the currency pairs on almost all the timeframes obey the Fibonacci retracement ratio.

Leonardo Fibonacci, an Italian mathematician, identified a series of numbers such as 0, 1, 1, 2, 3, 5, 8. 13, 21, 34, 55, etc. Each number is the sum of the preceding two numbers.  These numbers produce some significant ratios, such as 23.6. 38.2, 50, 61.8. 78.6, 100, 123.6, 138.2, 161.8. These ratios and the Fibonacci sequence are found in nature as well. Thus, people love using the sequence ratios in their design and plan. At the end of the day, people run financial markets. They buy or sell at certain levels. Since Fibonacci ratios are much related to our nature and life, traders love using these ratios to help decide where to buy and where to sell.

As far as Fibonacci ratios are concerned, the 61.8 is considered as the golden ratio. It is found in flower petals, seed heads, pinecones, fruits and vegetables, tree branches, shells, spiral galaxies, hurricanes, fingers, animal bodies, reproductive dynamics, animal fight patterns, DNA molecule, etc.

In the financial/Forex market, the ratios are used by using a tool called Fibonacci Retracement. There are other Fibonacci tools, but this one may be the trader’s most favorite.

In a buying market, a trader draws his Fibonacci retracement levels from the lowest low to highest high.

The level of 00.00 is the lowest low, and the 100.00 is the highest high of a bullish wave. Traders are to wait for the price to make a bearish retracement. All these levels are significant, and the price reacts to these levels. However, the buyers pay more attention when the price is around 61.8 level to go long in a pair.

In a bearish market, it is just the opposite. Let us have a look at how it looks like.

Fibonacci Retracement levels help traders spout out the trend’s initiating point. Thus, it becomes easy for the traders to take entry with excellent risk-reward. In our forthcoming articles, we are going to demonstrate charts on different pairs, time frames to find out how the price reacts to different Fibonacci levels. Stay tuned.

Categories
Forex Daily Topic Forex Price-Action Strategies

Forex Price Action: A Losing Trade

Forex trading is considered one of the riskiest businesses. The market is volatile and it gets unpredictable from time to time. There is no trading strategy, which can guarantee one hundred per cent success. Thus, Forex traders must be mentally prepared to take losses. In today’s lesson, we are going to demonstrate an example of a losing trade.

The chart shows that the price upon finding its resistance heads towards the South with good bearish momentum. The first candle comes out as a bearish engulfing candle followed by two bearish candles. These suggest that the bear takes control. The sellers are to wait for the price to consolidate and a bearish engulfing candle to go short in the pair. Let us proceed to the next chart to find out what the price does.

The price finds its support. It produces a bullish inside bar followed by two doji candles. It seems that the price has been searching for its resistance. The sellers are to keep their eyes on this chart.

The price finds its resistance. It produces a bearish engulfing candle closing below consolidation resistance. Without any doubt, this is an A+ breakout candle. The sellers may trigger a short entry right after the candle closes by setting stop loss above consolidation resistance and by setting take profit with 1R. Let us find out how the trade goes.

It looks fantastic for the sellers. The next candle comes out as a bearish candle as well. Consecutive two bearish candles suggest that the bear is in a hurry to hit the take profit. The sellers may not have to wait too long to achieve their target as far as the price action in this chart is concerned.

Would you believe it? The next candle comes out as an inverted hammer. The upper shadow hits the stop loss. The sellers are out with their entry with a loss. That was beyond their imagination some might say. However, it happens a lot in the Forex market. Thus, traders must not be overconfident with any entry. Discipline and money management are to be maintained with every single trade.

Some traders, especially at the beginning can’t take losses easily. It bugs them up. Losing money may make them think something is wrong with their strategy. There is nothing wrong if traders want to try to develop new strategies. However, they should not just lose the belief and abandon a long proven strategy all of a sudden.

Categories
Forex Daily Topic Forex Price-Action Strategies

Price Action Trading and Trade Management

Trade management is such an important factor in Forex trading. Managing trades effectively saves traders from making a loss or help them secure their profit. Sometimes traders are to close their trades earlier or lock the profit. This shall be done only when trading is done on major time frames such as the H4, the daily, or the weekly, though. In today’s lesson, we are going to demonstrate an example of an early exit in the H4 chart.

The chart shows that the price makes a strong bearish move. It makes a breakout and produces a bullish inside bar. The H4 breakout traders are to wait for the price to find its resistance and produce a bearish engulfing candle to offer them a short entry. The price is at the breakout level. It seems that the breakout level is going to play a vital role here.

The chart produces a bearish spinning top and a bullish candle. However, the breakout level works as a level of resistance and produces a bearish engulfing candle closing well below consolidation support. The sellers may trigger a short entry right after the candle closes by setting stop-loss above the breakout level and by setting take profit with 1R. The signal candle suggests that the sellers do not have to wait too long to achieve their target.

As expected, the next candle comes out as a bearish Marubozu candle as well. The sellers would love to get a bit longer bearish candle. However, as long as it comes out as a bearish candle, they should be happy with it. Remember, this is an H4 chart. Thus, a bearish Marubozu candle means a lot for the sellers. It seems the price is going to take one more candle to hit the target.

The next candle comes out as a Bearish Marubozu candle as well. However, it does not hit the target 1R. A very few pips are left to achieve the target. The sellers must wait. The last candle suggests that it is only a matter of time for the sellers to reach their destination. Let us proceed to the next chart and find out what happens next.

The last candle comes out as a bullish engulfing candle. This does not convey a good message for the sellers. The price is yet to hit the target. They have some profit running in the trade. What should the sellers do here?

If it is an inside bar bullish candle, the sellers should keep holding the position to hit the target. However, the last candle comes out as a bullish engulfing candle (in an H4 chart). This means a lot for the minor intraday buyers. Thus, the best thing to do would be if the trade is closed manually, right after the last candle closes. It gets the sellers some profit, at least. Yes, the target is not achieved, and some profit is lost. Take it easy. Things go according to plan and sometimes don’t. This is what trading is all about.

Categories
Forex Daily Topic Forex Price-Action Strategies

Example of a Breakout Unfit for an Entry


In today’s lesson, we are going to demonstrate an example of a breakout on the H4 chart. The chart shows that the price heads towards the North with good momentum. It makes a bullish breakout upon consolidation. However, the breakout is not the kind that the breakout traders look for. Thus, this is going to be an example which we should skip taking entry. Let us now have a look at what happens.

The chart shows that it produces a bullish candle followed by a bearish inside bar. The next candle comes out as a bullish engulfing candle. Do you notice something here? Yes, this is an entry for the buyers. However, this is not where we concentrate today. Let us proceed to the next chart to dig out the main story.

The price keeps going towards the North. The buyers are to wait for the price to consolidate and produce another bullish engulfing candle to offer them entry. The way it has been going, it seems that the buyers hold the key and dominate over the sellers.

The price makes a bearish correction and finds its support. The first bullish reversal candle comes out as a bullish inside bar. This is not a strong bullish reversal candle. It produces three more bullish candles but the price does not make a breakout at the level of resistance. The last candle closes within the level of resistance, which is a point to be noticed. It means even the next candle makes a breakout, it would be a breakout right from the level of resistance.

The next candle closes well above the level of resistance. This is a breakout but not the kind of breakout that the breakout buyers wait for. The price is trending towards the upside; it consolidates and makes a bullish breakout. These three equations suggest that the buyers may take a long entry. They must not forget that the breakout candle does not make an explicit breakout. If a breakout takes place by one bullish engulfing candle that brings momentum. Over here, it needs four candles to make the breakout. Moreover, the breakout candle forms right at the level of resistance (now support). The buyers may restrain themselves from taking such entry. Let us find out what the price does next.

The price comes back to the breakout level. This is what usually happens when the price does not make a breakout with an A+ breakout candle. The price may still head towards the North, but 1 out of 3 times, it may come back in and hits the stop loss. Thus, to have winning consistency, we might as well skip taking entry in such price action.

Categories
Forex Daily Topic Forex Price-Action Strategies

H1 Breakout Trading: Keep Holding Your Positions

Price action traders are to maintain discipline with their entry and trade management. As far as trade management is concerned, it varies on time frames. Trade management on the H4 chart and the H1 chart is different. A reversal candle on an H4 chart has more potential to change the existent trend. Thus, traders may need to think about an early exit. On the other hand, H1 breakout traders may keep holding their positions until it reaches the target. In today’s lesson, we are going to demonstrate an example of this.

The chart shows that the price after being bullish has rejections at a level of resistance. The price heads towards the North but does not make any breakout. It has been in the bearish correction again. Let us see whether it finds its support and makes a bullish breakout or not.

Here it comes. The price finds its support and produces a bullish engulfing candle breaching the level of resistance. This is an A+ breakout candle. The buyers are to wait for the next candle to close above the breakout candle to trigger a long entry.

The next candle comes out as a bullish candle as well. It has an upper shadow, but the last 15 candle comes out as a bullish candle. The buyers may trigger a long entry right after the last candle closes by setting stop loss below the support level and take profit with 1R.

The price heads towards the North. However, it seems that the price does not head towards the target with good bullish momentum. Moreover, the last candle comes out as a bearish engulfing candle. This is ominous for the buyers. Do not forget this is an H1 chart, and the buyers are not supposed to take an early exit. They should keep holding their position and wait for the price to do the rest.

The price gets rather choppy. It has been testing traders’ patience. It is hard to keep holding positions. However, traders must not keep looking at the chart. Meanwhile, they might as well concentrate on other charts to find out potential entries.

Patience pays back to the buyers at last. The last candle comes out as a bullish candle, which helps the buyers to reach their take profit target. In the end, the trade goes well for the buyers. It may have gone the other way, but H1 breakout traders should stick with their plan and keep discipline.

Categories
Forex Daily Topic Forex Price-Action Strategies

Breakout Length: Key to Trend’s Strength

In today’s lesson, we are going to demonstrate the relation between the trend’s strength and breakout length. The breakout length usually represents one-fourth of a potential trend. If the breakout length is 25 pips, the trend may sustain up to 100 pips before making a big correction or long consolidation. It is important for breakout traders since the market often makes a breakout; confirms the breakout. However, the price does not head towards the trend direction. Let us clarify this by the examples below.

The price has been bearish upon making a bearish engulfing candle. The last swing low is quite far. This means the breakout length looks good for the sellers. The more the breakout length, the better it is for the traders.

The chart produces a bullish engulfing candle in between. This is bad for the sellers. The price may find its new resistance to produce a bearish reversal candle to make a breakout at the lowest low. This means the breakout length most probably needs to be adjusted.

The price seems to have found its new resistance here. It produces a do candle followed by a bearish engulfing candle. This means it produces an evening star. If the price heads towards the South and makes a breakout, the sellers may go short upon breakout confirmation. However, they must calculate new breakout length from the new resistance to the lowest low.

Here comes the breakout candle. This is an explicit breakout. The sellers are to wait for the price to make a breakout confirmation. If the next candle closes below the breakout candle, the sellers may trigger a short entry.

The confirmation candle looks to be an A+ breakout confirmation candle as well. However, do not forget the distance the price has already crossed. The price has crossed about 70% length considering the breakout length. Thus, the price may make a bullish correction. It usually happens when the price finds a new level of support/resistance. Let us proceed to the next chart.

The chart produces a big bullish engulfing candle, which changes the entire scenario. It happens when the price is about to make a correction. Sometimes corrective wave changes the trend. The sellers if the blindly trigger a short entry after the breakout confirmation without calculating breakout length and trend’s strength, they are to take a loss here.

Breakout strategy traders must calculate breakout length to determine how far the price could go. If it crosses more than 50% to confirm the breakout, it is better to skip such entries.


Categories
Forex Daily Topic Forex Price-Action Strategies

Do Not Give Up Until It Is Void

Forex traders have to have no given up attitude. With patience, discipline, and diligence they have to stick with a chart unless it is completely messed up. In today’s lesson, we are going to demonstrate an example of this.

The chart shows that the price makes a strong bearish move. It finds its support and heads towards the North for an upward correction. Look at the last candle on the chart. This comes out as a bearish engulfing candle, which the sellers wait for in such price action. If the price heads towards the downside and makes a breakout followed by a breakout confirmation, the sellers are going to trigger a short entry. Let us proceed to the next chart.

The sellers do not expect this. The price does not head towards the downside. It rather goes towards the North and roams around the level of resistance. It is painful for the sellers. However, observe on the chart that the level of resistance is still intact. The price may head towards the North but the sellers still have a chance. Let us see what happens next.

The sellers are on their toes again. The chart produces an inverted hammer followed by another long bearish candle. If the price makes a breakout and confirms that, the sellers are going to trigger a short entry.

Here comes the breakout candle. A good-looking bearish candle breaches the level of support closing well below it. This is an explicit breakout. The sellers are to wait for the next candle to close below the lowest low of the breakout candle to trigger the entry.

The next candle comes out as a bearish candle closing well below the breakout candle. The sellers must not waste a second here but trigger the entry right after the last candle closes. A dead-looking chart for the sellers ends up producing entry. Let us proceed to the next chart to find out how the trade goes.

The price heads towards the South in a hurry. It is quite a big bearish move, which offers more than 1R. A trade setup works wonderfully well for the sellers.

Let us recap the entry again. It looks good at the beginning. The price then goes towards the upside and it seems that it may not offer a short entry. The price finds its resistance at the same level; makes a breakout followed by a breakout confirmation. As far as breakout strategy is concerned, the sellers trigger a short entry and make a profit out of it. This is why traders must not give up but stick with the chart as long as it’s valid to produce a signal.

Categories
Forex Daily Topic Forex Price-Action Strategies

Don’t Lose Patience if a Chart Does not Produce the Signal

Breakout strategy traders wait for a breakout followed by a breakout confirmation candle. If the next candle does not close with a new higher high/lower low from the breakout candle, traders must not trigger entry. The price may go towards the trend sometimes, but it often goes another way. In today’s lesson, we are going to demonstrate an example of this where everything looks good, but it ends up without producing a signal candle.

The chart shows that the price heads towards the North with good bullish momentum. It finds its resistance and makes a correction. Upon finding its support, the chart produces a bullish engulfing candle. The candle suggests that the price may head towards the North. The buyers are to wait for the breakout followed by a breakout confirmation candle to trigger a long entry.

The price heads towards the North but does not make a breakout candle yet. The last candle closes within the level of resistance. The buyers must wait and keep their eyes on the chart since the breakout may take place anytime soon.

Here it comes. The last candle on the chart breaches through the level of resistance closing well above it. This is one good breakout candle. This must attract the buyers to stick with the chart and hope for the next candle to close above the breakout candle to trigger the entry. It looks extremely good. The entry is knocking at the door. Let us proceed to the next chart.

The breakout strategy buyers must be disappointed. After all the hours of waiting, the chart produces a bearish inside bar. Pullback buyers may wait for a bullish engulfing candle to go long in the pair. However, this chart does not have anything to offer for the breakout strategy traders at the moment. Let us proceed to the next chart to find out what happens.

The chart produces a bullish inside bar. However, the price heads towards the South with good bearish momentum. The last candle seems to hit the level of support as well. This means it does not produce any signal for the pullback buyers as well. It is disappointing when traders do not get the signal they wait for a long time. However, it does not hurt as much as a losing trade does. After a long wait, if a chart does not produce the signal, it often leads us towards taking bad entry in other pairs. Let us make sure we never do that. Patience is a great virtue as far as Forex trading is concerned. Traders must make sure that they have this virtue.

Categories
Forex Daily Topic Forex Price-Action Strategies

Long Shadow in Breakout Confirmation Candle

In price action trading, breakout, as well as confirmation candle’s attributes, plays a significant role. In today’s lesson, we are going to demonstrate an example of how the upper/lower shadow of a breakout confirmation candle plays a role in offering us an entry. Let us get started.

This is an H1 chart. The chart shows that the price makes a strong bearish move. It finds its support. Having a bounce, it goes towards the North. The last candle suggests that the price may have found its resistance too. If it makes a breakout at the level of support, upon getting breakout confirmation, the sellers may go short in the pair.

The price heads towards the South but not with good momentum. It takes only one candle to make a breakout. The sellers must wait. Let us find out what happens next.

Here it comes. The last candle breaches through the level of support. It has a lower shadow, but it closes well below the level. The sellers are to wait for the second important factor, which is breakout confirmation.

The next candle comes out as a bearish candle closing well below the breakout candle’s lowest low. In naked eyes, the sellers may trigger a short entry right after the last candle closes. However, the confirmation candle has a long lower shadow. To be sure about it, we may flip over to the 15 M chart. Let us have a look at the 15 M chart.

Look at the last 15M candle. This is a bullish pin bar, which is a strong bullish reversal candle. The 15 M traders may push the price towards the North. It means the H1 sellers may have to wait to reach the target. That may even end up being a losing trade. Let us flip over to the H1 again.

The last candle comes out as a bullish corrective candle. Usually, the price goes down after a breakout confirmation in such a setup. It this case, it does not. It may keep pushing towards the North even further. Let us find out what happens next.

The last candle comes out as a bullish corrective candle. Usually, the price goes down after a breakout confirmation in such a setup. It this case, it does not. It may keep pushing towards the North even further. Let us find out what happens next.

Yes, the price heads towards the North further. The last candle breaches through the breakout level as well. This does not look good for the H1 sellers. It all starts with a long lower shadow (in a selling market).

Whenever we see a long lower/upper shadow in an H1 chart, we may check it with the 15 M chart. If the last 15 M candle is a strong reversal candle (for opposite trend), we may skip taking the entry.

Categories
Forex Daily Topic Forex Price-Action Strategies

Price Action Trading: The Daily Chart’s Consistency

The Price Action Breakout Strategy works in almost all the charts. However, it works best on the daily chart. In today’s lesson, we are going to demonstrate an example of a breakout-trading example of that. The chart has a bullish gap, but consolidation followed by a bearish engulfing candle offers an excellent entry for the sellers.

The chart shows that it makes a strong bullish move. Upon finding a level of resistance, it produces a bearish engulfing candle. The sellers may want to keep an eye in this pair to go short.

The price keeps going towards the South. The sellers must wait for the price to consolidate and produce a bearish reversal candle. The swing low is far enough, which offers the price to travel towards the South further.

Here it comes. The chart produces a bullish candle. The sellers are to be attentive here. The chart may produce a bearish reversal candle and offer a short entry to them. Do not miss the point that the price has a little bullish gap. The gap is not visible explicitly, but if you count the last candle’s opening and the closing one before it suggests that the price starts with a gap.

The chart produces a bearish engulfing candle closing well below consolidation support. The sellers may trigger a short entry right after the candle closes by setting stop-loss above the signal candle’s highest high. The space between the last swing low and the signal candle’s closing price suggests that the entry offers 1R. This should be enough to bring enough liquidity and drive the price towards the South.

As anticipated, the price heads towards the swing low and hits the target. The sellers achieve 1R here with ease. The last candle comes out as a bullish reversal candle since it closes within the previous candle’s lowest low. The sellers may want to close their whole trade and wait for the next one.

Price action breakout strategy works in 5M to the weekly chart. However, the daily, the H4, and the H1 are the three best charts that work best with the strategy. Usually, the gap creates confusion among traders. It creates more confusion among price action traders. In this example, we have demonstrated that the gap does not create confusion, but the Price Action Breakout Strategy works well as it usually does. The little gap may be one of the reasons. However, if the daily chart produces a trade setup like this, it does not usually go in vain.

Categories
Forex Daily Topic Forex Price-Action Strategies

Keeping an Eye on Some Levels Comes Handy

Forex price action trading requires a clearer chart. Traders are to keep an eye on candlesticks’ attributes, consolidation, reversal candle, and support/resistance levels. The last swing high and the last swing low are two levels that traders must count. However, the price often reacts to certain levels, where it reacts heavily earlier. We may keep an eye on those closely since they often offer entries. In today’s lesson, we are going to demonstrate an example of that.

The chart produces a bullish engulfing candle after being bearish for a long time. The buyers still hold the key. However, the sellers may keep start eyeing on the pair as well. The chart shows a pullback level in its bearish wave. The highest high is further up, though. Thus, if the price makes a bullish move from here, it would be a big one.

The price heads towards the North with good bullish momentum. The buyers are to wait for the price to consolidate and produce a bullish signal candle to go long on the pair. A level of resistance (drawn level) is nearby. The price may consolidate around the level. Thus, this is time for the buyers to keep an eye in the pair closely.

The price does not consolidate around the level of resistance, but it makes a breakout.  Some traders may think that they have wasted time here by keeping an eye on the pair, which is never right. In Forex trading, we need to invest money and time. After such a breakout, the price usually keeps going towards the trend’s direction for one or two more candles before having consolidation. Do not forget, it often consolidates around the breakout level and offers entry.

The chart produces one more bullish candle followed by a bearish candle. The last candle closes within the breakout level. This means the price is having consolidation around the breakout level. If the chart produces a bullish engulfing candle closing consolidation resistance, the buyers are going to push the price towards the North.

The buyers crave for getting such a good–looking bullish candle to go long from here. The equation is simple here. The buyers may trigger a long entry right after the candle closes. Let us find out how the entry goes.

The price heads towards the North with good bullish momentum. The buyers achieve their 1R easily here. The highest high is further up. Thus, it may remain bullish for some more candles.

The price may consolidate and offer entry at any level when it is trending. However, it tends to consolidate around some particular levels often. By spotting them out, we may make our trading life a bit easier.

Categories
Forex Basic Strategies Forex Daily Topic

Significance of Breakout Confirmation or Reversal at Pullback

Breakout trading is one of the most widely used trading strategies in the Forex market. Breakout confirmation is equally important. Without breakout confirmation, a breakout may not work in favor of the traders in many cases. Thus, if we want to have a tremendous rate of winning, we may wait for breakout confirmation or reversal at pullback before taking entry. In today’s lesson, we are going to demonstrate an example of this.

The price after being rejected at a resistance level heads towards the South. It produces a bullish inside bar and heads towards the North again. The momentum suggests that the price may make a breakout at the level of resistance. Breakout traders are to keep an eye on the pair to get a breakout followed by breakout confirmation or reversal candle at the pullback to go long on the pair.

The last candle breaches through the level of resistance. Candle’s attributes suggest that this is an ideal breakout candle. The candle barley has the upper shadow. The breakout traders are to wait for either for the next candle to close above the breakout candle or the price to come back at the breakout level to consolidate and produce a bullish reversal candle to offer them a long entry.

The price does not head towards the North. It comes back at the breakout level closing within the breakout level. The breakout is still valid. However, the buyers must wait to get a bullish engulfing candle to close above consolidation resistance to trigger a long entry by setting stop loss below the breakout level. Let us proceed to the next chart to find out what happens next.

The price breaches the level of support and closes well below the breakout level. The sellers may take control soon in the pair. Traders taking a long entry right after the breakout candle closing are to have a loss here. If they set stop loss below the lowest low, the risk-reward would not be lucrative. When the price breaches a breakout level, it usually generates more momentum and changes its trend. Let us see what happens here.

The price goes back to the breakout level. This time it makes a bullish correction. The equation changes completely another way round. If the chart produces a bearish engulfing candle closing below consolidation support, the sellers may go short and drive the price towards the lowest low.

The chart produces a bearish engulfing candle followed by another strong bearish candle. It looks like a different ball game completely now. It is now the sellers’ territory.

In the bullish market, the chart does not produce a bullish reversal candle; thus, the price gets bearish. In the bearish market, it produces a bearish reversal candle (engulfing) and offers entry to the sellers. By taking entry upon breakout confirmation, we may not find as many entries as we would like, but it gets us more consistency in winning trades.

Categories
Forex Basic Strategies Forex Daily Topic

An Old Theory about Support/Resistance

In price action trading, traders rely on support/resistance a lot. Beginners often ask a question of whether they are predetermined. In answer to this, they are predetermined to some extent. A trader can guess level/levels that may work as support/resistance. The idea is simple. Support becomes resistance, and resistance becomes support. In today’s lesson, we are going to demonstrate an example of this.

The price has a bounce at the drawn level and heads towards the North. The last candle comes out as a bearish engulfing candle. The price may head towards the South. If that happens, the sellers are to wait for a breakout at the drawn level. Let us proceed to find out what happens next.

The next candle comes out as a bearish candle as well. However, it does not make a breakout. This is an interesting chart for both the buyers and the sellers. The buyers may wait to get a bullish reversal. Since this is the level where the price has bounce earlier, this may become double bottom support. On the contrary, if the price makes a bearish breakout at the drawn level, the sellers dominate in the pair.

The bear wins. The last candle closes well below the drawn level. This is an explicit breakout. The sellers are to wait for the breakout confirmation. If the chart produces another bearish candle closing below the last candle, the price may find its next resistance at another significant level. In most cases, the price usually goes back and finds its resistance at the breakout level, which was the level of support earlier.

Look at the chart. The price goes back to the breakout level and creates a doji candle. Do you notice the doji candle is produced right at the drawn level? This means the level may drive the price towards the South by being the level of resistance.

The level produces a bearish engulfing candle closing below consolidation support (This may become resistance later as well). The last candle suggests that the price may head towards the South with good bearish momentum. The sellers have found the new resistance.

As expected, the price heads towards the South for one more candle. It usually happens when support/resistance produces an engulfing candle as a reversal candle. In the end, a level of support flips and becomes a level of resistance. If we closely observe, we find this is what happens almost every time. Support becomes resistance, and vice versa. By obeying the theory, experienced traders spot out the levels of support/resistance well ahead.

Categories
Forex Daily Topic Forex Price-Action Strategies

Price Action Trading: An Important Thing to be Remembered

To draw Support/Resistance, price action traders are to be sensible. They often need to be adjusted. In today’s lesson, we are going to demonstrate an example of this. To spot out support/resistance, traders are to aim the zones. Then, in the end, they are to draw levels to have the confirmation of a breakout. Let us learn more about this from the examples below.

This is an H1 chart. The chart shows that the price has been choppy for quite a while. It has been roaming within a descending triangle. The price may make a breakout to either side. Let us work with horizontal support and spot out point/points where the price bounces twice.

We may spot out two points here. These two levels are nearby to each other. Without any doubt, this is a strong support zone. If we consider levels, we may get confused since we get two levels. In such a situation, we may closely observe what the price does around the last swing low. Let us proceed to the next chart.

The chart shows that the last candle breaches the level of support (the last swing low). This is not an explicit breakout. We must wait for the next candle to have the breakout confirmation.

The next candle comes out as a bearish candle as well as closing well below the breakout candle. If we consider the price action for the last two candles, it is clear that the sellers have taken the control. The level of support at the last swing low holds the key as far as the last two candles’ price action is concerned. The H1 breakout strategy sellers may trigger a short entry right after the candle closes. Let us proceed to the next chart what the price does after triggering the entry.

The price heads towards the South with good bearish momentum. The sellers achieve their 1R with ease. The last candle’s attributes suggest that the price may go towards the South further. In a word, this has been a prolific trade setup for the sellers.

If we consider the first swing low on this chart, we may get confused about the breakout. Considering the price action and the last swing low, it is a basic thing to understand that the price makes a breakout at the last swing low. The last swing low matters most as far as the breakout strategy is concerned. If the price consolidates after a breakout, then other levels (previous levels of support/resistance) may work as flipped support or resistance. This is one important thing to be remembered by the price action traders.

Categories
Forex Daily Topic Forex Price-Action Strategies

Price Action Trading: Entries to Take and Entries to Skip

In today’s price action trading lesson, we are going to demonstrate an example of a chart that offers multiple entries. We try to spot out entry/entries that we may skip and the entry/entries we may take. We try to find out the reasons behind that as well. Let us get started.

The price after being bullish for a long time produces a bearish reversal candle and heads towards the South. Look at the last candle. It comes out as a bullish inside bar. Price action traders start eyeing on such a chart to go short. However, the sellers would love to see the price have deeper consolidation.

The chart does not make a deep consolidation. It produces a bearish engulfing candle closing well below consolidation support. The trend and the reversal candle get 10 on 10, but the consolidation is not deep enough. It is not an A+ entry. It is best if we restrain ourselves from taking such entry. Let us proceed to the next chart.

Many of us may think an opportunity missed. Here is one added lesson on ‘ do not cry over spilled milk.’ Forex traders must obey this. Let us concentrate on the chart again. The last candle comes out as a very strong bearish candle. The pair may offer more short entries.

The chart produces a bullish inside bar again. The equation is simple for the sellers based on price action. The chart is to produce a bearish engulfing candle closing well below consolidation support. Let us proceed to the next chart.

Here it comes. This is one good-looking bearish engulfing candle closing well below consolidation support. The trend, consolidation length, and the bearish reversal candle all get 10 on 10. As far as price action breakout trading strategy is concerned, this is an A+ entry. Let us now find out how the entry goes.

It does not go according to our expectations. It rather produces a bullish inside bar again. It is an inside bar. Thus the sellers still hold the key here. The fact remains at the first consolidation, despite having shallow consolidation, the price heads towards the South with extreme bearish momentum. On the contrary, despite being an A+ entry, the price does not move according to the sellers’ expectations. It may even go towards the North and hits the stop loss. Then again, we must stick with our trading rules and be extremely disciplined. Let us proceed to the next chart to find out what happens next.

Ah! What a move this is! The sellers make some green pips here. The chart makes them wait, but it pays them back. As mentioned, it could go another way. That does not mean we start thinking to change our strategies or start taking random entries. We must make sure we only take entries that get A+ after considering all the segments.

Categories
Forex Daily Topic Forex Psychology

What does it take to Replicate Success?

Replicating something is done by taking a model and copying it. To become a successful trader, beginners should replicate, or model, a successful trader. But what does it take to replicate Success?

The Model

To replicate a model, we need first to define and subdivide it into sub-processes or tasks. According to Dr. Van K. Tharp, the needed subtasks required to master to become a successful trader are:

 The trading process

  1. The process of trading
  2. The process of developing a trading system that fits the trader
  3. The process of objective definition and risk management
  4. The process of a business plan as a document that guides decision-making.

Of course, to aim for excellence, we need to model the best traders in class. 

The first step is to subdivide the model into sub-tasks. Once the tasks have been defined, we need to attach beliefs, mental states, and mental strategies for each one. The purpose is to duplicate the way a successful trader thinks and acts. If we can achieve this feat, we are sure the results can be replicated.

The beliefs

According to Dr. Tharp, beliefs act as the first filter to transform the information coming from the world. Beliefs, meanings, categorizations, and comparisons determine how people perceive the real world. What a trader expects from the market depends largely on his beliefs about it. That which is called market sentiment is really “market beliefs.”

Since beliefs are filters to reality, it is wise to classify them, by asking ourselves the following

  • Where did this belief come from?
  • How useful is it?
  • How does it limit my actions?

This process helps us keep and improve valuable beliefs and get rid of un-useful ones.

Mental States

The next step to generate success is duplicating the mental state of top traders. It has to do with discipline and emotional control. When people carry their mental problems to trading their results usually come from an improper mental state, not suited to trading:

  • I’m impatient and always get in too early
  • I get mad at markets. They seem to know when I trade just to do the opposite
  • I’m afraid the market is against me now that I’m wining
  • I get too excited when I’m winning and don’t get out in time.

Controlling these states is not the solution to solve all problems. It is just one part of it. Dr. Van K. Tharp tells that in the ideal model to the trading success, each task has an optimal mental state attached to it. 

Mental Strategies

 A mental strategy is a sequence of thoughts that go from a stimulus coming any of your senses to output or action. Let’s create an example with two possible mental strategies for the same stimulus to better understand the concept.

Mental Strategy One:
  • perceiving a trading signal
  • realizing it is a known signal
  • Think about what can go wrong if you take it
  • Visualize the scenario
  • Feel afraid
Mental Strategy Two
  • Perceiving the Signal
  • Recognize it as part of your system
  • Feel good your system delivers you a new opportunity
  • Take it and trade

What do you think is the right strategy for trading? Could you take action and trade consistently using mental strategy one?

As in the case of the mental states, each trading task requires an optimal mental strategy to optimize the results.  That will be developed in future articles.


Further Reading: Peak Performance Course Book 1- How to use Risk, Van K. Tharp.

Categories
Forex Daily Topic Forex Price-Action Strategies

Price Action Trading: Let it go

The Engulfing Candle is considered one of the most influential candles to indicate a trend reversal. Price action trading is closely related to identifying trend reversal for which price action traders give value to engulfing candles a lot. In today’s lesson, we are going to demonstrate an example of an engulfing candle, which does not work in favor of the traders. We try to find out the reason behind that.

The chart shows that the price heads towards the South with good bearish momentum. On its way, it makes a breakout and trades below the level for one more candle. The sellers are to keep an eye on this pair for the price to consolidate and produce a bearish engulfing candle closing below consolidation support. Do not miss the point ‘closing below consolidation support’.

The price does not consolidate. It instead produces another bearish candle. It may consolidate now. A candle like this attracts more sellers to go short on the pair. Let us proceed to the next chart.

The chart produces a bullish inside bar. This means the chart is still bearish biased. The signal candle may come out at any time. The waiting game gets intense. The sellers are to keep checking the chart since the next candle may be the signal candle.

The chart makes them wait further. It produces a bearish inside bar followed by a bullish engulfing candle. The chart is still bearish biased, but the chart may get choppy as well if the next candle comes out as a bullish candle. Let us wait and find out how the next candle comes out.

The next candle comes out as a bearish engulfing candle. Is this what the sellers want? Here is a question for you. Would you trigger a short entry?

If the answer is no, you are right. The reason behind that is this is an engulfing candle, but it does not close below consolidation support. Look at the line below. This is where both candles get rejection. Thus, we may consider this one as consolidation support. Even if we consider only their bodies (not the best way), the candle closes within that level as well. The equation is an engulfing candle does not make a breakout. Thus, traders may skip taking this entry. We need to make sure these four things are there before taking entry based on this setup.

  1. Clear trend
  2. Consolidation
  3. Engulfing candle
  4. Breakout

If a trade setup misses any one of these, be patient. Let it go.


Categories
Forex Daily Topic Forex Price-Action Strategies

Price Action Trading: Support/Resistance and Breakout

Support and Resistance are the two most important things as far as price action trading is concerned. We often see that too many support levels/resistance levels are nearby being too close to each other. It may confuse us to be sure whether a breakout takes place or not. In today’s lesson, we try to find an answer to that. Let us get started.

This is a daily chart. The chart shows that the price heads towards the South after producing a bearish engulfing candle. Look at the last candle, which comes out as a bullish corrective candle. If the next candle comes out as a bearish engulfing candle closing below consolidation support, the sellers may trigger a short entry.

The last candle comes out as a bearish engulfing candle closing below consolidation support. The question is whether the sellers may trigger the entry or not. Look at those two drawn levels. The price reacts to those levels. Usually, price action traders count such levels to determine risk-reward or to set take profit level. Let us assume a trader takes the entry.

Typically, he should trigger the entry right after the last candle closes with 1R. Do not forget this is a daily chart. The daily chart usually offers more than 1R. Let us proceed to the next chart.

The price heads towards the South with extreme bearish pressure. As mentioned, it gets him more than 1R. It seems it may continue its bearish journey. At least the seller may hold his position until it produces a bullish reversal candle.

Here it comes. It produces a bullish inside bar. This is not a strong bullish reversal candle. However, some traders may consider come out with their profit or at least some part of it. Some sellers may still hold it until it produces a strong bullish reversal candle.

The last candle comes out as a bullish engulfing candle. This time the sellers are to think twice whether they should hold the entry. Many price action traders close their entry here. The trade setup works excellently well here. However, do you remember those two more support levels? The price does not seem to react to those levels at all. You may notice this next time. When support/resistance levels stand too close to each other, the last level and the last breakout gets the priority (in 80% cases). However, if they have enough space in between, then they must be counted by the traders to calculate risk-reward or to set take profit.

Categories
Forex Daily Topic

Adapt yourself to the FX Market!

From its very inception. the FX market was devised to guarantee that market insiders had an important advantage over retail traders. Because of the nature and lack of regulation, the FX market is, essentially, an unfair market for retail and non-pro players.

The Playing Field

Agustin Silvani, the author of Beat the Forex Dealer, explains in his book that since information is vital to succeeding in this market, “A player’s positioning on the FX food chain depends on his/her access to information and speed, and with no central clearing exchange, it can be difficult for nonprofessionals to gain access to this information and come up with an accurate view of the market.  

He also states that practices deemed illegal in traditional financial markets are regarded in the FX field as part of the game. Practices such as insider trading, front running, and price shading (adding pips to the current price if in an uptrend or subtracting them on a descending move) are commonly seen in FX with no legal repercussions.

There is no government or central trade book to compare trades, so large institutions are free to do whatever they want to their customers. An FX broker or dealer can quote any price it wishes.

The Dealers

If big banks were a car factory, an FX Dealer would be the salesman, selling the banks’ production. Hence, you need to understand how FX dealers make money to adapt and succeed. 

The dealer’s primary axiom is markets rarely move one-way only, especially in intraday timeframes, which are ranging 80 percent of the time. That means dealers, having bug pockets, will fade strong move, knowing that the price will eventually come back and make a profit. Sometimes they can lose money, but having deep pockets will help them stand considerably more than customers that are deep in the margin. That means that most of the time, the dealer takes the other side of its customer.

The Stones on the Road 

Non-transparent pricing

The FX market is not a centralized market on which the traders have direct access to a general order book. Therefore quotes are subject to manipulation, and traders trusting just the price shown on its MT4 chart cannot be sure if the price is fair or sharded.

Over-leveraging 

Many retail brokers boast about their leveraging ratios as if it were an advantage to traders. Instead, overleverage is the main reason for the blowoff of traders’ accounts.

 Trading against its clients

This practice is widespread among unscrupulous retail dealers. Retail trade sizes are small to be directly sent to the FX mainstream flow. Thus the broker takes the other side of the trade. The broker may wait for enough flow to send it out or simply hold the position and effectively trade against their customers. No dealing desks are the same, but dealers replaced by computers.

Unfair practices

Some retail brokers not only do sharding, encourage overleverage and trade against their customers, but also deny services, complicate trade executions, and finally throw our successful traders since they feel they lose money against them. Cases of denial of withdrawal after successful growth of an account were common on the binary options broker business, but also some examples of allegedly Australian-regulated FX brokers happened. Fortunately, these cases are not the general rule, and there are plenty of fair brokers to choose from.

How to Fight Back

Different price feeds

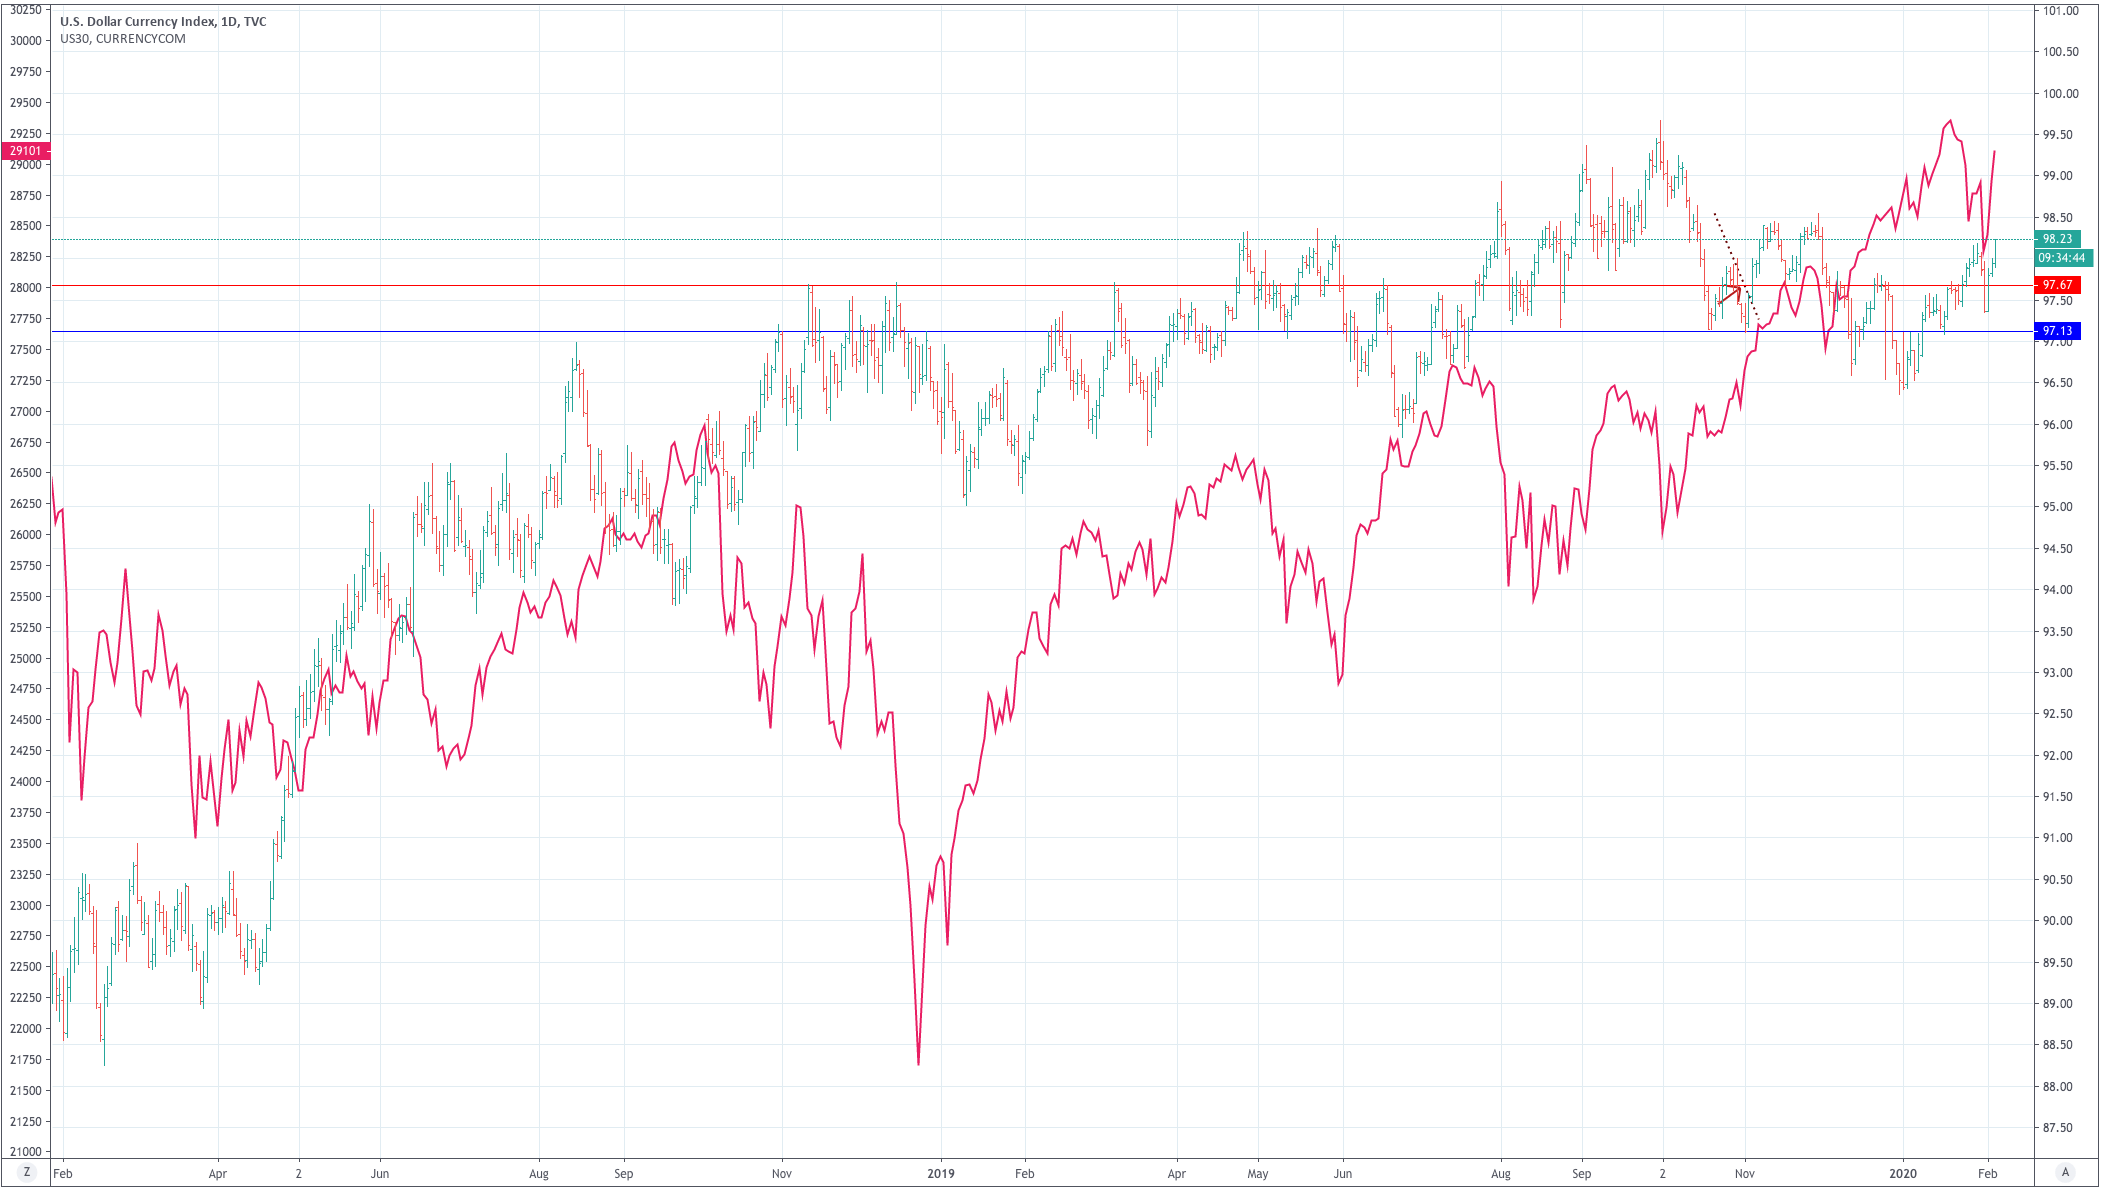
  • Use a backup feed service such as Tradingview, which is free, fast, and unbiased. Your second feed is like a second eye to the market that confirms your broker’s prices. 

Keep detailed records of your activity

If a trader finds the order is not rightly filled, it must show evidence to the broker. The lack of evidence can defeat a legitimate claim.

Take screenshots of all your trading actions, entries, exits, and any important market activity like strange price spikes not seen in your second data feed.

Check the costs of trading

Sometimes, in some trading pairs, the costs of trading are so high that it takes for hours of activity just to cover the costs. Be smart and don’t trade illiquid and high-spread pairs. 

Use your trading platform only to enter and exit your positions

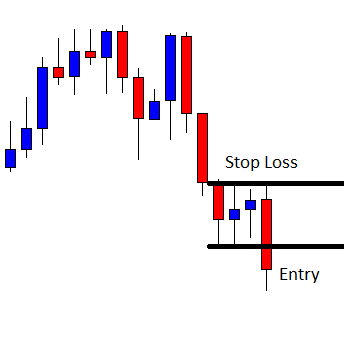
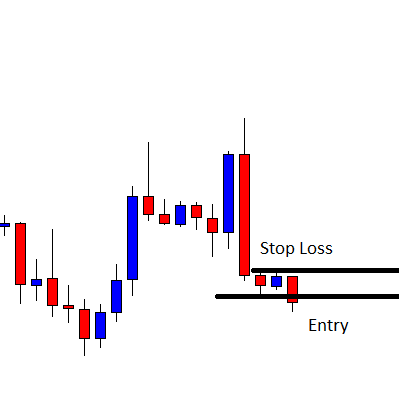
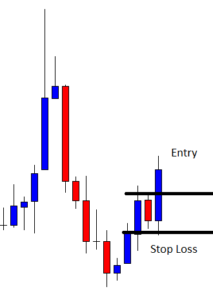
  • Use limit orders and mental stop-loss levels. Do not give any information about your strategy away.

Money Management

Do not overleverage. We have already said it in our past articles. Don’t be impatient and limit your risk to a percent of your account. Start by 0.5 percent on each trade. After you have the feeling about what that means in terms of drawdown, move it up to 1 percent and, again, see what does it feel, especially on losing positions. If, after some time, you feel you can withstand more drawdown, go on and move it to 1.5 percent and repeat the process.

How much drawdown can be expected?

That depends very much on the percent of losers of your system and the risk size. As an example, if your system is right 60 percent of the time, it is wrong 40 percent of the trades. Typically, there is a 0.01 percent chance of ten consecutive losses. Thus, if we consider ten times the usual risk our max drawdown, we see that 0.5 percent risk on each trade would result in a 5 percent max drawdown, whereas, 1.5 percent risk would mean a trader will sometimes withstand 15 percent drawdown.

Overleveraging

Consider leverage as a tool to adjust your position, but also is the leading cause of failure on FX. Thus limit your trades to 5X leverage on any position.

Diversification

Trade multiple uncorrelated pairs, so losses in one lot can offset the risk in another one. 
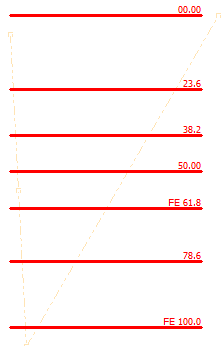
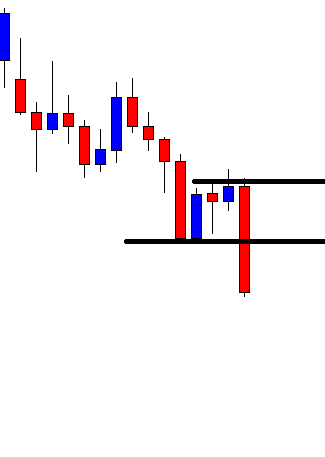
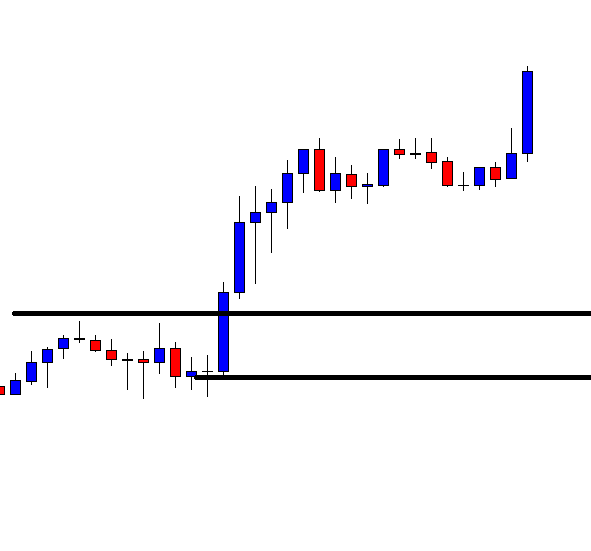
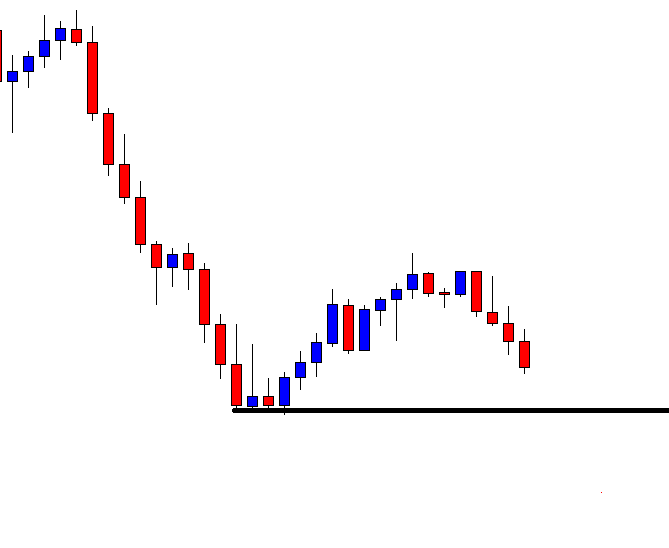
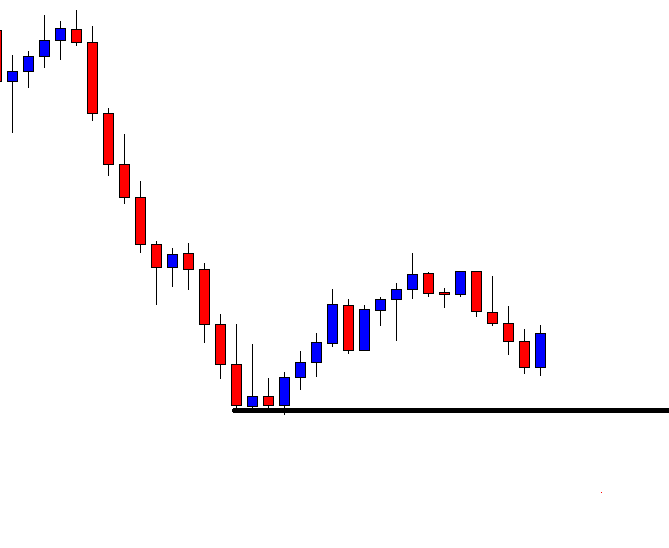
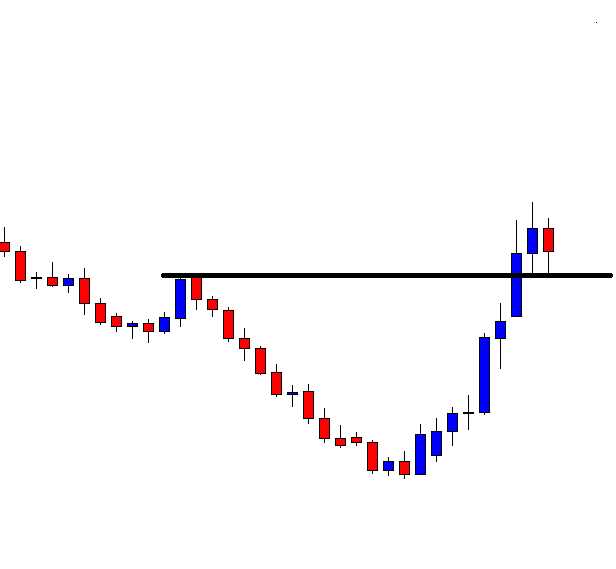
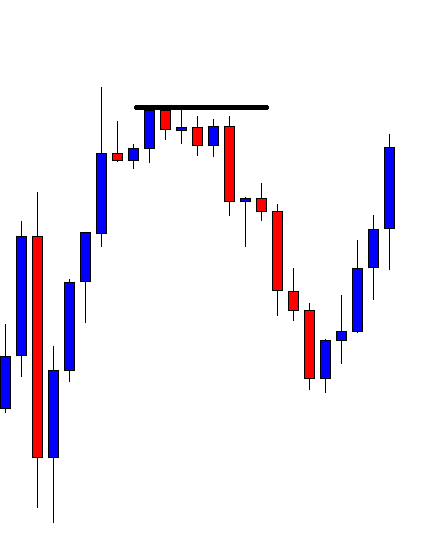
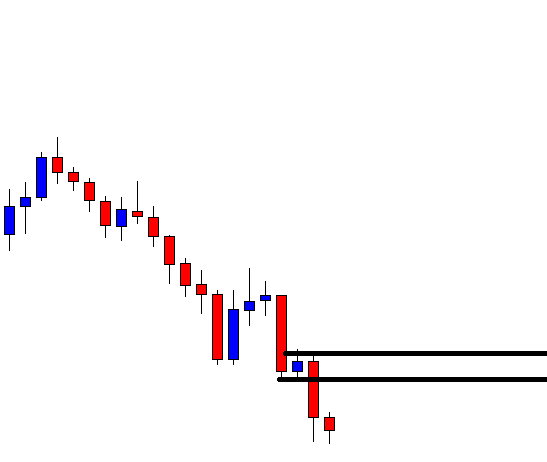
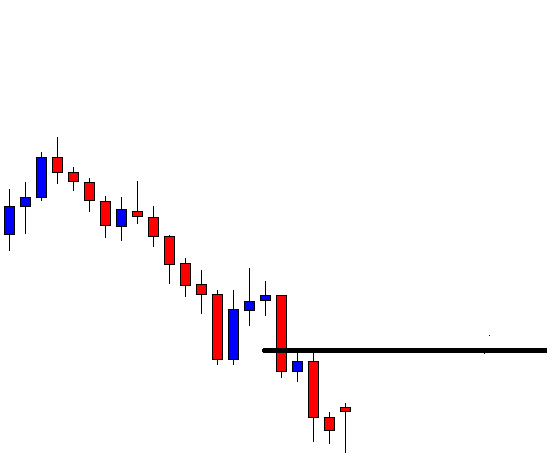
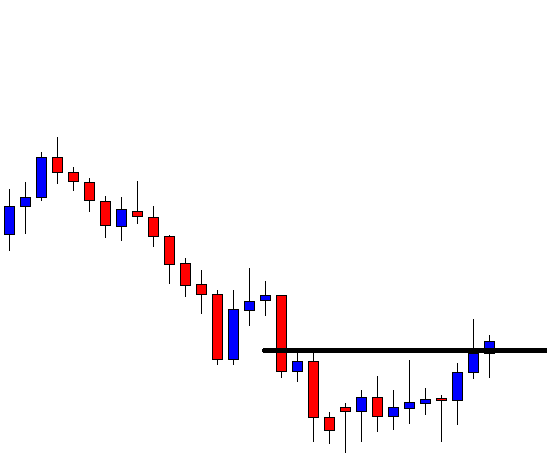
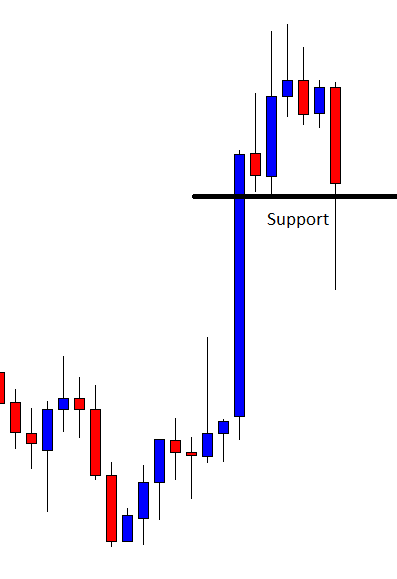
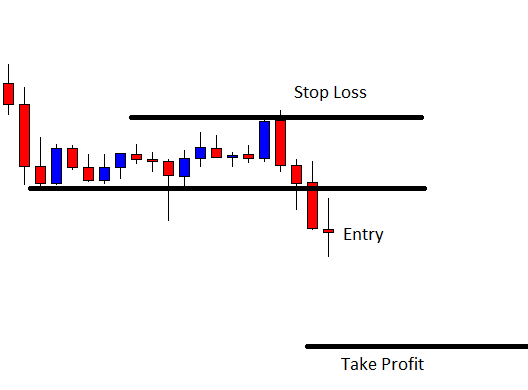
Trading

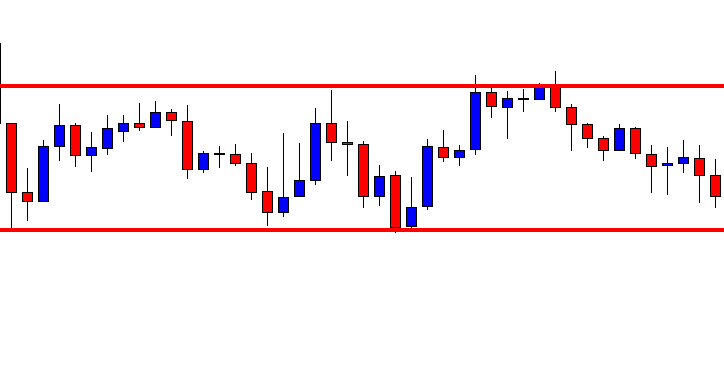
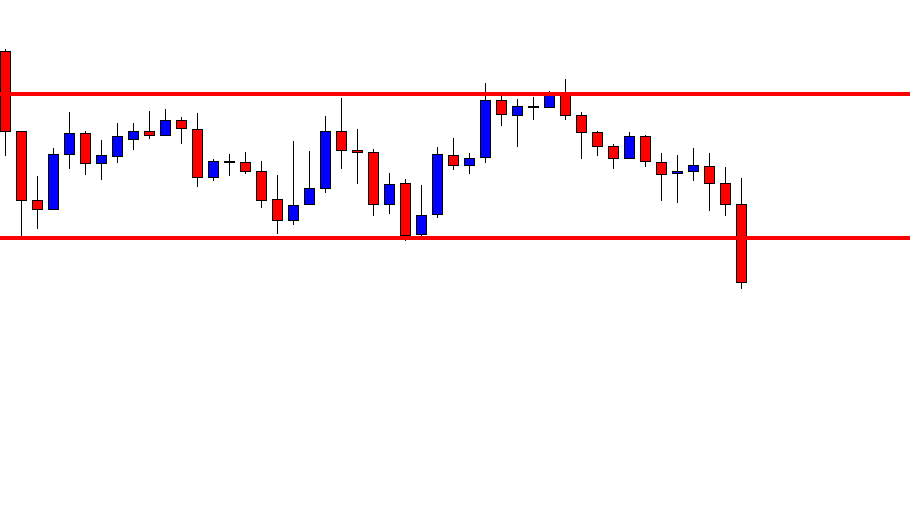
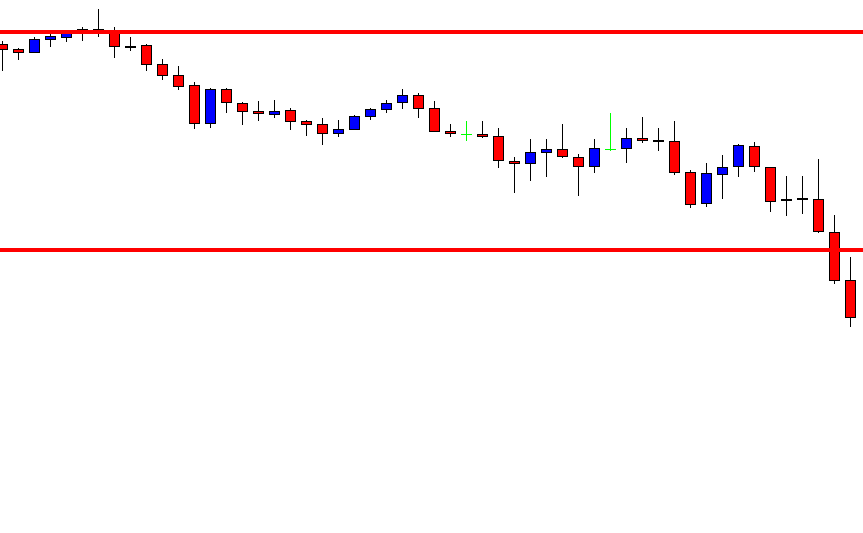
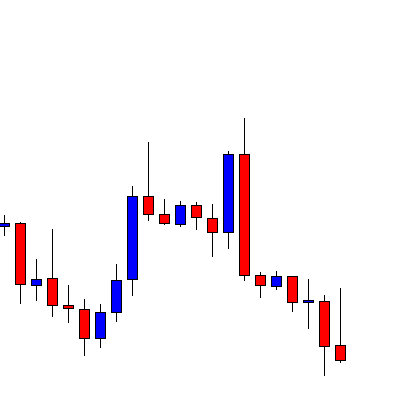
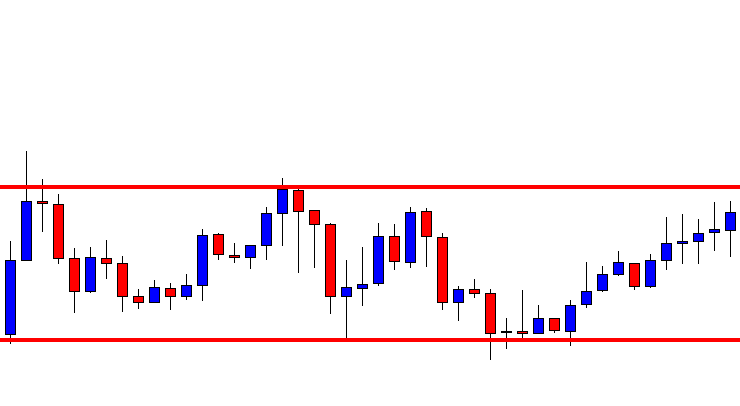
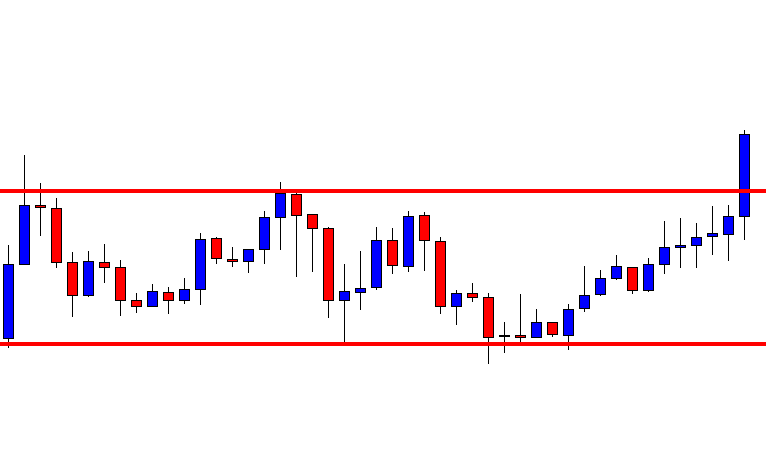
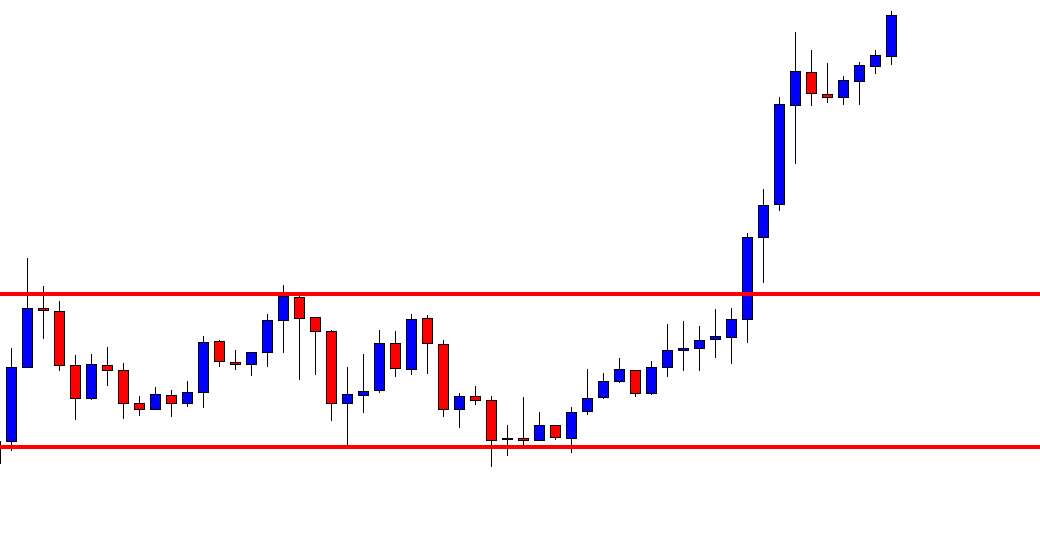
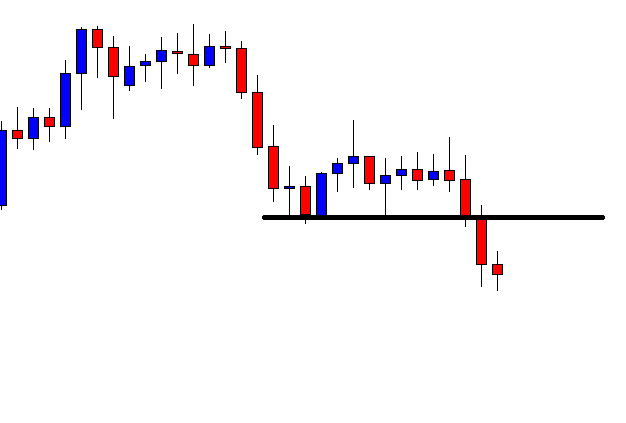
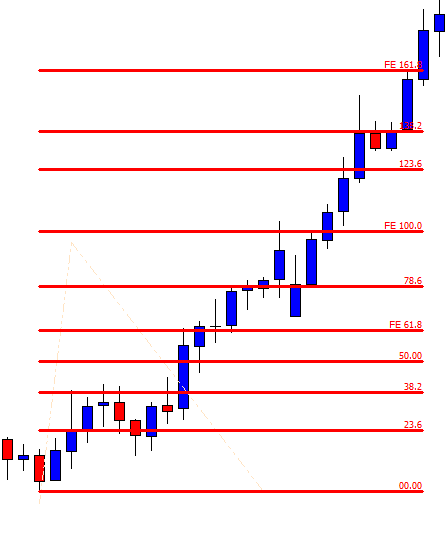
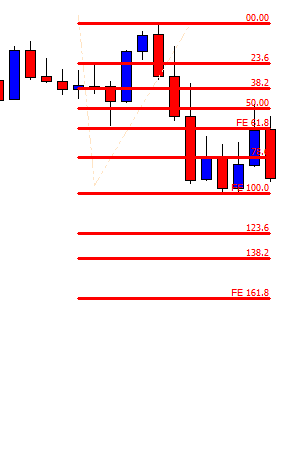
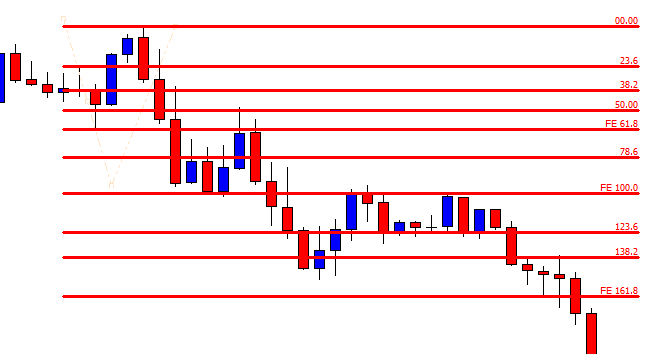
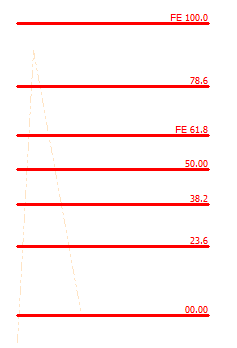
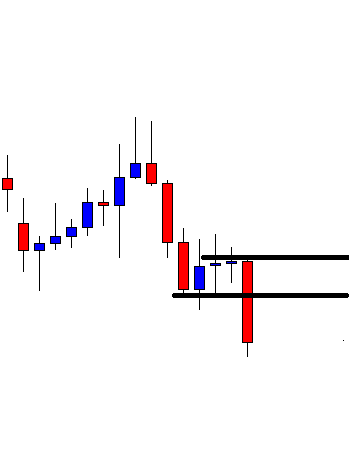
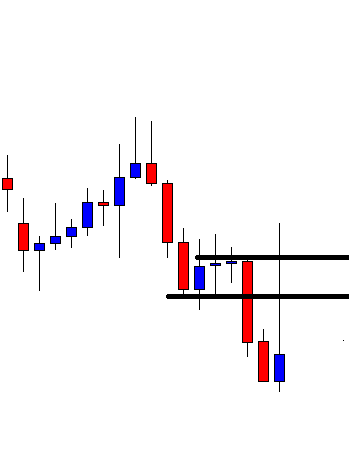
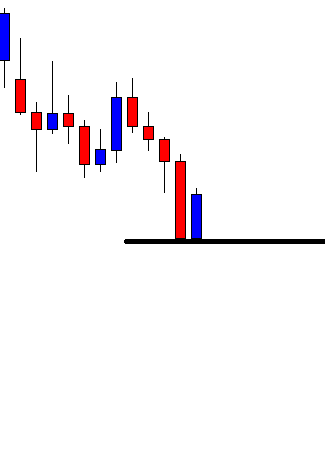
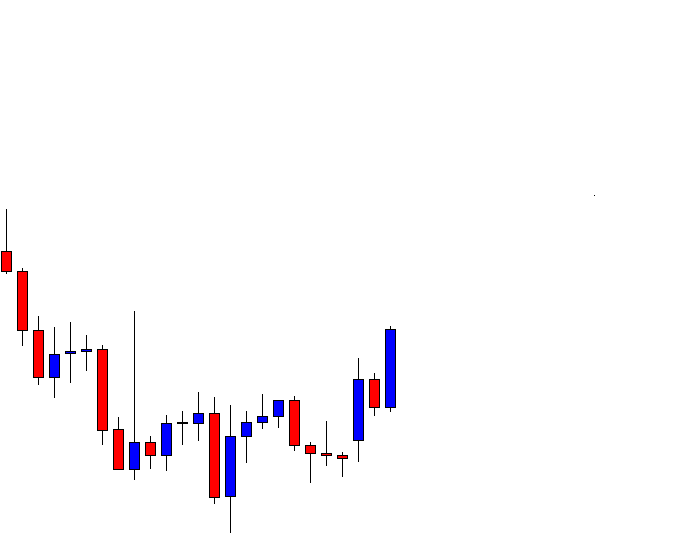
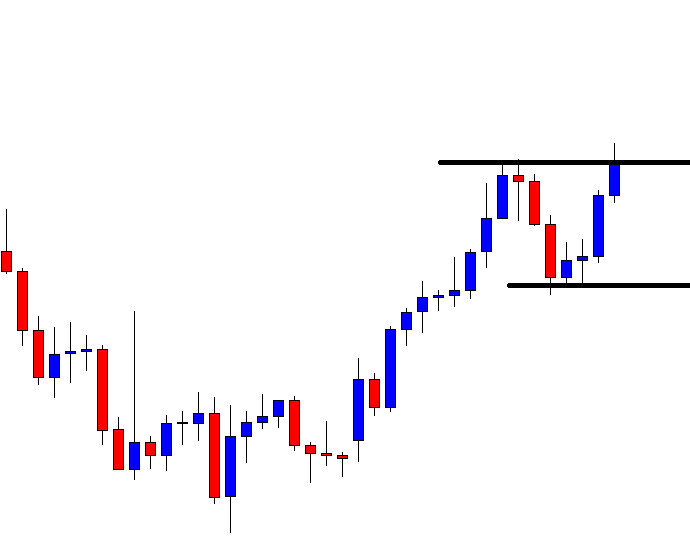
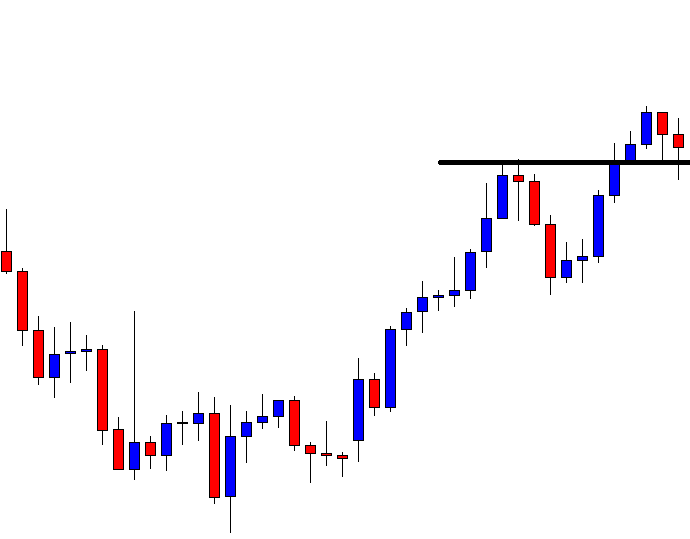
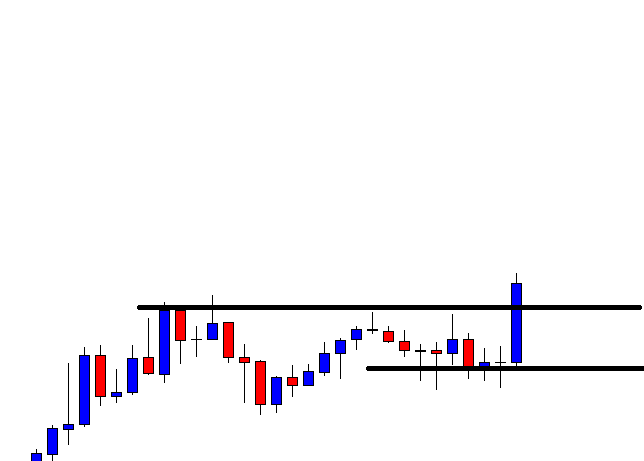
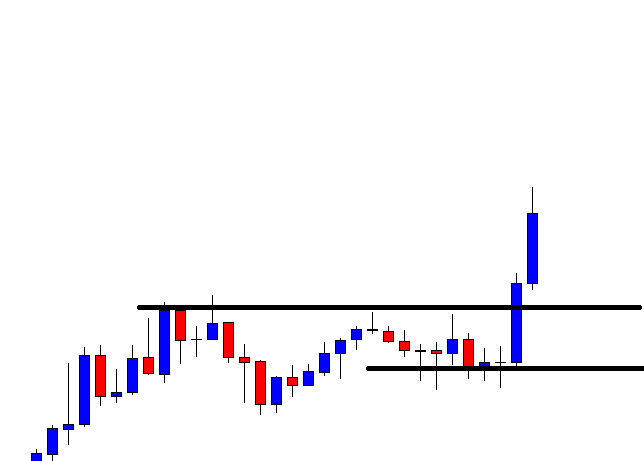
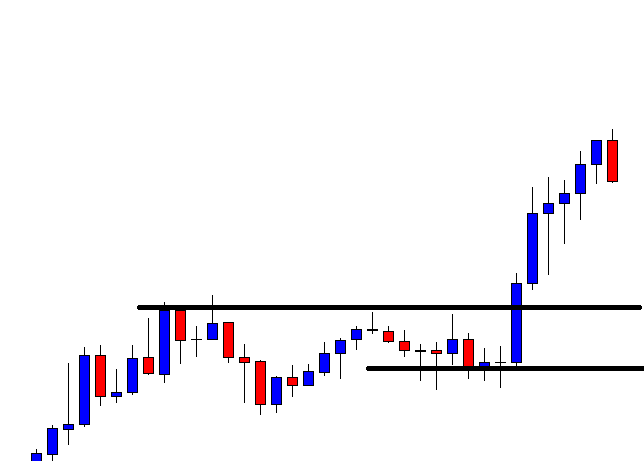
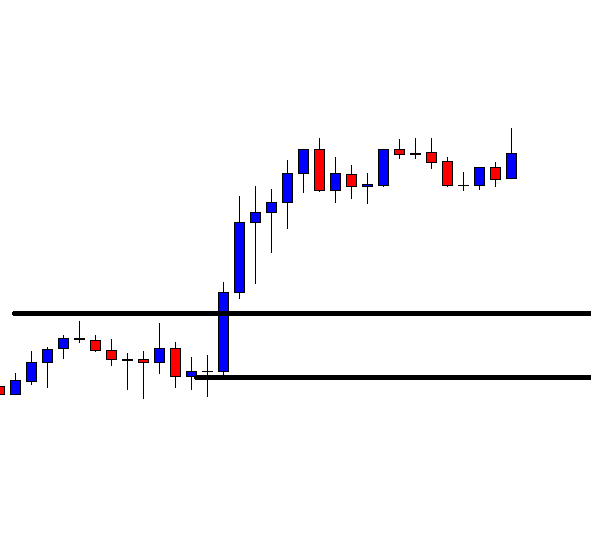
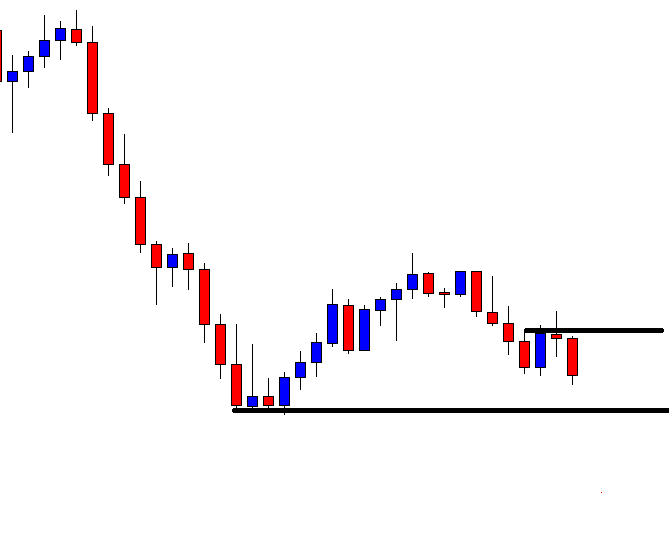
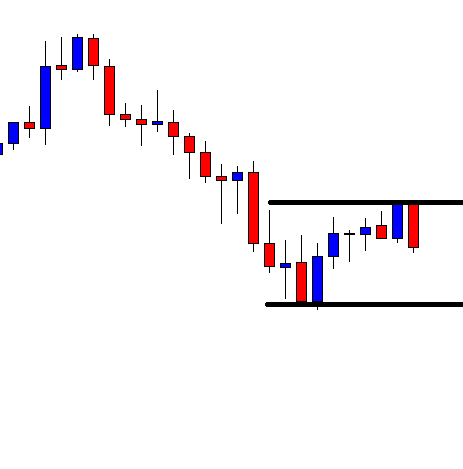
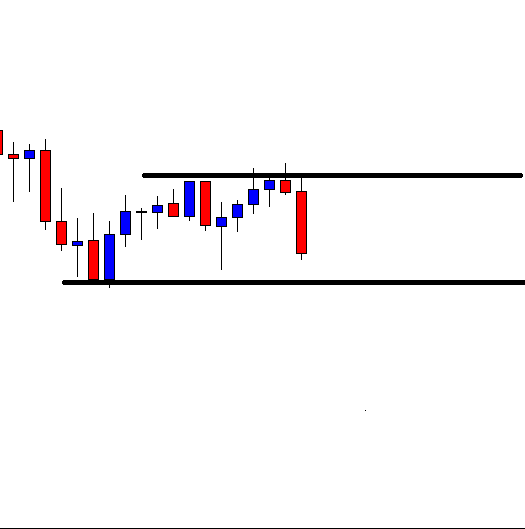
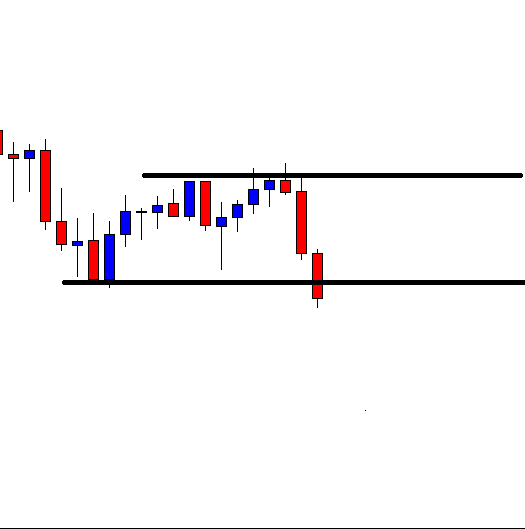
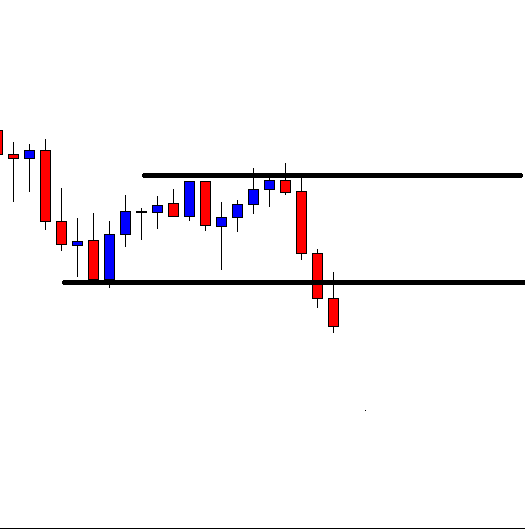
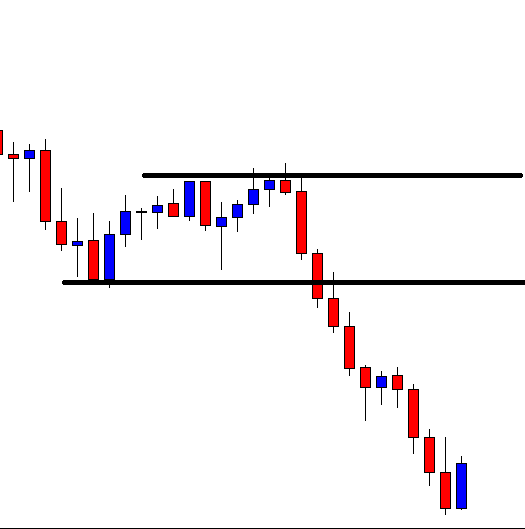
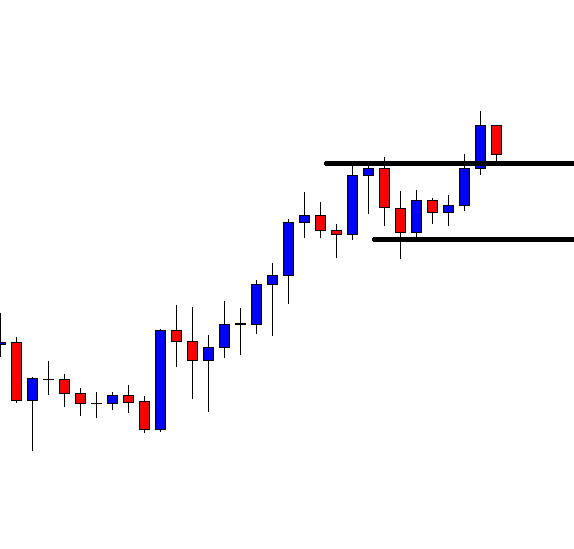
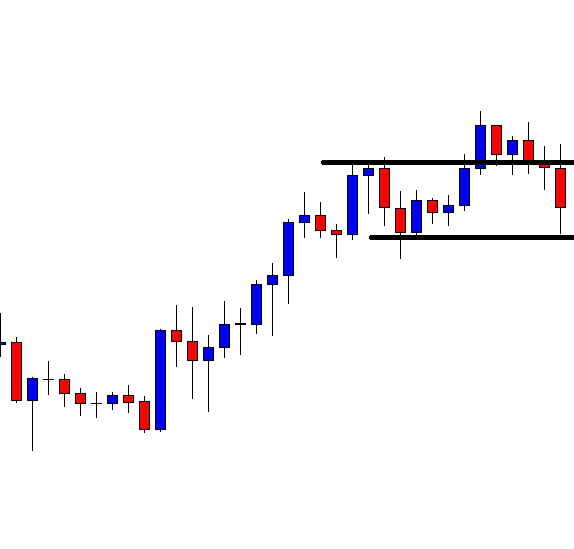
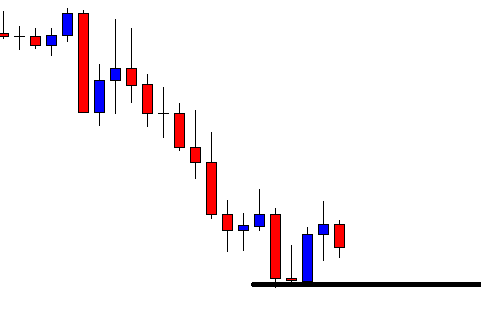
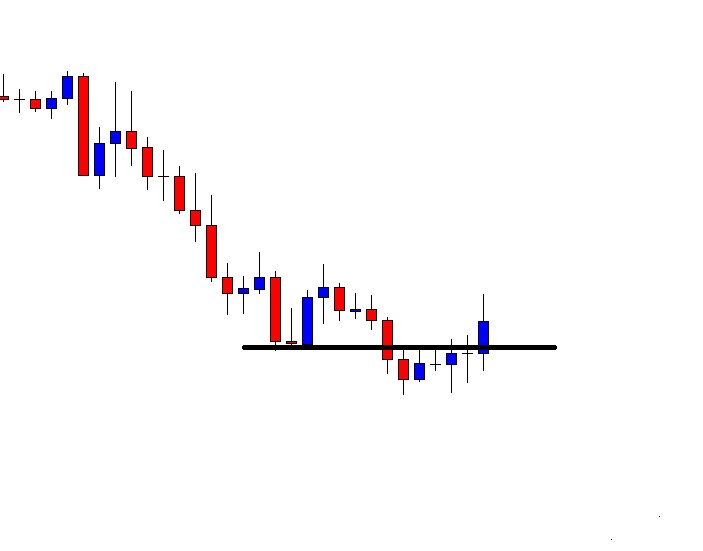
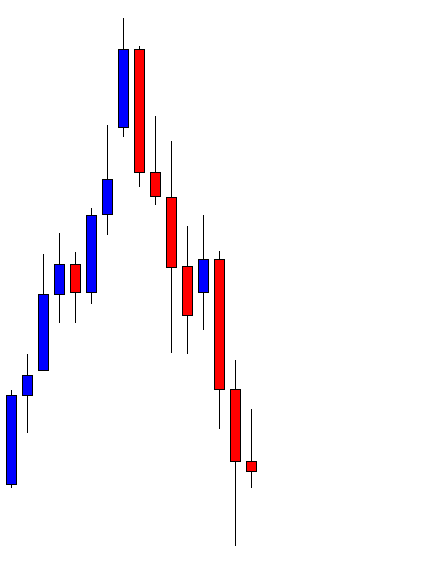
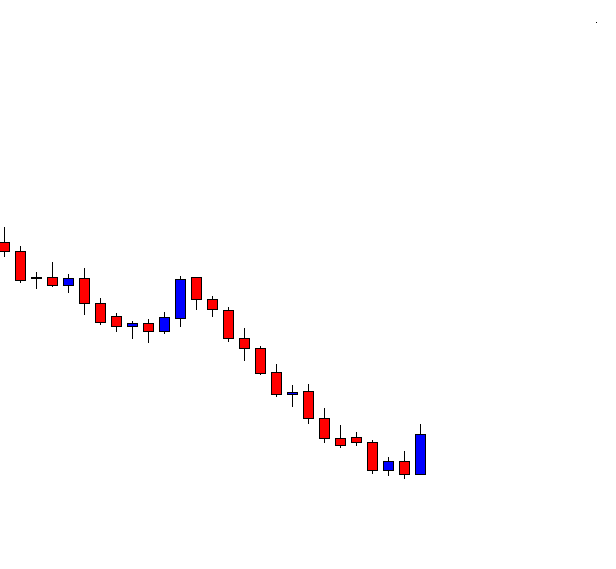
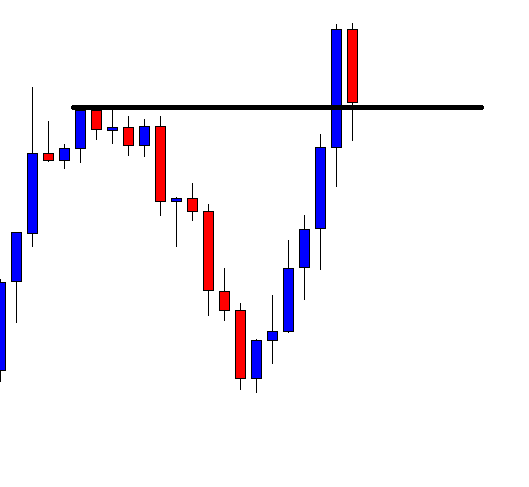
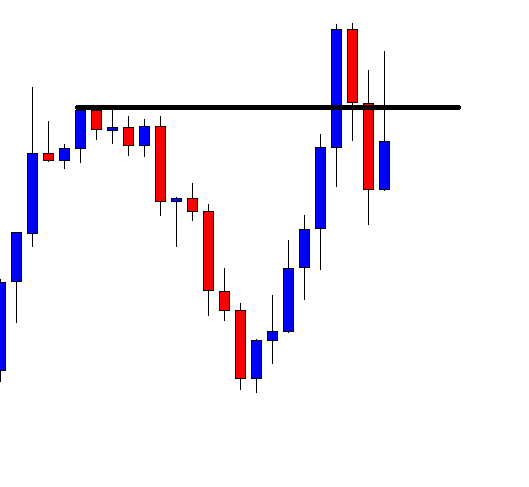
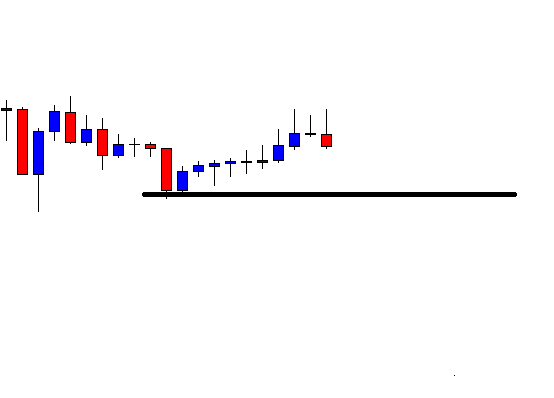
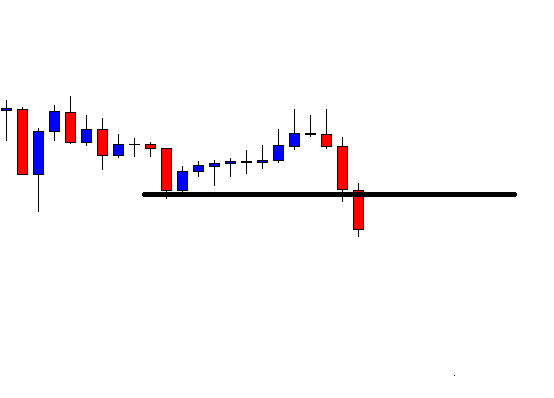
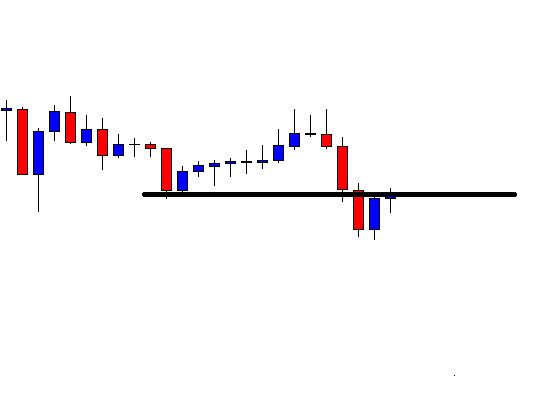
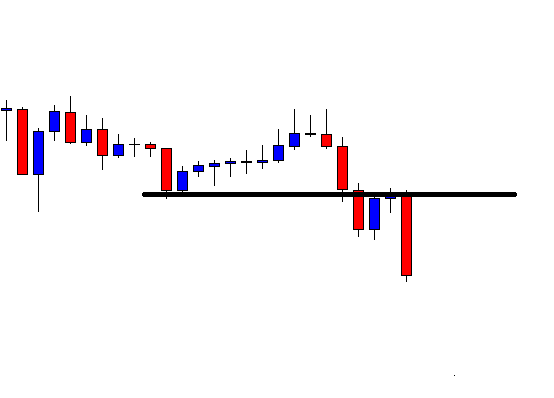
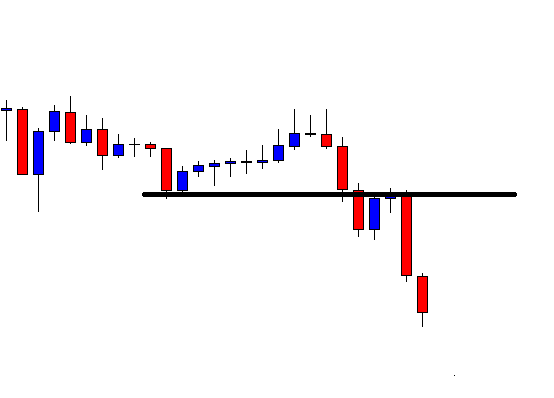
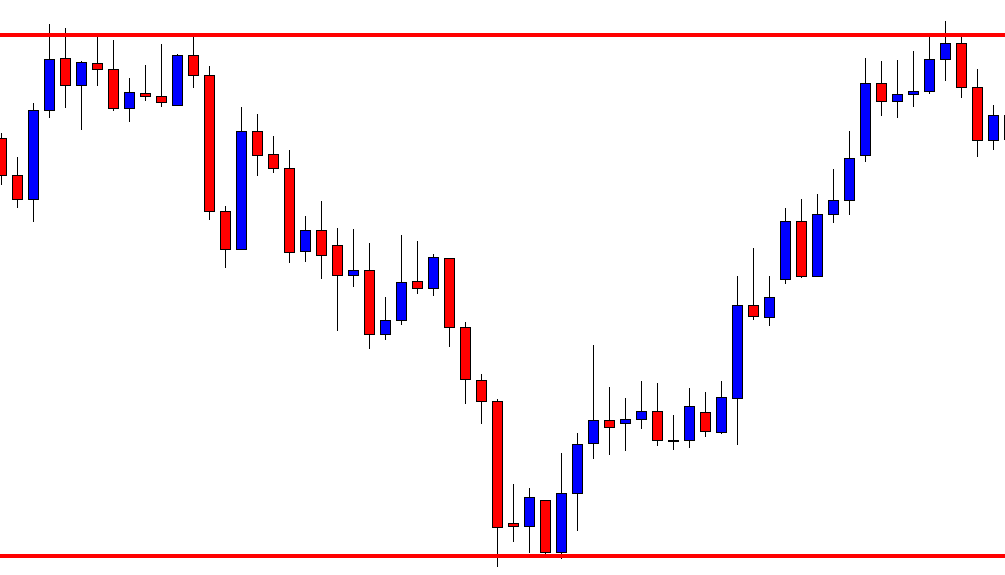
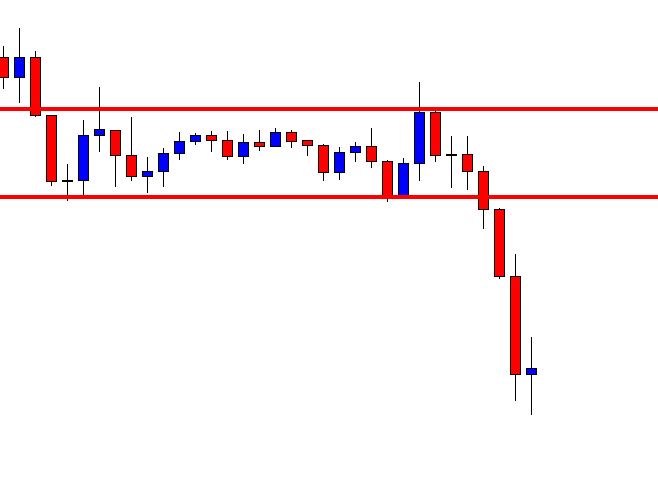
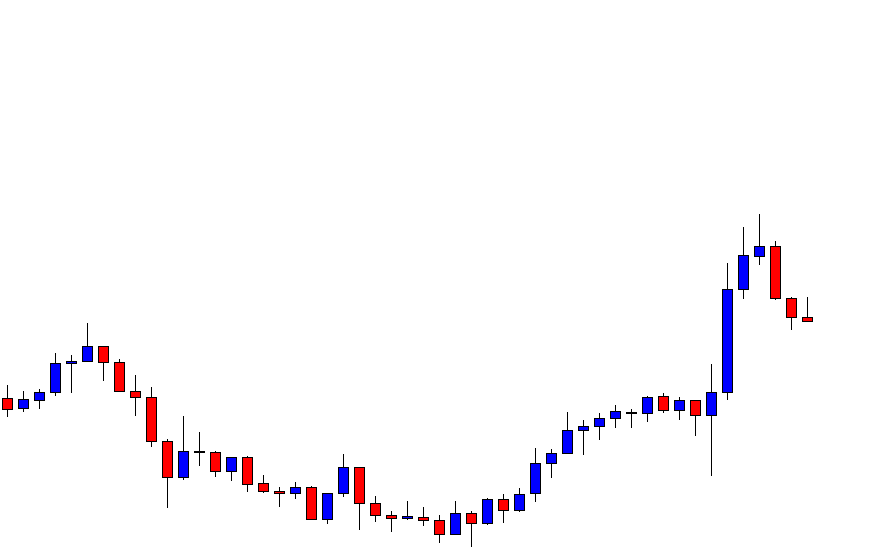
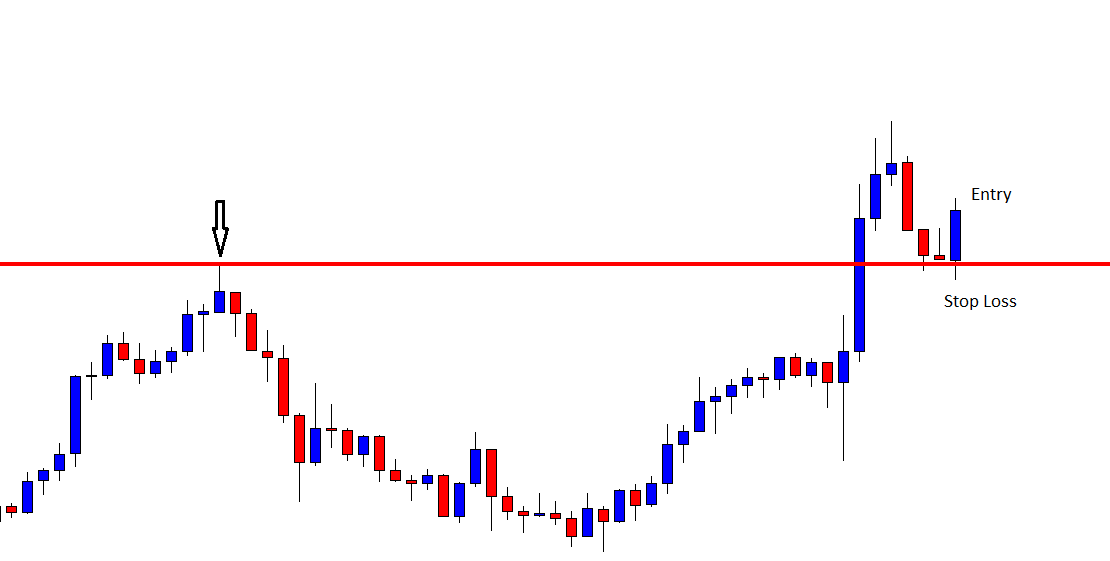
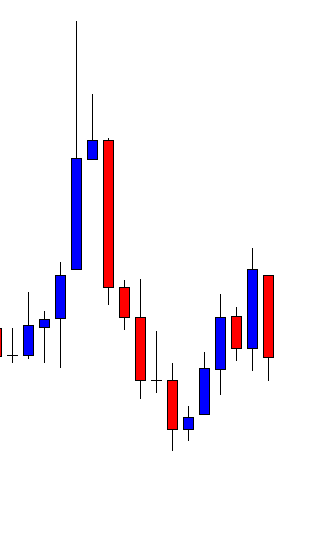
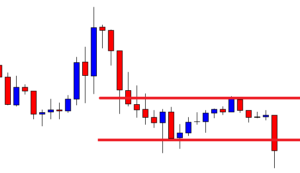
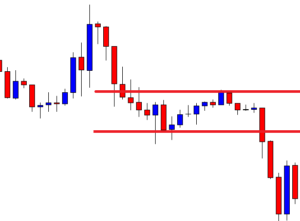
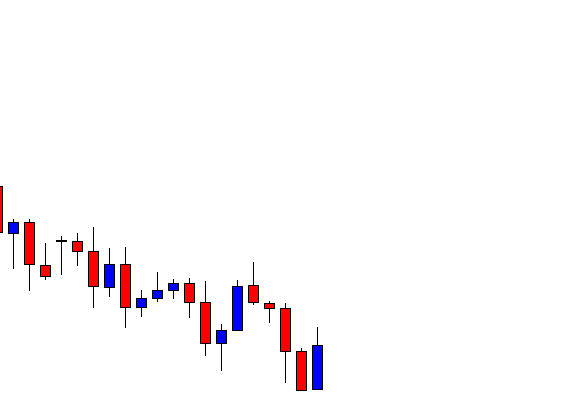
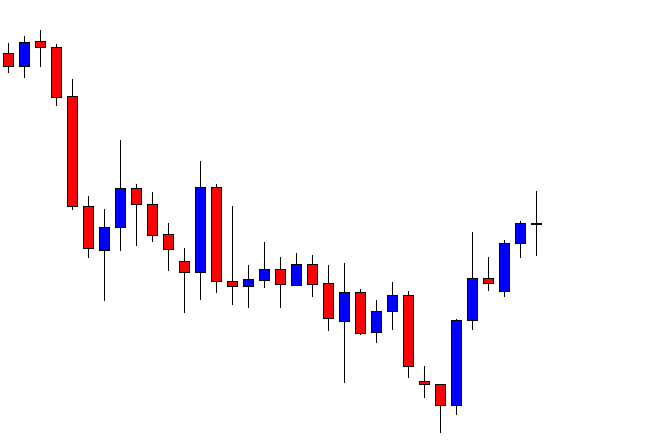
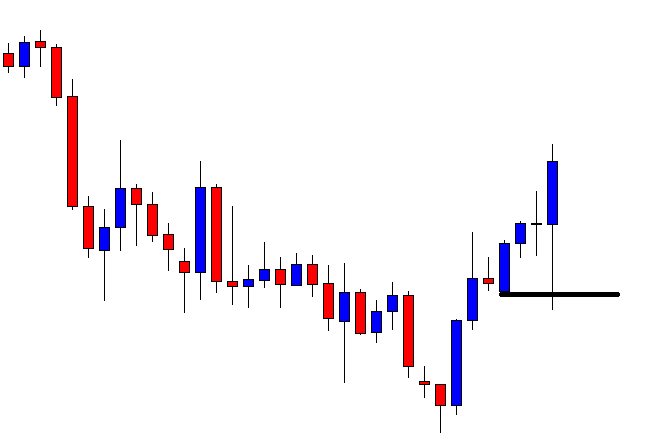
Use technical charts as a guide to where the price goes, but take into account what we have said at the beginning of this article: learn how your broker makes money. Think. 80 percent of the time, the intraday market move in ranges, so look for overbought and oversold prices and fade.

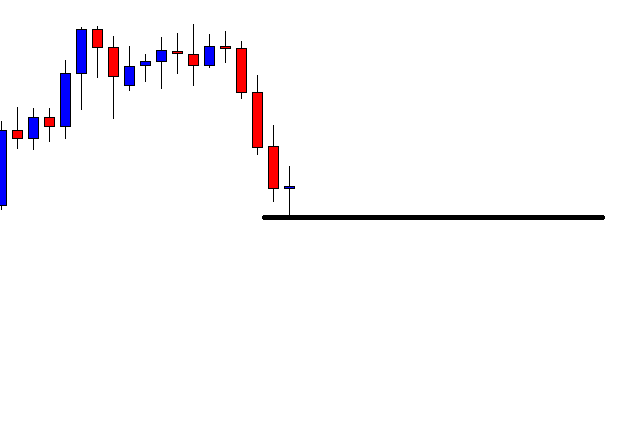
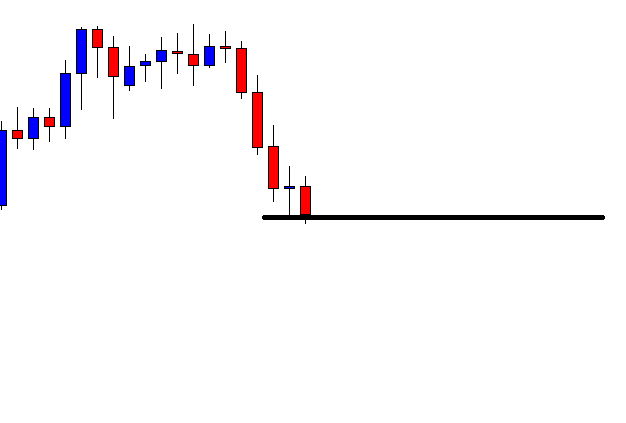
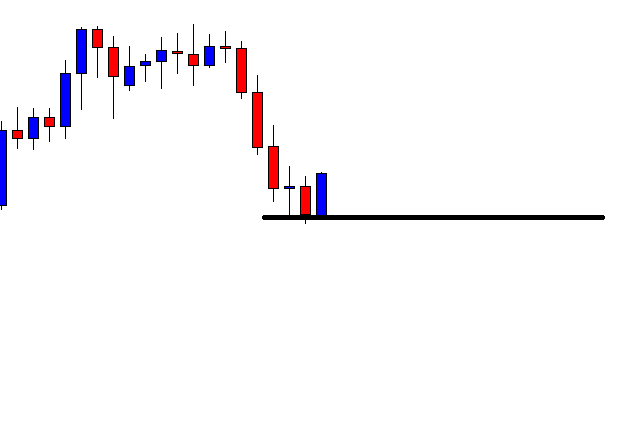
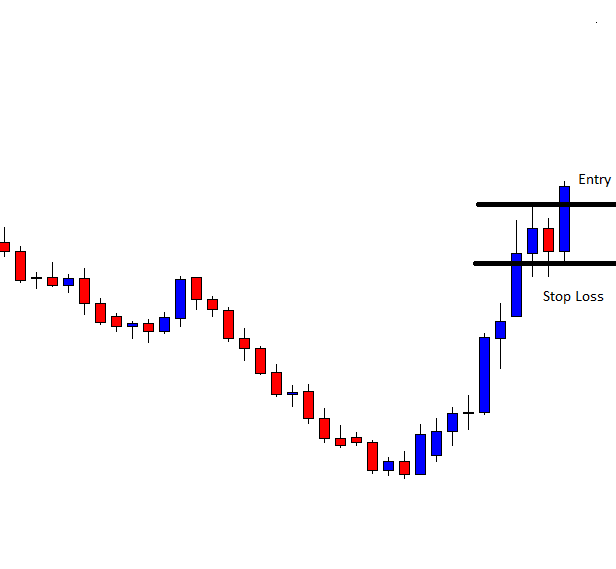
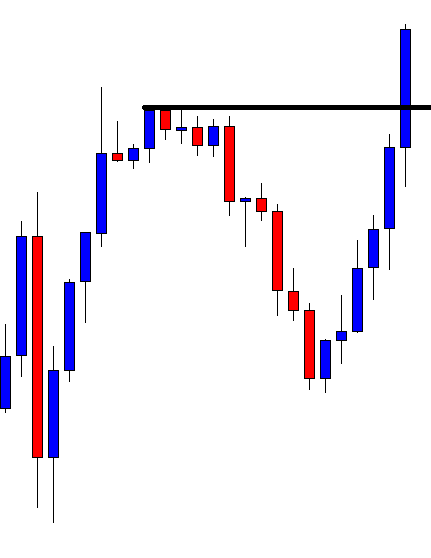
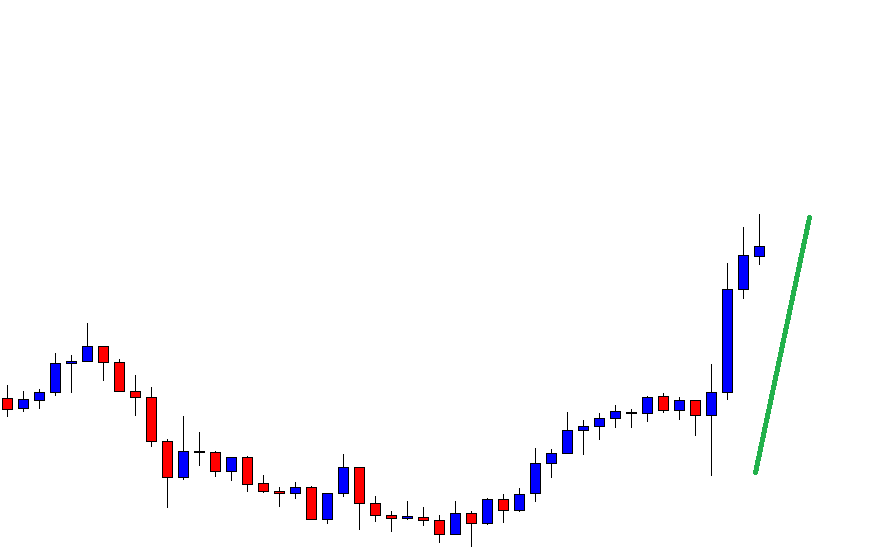
Follow the flow of the market

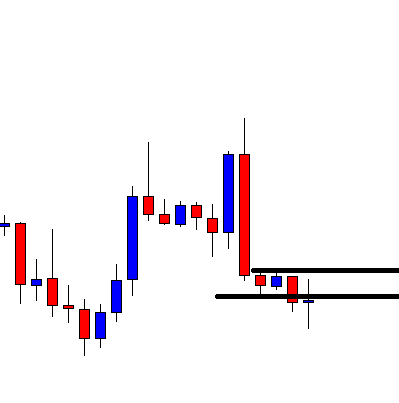
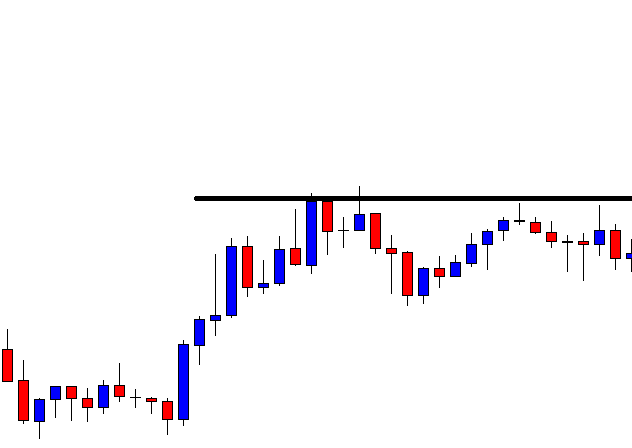
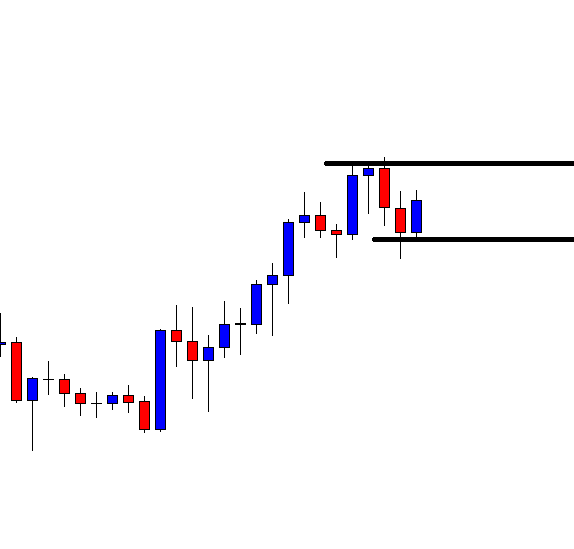
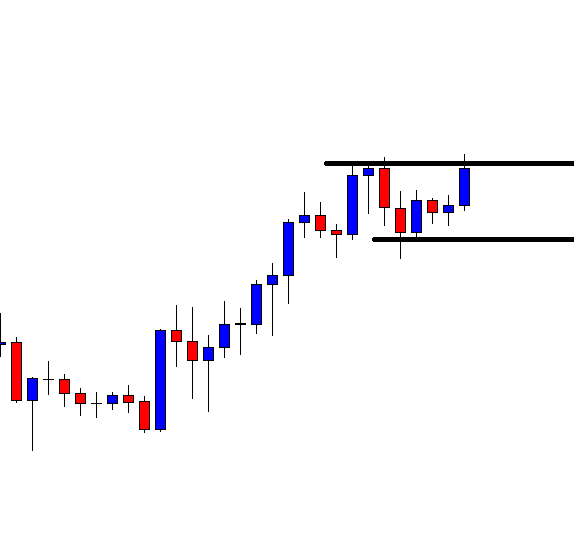
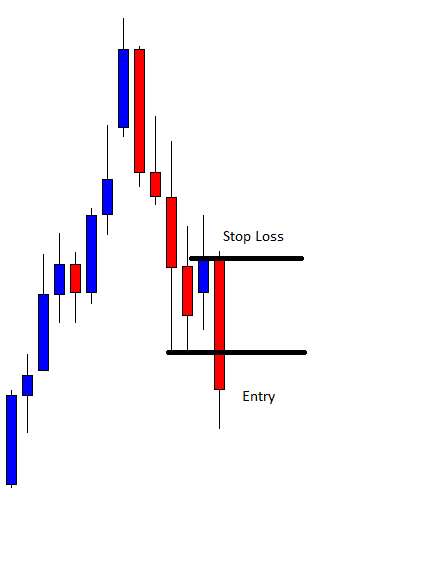
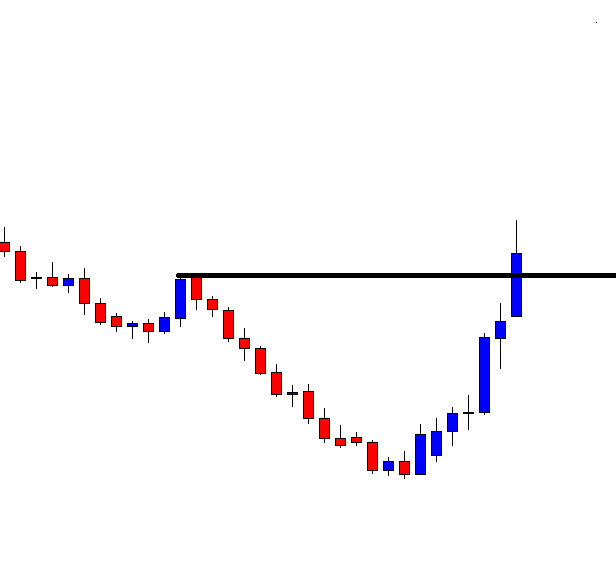
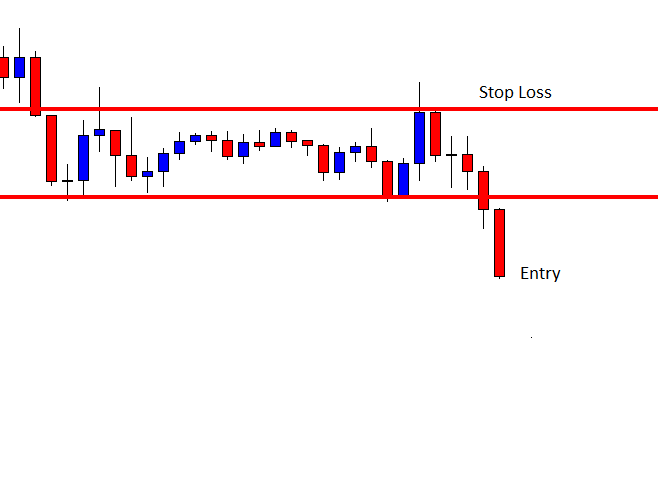
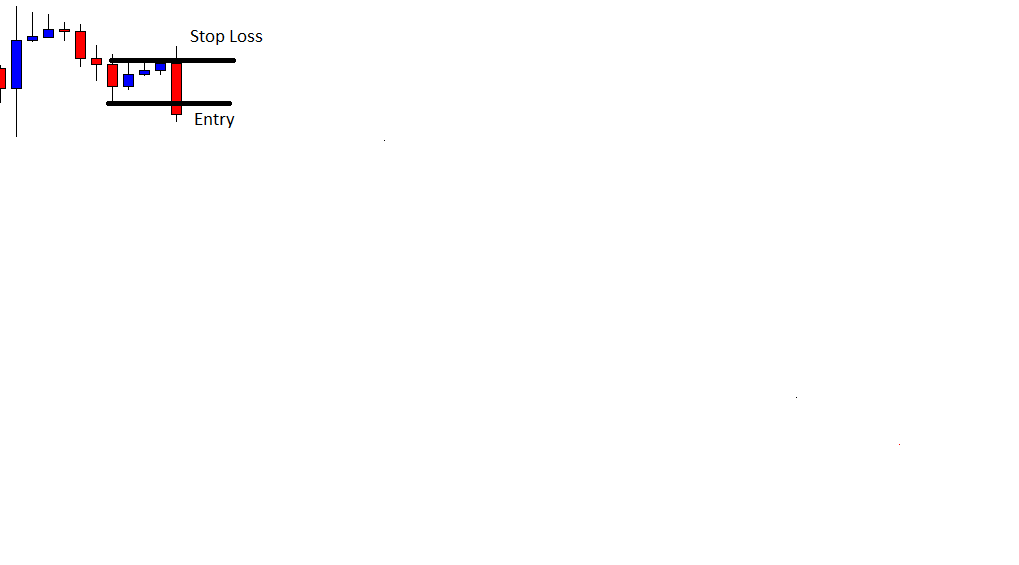
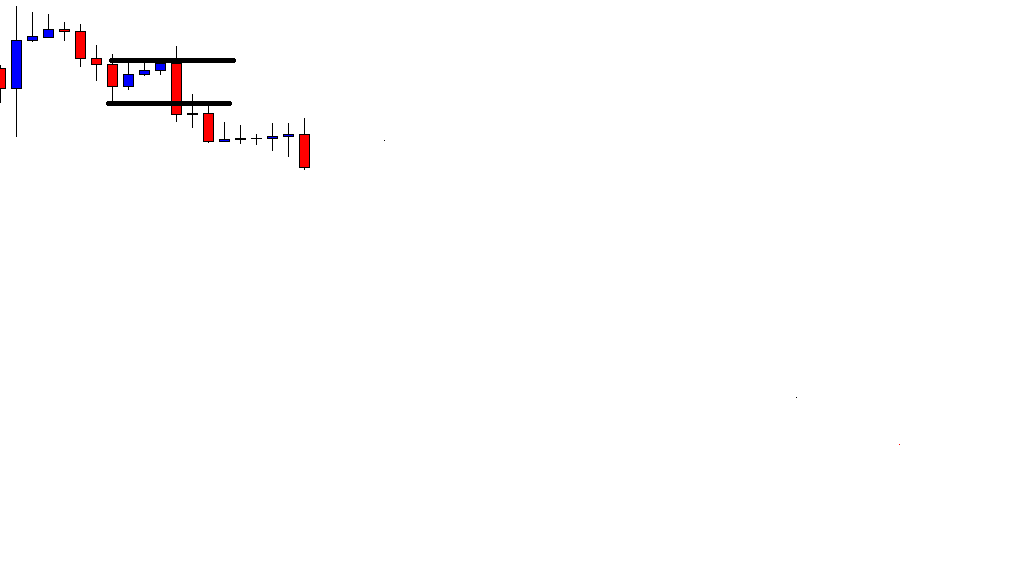
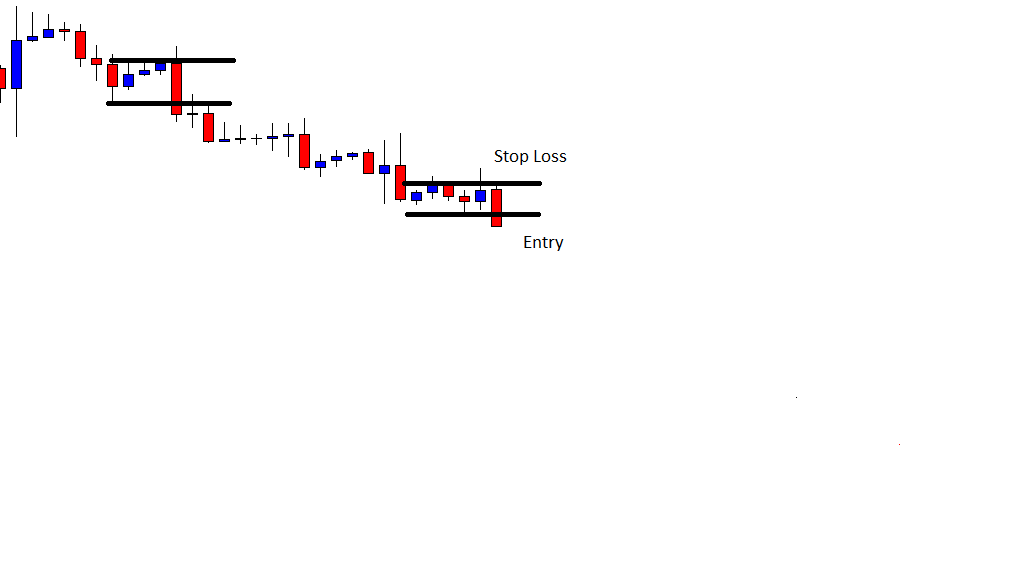
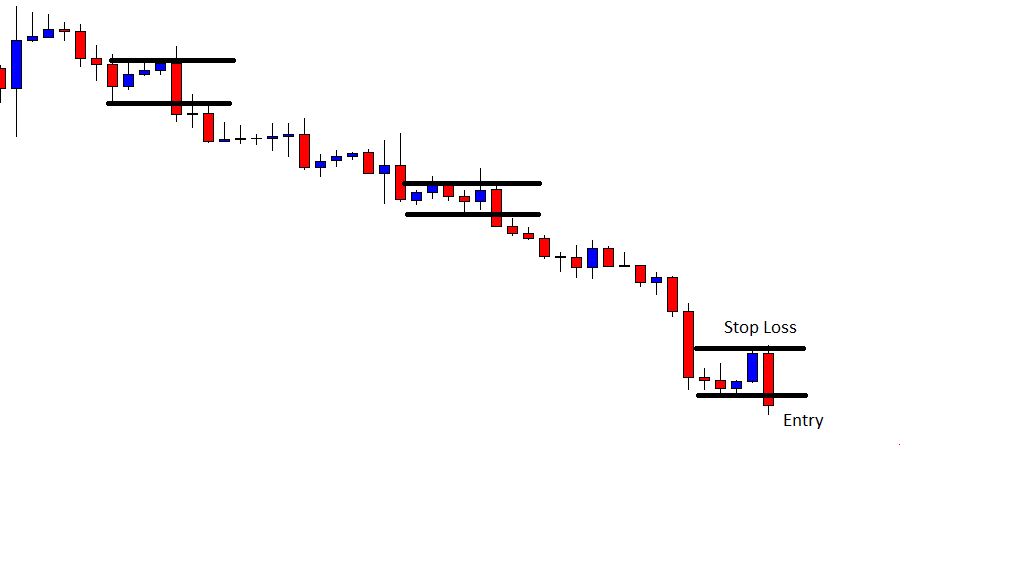
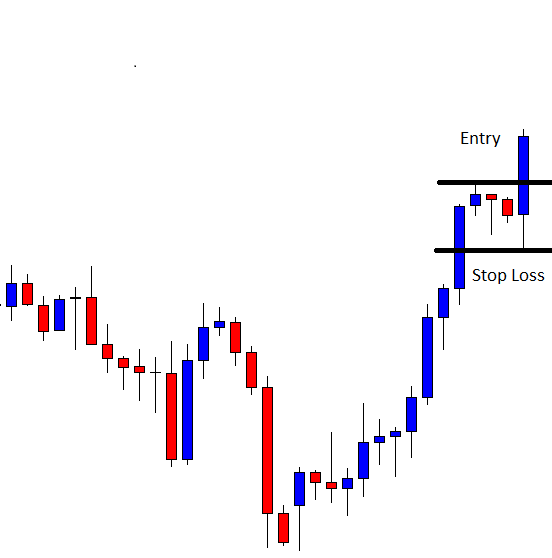
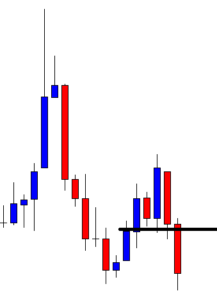
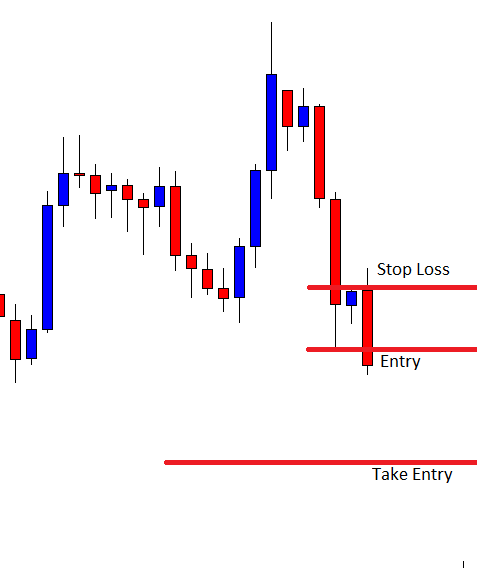
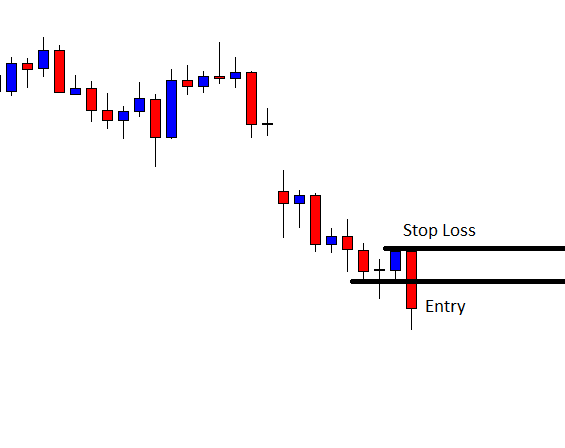
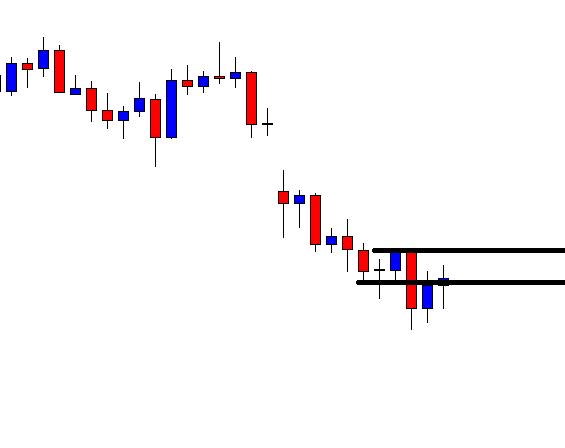
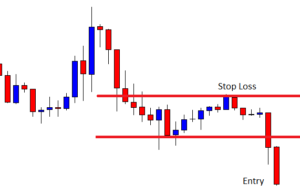
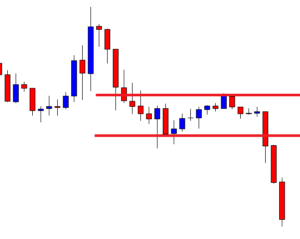
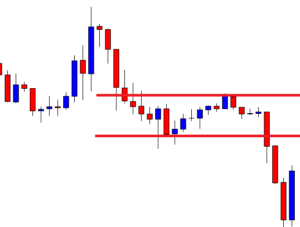
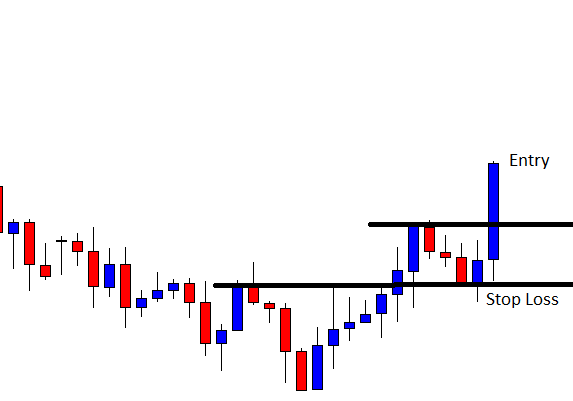
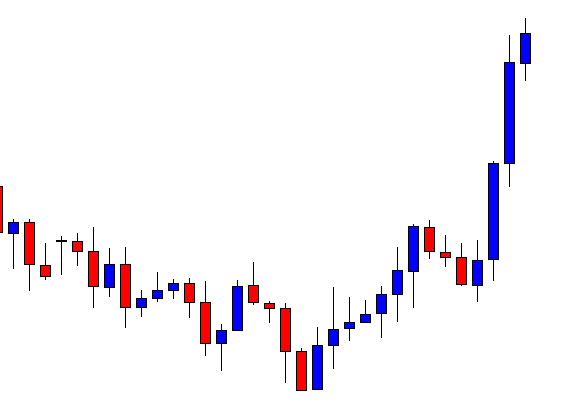
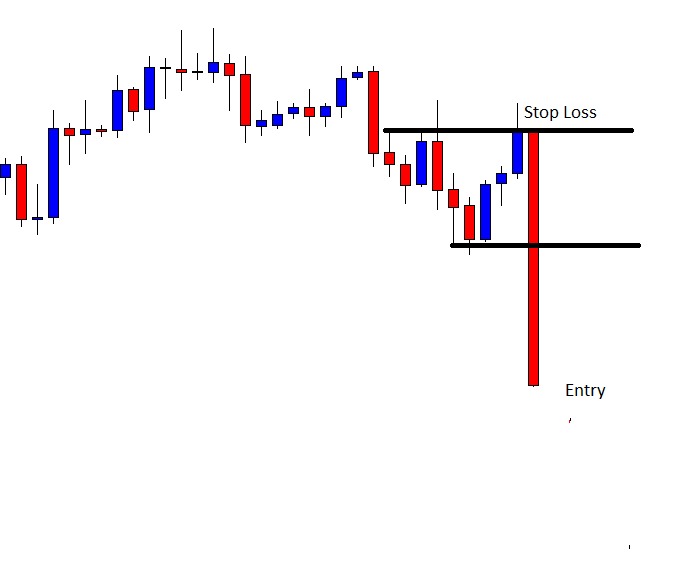
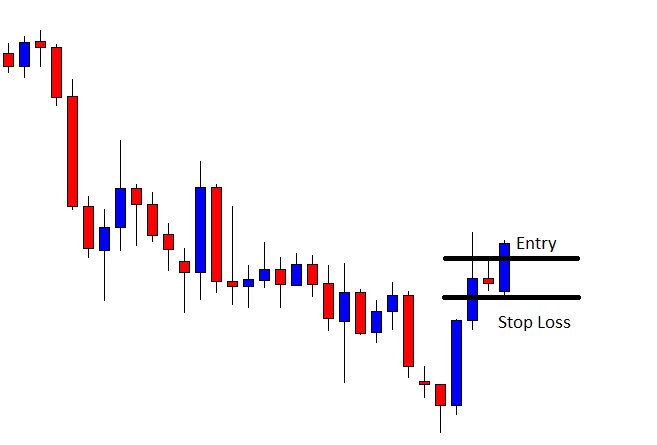
Let the market tell you the way. Use mental stop points and follow the volatility direction, but don’t chase the trade. Let the price come to your desired levels.

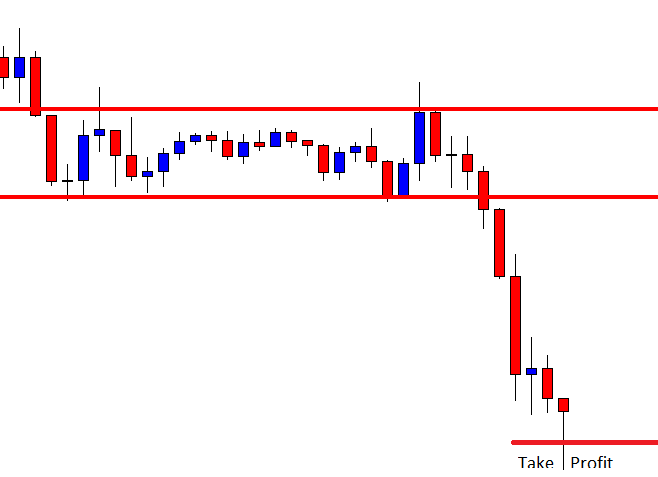
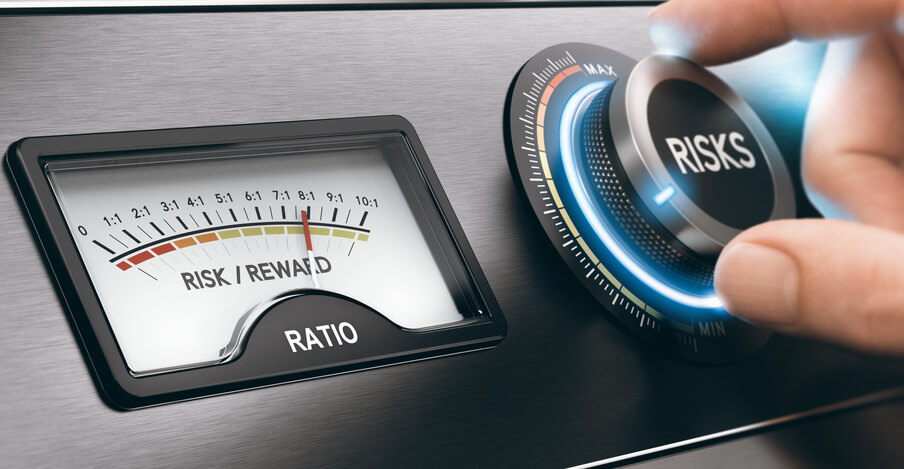
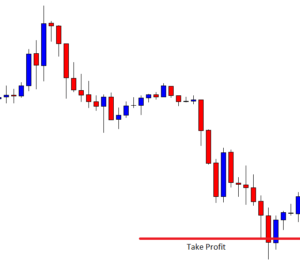
Reward-to-risk of two or more

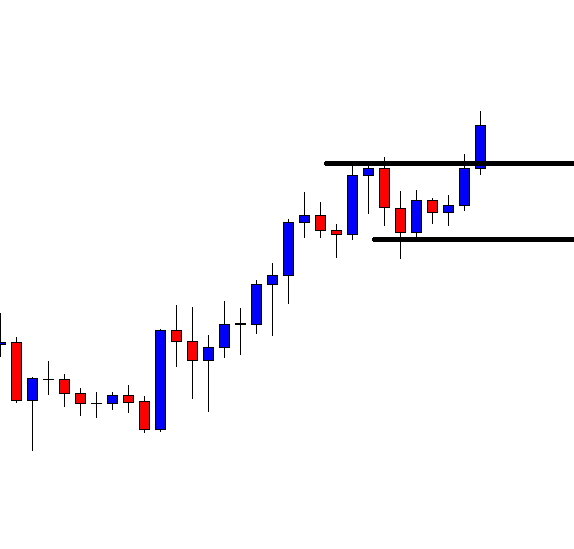
Use reward to risk ratios over 2 as a way to protect your system of a drop on the percent of winners. A RR higher than 2 guarantees you’re profitable if one over three trades succeed.


Further reading: Beat the Forex Dealer – Agustin Silvani 

 John Wiley & Sons Ltd.

Categories
Forex Daily Topic Forex Price-Action Strategies

Forex Traders: Get Patience, Optimism, and Never Give Up Attitude

In today’s lesson, we are going to demonstrate an example of the daily-H4 combination trading, which makes traders wait for a long time. Usually, if the daily chart produces a daily reversal, it creates an H4 entry within a day or two. In today’s lesson, the H4 chart takes four days after creating a daily reversal to produce the signal candle. Let us find out how it offers us entry.

This is a daily chart. The chart shows that it produces a bearish inside bar at a strong resistance zone. An inside bar is not a strong reversal candle, but a strong resistance zone may attract the sellers to look for short opportunities. The daily-H4 combination traders are to flip over to the H4 chart for the price to consolidate and produce a bearish reversal candle to offer a short entry. We flip over to the H4 chart later. Let us now have a look at the daily chart with four more daily candles.

The chart produces four more candles that are bearish. However, the daily-H4 combination traders do not get any A+ entry to go short. Should they skip eyeing on this pair? Never, they need to perform the same duty. As long as the last daily candle is bearish, they are to flip over to the H4 chart. The last candle on this chart is bearish. Let us flip over to the H4 chart this time.

You may notice that the H4 chart does not make deep consolidation followed by a bearish engulfing candle to offer them a short entry so far. Traders are to flip over to the H4 chart every day with no luck. Let us proceed to the next H4 chart.

The chart shows that it is having a deep consolidation. The last candle comes out as a bullish engulfing candle. However, the chart is still bearish biased unless it produces a bullish daily reversal candle. The sellers are to wait for an H4 bearish engulfing candle closing below consolidation support to offer them a short entry.

Here it is. The last candle comes out as a bearish engulfing candle closing well below consolidation support. The sellers may trigger a short entry right after the last candle closes with 1R.

The price heads towards the South with extreme bearish pressure. The price hits 1R with ease. Some traders may even make much more than 1R by taking a partial profit. In the end, it ends up being a prolific entry.

It does not come easily, though. The daily-H4 combination traders are to keep eying on the charts for four consecutive days. The H4 chart produces the signal on the fifth day after producing the daily bearish reversal candle. This is why Forex traders need to have patience, optimism, and never give up attitude.

Categories
Forex Daily Topic Forex Psychology

Sentiment Analysis- An Introduction


Market Sentiment

The Market sentiment term is used in reference to the mood of the market traders. Sometimes most traders feel fear and pessimism, and at other times they feel overconfident positive and, even, greedy. Investors trade their beliefs about the market, and the beliefs are raised by its over-protective system one (Please, read https://www.forex.academy/know-the-two-systems-operating-inside-your-head/). Thus, they react emotionally to the market, and these reactions influence the market at the same time that the market is changing their emotions.

The two systems

In the mentioned article, we talked about the work of Dr. Daniel Kahneman and the Two-systems model to explain people’s behavior. System one is fast and closely related to the primal emotions and instinctive knowledge. In contrast, system two is slow and is the way people use in rational thinking, computations such as math operations such as counting. We also said that system two trust system one most of the time. That is the way we are programmed. System one is a warning system if danger appears. 

Market Sentiment is a Contrarian Indicator

But the marketplace behaves very differently from the real world where system one was trained. Thus, market sentiment is a contrarian indicator. That is because the majority of market participants are non-professional investors moved mainly by greed or fear. Therefore, when a large portion of traders shows expectations about the future curse of an asset pointing to one direction, the market tends to move in the opposite direction. That is logical. Let’s suppose that a large percentage of retail investors think the EURUSD is going to rise significantly. That means they are invested in or plan to do it right away. At the times when the crowd is the most bullish, it is when they are nearly fully invested. 

The market is fueled by the buyer side. When everyone has already invested in the EURUSD most of their funds, almost no fuel is left to lift it further, as they don’t have more financial capacity to continue investing. Thus the demand shrinks. Only the supply side is left, since professionals, who sold every available lot to the masses, are not willing to buy that high; therefore, the prices should fall.

The Market Players

There are three types of market participants: The informed, the uninformed, and the liquidity players. The informed players have insider information about the course of the fundamental drivers and can position themselves in the direction of the future trend. These are the institutional traders. They tend to sell at the top, when the crowd is mostly optimistic and buy at the bottom when the public sees no end to the drop.

 Uninformed traders are the majority of retail traders. They act moved by greed and fear. Their greed made them bet with disproportionate leverage at the wrong moments. Their fear made then close their positions at the worst possible time or close it with minimal gains so as not to lose. 

 Liquidity traders are professional traders interested in short-term plays, so they mostly do not affect the primary market trends. On the forex, Liquidity traders operate using technical analysis and price-action strategies, using money management schemes and systems that have been proved to be profitable.

Traders are their worst Enemies

  •  Everybody knows they should buy low and sell high, but the majority buy high and sell low.
  • Everybody thinks it is easy to be successful in trading and be rick
  • Anyone should know that panic selling is a bad idea, but nobody follows the advice.
  • The major part of market signals is worth less than a coin toss, but people still crave them and then overtrade and lose at the first slight market retracement.
  • Nobody takes seriously trading with reward to risk ratios over two. Instead, they prefer High percent winners with lousy RR ratios.
  • Everybody trades untested strategies. Thus, they ignore the statistical parameters of the system, and, even, they cherry-pick the signals.
  • Nobody knows about position sizing even when they want to trade at maximal leverage.

Advice for you

Market Sentiment is a contrarian indicator. If you consider yourself a uniformed trader ( and 85% of retail traders are), trade against yourself. A lot of brokers trade against you, and they are getting rich.

Instead of one impulsive trade based on greed, consider yourself direction agnostic by taking two opposing trades using 15-pip away stop orders and a 2:1 Reward: Risk ratio: 

Practical System Example:

Two simultaneous and opposing orders with a Reward/Risk Ratio of 2.

1 One LONG EURUSD position
  • Buy Pending Order: Current price + 15 pip buy stop order
  • Stop-loss: 20 pips below the entry price
  • Take profit: 40 pips away from the entry price
2 One SHORT EURUSD position
  • Sell-short Pending Order: Current Price – 15 pip Sell stop order
  • Stop-loss: 20 pips Above the entry price
  • Take profit: 40 pips below from the entry price

Using this kind of order, you let the price tell you its direction. One order gets filled the other not. Also, an RR ratio of 2:1 protects you against a decrease in the percent of the winners, since only one good trade every three is needed to be profitable. 

Money management

Finally, do not risk more than one percent of your total assets initially. On the EURUSD, we know that every pip is worth $10 on each lot. Thus a 20 pip stop-loss distance is worth $400. To trade a full lot risking one percent, your account balance should be $40,000. Therefore if you own just $4,000, do trade one mini lot, and if your account is only $400, you should use just one micro-lot.

Learning is hard. You will think that trading that way you won’t get rich quick, but just four things you must consider.

  1. Your initial purpose should be to learn your trading job and know how the system performs.
  2. The primary goal of a trader is to preserve the capital
  3.  Compounding is a powerful concept.
  4. You should know your risk and its characteristics.

References:

THE COMPLETE RESOURCE FOR FINANCIAL MARKET TECHNICIANS, THIRD EDITION, 2016. Charles D. Kirkpatrick II, CMT Julie Dahlquist, Ph.D., CMT

Thinking, Fast and Slow, Daniel Kahneman


Categories
Forex Basic Strategies Forex Daily Topic Forex Price Action

Support, Resistance and Trade Management

-Support and Resistance are the two most important concepts in the financial market. Forex traders strongly rely on support and resistance, as well. Price action traders’ main weapon is support and resistance. In today’s article, we are going to demonstrate an example of how the price reacts to a major level of support and resistance. Let us get started.

Look at the chart. The price consolidates around the red-marked level, it finds its resistance there and makes a bearish move. After having a correction, it makes the new lowest low. This is now the sellers’ territory. Let us assume that there is no significant level, which may hold the price as support. Thus, we are not able to mark any level as support. The sellers are to wait for the price to consolidate and produce a bearish reversal candle to offer them short entry in this chart.

The price makes new lowest lows and heads towards the South with good bearish momentum. However, it seems that it may have found its support. It consolidates for a while around the red-marked level and produces a bullish engulfing candle. The buyers on the minor chart may get them engaged to keep an eye on the chart to go long above the highest high of the last candle. Let us find out what happens next.

The price heads towards the North. It consolidates and produces another bullish engulfing candle. It means the chart is now the buyers’ territory. This is where the game of support and resistance begins. You may have noticed that we have red-marked the level. This is the most significant level in this chart for the buyers. The price may consolidate and find its resistance in this chart before it reaches the red-marked level. However, this is where traders may make a decision concerning their long position. They may either close their whole trade or take partial profit.

The price keeps heading towards the North. It buyers are having a party here. They must not forget the red-marked level, though. Let us proceed to the next chart.

Look at the chart carefully. Do you notice that the price consolidates around the red-marked level, which is the swing high in this chart? It produces a bearish engulfing candle followed by another bearish one. The last candle on this chart comes out as a bullish inside bar. If the next candle comes out as a bearish engulfing candle, the sellers may drive the price towards the South. I am sure now you know where the sellers are to be careful with their trade management. Yes, they must take the red-marked support (swing low in this chart) into account to manage their short entries.

Categories
Forex Daily Topic Forex Price-Action Strategies

Manage Your Trade Differently on Different Charts

In today’s lesson, we are going to demonstrate an example of an H1 breakout strategy. Before hitting the target, at some point, the price gets sluggish. Nevertheless, it hits the target in the end. Let us now proceed to find out the lesson it has to offer us.

This is an H1 chart. The price gets choppy within these two horizontal lines. It has a rejection and makes a bearish move upon producing a bearish inside bar. The chart is yet to make a breakout. Until it makes a breakout, it does not have anything to offer to the buyers or the sellers. However, as it stands, the buyers may have an upper hand here. Let us proceed to the next chart.

Here it comes. After a long while, a candle breaches through the level of support closing well below it. The candle has a long lower shadow, but the breakout is explicit. The sellers are to wait for the next candle to close its lowest low to trigger a short entry.

The next candle comes out as a strong bearish candle. This is one perfect looking bearish candle to attract the sellers to trigger an entry. The sellers may trigger a short entry right after the candle closes, setting stop-loss above the level where the trend starts with 1R.

As expected, the price heads towards the South with good bearish momentum. However, look at the last candle. It comes out as a spinning top. In a strong bearish trend, it is not considered as a strong bullish reversal candle. Moreover, it is an H1 chart, and the entry is triggered based on the H1 breakout strategy. Thus, the sellers must hold their position and wait. To be precise, they should not even look at this chart anymore by following the rule of ‘Set and Forget.’

The price hits the target. The next candle, after the spinning top comes out as a bearish candle. However, it closes within consolidation support. If it were an H4 or the daily chart, the sellers would have to close the trade manually. This is the difference between trading on the minor chart and major chart.

If we have a plan to take trading as our fulltime business, we may have to trade on different charts from the 15M to Weekly. Trade management varies from chart to chart. This is what we must remember. In the beginning, we shall master on a particular chart that we are comfortable with. Then, we may start trading on the other charts, preferably on the demo first. Once we are confident, we may trade on that chart in our live account. We must not apply a strategy or manage the trade the same way on the weekly chart that we are successful on the H1 or the 15 Chart.

Categories
Forex Daily Topic Forex Price Action

A Business of Glorious Uncertainty

Trading on the daily-H4 chart combination often brings more reward than our initial expectation. Typically, traders aim to earn 1R. However, it may even bring up to 5R. In today’s lesson, we are going to show an example of this.

This is a daily chart. The price heads down with good bearish momentum. The last candle is a spinning top. In a strong bearish daily trend, a spinning top does not suggest that the trend may change. However, the H4-daily traders’ strategy is different. They are to flip over to the H4 chart and wait for consolidation followed by a bullish breakout, to go long on the pair. Let us flip over to the H4 chart.

The H4 chart looks good. The chart produces two bearish candles consecutively. The buyers are to wait for a bullish engulfing candle closing above consolidation resistance to go long. The chart suggests that the buyers shall stick with the chart.

It consolidates more and produces a bullish engulfing candle. However, the candle closes within consolidation resistance. They are to wait for more. Look at the last candle. It seems like it is going to have a deep consolidation again.

This time the chart produces a bullish engulfing candle closing well above consolidation resistance. The buyers could trigger a long entry right after the candle closes and set the stop loss below the signal candle’s lowest low.

The trade does not go as per buyers’ expectations. It takes time to hit the target. However, the candle breaches through the take-profit level, closing as a strong bullish candle. The buyers may consider taking a partial profit and let the rest of the trade run. Let us find out what happens next.

This time the price heads towards the North with extreme bullish pressure. It travels about five times the distance of the buyers’ initial target. Assume, by taking partial profit, how much more a trader can earn. This is the beauty of trading on the daily-H4 combination. Since the daily chart is involved here, the price often heads towards daily support/resistance. This brings traders more profit if they deal with their trade accordingly. Another interesting point here to be noticed, despite producing an excellent bullish engulfing candle, the price does not head towards the North with good bullish momentum. On the other hand, once it hits the target level by producing another bullish Marubozu candle, it keeps going towards the North with extreme bullish momentum. This is why trading may be called a business of glorious uncertainty.


Categories
Forex Daily Topic Forex Videos

Forex Black Swan Event Update! What Should You Be Trading & Avoiding

Black Swan event update!

If you missed our earlier article, a financial black swan event is usually a catastrophic event such as the Japanese earthquake and tsunami of March 2011, or virus breakout events such as the Sars epidemic in 2002/2003, Avian flu, or the Ebola breakout in West Africa in February 2014.
These events cannot be predicted and have the risk of severe consequences for the global economy. Black swan events are thankfully rare and have a severe market impact. They are also almost impossible to predict.


The latest COVID-19 breakout in China could turn out to be a major black swan event, with severe implications for the global economy.
While previous black swan events such as the 2003-2004 Sars epidemic wiped 14% off of the S&P 500 in as little as two months, it subsequently went on to recover its losses and gained from there. The avian flu crisis in 2006, the Ebola crisis in March 2014, both had similar effects, where the S&P slumped at the time only to recover and thrive after the events. It would, therefore, seem that stock indices, especially in the USA, such as the S&P 500 and DOW 30, have taken that onboard and, as yet, have suffered no real sustained selling pressure. And although both have recently hit record-breaking all-time highs, we might expect normal ebbing and flowing based on US fundamentals until the real global impact of the COVID- 19 can be seen in terms of hard data. And that won’t be available for several weeks. History tells us that the markets are prone to short jolts during such events, but they go on to recover, and in many cases, make further gains than were lost.
Another fairly typical scenario would be for investors and traders to bail out of riskier assets, such as equities, but that isn’t happening in the USA at the moment. And where safe-haven assets such as the Yen or Swiss Franc currencies get bought.


However, when the Japanese health expert who visited the Diamond Princess at the port in Yokohama said the situation on board was “completely chaotic” it left the market wondering if there could be an outbreak of the disease in mainland Japan, who earlier in the week said the virus could impact their GDP by 0.2%. This, coupled with weak data and the possibility of a spread of the infection in Japan, saw the USDJPY pair punch through the psychological 110.00 barrier this week. Should there be a breakout, it will prove catastrophic for the Japanese economy and where we might see the pair accelerate to 115.00 and beyond.


With the Yen failing to act as a safe haven we might see a continuation higher in USDCHF, where the Swiss National Bank has made it clear they are not happy with a strong Franc, and they will defend this stance by intervention, in which case we might see a return to the 0.1000.00 level.

The pound and Euro have their own problems with uncertainty regarding if the UK can reach a trade deal by the deadline of December 2020 and where the economic data coming from the Euro area looks bleak and where Germany is struggling to achieve growth. The COVID-19 virus will not help.


The Australian dollar is also on the back foot due to its dependence on trade with China as with New Zealand, and we might see AUDUSD hit 0.63 and NZDUSD test 0.60 in the short term if there is no immediate resolution in China, which looks highly unlikely.

Oil prices are at risk, and we would expect gold and precious metals to remain bid.
The Chinese government has committed to honoring the trade pact with the rest of their partners across the globe, but the longer this goes on, the more likely the markets will doubt if this is possible.

And so while the US economy remains strong and while economically and geographically it remains on peripheries of the virus event, and with its higher interest rates than the other safe-haven currencies, we should now see a further surge in the USD DXY which is approaching the psychological 100.00 level and which is now being seen by the markets as a safe haven currency and preferred investment choice.
Therefore, all scenarios are strictly data dependant and likely to be fluid and volatile as things unfold.

Categories
Forex Daily Topic Forex Price Action

Riding on a Trend is rewarding

The trend is the trader’s friend. To be able to spot the trend and reversal point are the two most important factors of price action trading. In the Forex market on the minor charts, trend changes in a second. However, the trend usually continues on major charts such as the H4, the daily as well as weekly. In today’s lesson, we are going to demonstrate an example of how we can ride on a trend and make most of it.

The chart shows that after making a strong bearish move, the price produces three consecutive bullish corrective candles. It finds its support and creates a bearish engulfing candle closing below consolidation support. The sellers may trigger a short entry right after the last candle closes. Let us proceed to the next chart.

The price heads towards the South and hits 1R. Look at the last candle. The candle comes out as a bearish engulfing candle as well after a long consolidation. However, the sellers on this chart shall skip taking this entry for its shallow consolidation. Let us find out what happens next.

The price again consolidates and produces another bearish engulfing candle. The sellers may trigger another short entry right after the last candle closes. This is the second entry of the trend.

As expected, the price again heads towards the South. This time the price moves with strong bearish momentum. The sellers again make some profit here. Let us proceed to the next chart.

The chart after producing one stronger bearish candle consolidates. This time the chart presents an A+ trade setup with deep consolidation and a strong bearish engulfing candle. The sellers may trigger another short entry here with 1R.

This is what tells the story of the Forex market. This one has been the best entry so far on this chart. However, the price does not head towards the trend’s direction as expected. Nevertheless, it hits the target again (1R). The sellers again make some pips. Altogether, it offers three entries and this is called riding on a trend. By looking at the chart, it seems it may provide more. The buyers must stay out of this chart until it produces a strong bullish reversal.

Meanwhile, the sellers shall keep eying on the chart to go short with the same process. It does not happen so often but when it does, traders shall make most of it. As they say, “Trend is your Friend,” and we have just demonstrated that riding on a trend is very rewarding.

Categories
Forex Daily Topic Forex Price-Action Strategies

ABC Pattern Trading: A Little Adjustment Needed According to the Charts

The ABC pattern is one of the traders’ favorite trading patterns for its lucrative risk-reward. It usually offers at least 1:2 risk-reward. In many cases, it offers even more. However, the price may sometimes find it hard to make a breakout at point B. That is where the ABC pattern traders must be patient and hold their nerves while trading on the minor charts. However, with major charts, it is a bit different. In today’s lesson, we are going to demonstrate an example of the ABC pattern trading on a minor chart.

This is an H1 chart. The price heads towards the North with good bullish momentum after having consolidation for a long time. The ABC pattern traders are to wait for the price to make a downside correction and produce a bullish reversal candle at C point.

The price has been on a downside correction. It produces three consecutive bearish candles. The ABC pattern buyers shall keep their close eyes on the chart to get a bullish reversal candle.

The chart produces a bullish engulfing candle. This is an A+ bullish reversal candle. The ABC pattern traders have some drawing work to do before the price produces a reversal candle. We find this out in a minute. Can you guess where the chart produces the bullish reversal candle? Have a look at the chart below.

Do you notice that the price had a massive rejection at the same level earlier? The chart produces the bullish reversal candle at the flipped support. This is an ideal C point. The buyers may trigger a long entry right after the candle closes by setting stop loss below the signal candle. As mentioned, take profit may be set at least with 1:2 risk-reward.

After triggering the entry, the price heads towards the North with good bullish momentum for three more candles. It then starts having consolidation around the last swing high (at point B). It often happens. The buyers must wait and hold their positions since the trade setup in on the H1 chart. The intraday ABC pattern traders must follow the rule “Set and Forget”. With the H4, the Daily, it is different though. Let us proceed to the next chart.

The chart produces another bullish candle and hits the target. The buyers’ have achieved their 2 R target. We must remember that when we trade on the ABC pattern, we adjust our target according to the chart. Intraday charts (5M, 15M, H1) usually makes a breakout at Point B. Thus, we let the trade run and decide its route. On the other hand, if an entry is taken on the charts such as the H4 and the daily based on the ABC pattern, we may consider taking at least 50% profit at Point B. This is where a little adjustment is needed if we trade based on the ABC pattern.

Categories
Forex Basic Strategies Forex Daily Topic

Partial Profit-taking and Decision-making

Traders on major charts such as the daily and the H4 often take partial profits and let the rest of the trade run to earn more profit. This is an effective way to earn more pips without any doubt. Yes, to do that, traders need to have good ideas about price action and enough experience to interpret the market’s language. In today’s lesson, we are going to demonstrate an example of partial profit-taking and a situation where traders to make a decision. Let us get started.

This is an H4 chart. The price heads towards the North with good bullish momentum. It then consolidates and produces a bullish engulfing candle. The buyers may trigger a long entry right after the last candle closes. Typically, the buyers shall aim to earn 1R.

The next candle comes out as a bullish candle as well. Things look suitable for buyers. It seems they do not have to wait too long to achieve 1R. Let us proceed to the next chart.

Things do not go according to the buyers’ expectations. However, the price hits their 1R target. Look at the last candle. It comes out as a bullish engulfing candle. Thus, the buyers may consider taking partial profit and let the rest of the trade run. Let us assume that the buyers take out their 50% trade. With 1R, they have free trade running.

After two more candles, things look a bit different. Anyway, the buyers must be patient and hold their positions. Overall, price action has been very bullish biased.

After a long while, the price does not know where to go. It gets trapped within two horizontal levels. Have a guess. What should you do here? It is an H4 chart, and the price action has been very choppy recently.

Yes, traders may close the rest of the entry as well. The price is at the breakeven (a bit above). Traders get ½ R here. In most cases, partial profit-taking rewards more. However, in some cases, it may not give us the maximum reward. Another important thing with partial profit-taking is it is to be applied when we trade only on the major charts. We may not consider taking partial profit if we trade on the 5M, the 15M, or the H1 chart. With partial profit-taking, we need to be well acquainted with using trailing stops as well. Only that is when we will be able to make the most out of it.

Categories
Forex Basic Strategies Forex Daily Topic

Consolidation Length: An Important Aspect of Price Action Trading

In price action trading, new traders at their beginning often ignore an important factor. This leads them towards taking losing entries. In today’s lesson, we are going to demonstrate an example of a winning trade and a losing trade on the same pair. Later, we try to find out what that important factor is.

This is an H4 chart. On the chart, the price heads towards the South with good bearish momentum. Upon finding support, the chart produces three consecutive corrective candles. The sellers must keep their eyes on the chart. A bearish reversal candle, along with a breakout at consolidation support, would be the signal to go short on the pair.

The price action produces a bearish engulfing candle, which closes below the level of consolidation support. The sellers may trigger a short entry right after the candle closes with 1:1 risk-reward. Another point I may add here is the daily level of support is far enough, which allows the H4 chart to travel towards the South a lot further down.

The next candle comes out as an inside bar bullish candle followed by another bearish candle. The sellers are to wait a bit more to hit their take profit level. As things stand, it may not take long. Do you notice something here? Let us have a look at the same chart with more drawings on it.

Does it not offer another short entry? It does, since the daily support level is far enough, as mentioned earlier. Typically, the sellers shall go with 1:1 risk-reward. Let us proceed to the next chart. Do not forget that we have two entries here.

The next candle comes out as a bearish candle as well as closing within the previous candle, though. The first entry does not hit the target yet. It has a few more pips to reach. Things look good for those two entries.

The next candle hits Take Profit level for the first entry. Let us wait and find out what happens with the second one.


The price gets choppy and hits the stop loss of the second entry. Can you find the difference between the two entries? Do not worry about the next level of support. Both entries meet all the requirements for the sellers. However, there is one difference, which is consolidation length. On the first occasion, the price makes a deeper correction/consolidation. On the second occasion, the price makes a shallow correction. Usually, the price travel four times of consolidation length. It means if the consolidation length is 10 pips, the price travel 40 pips in total (from where the trend starts). Thus, the deeper the consolidation length, the stronger the trend gets. In our future articles, we will learn more about consolidation length, breakout, and target. Stay tuned.

Categories
Forex Daily Topic Forex Price-Action Strategies

Never Forget to Calculate Risk-Reward

Risk-Reward is an extremely important factor in Forex trading. The price often makes a reversal at a significant level of swing high/swing low. Thus, price action traders must emphasize those levels before taking any entry. By calculating risk-reward, they should only take entry once a trade setup is found lucrative as far as the risk-reward ratio is concerned. In today’s article, we are going to demonstrate an example of a trade setup, which looks good with candlestick patterns and price action. However, things do not go as it usually goes. We try to find out the reason behind it.

After being bearish for quite a while, the chart heads towards the North by producing a bullish inside bar. The chart presents a strong bullish candle followed by a corrective candle. This is what price action traders wait for. Ideally, they are to wait for a bullish engulfing candle closing above the consolidation resistance to go long on the pair. Do not miss the drawn level, which is the last significant swing high.

Here it comes. The chart produces a bullish engulfing candle closing well above the consolidation resistance. Some traders may think that they shall trigger a long entry right after the last candle closes. We must not forget that it is not only about candlestick and breakout. There is another factor, which is risk-reward. The reward does not look good comparing to the risk.

The next candle does not disappoint the buyers (if there are some). However, it gives a strong message that the level of resistance has gone stronger. The price may make a reversal. Let us find out what the price does next.

The next candle comes out as a bearish engulfing candle. This is one of the strongest bearish reversal candles. Since a significant level of resistance produces the candle, the sellers are getting ready to go short on the pair upon a bearish breakout. Those who took a long entry earlier, their trade is in great danger.

The next candle comes out as a bearish candle having a strong bounce at the level of last support. It must have swept away buyers’ stop loss. The last candle does not make a bearish breakout and has a long lower shadow, which is not a good sign for the sellers as well.  However, the buyers have not been able to take advantage of such nice bullish price action. The Forex market could take any direction since there are technical as well as fundamental aspects. Nevertheless, if we are to find one valid reason for the bearish reversal, it most probably is risk-reward.

Categories
Forex Daily Topic Forex Price-Action Strategies

When You Confront a Loss

In today’s article, we are going to demonstrate an example of a failed entry on the daily chart. In a bullish market, the chart produces a bearish inside bar followed by a perfect looking bullish engulfing candle closing well above the level of resistance. However, the price heads towards the South and hits the stop loss. We try to find out what goes wrong here.

The chart shows that the price heads towards the South with strong bearish momentum. The sellers are having a feast here. Any intraday breakout at the lowest low of the last daily candle may get the traders to go short on the respective chart. Let us proceed with what happens next.

The last daily candle comes out as a bullish inside bar. Intraday buyers may search for a long entry on any breakout at the highest high of the last daily candle. On the other hand, the daily chart traders are to wait for the next day’s candle to close as a bearish engulfing candle.

The price heads towards the North with good bullish momentum. The chart produces two more bullish candles after that inside bar bullish candle. The chart looks good for the buyers on the daily chart as well. If the chart produces a bearish reversal candle followed by a bullish engulfing candle closing above the level of resistance, the buyers may go long on the daily chart.

The chart produces an inside bar. This must excite the buyers. If the next candle comes out as a bullish engulfing candle closing above the resistance of this bullish wave, the buyers may trigger a long entry.

Here it comes. This is what the buyers wait for. They may trigger a long entry right after the candle closes by setting stop loss below the candle’s lowest low. The significant level of resistance is far enough, which offers them a tremendous risk-reward. Moreover, this is the daily chart, which is one of the most consistent charts in the Forex market. In a word, this is a good trade setup for the buyers.

The price hits the stop loss the next day. The daily candle one after it comes out as a bearish candle too. The chart looked extremely good for the buyers two days ago. Now things are very different. If we dig into it, we do not find anything particular that the chart misses to produce such bearish candles all of a sudden. Technically, there is nothing wrong with the entry. We must remember this is how the market goes. It happens a lot. We must learn how to absorb such an unpleasant incident.


Categories
Forex Daily Topic Forex Price-Action Strategies

Daily-H4 Combination: A Daily Reversal on the Daily, Flip Over to the H4

In today’s article, we are going to demonstrate an example of a daily–H4 combination trade setup. On a strong bullish market, the daily chart produces a bearish reversal candle and offers a beautiful short entry for the sellers, the price gets exceptionally bearish, and it may remain bearish for a long time. Let us get started.

Look at the last candle, which closes as a bearish marubozu candle. Before that candle, the pair heads towards the North with strong bullish momentum. At some point, a bullish engulfing candle engulfs an inside bar bearish candle. This is an extremely good signal for the daily chart’s buyers to go long on the pair. Many daily buyers might have lost money here. However, the next candle (the last candle on this chart) changes the equation for daily-H4 combination traders. It is now time for them to flip over to the H4 chart.

This is how the H4 chart looks after flipping over. The price starts having consolidation, as well. A bearish engulfing candle closing below the lowest low is the signal for the sellers to trigger a short entry.

The next candle comes out as a bearish engulfing candle closing well below the lowest low of the bearish wave. The sellers may trigger a short entry right after the candle closes by setting stop-loss above the level of resistance (with some safety pips) and by setting take profit with 1:1 risk-reward.

As expected, the price heads towards the North with good bearish momentum. It seems that the price is in a hurry to hit the target. It may hit the target within the next candle. Let us find out what it does.

The price hits the target. The last candle comes out as a very strong bearish candle, which suggests that the price may head towards the North further. However, 1:1 risk-reward is achieved. This is what the first target as far as daily-H4 combination trading is concerned.  Considering the last candle’s attributes, the price may produce at least one more bearish wave in this chart. Anyway, we have a lesson to learn from here. We are to wait for the daily chart to produce a strong reversal candle. It does not matter how strong the trend has been. As long as we get a strong bearish reversal daily candle, our job first job is to flip over to the H4 chart. We must wait for the H4 consolidation and the signal candle closing below the highest high/lowest low of the last wave to trigger entry.


Categories
Forex Daily Topic Forex Price-Action Strategies

Mind the Gap Price Action Traders

In the Forex market, most pairs start trading with a gap after weekends. Most of them are not visible on charts such as the H1, H4, or the daily. Some pairs begin with a big gap, which is visible even on the major charts. It gets difficult for price action traders to trade and make a profit when a pair starts with an evident gap. In today’s article, we are going to demonstrate an example of this.

The trend starts with a bearish engulfing candle, which is a strong indication that the trend may sustain for a long time. The sellers are to wait for the price to consolidate and strong bearish reversal candle to go short on this chart. However, do not miss that the chart has a gap followed by trend continuation. It finds its support since it produces a doji candle followed by a bullish engulfing one.

The price finds its resistance as well. Look at the last candle on the chart. It is a bearish engulfing candle closing well below the level of support. Usually, the sellers may trigger a short entry right after the last candle closes in such price action. It is not a usual chart since it has a gap. Let us assume we have triggered a short entry here.

The next candle comes out as an inside bar bullish candle. The last candle comes out as a doji candle closing right at the breakout level. The bear still has control.

The last candle on this chart breaches through the level of stop loss. The trade does not go according to the sellers’ plan. The trend initiating and the breakout candle gets a 10 on 10. However, it gets us a loss. Do not forget this could happen any time with any trade setup. With this chart, something works against price action traders in both buying and selling. Can you guess what that is? Yes, it is the ‘Gap.’ Let us proceed to the next chart. It may create more drama.

It produces a spinning top. The buyers may think that they have a chance to take control next if it produces the next candle as a bullish engulfing candle.

It does not. It continues heading towards the South again at a slower pace. A chart with a big gap may act weird like this. Thus, it is best to avoid taking entry on a chart with a big gap.

Categories
Forex Daily Topic Forex Price-Action Strategies

A Weak Breakout Candle Makes Things Different

In H1 breakout trading, the signal candle’s attributes are as important as the breakout candle. We know that a breakout candle means a lot. So is the breakout confirmation or signal candle. In today’s article, we are going to demonstrate an example of this. Let us get started.

The price after being bearish gets caught within a horizontal channel. However, the last candle comes out as a bearish engulfing candle. It seems that the sellers may take control soon. It all depends on the breakout at the level of support followed by breakout confirmation.

The next candle comes out as a bearish candle as well closing within the level of support. The sellers are to wait longer. On the other hand, the buyers would love to get a bullish reversal right here. The battle is on.

The bear wins. The last candle comes out as a bearish engulfing candle closing well below the level of support. This is what H1 breakout traders want. If the next candle closes well below the breakout candle, the sellers may trigger a short entry.

The next candle comes out as a bearish doji candle. It closes below the breakout candle. The sellers may trigger a short entry. However, this is not an ideal candle showing strong bearish momentum. If a candle like this confirms a breakout, the price may not go towards the take profit level that we would love to see.

After triggering the entry, the chart produces two bullish candles. It looks extremely ominous. Most probably, the entry is going to get us a loss. Taking a loss is a usual thing in the Forex trading. However, the last two candles may be produced because of the fragile confirmation candle. This is where H1 breakout traders shall be a bit careful. If the confirmation candle does not come out as a strong candle, the price may go another way round. Let us find out from the next chart what the price does here.

Oh! It is about to hit the stop loss. It produces a bearish engulfing candle again. The price may head towards the downside and hit take profit level. It is still 50-50 since the price is trading within the level of last swing low. Let us find out how it ends.

Yes, it hits the target at last. However, this is what the price does not usually do when the H1 chart makes a breakout and confirms it. As mentioned, it often happens when the breakout and confirmation candle come out as weak candles. Thus, we may consider this when trading H1 breakout strategy next time.

Categories
Forex Daily Topic Forex Price-Action Strategies

‘Set and Forget’ Tailor Made for H1 Breakout Trading

In today’s article, we are going to demonstrate an example of H1 breakout strategy. It is a typical example of the rule ‘Set and Forget’. To trade on the H1 chart, we must be patient and let the price do its job once we have taken entry. Let us proceed.

The chart shows that the last candle breaches closing below the level of support. As far as the H1 breakout strategy is concerned, traders must wait for the next candle to be bearish closing well below the breakout candle.

The last candle comes out as a bearish candle closing well below the breakout candle. The sellers wait for such candle to confirm a breakout. The sellers may trigger a short entry right after the last candle closes. Stop loss is to be set above where the trend starts and Take Profit is to be set with a 1:1 risk-reward.

The next candle comes out as a bearish candle as well. The sellers must let the price to hit the target. To be precise, they shall not even look at the chart. Stop Loss and Take Profit are set. All they can do is let the price do its job.

Where does that one come from? The chart produces a bullish engulfing candle. It is a strong bullish reversal candle, which may change the trend. To be honest, a candle like this may intimidate any price action trader. Do not forget this is an H1 chart and the entry is taken on H1 breakout strategy. Set and Forget rule comes very handy in this trade setup. Let us assume, we do not even know that the chart produces such a candle. We let the market do its own job.

The next candle comes out as a bearish inside bar. It looks more ominous. If the next candle comes as a bullish engulfing candle, the sellers will be in serious trouble. Let us proceed to the next chart.

The next candle comes out as a doji candle followed by another doji candle. However, the price heads towards Take Profit level and hits the target at last. If we keep looking at such chart, would we be able to hold ourselves back from closing the entry manually? It may get very tough for the traders to hold their nerves with such price action when a trade is running. If a trader trades on the daily or the H4 chart, he may consider closing the entry manually. With the H1 chart trading, traders may not do this. In other words, set and forget when you are trading on the H1 chart.

Categories
Forex Daily Topic Forex Economic Indicators

What Moves the Forex Markets?

Analyzing the Forex Market

There are three ways to interpret the Forex markets: Fundamental Analysis, Technical Analysis, and Sentiment Analysis. But the markets move for just one reason: Supply and demand.
Supply and demand changes slowly or fast, depending on the current economic events, but that change is due to the Sentiment or beliefs of the major operators about what they think are imbalances of the market. That happens when institutional traders believe the current price is not a fair price, and it is due to change in the near or far future. The best strategies combine the tree methods to make the trading decisions, but a trader must always keep in mind the fundamental forces that move the Forex markets.

Fundamental Analysis

Fundamental Analysis deals with the economic and political events and situations that change supply and demand. Among the most important indicators are economic Growth Rates, Inflation, Interest Rates, Government Debt and Spending, Gross Domestic Product, and Unemployment. Fundamental Analysis combines all this information to determine the possible sentiment of the market participants and ultimately forecast the future performance of an asset.

Supply and Demand

Currencies’ prices change primarily driven by supply and demand. If the supply is larger than the demand, the price drops, and if the opposite happens, it goes up. We, as traders, cannot determine if the imbalance of the supply-demand forces is due to hedging, speculation, or monetary conversion. For example, the US dollar moved with strength from 1998 to 2001 when the Internet as the NASDAQ boom drove international investors to participate in the US financial markets in search of high returns. Investors had to buy dollars and sell their local currency, so the Dollar gained strength. At the end of 2001, the political climate changed after the 9/11 event, the stock market fell hard, and the FED started to cut interest rates. Therefore, stock investors moved their capital elsewhere, so they sold the Dollar, and its price dropped.

Capital Flows and Trade Flows

The flows of capital and trade are two major factors in the balance of payments. These two factors quantify the amount of demand for a currency. Common sense tells us that a balance of zero is needed for a currency to hold its value.
A negative number in the balance of payments will indicate that capital is leaving the domestic economy more rapidly than it is entering. Under these circumstances, the currency should move down. The opposite should happen if the balance of payments is positive.
An example of this is the Japanese Yen. Despite the fact of negative interest rates, the Japanese yen has managed to trade mostly moved by its high trade surplus; thus, this currency tends to increase in value. The Japanese government uses a negative interest rate policy and increases the money supply (by printing new money), counteract the inflows of currency coming from the export business to hold the currency’s value to a level not endangering its export business.

The capital flows show a measure of the net amount of currency bought and sold due to capital investments. A positive figure implies that the inflows originated from international investors entering the country exceded those bought by domestic investors abroad.

Physical Flows

Physical flows are originated by foreign investments, directly purchasing real estate, manufacturing facilities, and acquisitions of local firms. These operations require that foreign investors buy dollars and sell their local currency.
Physical flows data are essential, as they show the underlying changes in the physical investment activity. A change in the local laws encouraging foreign investments would boost Physical inflows. That happened in China when it relaxed the laws for foreign investment due to its entry into the World Trade organization in 2001.

Portfolio Inflows

Portfolio inflows measure the capital inflows in the equity and fixed-income markets.

Equity Markets

The Internet and computer technology enabled a greater easy to move fast and easily capitals from one market to another one in the search for profit maximization. A rally in the stock market can be an opportunity for any investor no matter where he lives. If the equity market rises, the money will flow in and drive the local currency up. If it moves down, investors would quit and move their money away.

Fig 1 – US Yields versus Stock Market Cycles

(source: http://estrategiastendencias.blogspot.com/)

The attraction of the equity markets compared to fixed-income markets ( bonds and monetary investments) is growing since the early 90ies. For example, the foreign transactions of US government bods dropped from 10-1 to 2-1.
That can also be verified when we see that the Dow Jones has over 80 percent correlation with the US Dollar Index.

Fig 2 – US Dollar Index and the DOW-30 correlation  (Created using Tradingview)

Fixed Income Markets

Fixed income markets start being appealing in times of global uncertainty due to the perceived safe-haven nature of this type of investment. As a result, countries offering the best returns in fixed income products are more appealing and attract foreign money, which would need to be converted to the country’s money, boosting the demand for this particular currency.
A useful metric to analyze fixed-income flows is the short and long-term yields of the different government bonds. For example, comparing the 10-year US Treasury note yield against the yields on foreign bonds. The reason is that investors tend to move their money to countries offering the highest-yields. Thus, for instance, a rise in yields would signify a boost in the inflow of fixed-income capital, which would push the currency up.
Aside from the US Treasury notes, the Euribor futures or the futures on the Interbank Rate is a good gauge for the expected interest rate in the Eurozone.

Fig 3 – 10-year note yield curves on Industrialized Countries

(from https://talkmarkets.com/)

Trade Flows

Trade flows are needed for import and export transactions. The Trade flows figure is a measure of the country’s trade balance. Countries that are net exporters will show a net surplus. Also, they will experience a rise in the value of their currencies as the result of the exchange transactions, when exporting companies trade the foreign currency for local money, as the local currency is bought more than sold.
Net importer countries will show a negative figure in its trad flow metric, and, since its currency is more often sold than bought will experience a push to the downside.

Economic Surprises

It seems logical that changes in any of the discussed flows would affect the involved currency pair. Traders, though, should focus on economic surprises. That is, data releases that are considerably different from the consensus forecasts. An unexpected figure would shatter the market and likely produce a long-term trend change. The trader should not trade the event itself, but use it to forecast future price trends and plan his short-term trading strategies with the long-term figure in mind.


Reference: Day Trading and Swing Trading the Currency Market, Kathy Lien


Categories
Forex Daily Topic

Soros – The Greatest Trade Ever Made

This is the account of the greatest trade, possibly driven by a masterful fundamental analysis and the power and skills to accomplish it. It was the hard fight of The Quantum Hedge Fund, owned and operated by George Soros, against the Bank of England.

The Underlying Theme

In the late seventies and the eighties, the interest rates were extremely high in Europe due to inflation. I remember my first mortgage had a 13 percent fixed interest during the first year, but it jumped up to 21 percent in the subsequent years. I was basically working for the food and the bank.

In 1979, there was a Franco-German initiative to create a European Monetary System (EMS) to stabilize the exchange rates and reduce inflation, thus, preparing the EU countries for monetary integration. One of the components of the EMS was the Exchange Rate Mechanism (ERM). The ERM obliged the participants to maintain their currencies within ±2.25 percent band of a basket of currencies called the European Currency Unit (ECU).

Initially, the UK was not participating in the EMS. Still, it decided to join in 1990 at a rate of 2.95 Deutsche Marks to the Pound with a fluctuation band of ±6 percent, as the ERM was very successful in taming inflation in all European countries.This stability began to fail following the German reunification that precisely started in 1990.

In the subsequent years, the German government spending sharply increased and forced the Bundesbank to print new Deutsche Marks, which created inflation, and, as a consequence, the Bundesbank raised interest rates. That created a side effect in the form of increased demand for DM from investors, raising the price of this currency. Thus, the rest of the EMS member countries were forced to raise their interest rates to keep their currencies within their pegged agreed band.

At that time, the United Kingdom’s economy was weak, and unemployment was quite high. It would not be advisable under these circumstances to raise interest rates. Thus, it would not be easy for the British government to keep the pegged monetary policy for long, and Soros knew it.

The Trade

Soros, running the Quantum Hedge Fund, bet essentially that the Pound would necessarily depreciate against the Deutsche Mark because the UK would need to devaluate the Pound or leave the Exchange Rate Mechanism (ERM). Thus, in June 1992, Soros made a long position in the Pound and a long position in the Deutsche Mark by borrowing pounds and investing in mark-related instruments. He also established positions in options and futures. His bet totaled over $10 billion. He was not the only one. It was said they were organized as a team, so the combined positions created massive downward pressure on the Pound.

The Bank of England tried to hold the pegged rates at the cost of buying 15 billion pounds with its reserves, but that was at the expense of less “fuel” for the real economy. Even the effectiveness of that measure was limited, as the Pound kept trading very close to the lower band limit.

Then, on September 16, 1992, the BoE announced a 2 percent interest rate increase, from 10 percent to 12 percent, attempting to boost the currency. And the next day, BoE Governor promised to raise them again to 15 percent. That was aimed at forcing short-positioned investors to close their trades and free the Pound from their claws, but that was not enough, and traders kept selling the Pound, while the BoE kept buying it.

Finally, at 7:00 p.m. of September 17, Chancellor Norman Lamont announced The UK would leave the ERM, and the rated would be back to 10 percent. That day, also known as “Black Wednesday,” saw the beginning of a severe depreciation of the British Pound over the next three weeks – 14% against the Deutsche Mark and 24% against the Dollar.

Fig 1 – The GBP/DEM Exchange rate  (source: here)

The Aftermath

The quantum Fund cashed in over two billion dollars by selling the Mark-related assets and closing its positions in the Pound. Soros became known as “the man who broke the Bank of England.” During that combined attack, the Bank of England spent 50 billion dollars defending the currency rate.

The success of this trade against the Pound gave fuel to the Quantum Fund and friends to attack other euro currencies. One by one, the Lira, the Spanish Peseta, fell under the attack of this trading group. After the Peseta dropped by 30 percent against the Dollar, also leaving the ERM, The German Bundesbank had to cut its interest rates to help stabilize the European currency markets.


—-
Taken from Day Trading and Swing Trading the Currency Market, Kathy Lien and some facts from old news articles.

Categories
Forex Daily Topic Forex Price-Action Strategies

Look for Such Price Action to Trade on the ABC Pattern

In today’s lesson, we are going to demonstrate an example of the ABC pattern trading. The trend-initiating candle comes out as a bullish engulfing candle followed by a bullish breakout. The price then makes a bearish correction and makes a bullish move upon producing a bullish reversal candle at a flipped support. Let us demonstrate with the charts how it happens.

The price has been bearish, but it has produced a bullish engulfing candle at the support zone. The buyers are to wait for the price to head towards the North and make a bullish breakout at the last swing high. Let us proceed to the next chart.

The price makes a breakout at the nearest swing high. The buyers are to wait for consolidation or correction and a bullish breakout. The last candle comes out as a strong bullish candle as well. It may keep going towards the North. Let us wait and find out what it does next.

It starts having a correction. Then, it produces a bearish inside bar followed by two more bearish candles. The price is at the flipped support. The buyers are to keep their eyes on this chart very closely.

Here it comes. The chart produces a bullish reversal candle. Do not miss the point that the level is the breakout level when the price heads towards the North. Such level is very significant as far as the ABC pattern trading is concerned.

The price makes a bullish breakout again and produces a new higher high. Traders may trigger a long entry right after the last candle closes by setting stop loss below the level of flipped support. It usually provides at least 1:1 risk-reward, which is the safest option. Let us proceed to the next chart to find out how it goes.

The price heads towards the North as expected. It hits the target (1R) with ease. The chart suggests that it may go towards the North further. Anyway, the ABC pattern traders shall enjoy their profit and hunt for the next one somewhere else.

In this example, we have seen that four aspects of the ABC pattern trading such trend initiating candle, breakout, reversal candle at the breakout level, and the signal candle get 10 on 10. Consequently, the price heads towards the desired direction with good momentum. If any of them fails to get 10 on 10, the trade may not go, exactly we would love to see it go. To keep excellent trading consistency, try your best to trade the ABC pattern on such price action that we have demonstrated today.

Categories
Forex Daily Topic Forex Price-Action Strategies

Trading on the Daily Chart More Rewarding Than It Looks

Trading on the daily chart is very rewarding as well as hassle-free comparing to intraday trading. Trade management is different since it allows enough time for the traders to make a decision about their positions. This often allows the traders to earn more pips. In today’s article, we are going to demonstrate an example of price action trading on the daily chart, which allows the traders to hunt some extra pips. We find out how traders do it.

This is a daily chart. It shows that after being bullish for seven trading days, it produces a bearish engulfing candle. The Bearish engulfing pattern is one of the strongest bearish reversal patterns. The sellers are to wait for the price to consolidate and give them a level of resistance where they set Stop Loss above to ensure better risk-reward.

This is what the sellers want to see. The chart produces a bullish inside bar, which states that the sellers may take over the control upon getting another bearish engulfing candle closing below the level of support.

Look at the last candle. It comes out as a bearish engulfing candle closing below the level of consolidation support. The sellers may trigger a short entry right after the candle closes by setting the stop loss above the highest high of the signal candle. To set take profit, some traders may close the trade manually upon getting a bullish reversal candle; some may set at 1:1 risk-reward; some may set at the last significant lowest low. It depends on traders’ psychology and with the strategy (in terms of taking profit) they feel comfortable with.

The price consolidates with one more candle after triggering the entry. However, the price hits the target, which is set at the level of the significant lowest low. As mentioned, some traders may keep holding the position since the price is still with the bear. Let us proceed to the next chart and find out what the price does in the next candle.

It makes a breakout as well. The sellers holding the position may dream big. It seems the price may keep heading towards the South further. This is the good thing about trading on the daily chart. Traders get enough time to decide about their positions. They get 1:1 risk-reward in almost every trade. If they understand daily price action well and get well acquainted with daily trading, it usually gets them very lucrative risk-reward. Imagine, if traders want to manage trade like this on the H4 or the H1 chart, how painful it could be. Moreover, the H4 or the H1 chart is not as consistent as the daily chart. In our fore coming articles, we will demonstrate more examples of how we can maximize our profit by trading on the daily chart. Stay tuned.

Categories
Forex Daily Topic Forex Videos

Protect Your Assets During The Coronavirus outbreak – Whats About To Happen In Forex & Crypto


How to guard your financial assets against the Coronavirus outbreak

The ink is still dry on the United States and China phase one trade deal agreement, and already China’s commitment to purchase goods has been very unexpectedly hampered by the Coronavirus outbreak.


With 56 million people under lockdown in China, because isolation and quarantine is the best way to try and prevent the spread of the deadly virus, it poses difficulties for China to import and export goods, so long as their country is in a stranglehold situation.

Similar to the SARS virus, which also started in China and lasted from November 2002 to July 2003 and which caused 800 deaths while reaching over 30 countries, the Coronavirus is an unknown entity in terms of its potential mortality rate and therefore nobody knows how long this new contagion will continue to grow and accelerate in China. It is possible that it could cause a pandemic across the world. But at this stage, it is difficult to say how it will impact on global economics in the medium term. Certainly, the longer he goes on, the more of an impact it will have on the gross domestic product of China and all of the countries that it does business with.


It is important to say at this point, that the thoughts and prayers all of us here at Forex Academy go out to all of those people who are and will be affected by the virus. And the thought of trying to take advantage of this terrible situation and make money when people are suffering and dying is absolutely crass. However, those of you who are currently in trades that could be affected by this outbreak have a right to know how to protect yourself while this awful situation continues.
Firstly, as mentioned earlier, this will likely affect the gross domestic product of those countries who do business with China and, of course, China itself. Therefore we might expect that stock indices across the globe may come under continued selling pressure. Recent record highs of some are already well off their highs. And those countries which are heavily reliant on exporting goods and services to China will also be affected by their currency rates falling. But not in all cases!
So let’s take a look at what might happen the longer that this goes on. This is considered to be a Risk-off event, where investors will diversify from risky assets and move to ‘A’ rated bonds and Treasuries, gold, cash, and other safe-haven assets.


For example, Australia and New Zealand, whose GDP is heavily dependent on their exports into China, may find that their currencies come under selling pressure. While countries such as Japan and Switzerland find that their currencies’ grow stronger due to their safe-haven status, and although bitcoin is off its recent highs and is considered to be in a slight downward channel at the moment, investors might be sitting on the sidelines waiting for opportunities to buy this asset.

With the United Kingdom due to leave the European Union this week we might see the pound find volatile ground due to the uncertainty pertaining to the pressures of completing a trade deal within the next 10-months with the European Union or face the possibility of crashing out of the euro area with no deal after the transition period ends in December 2020. The virus situation could cause pressure on the pound as the market looks at the overall risk sentiment.

The Euro has also come under selling pressure recently mostly due to bad economic data and a dovish stance taken by Ms. Christine Legarde, president of the European Central Bank, whose recent comments put the Euro on the back foot.

All of this can only mean one thing for the US dollar: its directional bias will be to the upside.

Categories
Forex Daily Topic Forex Price-Action Strategies

Taking Partial Profits: an Alternative if You are Too Defensive

In today’s article, we are going to demonstrate an example of the daily-H4 chart-combination price-action trading. The signal candle comes out as a strong bearish candle, which attributes have a lot to offer to the sellers. Let us find out how it ends.

This is a daily chart. The last candle comes out as a bearish engulfing candle. The daily-H4 combination traders are to flip over to the H4 chart for the price to consolidate and produce a bearish reversal candle to offer them a short entry below the consolidation level of support.

This is the H4 chart. The price consolidated earlier before producing that daily bearish reversal candle. Traders must wait for consolidation and a bearish candle from now. It produces two bearish candles consecutively. It may consolidate soon.

It produces one more bearish candle and starts having a correction instead of consolidation. It is less likely that the chart presents a bearish engulfing candle breaching the level of support. We shall never be certain, though, since it is the Forex market. Let us see what happens next.

Would you believe it? What a good-looking bearish engulfing candle that is! The sellers may trigger a short entry right after the candle closes by setting stop-loss above the level where it has a rejection. Such price action offers 1:1 risk-reward easily. Considering the signal candle, the price may go towards the South further and get more reward to the sellers.

The chart produces a bullish inside bar and heads towards the South again. The last candle comes out as a bearish Marubozu candle. The sellers must hold the trade to make a handful of pips.

The price heads towards the South for one more candle. However, it produces three consecutive bullish reversal candles. The last one comes out as a bullish pin bar. The price is still to cover a lot of space to get us 1:1 risk-reward. By looking at the price action for the last three candles, it seems that the price may have an upside correction before making the next bearish move. It may even change its trend as well. It is best to have a belief in our positions and hold it as long as we can. In other words, we shall remember the rule ‘set and forget.’ However, if the price produces too many reversal candles and strong reversal candle such as pinbar, truck rail, or engulfing candle, we may consider taking a partial profit.

In such cases, taking a partial profit comes handy. We may take out at least 50% profit and let the rest of it run. Even if the trend changes, we do not lose money. On the other hand, if it goes towards our desired direction, it gets us more profit.

Categories
Forex Daily Topic Forex Price-Action Strategies

High Impact News Events and Risk Management

In today’s lesson, we are going to demonstrate an example of price action trading on the daily chart. The lesson has a message if a high impact news event comes in between, what daily traders should do?. Let us get started.

This is EURJPY daily chart. The chart produces a bullish engulfing candle, which suggests that the buyers may dominate in the pair. Traders on different time frames may get themselves ready to go long on the pair. Traders who trade on the daily chart, they are to wait for the price to consolidate and produce a bullish reversal candle to go long on the pair. Let us proceed to the next chart.

The pair produces another bullish candle before creating the corrective candle. It means the buyers on the H4, H1, or 15M may have found some entries and drove the price towards the North last day. Anyway, the daily traders may keep an eye on the pair to go long upon a bullish engulfing candle closing above the last candle’s highest high.

Here it comes. A bullish engulfing candle closes above the daily resistance. The buyers may trigger a long entry right after the candle closes by setting stop loss below the candle’s lowest low. The nearest significant swing high is quite far away. It offers a tremendous reward considering the risk.

The price heads towards the North for one more candle. However, it does not get as bullish as expected. The good thing is it is a bullish candle. The buyers must hold the trade at least up to the level, which offers 1:1 risk-reward.

The pair produces a doji candle. The price hits the level, which offers 1:1 risk-reward. Then, it ends up producing a candle, which neither a bullish nor a bearish candle. Technically, the buyers shall take out at least 50% profit and let the rest of it run. As far as the price action is concerned, the price still may go towards the North further. I may give you information that this is the Wednesday market dated 11/09/2019. Here I have something interesting to show you before we start Thursday trading.

Source: Forex Factory

The pair we are dealing with here is EURJPY. Look at those news events with the EURO. The EURO pairs are to ride on a roller coaster on such news days. Let us not guess, but have a look at the daily chart to find out how it looks.

The price goes towards the trend’s direction. Do not miss the lower spike. You can see that it hits the stop loss. It is painful, but this is how the Forex market is. Thus, traders must take extra care of their positions before such high-impact news event. Otherwise, they may lose their hard-earned profit by getting hit such high impact news events.