Categories
Forex Elliott Wave Forex Market Analysis

USDJPY: Be Ready for this Flag Pattern Breakout

The USDJPY pair presents the breakout of a flag pattern corresponding to the third wave of Subminuette degree identified in green, triggered after the flag pattern breakout observed in Wednesday 26th session. Examine with us what’s next for the coming trading sessions.

Our Previous Analysis

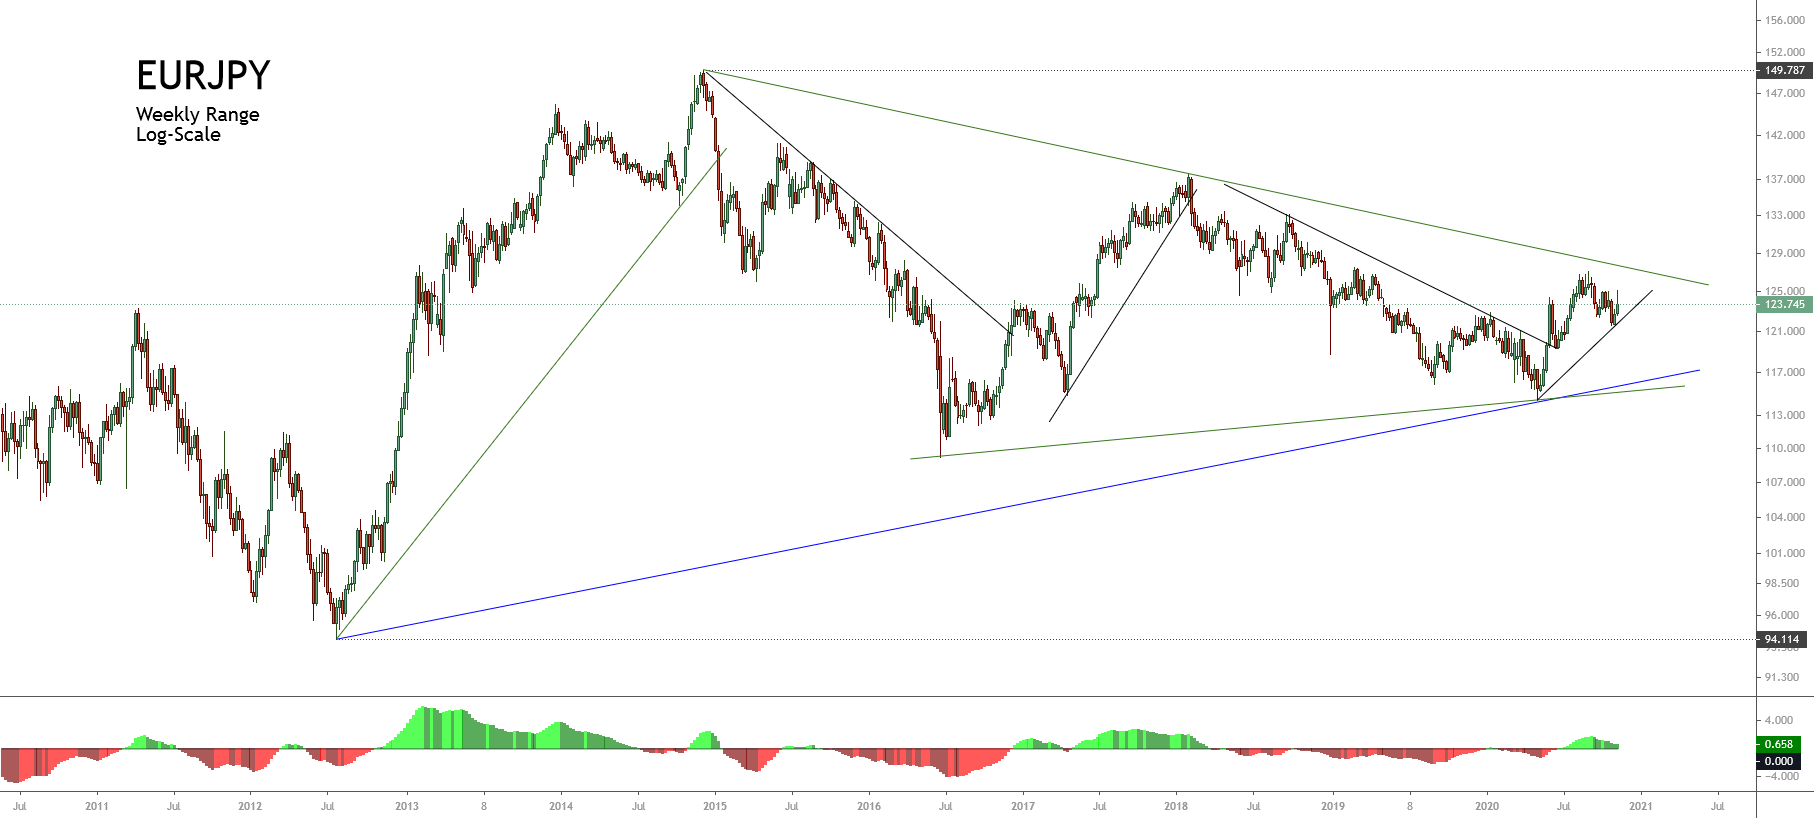
Our previous Elliott wave analysis of the USDJPY pair commented on the complex corrective formation developed by USDJPY since the price topped at 111.715 in March 2020. Also, we recognized the internal structure as an incomplete triple-three pattern. 

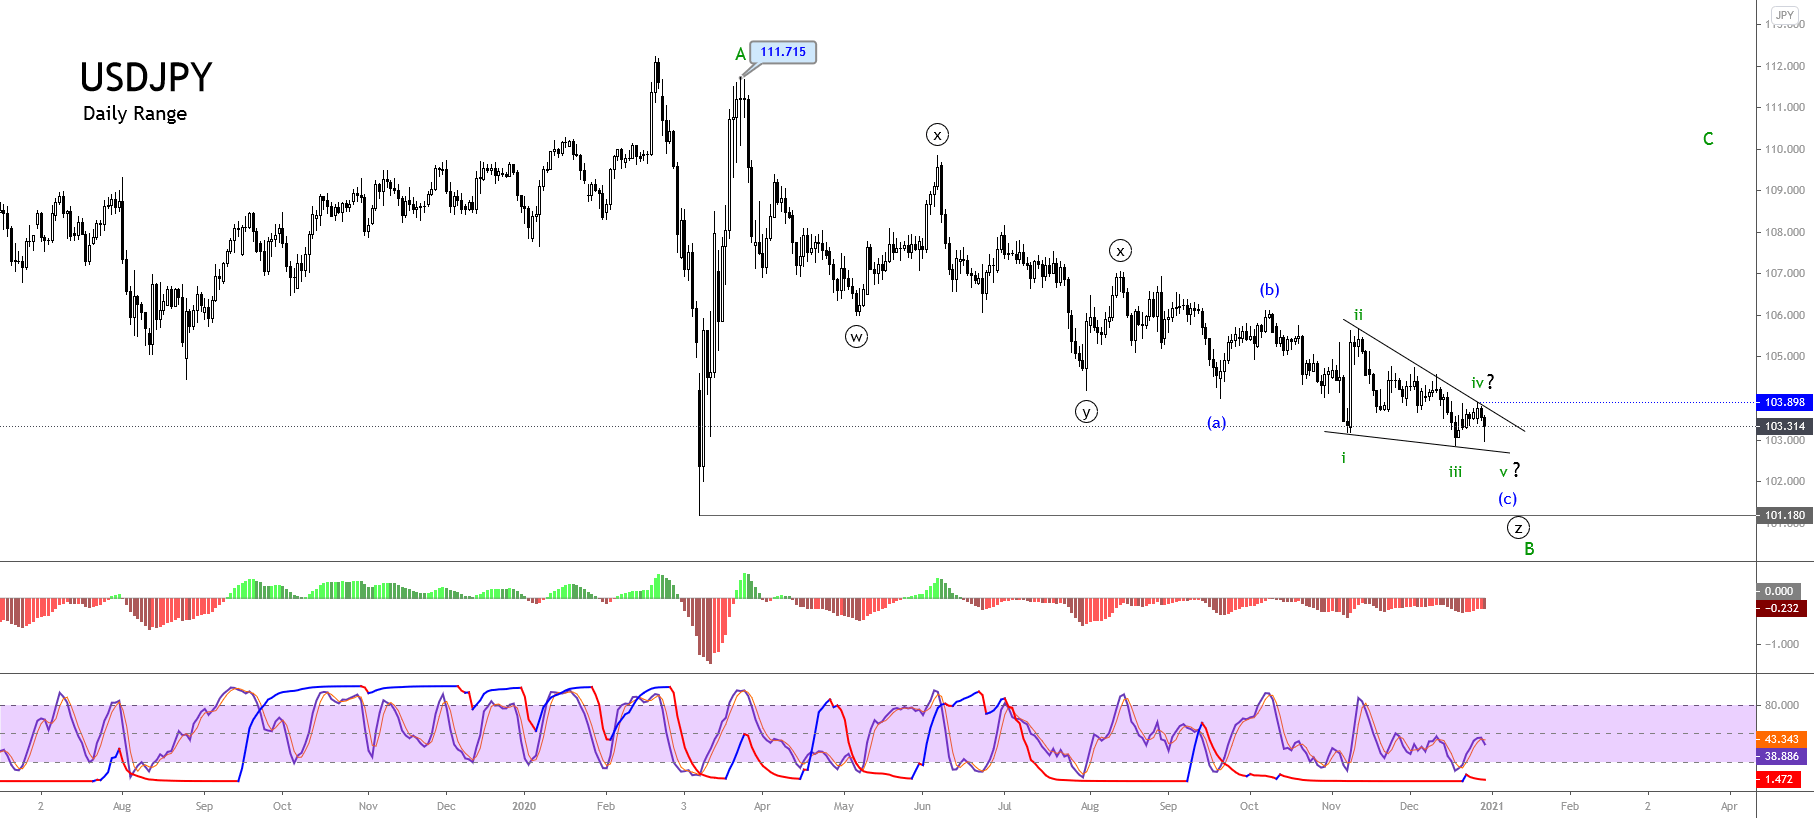
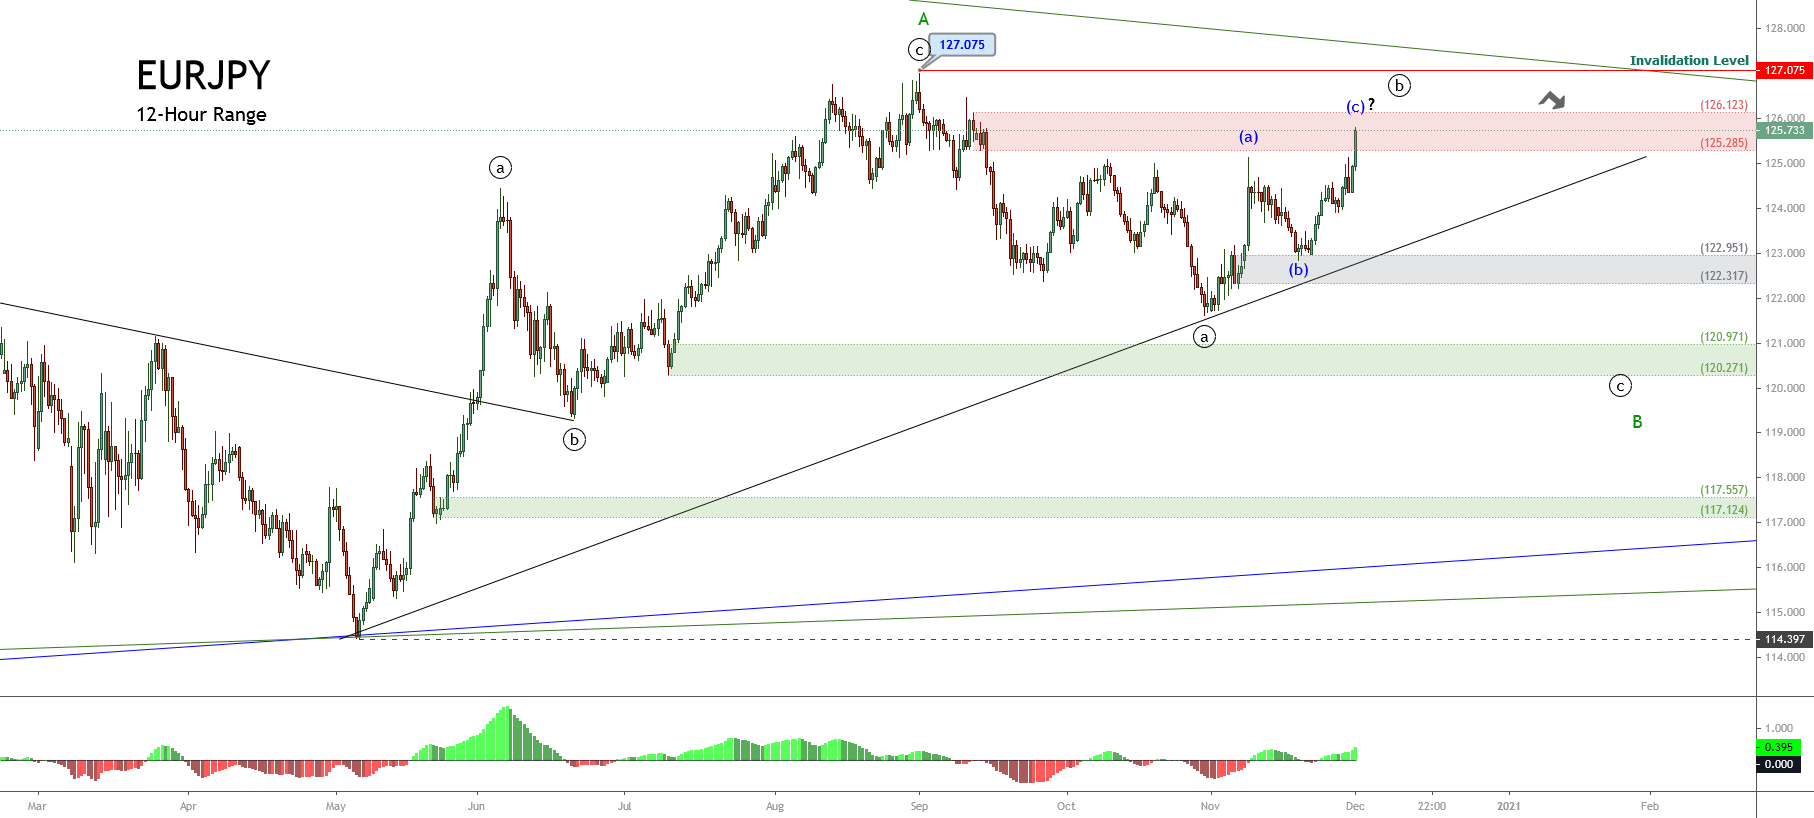
As illustrated in the previous daily chart released in late December 2020, the USDJPY pair moved in an incomplete wave (c) of Minuette degree labeled in blue. Likewise, the lower degree sequence revealed the progress in an ending diagonal pattern, suggesting the corrective formation’s exhaustion, which belongs to wave B of Minor degree in green.

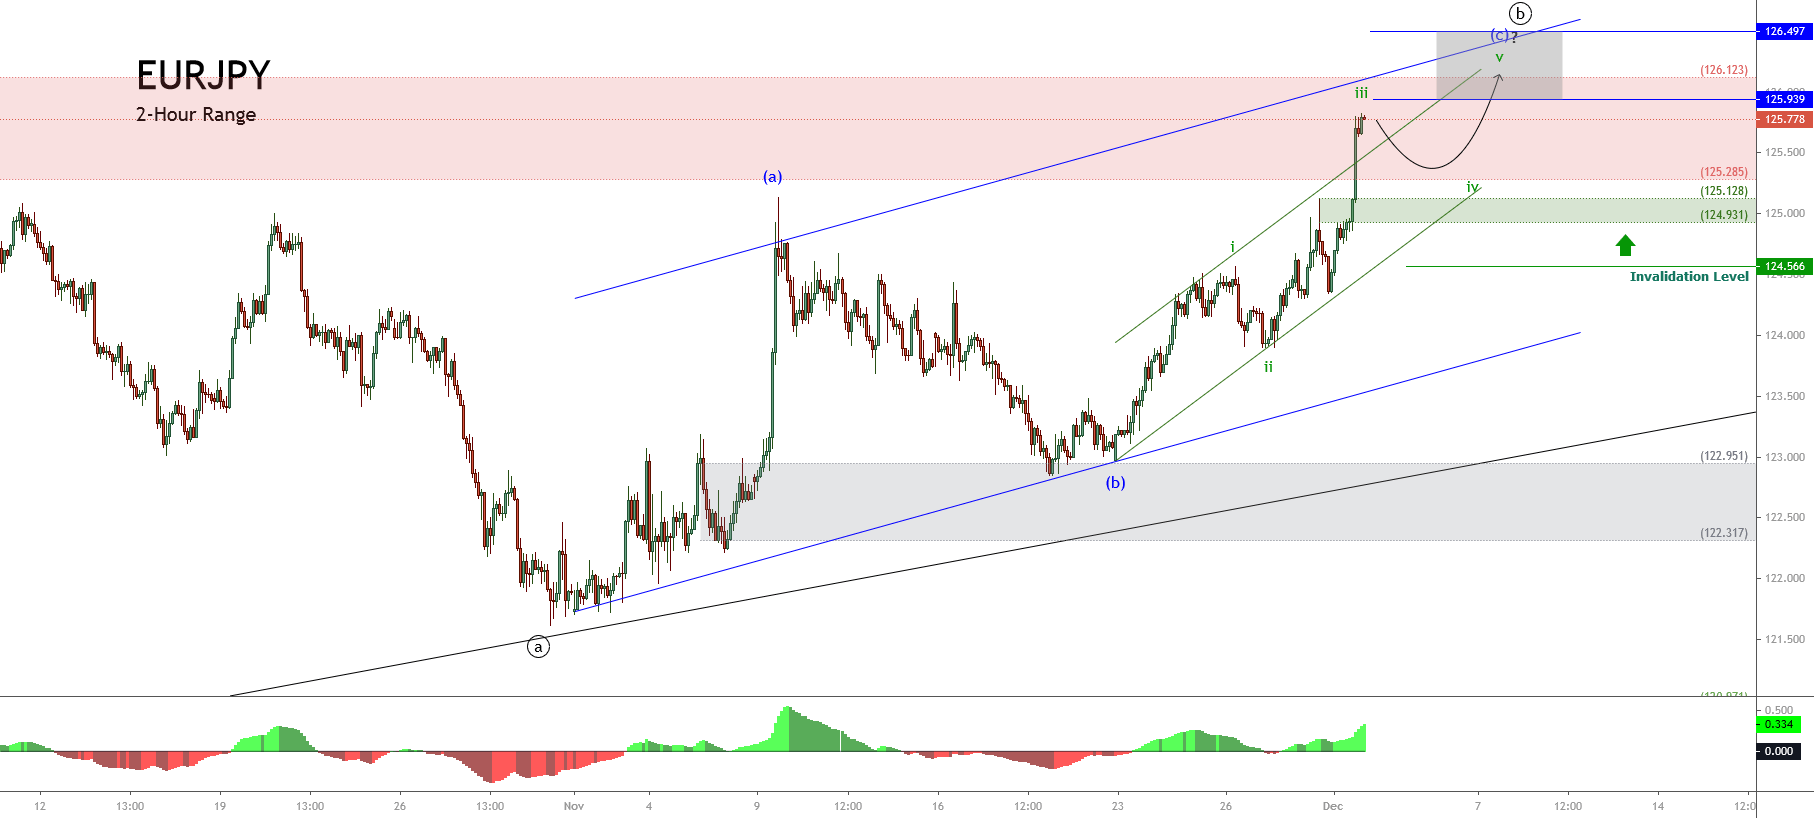
Likewise, the breakout of the trendline that connects the end of waves ii and iv of Subminuette degree labeled in green would confirm the end of wave B of Minor degree. In this context, once the USDJPY surpassed the upper-line of the ending diagonal pattern, the pair confirmed the end of wave B and the beginning of wave C of the same degree.

What’s Next?

The USDJPY surpassing the upper guideline of the ending diagonal pattern on January 07th confirmed the completion of wave B of Minor degree and the beginning of wave C of the same degree.

In this context, the first breakout the USDJPY formed in early January corresponds to wave i in green. Likewise, the consolidation sequence recognized as a flag pattern corresponds to wave ii. Both waves belong to wave C of Minor degree labeled in green.

The last breakout developed by the USDJPY activates wave iii that belongs to wave C in green. Its potential advance could strike the psychological barrier of level 106.

Summarizing, the mid-term Elliott wave view for the USDJPY pair suggests that the price action may advance in its wave iii of Subminuette degree, which belongs to the first segment of the internal structure of wave C of Minor degree identified in green. The upward wave iii in progress could exceed the psychological barrier of 106. It even could strike the supply zone between 106.561 and 107.050. Finally, the bullish scenario’s invalidation level is at the beginning of wave i in green, at 102.591.

Categories
Forex Elliott Wave Forex Market Analysis

USDCHF: Examine These Three Charts Before Taking any Trade


Last week, the USDCHF pair developed a sideways movement pattern that looks like an inverted head and shoulder pattern. However, the primary mid-term trend remains dominated by bearish sentiment. Examine with us these three charts to help you foresee the pair’s potential movements in the coming sessions.

Inverted Head and Shoulder Pattern?

The USDCHF pair illustrated in the following 12-hour chart seems to develop a sideways formation after the accelerated decline observed during the second half of November 2020. After easing from the psychological support of 0.89, the price began to consolidate in a range between 0.8917 and 0.8757.

In the previous chart, the USDCHF seems to be forming an inverse head and shoulder (iH&S) pattern, suggesting a likely bullish reversal movement. According to chartist analysis, the iH&S formation will be confirmed if the price breaks and closes above the neckline located at 0.89171. 

For this reversal scenario, the invalidation level is located below the head, which holds its lowest level at 0.87576, corresponding to the low touched last January 06th.

Elliott Wave View Suggests Exhaustion

The big picture of the USDCHF pair exposed in its daily chart reveals the incomplete bearish impulsive sequence of Minute degree labeled in black, suggesting a limited decline.

As illustrated in the last chart, the USDCHF began a downward impulsive sequence of Minute degree on March 23rd when the price found fresh sellers at 0.99017. The price action reveals the completion of its third extended wave bearish move, which found support at 0.89986 in late August 2020, starting to advance mostly sideways in its wave ((iv)) in black. 

Once the sideways corrective formation corresponding to the fourth wave in black finished, the pair began to continue its declines in the wave ((v)) of Minute degree, which currently seems developing its wave (iv) of Minuette degree identified in blue. 

On the other hand, the timing and momentum oscillator reveals that the bearish pressure still controls the price action. In this context, the price would see a further decline, confirming Elliott Wave’s outlook of a pending fifth wave of Minuette degree.

This bearish continuation scenario’s invalidation level stays at 0.8979, which corresponds to the end of wave (i).

Price Action Reveals Indecision

The USDCHF pair in its daily chart unfolded in the bellow chart shows an indecision candle corresponding to the last Friday’s session, leaving a narrow body and long-tailed candlestick pattern. This market context carries us to expect a pause in the downward movement developed in previous trading sessions.

The confirmation of the bearish scenario will occur if the price closes below the LOD at 0.88385. Conversely, a reversal signal could be established by a Monday 25th session’s close if it exceeds Friday’s high of 0.88662.

In summary, the USDCHF pair develops a sideways formation that looks like an incomplete inverse head and shoulders pattern suggesting the potential bullish reversal sequence if the price soars above the neckline located at 0.89171. However, the Elliott wave outlook suggests further declines, corresponding to a possible wave (v) of Minuette degree labeled in blue. In this context, the price action reveals the indecision of the next direction. If the price decides to continue its decline, the USDCHF could re-test January’s 06 low zone.

Categories
Forex Elliott Wave Forex Technical Analysis

Three Things you Ought to Know Before Buying EURUSD

The EURUSD eased the last trading week, losing 1.18%, leaving away from the yearly high at 1.23495 reached on last January 06th. The common currency accumulates losses by 1.14% (YTD), which, added to other market conditions commented in our current analysis, carries us to expect further declines in the following trading sessions.  

1. Retail Traders Seems to Look for Long Positions

Retail traders tend to place their trades against the primary trend, remaining on the wrong side on most occasions. Regarding this market participant behavior context, retail traders reduced their short positions from 79.77% reached last January 06th to 44% last Friday’s session, as the EURUSD pair accelerated its decline. 

Source: myfxbook.com

Retail traders’ increasing positioning to the long-side carries us to sustain the prospect for further declines in the following trading sessions.

2. The Price Violated its Short-Term Upward Trendline

The big picture of EURUSD illustrated in its daily chart reveals the violation of the secondary trendline plotted in green, corresponding to the last rally developed by the common currency since November 04th from the 1.16025 level, which found resistance on January 06th at 1.23495. This market context leads us to observe that the price could develop a correction proportional to the last rally.

In this regard, the Dow Theory view suggests that EURUSD’s corrective move depth might lie between 33% (1.21030) and 66% (1.18565). Moreover, the price could find support in the long-term upward trendline plotted in blue.

3. Timing and Momentum Oscillator Supports the Elliott Wave View.

The intraday Elliott wave view for the EURUSD pair exposed in the next 4-hour chart shows the completion of an ending diagonal pattern corresponding to wave (v) of Minuette degree labeled in blue and its bearish reaction after its finalization.

Once the common currency topped at 1.23495, the price developed an intraday corrective move subdivided into five internal segments of Subminuette degree identified in green. This five-wave sequence of lesser degree carries us to expect the progress in a potential zigzag pattern (5-3-5). 

On the other hand, the timing and momentum oscillator lead us to observe the first downward sequence’s exhaustion corresponding to wave (a) in blue. In consequence, the common currency should develop a corrective rally corresponding to wave (b). This upward move could hit the zone between 1.21576 and 1.22523.

Once the EURUSD completes its wave (b) in blue, the price action should start its bearish wave (c), which follows an internal structure subdivided into five waves. In this context, the bearish scenario’s invalidation level can be found at the end of wave (v) at 1.23495.

What’s Next?

According to Myfxbook.com’s Community Outlook, 56% of retail EURUSD traders are positioned to the long side. Likewise, the violation of a short-term upward trendline carries to expect further declines in the common currency for the coming trading sessions. Nevertheless, the EURUSD could be at the end of the first segment of a corrective formation. In this context, the price could develop an upward bounce that could reach the zone between 1.21579 and 1.22523. After the bounce conclusion, the common currency could find fresh sellers expecting to join a new downward sequence corresponding to wave (c).

If you are interested in finding trading opportunities using the Elliott Wave Principle, follow our Forex.Academy Educational Section.

Categories
Forex Elliott Wave Forex Market Analysis

Why GBPJPY Plummeted in Friday’s Session?

The GBPJPY cross declined on Friday trading session dragged 0.70% after the price surpassed the psychological barrier of 142, being the highest level reached since early September 2020.

Technical Overview

The GBPJPY cross drops over 100 pips on the last trading session of the week, accumulating a modest advance of 0.02% (YTD) since the yearly opening.

On the fundamental side, the industrial production in the United Kingdom eased 4.7% (YoY) in November 2020, informed the Office for National Statistics on Friday. The reading is worse than the decline of 4.2% expected by analysts. Likewise, both coronavirus lockdown and the Brexit uncertainty contributed to the decline in the industrial output.

Source: TradingEconomics.com

On the other hand, the doubts in the fourth quarter 2020 earnings season kick-off and the elected U.S. President Biden’s stimulus plan seem not enough to keep fueling the stock market participants’ euphoric sentiment. This context looks fading the record highs in the stock market, boosting the risk-off bias pushing lower the GBPJPY cross.

The big-picture illustrated in the next daily chart shows the price action moving in the extreme bullish sentiment where the cross ended the Friday session unveiling a bearish engulfing pattern, which carries to expect further declines in the coming trading sessions.

Finally, the piercing below the yearly opening level at 140.779 suggests potential declines during the first quarter of 2021.

Technical Outlook

Our previous analysis saw the progress in a complex correction identified as a double-three pattern (3-3-3). Nevertheless, the corrective rally suggests that the GBPJPY moves in a triple-three formation (3-3-3-3-3), which looks in its terminal stage.

The following 4-hour chart shows the completion of a triple-three pattern of Minute degree labeled in black, which moves inside a wave B of Minor degree identified in green since the cross found support at 133.040 touched in last September 22nd.

The internal structure of wave ((z)) in black shows its last corrective leg corresponding to wave (c) in blue, developing an ending diagonal pattern, which seems finished its wave v of Subminuette degree labeled in green. The breakdown of the guideline that connects the end of waves ii with iv carries to support the ending diagonal pattern’s finalization.

On the other hand, the timing indicator exposes the intraday oversold (see the yellow circle), which leads to the conclusion that the GBPJPY cross should develop an upward retracement as a flag pattern before continuing with its potential further decline.

In summary, the GBPJPY cross plummeted in last Friday’s session dragged by the completion of an ending diagonal pattern, which belongs to wave ((z)) of a triple-three formation, where its upper degree sequence corresponds to wave B of Minor degree. Although the news media continue supporting hopes in the stimulus plan for the U.S. economy, the Elliott wave structure showed by the cross unveils a different story.

According to the Elliott wave theory, the price should develop a downward wave C of Minor degree. The timing oscillator also suggests an intraday upward consolidation likely as a flag pattern before continuing its drops.

If you are interested in expanding your knowledge about the Elliott wave theory from the basics to advanced, visit our Forex.Academy Educational Section.

Categories
Forex Elliott Wave Forex Market Analysis

EURAUD Under Bearish Pressure, What’s ahead?

The EURAUD cross is advancing in its incomplete third wave from a mid-term downward sequence that remains in play. Follow with us on what the Elliott wave theory tells about its next movement.

Technical Overview 

The big picture of the EURAUD cross unveiled in the following 12-hour chart exposes the price action moving in the extreme bearish sentiment zone during the second week of the year. However, both the acceleration and oversold could suggest the exhaustion of the bear market.

The following 12-hour chart exposes the market participants’ sentiment, unfolded by the 90-day high and low range. The figure reveals the institutional activity pushing the cross in the extreme bearish zone and consolidating under the yearly opening price at 1.58763.

On the other hand, the EMA(60) to Close Index recently pierced the -0.0300 level. This reading suggests both the oversold and the exhaustion of its accelerated downtrend identified with the black trend-line.

In this context, the accelerated downward trend-line breakout and the close above yearly opening price should warn about potential recoveries in the EURAUD cross.

Technical Outlook

The short-term Elliott wave outlook for the EURAUD cross unfolded in the 8-hour chart reveals the progress of an incomplete bearish impulsive wave of Minuette degree labeled in blue, suggesting further drops.

The previous chart illustrates the downward sequence that began on October 20th when the cross found fresh sellers at 1.68273 and started a bearish structural series of Minute degree labeled in black, which currently could be in its wave ((c)) or ((iii)). The internal structure seems developing its wave (iii) of Minuette degree identified in blue. 

The wave (iii) potential bearish target can be found between 1.56175 and 1.55359, which coincides with the descending channel’s base-line. Once the price tests the possible target area, the market participants could carry up the EURAUD cross toward the short-term descending channel’s upper line.

Regarding the wave (iv) in blue, considering the alternation principle, as wave (ii) is a simple corrective formation in price and time, wave (iv) should be complex and should last longer than wave (ii).

On the other hand, both the trend indicator and the timing plus momentum oscillator remain, supporting the bearish bias. Each rally could represent an opportunity to add positions to the bearish side.

In summary, the EURAUD cross continues in the extreme bearish sentiment zone advancing in an incomplete downward sequence, which could find support in the potential target zone between 1.56175 and 1.55539. Once the price finds support, the cross could start to bounce toward the upper line of its short-term descending channel. Finally, the bearish scenario analyzed will be invalid if the price soars above 1.60416, corresponding to the end of wave (i) in blue.

Categories
Forex Elliott Wave Forex Market Analysis

Is US Dollar Index Ready for a Rally?

The US Dollar Index reveals exhaustion signals of its bearish trend. A trend that remains in progress since the currency basket topped at 102.992 pm mid-March 2020. Follow with us what signs show the Greenback to expect a rally during the first quarter of the year.

Technical Overview

The big picture of the US Dollar Index (DXY) illustrated in the next weekly chart reveals the downtrend that remains active since the price found fresh sellers at 102.992 in mid-March 2020. The following figure also exposes the market participants’ sentiment represented by the 52-week high and low range.

The previous figure shows the extreme bearish sentiment dominating the big participants’ bias since mid-March 2020. Nevertheless, the long-tailed candlestick corresponding to the last trading week that was closed above the yearly opening, suggests the bearish trend’s exhaustion in progress.

On the other hand, the reading -4.26 observed in the EMA(52) to Close Index suggests the currency basket is oversold; thus, a potential corrective rally could occur in the coming weeks.

The mid-term Elliott wave view of the US Dollar Index exposed in the next 8-hour chart suggests completing an extended third wave of Minute degree labeled in black, when the price found support at 89.209 on January 06th.

Once the price found support, the price started to bounce, developing an incomplete wave (a) of Minuette degree identified in blue, which belongs to wave ((iv)) in black. Finally, the momentum and timing oscillator suggests that the bearish pressure persists, and the current upward movement could correspond to a corrective rally.

Technical Outlook

The mid-term outlook for the US Dollar Index unfolded in the next 8-hour chart shows the incomplete wave ((iv)) in black, which advances in wave (a) identified in blue. In this context, the current climb experienced by the Greenback could be a corrective rally.

According to Elliott Wave theory, the fourth wave in progress could retrace to 50% of wave ((iii)),  and reach 91.205. Likewise, considering that the second wave was a simple correction in terms of price and time, the current fourth wave should be complex in terms of price, time, or both. 

On the other hand, if the price extends beyond 50%, this could indicate weakness in the bearish pressure. If the price action advances above 92.107, the bearish scenario will be invalidated leading us to expect more upward movement.

In summary

The US Dollar Index completed a bearish third wave of Minute degree at 89.209 on January 06th, when it began to bounce, starting an upward corrective rally that remains in progress. The current intraday movement could reach 91.206 where the price could complete its wave (a) of Minuette degree labeled in blue. On the other hand, considering the alternation principle, the current corrective formation, the structure should be complex in terms of price, time, or both. Finally, the bearish scenario’s invalidation level locates at 92.107, corresponding to the end of wave ((i)) in black.

Categories
Forex Elliott Wave Forex Market Analysis

USDCAD Bullish Divergence in a Complex Corrective Formation; What’s next?

The big picture of the USDCAD pair shows a bullish divergence suggesting the exhaustion of the current bearish trend that remains active since past March 2020 when the price topped at 1.46674 and began to decline in a complex corrective pattern. Follow with us what’s next for Lonnie.

Technical Overview

The long-term Elliott wave view of the USDCAD pair unfolded in its 2-day chart and log-scale, illustrates a downward movement that began on the second half of March 2020 when the price found fresh sellers at level 1.46674. Once the price topped, the Lonnie started to decline in a complex corrective formation identified as a double-three pattern (3-3-3) of Minor degree labeled in green.

According to the textbook, the double-three pattern characterizes itself by following an internal sequence subdivided into 3-3-3, each “three” a complete corrective formation. In this regard, the previous figure shows the price action moving in the third segment of the double-tree pattern corresponding to its wave Y. Also, the lower degree structural sequence reveals the progress in its wave ((c)) of Minute degree identified in black.

On the other hand, the technical indicators support the bearish bias that dominates the downtrend, persisting since March 2020. Both the trend and the momentum oscillators confirm the downtrend in progress. Nevertheless, the timing oscillator shows a bullish divergence plotted in green. This reading suggests the exhaustion of the bearish trend. In this context, the candlesticks formations observed in the last chart remains weighting declines over rallies.

Technical Outlook

The short-term outlook for USDCAD exposed in the next 8-hour chart reveals the incomplete downward advance corresponding to wave ((c)) of Minute degree identified in black, suggesting a potential new decline.

The figure illustrates the downward channel in play that connects the extremes of waves (i)-(iii) and (ii)-(iv) Minuette degree identified in blue. The Elliott Wave theory suggests that the penetration below the base-line between waves (i) and (iii) could reveal the end of wave (v). In this regard, a potential new decline could strike the area bounded between 1.2585 and 1.2425. Likewise, the gap between momentum and timing oscillators supports the likely additional downward move in the USDCAD pair. 

In summary, the USDCAD advances in a downward complex corrective sequence identified as a double-three pattern of Minor degree, which looks running in its wave Y. Simultaneously, the internal structure reveals the progress in its wave ((c)) of Minute degree, which could see a new drop to the potential target area between 1.2585 and 1.2425. Finally, the bearish scenario will invalidate if the price soars and closes above 1.27980.

Categories
Forex Elliott Wave Forex Market Analysis

GBPCAD Triangle Pattern Completion. What’s Next?

The GBPCAD cross shows the completion of an Elliott wave triangle developed in its wave ((b)) of Minute degree, which moves inside the incomplete wave 2 of Minor degree. 

Technical Overview

The big picture of GBPCAD cross under the Elliott Wave view exposed in the following daily chart shows the progress of a corrective structure that began on March 09th when the price found fresh sellers at 1.80531. Once the cross topped at 180531, the cross completed an impulsive wave identified as wave 1 of Minor degree labeled in green and began to develop its wave 2 of the same degree, which remains incomplete.

The previous chart also shows the price developed its wave ((a)) of Minute degree in black as a sharp decline, making its next path corresponding to wave ((b)) as a triangle pattern. This price context carries us to verify the alternation principle between waves inside a corrective pattern. In fact,  the speedy first corrective leg gave way to an elapsed second move in an extended time range compared with wave ((a)). Likewise, the next decline corresponding to wave ((c)) shouldn’t be as quick as wave ((a)).

On the other hand, the piercing below the base-line of the triangle that connects the end of waves (b) and (d) of Minuette degree labeled in blue suggests that the cross could see further declines in the following weeks. Additionally, considering that the price action didn’t surpass the end of wave (e), the likelihood of further drops increases.

Technical Outlook

The next daily chart exposes the time segment of the corrective sequence corresponding to wave 2 of Minor degree, in which waves ((a)) and ((b)) in black were moving for 259 days, starting when the cross topped at 1.80531 and till the end of wave (e) in blue. Additionally, the piercing of the base-line that connects the end of waves (b) and (b) suggests that wave (c) should be in progress.

In this context, the incomplete bearish sequence in progress corresponding to wave ((c)) could extend in a fraction of 259 days, for example, 50 percent of that time or approximately 130 days, which carries us to foresee a downward correction in the GBPCAD cross till early April 2021. Likewise, the potential bearish target zone can be found between 1.65562 and 1.63042.

In summary, the GBPCAD cross advances in an incomplete corrective sequence corresponding to wave 2 of Minor degree. Simultaneously, its internal structure reveals the progress in its wave ((c)). The potential bearish target for this segment extends between 165562 and 1.63042. Also, the downward sequence could elapse until early April 2021. Finally, the invalidation level of the current bearish scenario is located at 1.75549.

Categories
Forex Elliott Wave Forex Market Analysis

Is the US Dollar Index Finding A Bottom?

Technical Overview

The US Dollar Index (DXY) continues bouncing in the extreme bearish sentiment zone, testing the resistance at 90.983. The breakout of this resistance level could lead to expect further upsides in the following trading sessions.

The following figure shows the US Dollar Index in its 8-hour timeframe exposing the mid-term market participants’ sentiment unfolded by the 90-day high and low range, revealing the bearish trend’s exhaustion. In this context, the surpassing of the next resistance at 90.983 could warn about the Greenback recovery, which could boost the price until the next resistance is located at 92.236. Likewise, the exhaustion could imply the consolidation of the bearish trend.

On the other hand, the primary mid-term trend plotted in blue shows the bearish pressure that remains in progress and the current since DXY found resistance at 94.742 on September 25th. Likewise, the secondary trend identified with the accelerated green downward trendline shows a pause of the short-term downtrend started at 94.302 on November 04th. In this context, the pause in progress represented by the rising minor trend could develop a limited rally, which could carry the price to test the precious swing at 91.200 reached on December 09th.

Technical Outlook

The short-term Elliott wave view for DXY exposed in the next 4-hour chart reveals the end of the bearish wave ((iii)) of Minute degree labeled in black and the start of wave ((iv)) of the same degree, suggesting the possibility of a corrective rally, which could take until January 20212.

From the previous chart, we distinguish the start of wave ((iv)) identified in black, which began when DXY found support at 89.73 on December 17th, ending the third wave of Minute degree labeled in black. Likewise, the price action surpassed the short-term downward trendline plotted in green, suggesting the bearish sequence’s exhaustion that began at 94.302 on November 04th.

With the short-term trendline piercing, DXY developed the first segment of a corrective wave of Subminuette degree identified as wave a labeled in green, which found resistance in the supply zone between 91.014 and 91.200. Once topped at 91.018, the Greenback retraced, developing its wave b of the same degree, which found support in the intraday demand zone between 90.262 and 90.059. 

The textbook suggests that the price action should develop a third move identified as wave c in green, which could advance until the next supply zone bounded between 91.412 and 91.580. Once the US Dollar Index completes the third segment, the Greenback will complete the wave (a) of Minuette degree identified in blue corresponding to the first segment of the wave ((iv)) in black.

In summary, the US Dollar Index looks starting to develop the first segment of the fourth wave of Minute degree, suggesting the pause of the primary trend’s downtrend, which could last up until January 2021. In this regard, DXY currently found temporary support at 89.730, and the price could develop a new decline corresponding to the fifth wave of Minute degree. The potential next decline could pierce the previous low, being its potential next bearish target located at 88.864. Finally, if the price action surpasses the invalidation level placed at 92.107, the Greenback could start to show recovery signals, which could carry to expect a bullish reversal move.

Categories
Forex Elliott Wave Forex Market Analysis

AUDNZD: Profiting from its Intraday Triangle Pattern

The AUDNZD cross seems to start a movement in wave 3 of Minor degree labeled in green after completing its second corrective wave of the same degree, which found its bottom at 1.04181 on December 01st.

Technical Overview

The big picture of the AUDNZD cross and under the Elliott Wave perspective and illustrated in the following daily chart reveals the bullish sequence of Minor degree that began last March 09th, when the price pierced the parity level, dropping to 0.99906.

Once the price found fresh buyers, the Oceanic cross climbed in five internal movements of Minute degree, identified in black, until 1.10438, where the cross completed its first wave in green. After this completion, AUDNZD dropped in a complex corrective formation identified as a double-three pattern, which found support at 1.04181 on December 01st. From there, it bounced up to the current levels. 

On the other hand, the breakout of the short-term descending trendline that connects the end of wave ((x)), in black, with the end of wave (b), in blue, suggests the end of the second wave of Minor degree.

Short-term Technical Outlook

The intraday view unfolded in the next 2-hour chart shows the rally that remains in progress since December 01st when the cross found fresh buyers at 1.04181 suggesting further upsides in the following trading sessions.

The previous chart shows the wave (iii) movement of the Minuette degree labeled in blue, which currently looks consolidating its internal structure in a potential running triangle pattern. 

According to the Elliott Wave theory, practically all running triangle patterns tend to be confused with ending diagonals driving retail traders to open trades in the opposite direction to the current trend instead of considering the pattern as a continuation of the trend. Therefore under this scenario, our main bias remains on the bullish side. In this regard, this triangular pattern makes us think that the Oceanic cross might continue extending its movement until the potential target zone between 1.0758 and 1.0816, where the price could complete its third wave, in blue.

In summary, the AUDNZD cross completed its second wave of Minor degree subdivided in a descending three-wave sequence calling for a new upward movement in favor of the first rally, which should follow a five-wave sequence. In this context, the internal structure shows the progress in the third wave of an impulsive wave, which looks consolidating in a running triangle pattern. The potential target of the current rally is located between 1.0758 and 1.0816. On the other hand, the bullish scenario’s invalidation level is set at 1.04181, corresponding to the origin of the current upward sequence.

Categories
Forex Elliott Wave Forex Technical Analysis

EURJPY Consolidates Expecting Further Upsides

Technical Overview

The EURJPY cross consolidates in the extreme bullish sentiment zone, suggesting a bullish continuation of the strong upward movement developed in early December.

The following daily chart exposes the EURJPY cross developing a consolidation pattern, which looks like a flag pattern bounded between 125.77 and 126.70. According to the chartist analysis, the formation suggests the continuation of the previous movement. In this case, the cross could extend its gains surpassing the next resistance corresponding to the 52-week high located at 127.075.

The mid-term overview for the EURJPY cross reveals its primary trend plotted in blue, supporting a rally that remains in progress since the price confirmed its bottom at 114.397 touched on last May 07th. The secondary trend traced in green and minor trend drawn in black supports the price acceleration, which currently consolidates carrying to expect the bullish continuation for the following trading sessions.

Technical Outlook

The big picture for the EURJPY cross under the Elliott wave perspective unfolded in the next 12-hour chart shows the incomplete corrective rally corresponding to wave ((b)) of Minute degree labeled in black. This corrective rally remains in progress since the price found fresh buyers at 121.617 on last October 29th and could reach new yearly highs.

The upper degree structure of the EURJPY cross illustrated in the previous chart exposes the progress in wave B of Minor degree labeled in green, which began when the cross completed its wave A at 127.075 on last September 01st. Currently, the price advances in its wave ((b)) in black. Likewise, its internal structural series shows the development in the wave (c) of Minuette degree labeled in blue, which at the same time, looks starting to develop the wave v of Suminuette degree identified in green.

In this context, the EURJPY cross could extend its gains toward the potential target zone bounded between 126.96 until 128.08, where the cross could find fresh sellers expecting to drag the price to new lows developing the wave ((c)) in black. 

In this regard, if the price confirms its new bearish leg, the cross could complete the third segment of wave B in green. On the other hand, considering both the alternation principle and the wave ((a)) and ((b)) looks extended in terms of time, the wave ((c)) could be a sharp decline.

In conclusion, the EURJPY cross moves mostly upward in a corrective rally that belongs to wave ((b)), corresponding to the second segment of the upper degree wave B. If the price breaks the sideways consolidation structure developed since early December, the cross could strike the potential target zone between 126.96 and 128.08. Likewise, the invalidation level of the bullish scenario locates at 125.130.

Categories
Forex Elliott Wave Forex Market Analysis

Will 1.24 be the Next EURUSD Yearly High?

The EURUSD pair continues extending its gains after surpass its psychological resistance of $1.22 for the first time since late April 2018. The common currency gained over 9.20% (YTD), encouraged by the US Dollar weakness.

Technical Overview

The following daily chart illustrates the long-term market participants’ sentiment unfolded within the 52-week high and low range. The figure shows the progression starting from 1.06359, which corresponds to the lowest level of the year. 

The long-term primary trend identified with the trend-line in blue reveals that bull traders remain the market control since last March 23rd when the price found and confirmed the bottom at 1.06359 after the massive sell-off occurred last mid-February. Moreover, both the secondary trend (green trend-line) and the minor trend (black trend-line) show the bullish acceleration that carries the cross from November 04th when the EURUSD found fresh buyers expecting further upsides. 

On the other hand, although the trend looks mostly bullish, the EMA(60) to close index is moving in its overbought zone; thus, we should be prepared fr the upward movement in progress to end soon. Under this context, the main bias for bulls should change from buy to hold. Also, Bearish traders should expect confirmation signals such as a significative breakdown before placing their short positions.

Technical Overview

The mid-term Elliott wave view of the EURUSD pair exposed in the next 12-hour timeframe chart reveals the price action is reaching its second target level of $1.22575 proposed in our previous analysis. Also, the chart illustrates its progress in an incomplete wave 5 of Minor degree labeled in green.

The lesser degree structure observed in the fifth wave in green shows the progression of the wave ((iii)) of Minute degree labeled in black, which simultaneously appears advancing in its internal fifth wave of Minuette degree identified in blue. The Elliott Wave textbook suggests that, currently, the common currency moves in an extended wave. In this context, once the pair completes its rally, it should start to consolidate in its wave ((iv)) in black. This corrective formation could find support in the demand zone between 1.21061 and 1.20586, which could bring the possibility to join the long-term bullish trend. The potential target for wave 5 in green is $1.2405.

In summary, the EURUSD pair moves in its third wave of Minute degree, which should complete its rally in the coming trading sessions. The next path corresponding to wave ((iv)) in black could drag the price until the demand zone between 1.21061 and 1.20586, where the common currency could start a new rally with a potential target at 1.2405. Finally, the invalidation level of the bullish scenario is $1.19201.

Categories
Forex Elliott Wave Forex Market Analysis

EURAUD Advances Supported by the RBA Minutes

Technical Overview

The EURAUD cross advanced on the overnight trading session, expecting the minutes from the last Reserve Australia Bank (RBA) interest rate decision meeting, where policymakers decided to keep unchanged the rate at 0.1% for the second month in a row.

Source: TradingEconomics.com

On the technical side, the following 12-hour chart shows the short-term market sentiment unfolded by the 90-day high and low range, which illustrates the cross consolidating in the extreme bearish sentiment zone

The bullish candlestick formation developed during the recent trading sessions carries to suspect the possibility of a short-term bounce. This bounce could find strike the level 1.62374 that corresponds to the resistance of the extreme bearish zone.

On the other hand, the short-term primary trend plotted in blue shows the bearish bias that remains in progress. The secondary trend also shows the intraday downward acceleration, which dragged the price until 1.60408, where the cross found support. Likewise, the bounce observed on the EMA(60) to Close Index carries to support the possibility of a limited recovery.

Technical Outlook

The short-term Elliott wave view for the EURAUD cross shows the downward progress of the incomplete five-wave sequence of Minute degree labeled in black, suggesting a limited recovery in the following trading sessions.

The next 4-hour chart shows the bearish movement subdivided into a five-wave sequence of Minute degree identified in black. It began on October 20th at 1.68273 and found its temporary bottom at 1.60408 on December 11th.

The previous figure illustrates the price looks advancing in its fifth wave in black, which after the bottom reached on the last Friday 11 session completed its wave (iii) of Minuette degree labeled in blue. In this context, according to the Elliott wave theory, the price action should start to develop a corrective formation, which could find resistance in the supply zone between 1.61786 and 1.62271.

On the other hand, considering that the wave ((iii)) in black looks like the extended wave, the fifth wave could have a limited extension. In this context, the lesser degree structure of the wave ((v)) could pierce slightly below the end of wave (iii) in blue.

In conclusion, the EURAUD cross shows the possibility of a limited recovery, which could strike the supply zone between 1.61786 and 1.62271, where the price could start to consolidate in a sideways range with support at the end of wave (iii) at 1.60408. On the other hand, if the cross surpasses the supply zone, it would indicate further recoveries, and the price could start a bullish rally. Finally, the invalidation level of the current bearish scenario locates at 1.62872.

Categories
Forex Elliott Wave Forex Market Analysis

NZDUSD Could Reach a New Yearly High

The NZDUSD pair continues extending its gains, testing the psychological barrier of 0.71, helped by the US Dollar weakness. The Oceanic currency outperforms over 5.4% during the current year. Also, the pair advances over 27% since it confirmed its bottom on March 22nd at 0.55862.

Technical Overview

The big picture of the NZDUSD illustrated in the following 12-hour chart shows the primary upward trend, its trendline plotted in blue, intact since March 22nd when the price confirmed its bottom at 0.55862 and began the rally that remains in progress to date. Likewise, the secondary trend and its green trendline reveal the acceleration of the price testing by the third time the psychological barrier of 0.71.

Considering that the NZDUSD pair currently re-tests the 0.71 level, the price could extend its gains, reaching a new yearly high, to find resistance in the next psychological resistance of 0.72.

Short-term Technical Outlook

The short-term Elliott wave view for the NZDUSD pair unfolded by its 4-hour chart led us to observe an incomplete impulsive sequence of Minute degree labeled in black, which began on October 22nd price found fresh buyers at 0.65529.

The previous chart illustrates the impulsive structure that continues progressing and looks to develop its fourth wave of Minute degree labeled in black. Moreover, in the chart, we should remark that the third wave, which looks like the extended wave of the incomplete impulsive sequence identified in black, has found resistance at 0.71043 on December 03rd. 

Once the price topped the yearly high at 0.71043, the pair began to develop a sideways corrective formation, still progressing. In this regard, considering both the alternation principle stated by the Elliott Wave Theory and that wave ((ii)) in black looks like a simple corrective pattern, the current wave ((iv)) of the same degree should be complex in terms of price, time, or both.

In this scenario, the price action might retrace until the demand zone bounded between 0.69462 and 0.68970, where the Kiwi could find fresh buyers expecting to boost the pair toward a new yearly high. This high could strike the potential target zone between 0.71618 and 0.7260.

In summary, the short-term Elliott wave perspective for the NZDUSD pair reveals the advance in a bullish trend that currently moves mostly sideways in an incomplete corrective formation. The fourth wave in progress could find support in the demand zone bounded between 0.69462 and 0.68970. Likewise, fresh buyers could boost the price toward 0.71618 and extend its gains until 0.7260. Finally, the invalidation level of the current bullish scenario is located at 0.68106.

Categories
Forex Elliott Wave Forex Technical Analysis

EURGBP Soars!, More Gains Ahead?

The EURGBP cross soared on Friday session, surpassing the psychological 0.92 barrier, advancing until the target area forecasted in our previous short-term analysis (here.)

Technical Overview

Our previous analysis discussed the completion of the complex corrective formation identified as a double-three pattern of Minute degree labeled in black, which began on last September 11th at 0.92916 and finished on November 11th at 0.88610. Likewise, after the double-three completion, the cross completed the wave B of Minor degree identified in green.

Once the EURGBP found the bottom at 0.88610, the cross began a rally corresponding to wave C. We have seen in our previous analysis the price completed wave ((ii)) at 0.88667 on November 23rd. After this completion, both the breakout of the descending trendline of the second wave in black and the strong bullish long-body candlestick formation developed in the November 27th session confirmed the start of the third wave in black.

Technical Outlook

During the last trading session of the week, the short-term Elliott wave view for the EURGBP cross exposed in the following 8-hour chart reveals the acceleration in its advance, which surpassed the supply zone between 0.92008 and 0.92181, finding resistance at 0.92298.

The impulsive upward movement observed during Friday’s session allows us to distinguish the completion of the wave ((iii)) at 0.92298 and the beginning of the fourth wave of the same degree.

In this context, the current corrective formation identified as wave ((iv)) in black could decline until the previous supply zone between 0.90686 and 0.90446, where the cross could find fresh buyers. Once the fourth wave completes, the cross should advance in a new rally corresponding to wave ((v)), which would be subdivided into a five-wave sequence. The potential target for the end of wave C is within the next supply zone between 0.92568 and 0.92916.

In summary, the EURGBP cross appears moving in an incomplete wave C of Minor degree, which, in its lesser degree count, shows the beginning of the fourth wave in black. This corrective formation could decline until the previous supply zone is located between 0.90446 and 0.90686. The cross, then, could find fresh buyers expecting the continuation of the trend that would push up the price toward the supply zone between 0.92568 and 0.92916.

Lastly, the invalidation level for this bullish scenario can be found at 0.90031.

Categories
Forex Elliott Wave Forex Market Analysis

EURNZD Consolidates after Bouncing from its Recent Lows

The EURNZD cross is seen consolidating near the extreme bearish sentiment zone backed by the strength of the New Zealand dollar. This consolidation suggests a pause of the downward sequence that began on August 20th and ended heavily oversold after its latest decline that drove it to 1.69472.

Technical Overview

The following 12-hour chart illustrates the short-term markets participants’ sentiment bounded by the 90 high and low range, which shows the price consolidating in the extreme bearish sentiment zone after the cross found support on 1.69472 on November 24th.

Furthermore, the previous chart shows the primary trend outlined a blue trend-line that tells the bias remains mostly bearish. Likewise, the secondary trend represented with the green trend-line exposes the downward acceleration, and, shows also its consolidation range between the levels of 1.69472 and 1.72664.

Finally, as long as the EURNZD cross keeps moving below level 1.72664, the bias will remain bearish, so we could expect further drops, likely below 1.69472. Whereas, the breakout of the extreme bearish zone of 1.72664 to the upside could indicate the start of a recovery.

Short-term Technical Outlook

The short-term outlook for the EURNZD cross under the Elliott Wave perspective is shown in the next 2-hour chart and seen moving in an incomplete downward sequence. The current leg in which is moving corresponds to the wave ((c)) of Minute degree labeled in black.  Within that wave ((c)), the price is advancing in its fourth wave of Minuette degree identified in blue.


We see all that the wave ((c)) of Minute degree labeled in black came after the completion of the wave ((b)), which ends on 1.80212 where the cross found fresh sellers dragging it in an accelerated bearish movement. In this context, the current wave ((c)) should develop an internal structure of five waves.

Right now, the chart shows the action is happening in its fourth wave, in blue, which could be advancing in its internal wave b of Subminuette degree identified in green. This leg could possibly test November’s lows. Likewise, considering that the third wave, in blue, looks like an extended wave, the fourth wave should be complex in price, time, or both. Therefore, the current corrective wave could continue evlving likely until early 2021.

Concerning the fifth wave, in blue, and considering that the third one of the same degree was the extended movement, there are two potential scenarios for the cross:

  • First scenario: the cross fails in its downward sequence finding fresh buyers above the end of the third wave, in blue, at 1.69472.
  • Second scenario: the cross penetrates below 1.69472, creating a new lower low. In this case, this new leg down could continue until the psychological barrier of 1.68.

In summary, the EURNZD cross currently moves in a corrective formation in the extreme bearish sentiment zone. In this context, our principal bias remains neutral until the completion of the fourth wave in blue. Once the cross ends the current consolidation, we could seek short positions following the direction of the fifth wave. Finally, the invalidation level of the bearish scenario locates at 1.73606.

Categories
Forex Elliott Wave Forex Technical Analysis

EURJPY Consolidates Expecting the ECB Decision Ahead

The EURJPY cross consolidates in the overnight trading session expecting the ECB interest rate decision statement that will take place before the U.S. opening bell. The analysts’ consensus doesn’t expect changes both in the interest rate that remains at 0.0% and in the deposit facility rate that keeps at -0.50%.

Source: TradingEconomics.com

Technical Overview

The following 8-hour chart shows the EURJPY market participants’ sentiment, where the cross looks consolidating in the extreme bullish zone, developing a flag pattern. This chartist pattern suggests the continuation of the previous movement. In this case, the technical formation could be indicative of further upsides for the following trading sessions.

Moreover, the primary trend identified with the upward trend-line in blue remains on the bullish side. Also, the secondary trendline plotted in green reveals the bullish acceleration of the price action. This market context is confirmed by the EMA(60) to Close Index, with a reading above the level 2.000 that suggests the overbought levels and the potential correction or consolidation of the previous rally.

Short-term Technical Outlook

The EURJPY under the intraday Elliott wave perspective unfolded in its 2-hour chart illustrates the advance in an incomplete corrective rally corresponding to wave ((b)) of Minute degree labeled in black. The internal structure shows the cross advancing in its incomplete wave (c) of Minuette degree marked in blue, suggesting a further upside in the following trading sessions.

At the same time, the previous chart reveals the internal five-wave sequence of wave (c) in blue, which exposes the sideways progress of its fourth wave of Subminuette degree identified in green, which belongs to the wave (c) of Minuette degree. 

In this context, considering that the price action could develop a new upward movement, the cross could advance in its fifth wave in green to the potential target zone between 126.84 and 127.48, where the EURJPY cross could complete the wave (c) in blue, and the wave ((b)) in black. Likewise, once this corrective rally completes, the price could start to develop a downward movement identified as wave ((c)) in black.

In this regard, according to the Elliott Wave theory and considering that the mid-term structure corresponds to an incomplete corrective formation constituted by a three-wave sequence, after the completion of the wave ((b)) in black, the price should start to decline in its wave ((c)) with an internal structure subdivided into a five-wave sequence.

Summarizing, the EURJPY cross currently develops a consolidation pattern, which leads to expect a new upward movement with a potential target between 126.84 and 127.48. Once the price completed its target, the cross may start to decline in a five-wave sequence corresponding to wave ((c)) of Minute degree.

Finally, the invalidation level of the current bullish scenario can be found at 124.566.

Categories
Forex Elliott Wave Forex Market Analysis

GBPUSD Ending Diagonal Completion a Warning Sign for a Trend Reversal?

In our last GBPUSD analysis, we discussed its upward advance in an incomplete ending diagonal pattern. We said that the terminal Elliott wave formation progressed in its fifth wave of Minuette degree identified in blue that belongs to a wave ((c)) of Minute degree labeled in black. Likewise, the wave ((c)) corresponds to the third internal segment of the wave B of Minor degree identified in green. 

Technical Overview

The big picture unveiled the sideways movement in an incomplete corrective formation, which could correspond to an expanding flat pattern. In this regard, after the completion of wave B, the Sterling should start developing wave C, which should lead to a decline of this major pair in a five-wave internal sequence.

On the other hand, the following 8-hour chart reveals the market participants’ sentiment unfolded by the 90-day high and low range, which looks advancing in the extreme bullish sentiment zone. 

The previous chart illustrates the bullish failure in the Wednesday trading session, which couldn’t strike the last high of 1.35394. This failure added to the breakdown of the previous upward trendline plotted in green leads us to expect further declines in the coming trading sessions, likely to the ascending primary trend-line identified in blue.

Short-term Technical Outlook

The intraday Elliott wave view for the GBPUSD pair displayed by the following 2-hour chart exposes the breakdown of the ending diagonal pattern formed on December 07th, confirming the completion of the terminal formation unveiled in the wave ((c)) identified in black. 

Once the Pound found the intraday support at 1.32238, the price action began to bounce in an internal corrective rally subdivided in a three-wave sequence corresponding to wave ((ii)) in black, founding resistance at 1.34779 on the Wednesday trading session.

In this regard, the breakdown of the intraday trend-line that connects the waves ((i)) and (b) should confirm the downward progress of its wave ((iii)) in black, which according to the Elliott wave theory, should be the largest wave of the downward sequence.

The third wave in black could find support in the demand zone between 1.31296 and 1.31064. If the price action continues deteriorating, the Cable could drop toward the next demand zone between 1.29843 and 1.29144.

Summarizing

After the GBPUSD pair made a breakdown of its ending diagonal pattern, is currently moving in a corrective rally corresponding to wave ((ii)), which should give way to a new decline corresponding to the third wave of Minute degree. According to the textbook, this movement should be the largest decline of the current downward sequence and could find support in the demand zone between 1.31296 and 1.31064. Finally, the invalidation level of the current bearish scenario can be found at 1.35394.

Categories
Forex Elliott Wave Forex Market Analysis

EURUSD: is 1.22 at Hand?

The EURUSD pair advances in the extreme bullish sentiment range, consolidating the short-term rally that started on November 04th when the price found fresh buyers at 1.15615.

Technical Overview

The following 8-hour chart shows the short-term participants’ sentiment keeps pushing higher the price action. In this view, the common currency looks to consolidate the pair’s impulsive movement that began in early November.

In this chart, we can see that the current primary trend is clearly bullish. Simultaneously, the accelerated trendline identified with the green line shows the short-term bull market remains intact.

On the other hand, both the intraday sideways channel and the retracement observed in the EMA(60) to Close Index lead to a consolidation of the rally experienced by the common currency during the previous trading sessions.

Therefore, if the price action penetrates below 1.20338, the likelihood of a reversal movement in the EURUSD increases.

Short-term Technical Outlook

The short-term Elliott Wave view for the EURUSD pair unfolded in the next 4-hour chart reveals the advance in an incomplete bullish impulsive wave of Minor degree identified in green.

The EURUSD 4-hour chart illustrates the impulsive rally that began on November 04th when the price found fresh buyers at 1.16025. The price action currently looks to have completed its third wave of Minute degree labeled in black, confirmed by the broadest distance shown on the MACD oscillator

On the other hand, the consolidation structure in progress reveals the potential sideways advance of its fourth wave. Considering the Elliott Wave Principle, the fourth wave shouldn’t penetrate below the invalidation level located at 1.19201, which corresponds to the end of wave ((i)) in black.

Also, considering both the second wave, which looks like a simple corrective pattern, and the alternation principle on corrective waves, the fourth wave should be a complex correction. In this context, the fourth wave could be a triangle or a combination of simple waves grouped in a double-three or a triple-three formation.

Finally, the extension in terms of time should indicate the exhaustion of the bullish pressure; thus, the common currency could soon end its bullish cycle.

Categories
Forex Elliott Wave Forex Market Analysis

GBPAUD Consolidates in an Incomplete Correction

The GBPAUD cross continues consolidating in what is a corrective formation that continues in development since October 22nd when the price found fresh sellers on 1.85272. In this context, the current consolidation pattern suggests a coming rally in the following trading weeks.

Technical Overview

The next 12-hour chart illustrates the short-term market participants’ sentiment displaying the 90-day high and low range, which bounced in the bearish sentiment zone finding resistance in the neutral level of 1.80104, where the cross is still moving in the current trading session. However, as long as the GBPAUD cross doesn’t surpass and closes above the level of 1.80104, the bias will stay mostly bearish.

The primary trend identified in blue shows that the current uptrend remains in its formation process. In this context, the corrective movement in progress represents a secondary trend from the last upward move that carried the cross from 1.74935 to 1.85272.

Short-term Technical Outlook

The short-term Elliott wave view for the GBPAUD cross shown in the following 4-hour chart reveals the downward advance in an incomplete double-three pattern of Minute degree labeled in black, which suggests further declines for the following trading sessions.

The previous chart shows the GBPAUD developing a double three pattern. According to the textbook, this complex corrective formation follows an internal sequence subdivided into 3-3-3, where each three corresponds to a basic corrective structure.

Currently, the cross looks advancing in its wave (c) of Minuette degree labeled in blue, which belongs to the wave ((y)) of Minute degree identified in black. The movement developed until now fits two potential scenarios:

  • The first scenario considers the pause in the wave (c), which could see further declines to the demand zone between 1.7774 and 1.7716. The cross could even extend its drops until 1.7610 and 1.7554, where the price could find fresh buyers expecting a boost in its price to new highs.
  • The second occurs if the price ends its wave (c) in blue and rally toward fresh highs. In this context, the cross should confirm the breakout of the supply zone resistance at 1.8041. Also, the cross must break up the ((x))-(b) trend-line.

Finally, the invalidation level for this bearish sequence in progress can be found at the end of wave (b) in blue at 1.82144.

Categories
Forex Elliott Wave Forex Technical Analysis

US Dollar Index Under Bearish Pressure. What’s next?

The US Dollar Index (DXY) consolidates on Monday’s session in the extreme bearish sentiment zone bouncing a modest 0.06% from the last Friday 04th, from 90.476 to 90.757. However, the technical perspective is mostly bearish for the DXY basket of currencies.

Technical Overview

The following 8-hour chart shows the mid-term market participants’ sentiment unfolded in its 90-day high and low range. The figure reveals the bearish pressure that carries the Greenback in the extreme bearish zone between 90.476 and 91.543. Likewise, the intraday sideways candlestick formation suggests the likelihood of a pause and the downward continuation for the following trading sessions.

Regarding the US Dollar’s trend, the primary trend plotted in the blue line reveals the bearish bias. The secondary trend identified in green suggested the downward acceleration since November 04th when the price failed its bullish advance at 94.316. Likewise, the broader distance between the primary trend-line and the price leads to a limited correction before continuing the bearish path.

Short-term Technical Outlook

The short-term Elliott Wave perspective for the US Dollar Index exposed in the next 2-hour chart suggests the incomplete downward advance of a five-wave sequence, which could be starting to consolidate in its fourth wave of Minuette degree identified in blue.

The current bearish sequence began on November 04th when the price found fresh sellers at 90.302 and began a decline that is still present to date. The previous chart suggests the completion of the third wave of Minuette degree. This Elliott wave context is supported by the broadest distance observed in the MACD oscillator.

On the other hand, considering that the second corrective wave seems simple in terms of price and time, the alternation principle suggests that the fourth wave in progress should be complex in terms of price, time, or both. In this context, the next corrective pattern could be a triangle pattern or a combination such as a double-three or a triple-three formation.

The implication of the fourth wave’s extension could be indicative of the exhaustion of the bearish trend, and the price action should reverse soon.

Finally, if the price action rises and closes above the supply zone between 91.412 and 91.580, the US Dollar Index could reveal a possible reversion of the current bearish trend.

Categories
Forex Elliott Wave Forex Market Analysis

AUDUSD Consolidates its Gains Expecting the US Employment Data Ahead

The price of AUDUSD reached a fresh yearly high at 0.74496 on the Thursday trading session expecting the last employment data release of the year for the US labor market corresponding to November. 

(Source: tradingeconomics.com)

Technical Overview

This year, as illustrated in the previous chart, Australia’s unemployment rate peaked at a record high of 14.7% in April, mainly boosted by the coronavirus lockdown. In this context, the analysts’ consensus expects the unemployment to drop to 6.8% for November, from 6.9% reported last October.

The mid-term Elliott wave perspective displayed in the 12-hour chart below reveals the upward progression in an incomplete five-wave sequence of Minor degree labeled in green. This bullish impulsive move began on March 18th when the Aussie found fresh buyers at 0.55063.

The previous chart also shows the Aussie’s advance in a third extended wave, suggesting that the price action could be moving in its fourth wave in green, still in development. 

This scenario considers that the Aussie moves in its internal wave (c) of Minuette degree labeled in blue, developing an ending diagonal pattern. Likewise, the wave of the upper degree corresponding to wave ((b)) of Minute degree identified in black should correspond to an expanded flat pattern, and the price should realize a new decline,

The alternative count considers the advance in the fifth wave of Minor degree in green is developing an internal ending diagonal pattern. In this case, the Aussie should start a decline corresponding to wave A in green.

Technical Outlook

The short-term Elliott wave for AUDUSD exposed in its 4-hour chart shows the advance in an ending diagonal pattern, which looks developing its fifth wave of Subminuette degree labeled in green.

Although the ending diagonal pattern suggests completing the fifth wave or wave (c), the Aussie must confirm its completion through the breakdown of its base-line that connects the waves ii and iv, in green. Also, the price should confirm the close below the intraday demand zone between 0.73492 and 0.73571.

Finally, if the price confirms its downward correction, the potential target area for this movement is from 0.7265 and 0.7144. If the area fails to hold, and the bearish pressure extends this downward movement, the Aussie could visit the base of its sideways channel on the psychologically key level of 0.70.

Categories
Forex Elliott Wave Forex Market Analysis

Is GBPUSD Preparing a Reversal Move?

The GBPUSD pair is seen advancing in an ending diagonal pattern inside an incomplete flat pattern of Minor degree, identified in green, which is in progress since September 01st when the Sterling found resistance 1.34832. 


Technical Overview

The previous 8-hour chart exposes the advance in a potential flat pattern (3-3-5), which currently develops its wave B of Minor degree identified in green. In this context, once the current corrective rally ends, the next potential move, according to the Elliott Wave theory, could correspond the wave C. This movement should follow an internal structure subdivided into five wave segments.

Analyzing wave B’s internal structure, currently, we see the price advancing in its wave ((c)) of Minute degree labeled in black. In this context, according to the textbook, the pattern identified in the current wave ((c)) has the shape of an incomplete ending diagonal pattern.

On the other hand, looking at the price and time relationship presented in the first chart, it is interesting to compare the elapsed time of the current wave B with wave A. This comparison suggests that the current wave B can be thought of as a corrective rally; thus, the next move could become an aggressive decline. 

Nevertheless, considering that the current wave B remains in progress, the short-term bias is still on the bullish side.

Technical Outlook

The next 8-hour chart shows the GBPUSD advance in its fifth wave of Minuette degree, labeled in blue, which belongs to the wave ((c)), in black, suggesting a terminal movement.

In this context, the price’s test of the upper sideways channel trendline suggests that the Pound Sterling could develop an expanded flat pattern. This Elliott Wave pattern’s implication makes us consider a strike over the origin of wave A located at 1.34832, where the pair should start to decline, developing its wave C in green.

Finally, both the ending diagonal pattern and the expanded flat pattern requires the pair to confirm the breakdown below the demand zone between 1.33135 and 1.32876. If the pair’s price action confirms this breakdown, it could move down up to the level of 1.29144.

Categories
Forex Elliott Wave Forex Market Analysis

EURJPY Advances Toward Key Supply Zone

In our latest EURJPY analysis, we commented on its advance in an incomplete corrective structure identified as a triangle pattern, which remains in development since mid-2014.

Technical Overview

Also, we saw that the mid-term trend looks like an incomplete corrective structure, which seems to advance in a wave B of Minor degree, labeled in green. Moreover, the structure observed previously unveiled the progress in an incomplete wave ((b)), identified in black, which should develop a bounce toward the supply zone between 125.285 and 126.123.

The price action is currently seen advancing in its wave (c) of Minuette degree, labeled in blue, which has now reached the supply zone between 125.285 and 126.123 forecasted in our previous analysis.

On the other hand, the current wave (c), in blue, that remains in development could extend its gains toward the psychological barrier of 126, where the cross could start to decline to the wave ((c)), in black. This bearish sequence, possibly developed with five internal segments, should complete the wave B of Minor degree, in green.

Short- term Technical Outlook

The EURJPY in its 2-hour chart reveals the internal structure created by the wave (c), in blue, which shows the intraday ascending channel plotted in green. The price action that has surpassed the ascending channel’s upper line suggests the rise of the third wave of Subminuette degree labeled in green that is in progress.

In this context, according to the Elliott Wave theory, once the EURJPY completes the advance of the third wave, in green, the cross should experience a limited decline corresponding to the fourth wave in green. This drop could reach the demand zone between 124.931 and 125.128, where the price could find fresh buyers expecting the price to head toward new highs.

The fifth wave’s potential target zone, in green, is located between 125.939 and 126.497. In this area, the cross could complete the wave ((b)) of Minute degree in black. 

Finally, the invalidation level of this intraday bullish scenario is found at 124.566, which corresponds to the top of the first wave of Minute degree.

Categories
Forex Elliott Wave Forex Market Analysis

Is AUDUSD Turning Bearish?

In our previous technical analysis of the AUDUSD pair, we mentioned the potential corrective formation that was developing. In particular, we warned about the progress of an incomplete fourth wave of Minute degree identified in black, in which the pair was advancing on the wave (b) of Minutette degree in blue.

Technical Overview

As the previous chart shows, the price action seems moving in a mid-term sideways channel. This formation has been evolving since early September, when the price topped at 0.74134. In terms of the Elliott Wave theory, the figure shows the progression of a likely incomplete flat pattern (3-3-5).

In this context, the bearish rejection below September’s high of 0.74134 should confirm the end of wave (b), in blue, and the beginning of wave (c). Also, according to Elliott’s textbook, the coming wave (c) should follow an internal sequence subdivided into five waves.

The big picture of the AUDUSD pair currently reveals the gray box’s rejection suggested in our previous analysis. From here, the Aussie could start to decline in a five-wave sequence corresponding to the already mentioned wave (c) of Minuette degree, labeled in blue. 

Moreover, after wave (c) completes, the Australian currency should also end its wave ((iv)) of Minute degree in black and giving way to a new impulsive wave corresponding to the fifth wave of the same degree.

Short-term Technical Outlook

The AUDUSD price exposed in the next 2-hour chart reveals the completion of wave c of Subminuette degree identified in green, which topped at 0.74076 on November 30th, as the price action developed an ending diagonal pattern.

Once the price touched the psychological barrier of 0.74, the price began to decline, developing a breakdown below the baseline of the ending diagonal pattern, piercing the demand zone between 0.73492 and 1.73571, where the Aussie started a consolidation in the current trading session.

Considering that the pair started to consolidate, we expect an intraday sideways formation, likely a flag pattern. In this context, if the price breaks and closes below the baseline of this flag pattern, the AUDUSD could confirm the bearish continuation, which could make it drop to the next demand zone between 0.72654 and 0.72801.

Likewise, the price could extend its declines toward the next demand zone between 0.71449 and 0.71651. The movement, developed into a five-wave sequence, should complete the wave (c) of Minuette degree identified in blue, which, at the same time, could confirm the end of wave ((iv)) of Minute degree labeled in black, as we said earlier.

The invalidation level corresponding to this downward scenario is placed at the high of wave c, in green,  0.74076.

Categories
Forex Elliott Wave Forex Market Analysis Forex Signals

Is EURNZD Developing a Terminal Formation?

The EURNZD cross presents a downward sequence in its 12-hour chart that began on August 20th when the price found fresh sellers at 1.82238. This sequence formed three internal segments and, recently, is likely forming a reversal movement in the following trading sessions.

Technical Overview

The previous chart illustrates the bearish primary trend identified with the descending trendline, drawn in blue. Moreover, the secondary trend, plotted in green, reveals an aggressive decline that is happening since October 20th when the cross found resistance at 1.80212. But we see all that the EURNZD price seems to have found support on November 23rd on 1.69472. Currently, the price action appears consolidating in a narrow range between 1.69622 and 1.70645.

In Elliott Wave theory terms, the cross is advancing in an incomplete downward corrective sequence of Minute degree identified in black, which currently is drawing its wave ((c)). Likewise, its internal structure suggests the progress in the fifth wave of Minuette degree labeled in blue.

The following 2-hour chart reveals the EURNZD cross is moving mostly sideways following a descending wedge breakout, or in terms of the Elliott Wave theory, an ending diagonal breakout. 

Nevertheless, the bullish reversal is still unconfirmed as long as the cross keeps moving below the level of 1.70486.

Short-term Technical Outlook

The EURNZD cross shown in its 2-hour chart below presents a sideways movement below the pivot level of 1.70486, which could correspond to the fifth wave of Minuette degree, labeled in blue. 

Considering that the cross remains in a consolidation structure, there are two potential scenarios:

  • The first scenario occurs if the price action breaks and closes above the 1.70486 pivot level. In this case, the EURNZD could develop an upward movement. According to the Dow Theory, the cross should make an upward motion to the area between 1.73016 and 1.76560. Likewise, the invalidation level for this reversal scenario is seen on 1.69472, which corresponds to the low made on November 24th.
  • The second scenario calls for the price to drop and close below the 1.69472 level. If that happens, the cross could continue its decline toward the lows zone made in January, near the 1.6650 level. The price could find support and complete the wave ((c)) of Minute degree labeled in black. In this scenario, the invalidation level would be located above the last relevant swing high of 1.70961.

However, let’s remember that as long as the price doesn’t confirm any breakout, bullish, or bearish, the bias should be kept neutral.

Categories
Forex Elliott Wave Forex Market Analysis Forex Price Action Forex Technical Analysis

Is EURGBP Ready for a Fresh Rally?

In our latest EURGBP technical analysis, we commented on the cross moving in an incomplete sideways corrective formation of Minor degree, identified in green. Its internal structure suggested the completion of a double-three pattern of Minute degree.

Also, we saw the pierce and bounce of the September 03rd low at 0.8658, when EURGBP dropped to 0.88610, found fresh buyers there, and created an intraday impulsive move identified as the first wave of Minute degree, labeled in black.

As the next 4-hour chart shows, once the EURGBP cross completed its first wave, in black that belongs to wave C, in green, it reacted mostly bearish, developing a correction, extending the move below our forecasted area, and testing the lows of the previous bullish impulsive move.

The breakout of the short-term descending trendline confirmed the end of wave ((ii)) of Minute degree and the beginning of the third wave of the same degree, which remains in progress.

Likewise, in the last chart, we distinguish the advance of the third wave of Minuette degree identified in blue in its internal structure.

Short-term Technical Outlook

The short-term Elliott Wave view of the EURGBP cross, unveiled in the below 4-hour chart, reveals the breakout of the descending trendline that follows the wave ((ii)) identified in black, which suggests the beginning of a new rally.

Once the price found fresh buyers at 0.88998, the cross began to advance mostly bullish in an impulsive sequence of Minuette degree, identified in blue, that remains in progress. This upward move corresponds to the internal structural series of wave ((iii)) of Minute degree that belongs to wave C of Minor degree, in green.

Furthermore, considering the reduced period it took for the first stage of wave (iii) to complete, It is plausible that the third wave in progress will be the extended wave, as the Elliott Wave theory states that only one extended wave would occur in an impulsive structure. 

In this context, the current upward move could advance to the next supply zone between 0.90446 until 0.90686. But, if the cross maintains its bullish momentum, it could strike the next potential target zone between 0.91260 and 0.91464.

Finally, the current bullish scenario’s invalidation level is 0.88610, which corresponds to the origin of the wave C in green.


Categories
Forex Elliott Wave Forex Market Analysis

EURJPY Advances from Demand Zone Forecasted

In mid-November, we commented about the technical market context of the EURJPY cross, as its big picture displayed in its weekly chart revealed a technical formation identified as a triangle pattern, which continues progressing since mid-2014.

Moreover, our previous mid-term Elliott wave analysis in its 12-hour chart revealed the advance of an incomplete corrective structure of Minor degree, which currently advances in wave B in green.

In this regard, our main outlook anticipated the progress in its wave ((b)) of Minute degree identified in black. The internal structure also suggested a limited decline toward the demand zone between 122.951 and 122.317. Once reached, the price could have completed the internal wave (b) of Minuette degree labeled in blue. 

Once the cross completed its wave (b), in blue, the cross should begin its wave (c), in blue, with a potential target in the supply zone between 125.285 and 126.123.

Technical Outlook

Currently, the EURJPY cross in its 12-hour chart reveals the bounce from the previous demand zone forecasted, where the price began to advance in its wave (c) in blue.

In the previous chart, we distinguish wave (c)‘s upward progress, which should evolve in a five-wave sequence according to the Elliott Wave theory. The figure also shows the potential target zone between 125.285 and the psychological barrier of 126.

This price landscape brings us three potential scenarios for the current upward movement:

  • First scenario: The EURJPY cross reaches the supply zone between 125.285 and 126.123, completing its wave ((b)) in black, and the price starts to decline in an internal five-wave sequence corresponding to wave ((c)).
  • Second scenario: The cross’ short-term rally fails to surpass the end of wave (a), in blue, and begins to decline. This scenario should be indicative of strong bearish pressure.
  • Third scenario: EURJY price action surpasses the invalidation level located on 127.075. In this case, the cross could be creating a bullish breakout of the long-term triangle, suggesting the continuation of the long-term bullish trend.

Nevertheless, before placing any position on the bearish side or continue on the bullish side, the price action must confirm the end of wave ((b)) in black.

Categories
Forex Elliott Wave Forex Market Analysis Forex Technical Analysis

AUDNZD: Potential Bounce among Overall Weakness

This analysis discusses AUDUSD’s overall Elliott Structure, the likelihood of a short bounce in the AUDUSD, and its potential continuation.

Technical Overview

In our last AUDNZD technical analysis, the Oceanic cross was moving in an incomplete complex corrective sequence corresponding to wave (c) of Minuette degree labeled in blue, which belongs to wave ((y)) of Minute degree identified in black. 

As illustrated in the following 8-hour chart corresponding to our previous mid-November analysis, we commented on the broadening corrective formation the cross develops, which implies an acceleration of the downward sequence. Also, the move that pierced below the wave (a) in blue suggested further declines in the following trading sessions.

Likewise, we observed the potential bearish reaction areas for the decline until two potential demand zones. The first one located between 1.05186 and 1.04870, and the second one bounded between 1.03511 and 1.02864.

On the other hand, according to the Elliott wave theory, a complex corrective formation as a double-three pattern follows an internal sequence subdivided into 3-3-3, where each “three” corresponds to a single complete corrective wave.

Once completed, the current corrective structural series of wave 2 or B of Minor degree, the AUDNZD cross should give way to the start wave 3 or C, in green.

Technical Outlook

The AUDNZD cross in the next 8-hour chart exposes the price action advancing in its wave iii of Subminuette degree labeled in green, which belongs to the incomplete wave (c) of Minuette degree identified in blue. 

Considering the acceleration present in wave (c), the cross could develop an internal upward corrective movement corresponding to wave iv, in green. This move could find resistance in the adjacent supply zone between 1.0457 and 1.05603, where the cross could resume its downward movement, leading it to complete the wave ((y)) of Minute degree and, in consequence, wave 2 or B, in green. 

Once the current downward sequence finishes, the Oceanic cross will be ready for a new long-term rally corresponding to wave 3 or C, in green, which according to the Elliott wave theory, should be the largest wave of the impulsive sequence.

Finally, the invalidation level for the short-term bearish scenario is found at 1.07029, above the end of wave ii in green.


Categories
Forex Elliott Wave Forex Market Analysis

Beware of these Supply and Demand Zones on the GBPJPY

The short-term overview for the GBPJPY pair reveals the sideways movement in a trading range bounded by its 90-day high and low range between levels of 133.040 and 142.714. The cross recently developed a rally that found resistance in the bullish sentiment zone resistance located on 140.296, where the GBPJPY presents a set of scenarios.

Technical Overview

The following 12-hour chart illustrates the short-term market participants’ sentiment bounded by the 90-day high and low range. The figure presents a bullish bias that remains active since the GBPJPY found fresh buyers on 133.040.

After the cross found resistance at 140.296, the price action retraced it until a neutral zone located on 137.877, forming an intraday sideways channel that suggests a pause in the short-term bullish cycle.

On the other hand, the following figure unveils that the retail traders’ market sentiment is positioned on the bearish side. As the chart shows, 75% of retail traders hold their positioning on the sell-side, which is contrarian.

(source: myfxbook.com)

In this context, we can see that numerous retail traders are expecting a downward movement, while the price action remains moving in the bullish sentiment without exposing a reversal pattern. Thus, it is plausible the GBPJPY pair could develop a new upward movement.

Short-term Technical Outlook

The short-term Elliott Wave view shows a movement inside an incomplete corrective wave of Minor degree, labeled in green, which could be in its wave C

The following chart shows the price action developing an upward corrective rally, which could correspond to a wave (ii) or (b) of Minute degree identified in green. In this context, the following movement should correspond to wave (iii) or (c).

Under this scenario, if the supply zone between 139.831 and 140.315 confirms the end of the current second segment, in blue, GBPJPY should begin a decline to the first demand zone between 137.594 and 137.196. Moreover, the market action could extend its down move toward the next demand zone between 134.997 and 134.404.

An alternative scenario considers the possibility of the price extending its advance beyond the 140.315 level. In this case, the GBPJPY could find fresh sellers in the next supply zone between 141.759 and 142.714. The pair could complete its wave B in green and start to weaken, developing the wave C subdivided into a five-wave sequence with a potential target in the demand zones identified in green.

Finally, the invalidation level of the bearish scenario is set above the origin of wave A in green at 142.714

Categories
Forex Elliott Wave Forex Market Analysis Forex Technical Analysis

Would you Trade this CADJPY Pattern?

The CADJPY cross moved up in the Tuesday trading session, boosted by the stock market’s risk-on sentiment. Although the cross advances 2.25% during the current month, the price is under -4% (YTD).

Technical Overview

The CADJPY prices represented in the next 12-hour chart reveal the short-term market participants’ sentiment moving in the 90-day high and low range. The figure illustrates the cross advancing mostly upward in the bullish sentiment zone.

On the other hand, the previous chart presents a contracting triangle, which began in early June when CADJPY found fresh sellers on 81.909, followed by a first support level at 77.614. According to the classic chartist theory, the triangle pattern distinguishes itself as a continuation formation. In this case, this contracting triangle suggests further upsides.

In this regard, the likely next move could lead to a test of its intraday resistance of 80.591: this level corresponds to the bullish sentiment zone’s resistance, as well. If the price overcomes it and extends its upward advance, the cross could reach its supply zone between 80.985 and 81.424, a level that matches the triangle pattern’s upper trendline.

Conversely, a downward correction could drop it to its demand zone between 79.468 and 79.237.

Short-term Technical Outlook

The short-term Elliott Wave view for the CADJPY cross displayed in the next 4-hour chart reveals the advance in an incomplete internal structural series of a contracting triangle pattern, which currently advances developing its wave (e) of Minuette degree, labeled in blue.

The previous chart presents the price advancing in the wave b of Subminuette degree, identified in blue, which belongs to wave (e), also in blue. According to the Elliott Wave theory, the triangle pattern follows an internal sequence subdivided into 3-3-3-3-3 waves. In this context, and observing its advance in the triangle formation, the cross could develop its latest decline before starting a rally that corresponds to wave ((c)) of Minute degree, labeled in black.

The current downward move, corresponding to wave c, in green, could reach two potential demand zones. The first one is located between 79.468 and 79.237, whereas the second one is seen from 78.878 to 78.394.

Once CADJPY starts to get fresh buyers, the cross could experience a strong rally and test June’s high zone of 81.909.

Finally, the bullish scenario has its invalidation level below the wave (a) of Minuette degree in blue located at 77.585, under the contracting triangle pattern limits.

Categories
Forex Elliott Wave Forex Market Analysis

Is the US Dollar Index Ready for a Bounce?

The US Dollar Index (DXY) advances in the extreme bearish sentiment zone finding an intraday support on Monday’s trading session at 92.016. During this intraday bounce, the price jumped to the extreme bearish zone’s resistance, where the price action started to consolidate. Even considering this intraday recovery, the Greenback accumulates losses of nearly 4.40% (YTD).

Technical Overview

The US Dollar Index, represented in its 8-hour chart, shows the market sentiment’s participants moving within its 90-high and low range, and it reveals the bearish pressure on the Greenback. In this regard, as long as the price keeps moving below 92.663, the short-term trend should stay mostly bearish.

On the other hand, the big picture under the Elliott Wave perspective illustrated in its 8-hour chart reveals the progress in an incomplete corrective formation, which could correspond to a flat pattern.

According to the wave theory, the flat pattern follows an internal sequence subdivided into 3-3-5. In this case, the Greenback should advance in a rally in a wave ((c)) of Minute degree identified in black subdivided into five segments.

An alternative scenario considers the possibility of a triangle pattern (3-3-3-3-3) or a double-three (3-3-3) in progress. However, the structure observed until this point doesn’t allow us to confirm or discard any of these potential Elliott wave formations.

Short-term Technical Outlook

The Greenback in its 4-hour range unveils the completion of the wave ((b)) of Minute degree labeled in black in the demand zone between 92.019 and 91.750, where the price bounced from on Monday’s trading session until 92.800.


Once the price reacted mostly upward, the US Dollar Index began to decline in a wave ii or B of Subminuette degree identified in green. In this regard, a bullish confirmation should lead us to expect further upward movements that could boost the price toward the next supply zone between 93.343 and 93.545.

If the Elliott wave formation corresponds to a Flat pattern, the price could surpass the supply zone level of 94.303 and seek to test the end of wave ((a)) located on 94.742.

On the other hand, we should be aware that a rally in the US Dollar Index implies a potential drop in the pairs against the US Dollar, for example, EURUSD or GBPUSD.

Finally, the return to a  bullish scenario holds its invalidation level at 92.016, which corresponds to the bottom of the first upwards move identified in green.

Categories
Forex Elliott Wave Forex Market Analysis

NZDUSD Reaches a Fresh 90-Day High

The NZDUSD pair ends the last trading week reaching its seventh fresh 90-day range high soaring to 0.69507. This advance brought the Oceanic currency to a close in the extreme bullish sentiment zone. 

Technical Overview

The next chart unveils the NZDUSD pair in its 8-hour timeframe, which shows the market participants’ sentiment in the 90-day high and low range. The figure illustrates the previous 90-day high and low range located at 0.67978 from September 18th. In this regard, the latest rally started on November 02nd created seven fresh 90-day highs.

On the other hand, the EMA(60)-to-Close index shows a bearish divergence that suggests both the bullish trend’s exhaustion and the price’s potential reversion to the moving average. However, a price breakdown and close below the recent lows is needed to confirm the current bullish trend’s correction.

Short-term Technical Outlook

The short-term view of the NZDUSD cross displayed under the Elliott Wave perspective reveals the intraday upward movement advancing in an incomplete Ending diagonal pattern of Minuette degree labeled in blue. Likewise, the advance of the fifth wave in blue should correspond to the ending of the fifth wave of Minute degree identified in black. Nevertheless, the Elliott Wave formation still doesn’t confirm it.

The next4-hour chart reveals the bullish sequence developed by the NZDUSD pair since October 20th when the kiwi found fresh buyers at 0.65555. Until now, the price action advanced in an incomplete upward five-wave sequence, which reached the potential target zone forecasted in a previous analysis.

According to Elliott wave theory, the Ending Diagonal pattern follows an internal sequence subdivided into 3-3-3-3-3 waves. In this context, the previous chart exposes the terminal formation of the bullish impulsive structure advancing in its fifth wave of Subminuette degree labeled in green, which provides two potential scenarios.

  • First Scenario: The price breaks below the base-line that connects the waves ii and iv, confirming the end of the Ending Diagonal pattern and starting a corrective upper degree structure.
  • Second Scenario: The price advances slightly over last Friday’s high and starts to decline below the base-line between waves ii-iv, from where the NZDUSD should begin to develop a correction of upper degree.

In both scenarios, the confirmation of the ending diagonal completion comes from the breakdown and closing below the base-line that connects the end of waves ii and iv.

Finally, the downward scenario will have its invalidation level once the ending diagonal pattern confirms its completion.

Categories
Forex Elliott Wave Forex Market Analysis

GBPJPY Consolidates in the Bearish Sentiment Zone

The GBPJPY cross continues moving by its seventh session in a row in a sideways channel turning in the neutral zone. However, since the last Thursday trading session, the price is consolidating in the bearish sentiment zone.

Technical Overview


The following 8-hour chart illustrates the 90-day high and low range, which exposes the market participants’ sentiment. The figure shows the price action moving around the pivot level at 137.877. Nevertheless, the close below the pivot level pulled the price toward the bearish sentiment zone.

Additionally, the strong bearish rejection in the price action decreasing from the extreme bullish sentiment zone of 140.296 toward the pivot level leads to suspect that the intraday upward movement developed on November 09th couldn’t be as strong as it seemed.

On the other hand, both the positive EMA(60) to Price Index and the 200-period moving average moving below the price, leads to the conclusion that the mid-term sentiment remains on the bullish side. In this regard, the short-term sideways channel’s breakdown could confirm the turning bias from bullish to bearish.

Short-term Technical Outlook

The GBPJPY cross short-term view and under the Elliott Wave perspective reveals the sideways progress in an incomplete corrective sequence that corresponds to wave B of Minor degree labeled in green.

The next 4-hour chart illustrates the advance in a broadening structural series that could correspond to a possible double-three pattern that ended once the price topped at 140.315 on November 11th.

If this scenario is correct, then the pair’s action should be advancing in wave C of Minor degree labeled in green. In this context, the GBPJPY cross should confirm the end of its internal corrective wave corresponding to wave (ii) of Minuette degree identified in blue. In this scenario, the bearish pressure could drag the price toward the end of wave A zone located between levels 133.70 and 133.

The alternative count considers the possibility that wave B of Minor degree remains incomplete and the internal structural series corresponds to a triple-three pattern. In consequence, the current downward move would correspond to the second wave ((x)) of Minute degree. If this scenario is valid, the wave (c) of Minuette degree in blue should have a limited decline, likely until the previous lows located between 135 and 134.

Finally, the invalidation level for both short-term scenarios locates at 140.315, which corresponds to the end of wave ((y)) in black.

Categories
Forex Elliott Wave Forex Market Analysis

Is NZDJPY ready for a New Upward Move?

The Elliott Wave perspective of the NZDJPY pair reveals it is moving in an incomplete impulsive sequence that began on March 18th when the price found fresh buyers at 59.49.

Elliott Wave Landscape

In its 12-hour chart, NZDJPY is seen progressing in its fifth wave of Minute degree labeled in black. Its internal structure reveals a sideways action corresponding to the fourth wave of Minuette degree identified in blue. Looking at this context, the cross would likely develop a new upward movement, which should correspond to the fifth wave of Minuette degree of the fifth wave of Minute degree,  following the Elliott Wave theory.

In this regard, the next movement corresponding to the fifth wave in blue of the fifth wave in black should be a terminal move. However, this potential sequence will not necessarily be an ending diagonal pattern.

On the other hand, as exposed in the previous chart, the third wave of Minute degree corresponds to the extended movement of the complete impulsive sequence of Minute degree. Therefore, under the EW rules, the fifth wave cannot be an extended move.

Finally, considering that the fifth wave doesn’t reveal a reversal formation, the current uptrend is likely to continue mostly bullish.

Short-term Technical Outlook

The short-term Elliott wave outlook for the NZDJPY cross displayed in the following 4-hour chart reveals the incomplete internal sequence that currently appears advancing in its fourth wave of Minuette degree identified in blue. At the same time, the corrective wave in progress is running in wave b of Subminuette degree labeled in green.

Once NZDUSD completes its wave b (labeled in green), it could develop a new decline corresponding to wave c. This intraday downward movement, subdivided into five internal segments, could fail below the latest lows, with its potential support on 71.411, where the NZDJPY cross could find fresh buyers expecting to boost its price toward the potential target zone located between 72.569, even till the psychological barrier at 73.002. This likely decline could be a “bear trap,” the big market participant could use to incorporate their long positions.

On the other hand, looking back in our first 12H chart, considering that the third wave is the extended wave,we can perceive two potential scenarios for the wave (v), in blue.

  • Scenario 1: Wave (v) doesn’t surpass the end of wave (iii) located at 72.791 and starts to decline, unveiling the bearish pressure for the cross. In this case, the price likely would pierce and close below level 71.411.
  • Scenario 2:  Wave (v) exceeds the end of wave (iii). In this case, the bullish pressure continues; therefore, the cross retracement could find support above the recent low located at 71.51.

Finally, the invalidation level corresponding to the intraday bullish scenario is 70.511, corresponding to the end of wave (i) identified in blue.

Categories
Forex Elliott Wave Forex Market Analysis

Is EURGBP Ready for an Elliott Wave Rally?

Technical Overview

The EURGBP cross develops an incomplete Elliott wave correction of Minor degree labeled in green, which began on September 03rd when the price found fresh buyers at 0.88658 and rallied until 0.92916, in where the cross completed its wave A in green. 

The following 4-hour chart illustrates wave B completion.  We see that its internal structure looks like a double-three pattern. This second leg started on 0.92916 on September 11th and ended on November 11th when the price found fresh buyers that boosted the cross in a move that looks like an impulsive intraday rally.

According to the Elliott Wave theory, the double-three pattern is a complex correction that follows an internal structure subdivided into 3-3-3. Likewise, in a corrective formation subdivided into three-wave movements, the segment corresponding to wave C should hold five segments inside it.

On the other hand, considering the Elliott wave theory’s alternation principle, the price likely could advance in an aggressive rally after an extended complex movement.

The cross is advancing in its wave ((ii)) of Minute degree labeled in black that belongs to wave C of Minor degree. In this context, the descending channel’s upper line’s breakout would confirm the potential bullish continuation of wave (iii).

Short-term Technical Outlook

The next 4-hour chart shows the second wave of Minute degree’s internal corrective structure, which could be advancing in its wave (c) of Minuette degree labeled in blue. 

From the previous chart, if the cross finds support in the demand zone located between 0.8917 and 0.8901, opens the likelihood of a new rally corresponding to wave ((iii)), which could advance toward the first supply zone between 0.9126 and 0.91464. The next potential target zone resides between 0.9200 and 0.9218.

On the other hand, both the breakout of the intraday descending trendline that connects the end of waves ((i)) in black and (b) in blue and the surpassing of the end of wave ((i)) will confirm the advance in wave ((iii)) of Minute degree.

Finally, the bullish turning scenario’s invalidation level locates at 0.88610, which corresponds to the origin of wave ((i)).

Categories
Forex Elliott Wave Forex Market Analysis

NZDUSD: Is the Rally Over?

The NZDUSD pair continues consolidating in the extreme bullish sentiment zone, as is revealed on its 8-hour chart. The chart comprises its 90-day high and low range. Currently, the cross remains testing the psychological barrier at 0.6900.

In the previous chart, we can observe the five new highs in the 90-day range reached by the NZDUSD each trading day after the last range maximum, which stood at level 0.67978. This market context leads us to expect a euphoric bullish movement followed by an imminent retracement.

On the other hand, the bearish divergence in the MACD oscillator moves us to recognize the current uptrend’s exhaustion, although it remains in progress.

The next 4-hour chart shows the upward incomplete impulsive sequence, which corresponds to the fifth wave of Minute degree identified in blue that began on October 20th at 0.65555.


Currently, the price action reveals the advance in its fourth wave of Minuette degree labeled in blue. At the same time, we can distinguish the NZDUSD pair’s price running in the wave c of Subminuette degree identified in green. In this context, the intraday decline could lead the price to develop a new short-term rally subdivided into a five-wave sequence.

Short-term Technical Outlook

The short-term Elliott wave view for the NZDUSD pair unfolded in its 4-hour chart foresees further upsides, which could advance to the area between 0.6926 and extend its gains until 0.6972. This upward movement could complete its fifth wave of Minuette degree labeled in blue.

An alternative scenario considers the possibility that the NZDUSD pair could achieve a limited decline to the demand zone between 0.68452 and 0.68281, where the pair could find fresh buyers and complete its fourth wave of Minuette degree identified in blue.

On the other hand, the limited correction corresponding to wave (iv) in blue could advance toward the ascending channel’s base-line, where the cross could find its dynamic support. Once the price finds fresh buyers, the pair may advance on its fifth wave of Minuette degree into five internal segments.

Lastly, the bullish scenario’s invalidation level is at 0.67242, which corresponds to the end of wave (i) of Minuette degree.

Categories
Forex Elliott Wave Forex Market Analysis

Is GBPJPY Brewing a New Decline?

Is GBPJPY Brewing a New Decline?

The GBPJPY cross in its 4-hour chart exposes an upward movement corresponding to an incomplete corrective structural series of Minute degree labeled in black that began at 142.714 on September 01st. In terms of the Wave Theory, the Elliott Wave formation in progress could agree with an incomplete flat pattern. This flat pattern may follow an internal sequence subdivision into 3-3-5 internal waves.

The previous figure shows a corrective rally corresponding to wave ((b)) of Minute degree labeled in black. This structural series shows the breakdown that the GBPJPY cross did after the price found resistance on 140.315. Moreover, the breakdown and consolidation below the intraday upward trendline suggest the completion of the wave ((b)) identified in black.

On the other hand, according to the Elliott Wave Theory, the next move that would correspond to wave ((c)) should follow an internal sequence subdivided into five movements of the Minuette degree labeled in blue.

The current consolidation sequence that is still in progress could correspond to wave (b) of the Minuette degree. However, while the price action doesn’t confirm the breakdown below the low of the November 13th at 137.541, wave (ii) will remain incomplete.

Finally, the wave ((c)) could extend its drops until the short-term ascending trendline that connects the end of waves ((a)) and (b).

Technical Outlook

The intraday Elliott wave view unfolded in the following 2-hour chart illustrates the sideways movement corresponding to an incomplete wave (ii) of the Minuette degree identified in blue. At the same time, the internal structure reveals the price action developing its wave b of Subminuette identified in green.

The previous chart suggests that GBPJPY could develop a limited recovery until the supply zone bounded between 138.65 and 138.965. Likewise, the price action could extend its gains until level 139.32. The cross could find fresh sellers expecting to incorporate their limited short positions with a potential profit target zone of the third wave of Minuette degree in blue locates in the demand zone between 136.45 and 136.03.

The bearish scenario’s invalidation level locates at 140.315, which corresponds to the downward sequence’s origin that remains in progress.


Categories
Forex Elliott Wave Forex Market Analysis

EURCAD Advances in an Incomplete Triangle Pattern

The EURCAD cross reveals a mid-term consolidation formation that looks like an incomplete triangle pattern. This pattern continues in development since March 18th, when the price topped at 1.59914. In this context, this chartist pattern suggests the continuation of the previous movement, in the

The following 12-hour chart depicts the EURCAD action consolidating after a sharp rally, the cross began on February 19th when it found fresh buyers on 1.42637 and ended on 1.59914 on March 18th.

In terms of the Elliott Wave Theory, the corrective pattern presents a three-wave subdivision; the last downward move of Minute degree identified in black began at 1.59791, and current advances in its wave ((c)) in black. Likewise, its internal structure unveils four internal moves of the Minuette degree labeled in blue. 

Considering that the wave ((c)) in blue looks unfinished, the EURCAD cross could develop a new decline corresponding to its fifth wave. On the other hand, the breakout of the line that connects the end of waves (ii) and (iv) should confirm the new upward sequence that could boost the price likely toward the psychological barrier of level 1.59.

Short-term Technical Outlook

The short-term Elliott wave view unfolded in the following 4-hour chart, reveals the incomplete descending wave ((c)) of Minute degree labeled in black, which could start to advance in its fifth internal leg marked in blue.

In this context, the price could decline and found fresh buyers in the demand zone between 1.5471 and 1.5451; it even could extend its retracement to the area of 1.5408 and 1.5389, where the EURCAD cross could start to bounce.

If the price reacts mostly upward and surpasses the supply zone between 1.5538 and 1.5549, the EURCAD bias should start to turn primarily bullish. Likewise, the short-term bullish target can be found in the supply region bounded by 1.5718 and 1.5739.

Finally, if the price penetrates and closes below 1.5312, the bullish scenario will be invalid, and likely, the cross could extend its declines in “free fall.”


Categories
Forex Elliott Wave Forex Market Analysis

Is the EURJPY Ready to Develop a New Decline?

The EURJPY cross advances in a long-term consolidation structure, which began in early December 2016. The short-term Elliott wave view predicts a limited decline in the following trading sessions.

Market Sentiment

The EURJPY cross closed the last trading week, cutting Monday’s session gains when the cross jumped from 122.835 until 125.136, mainly supported by the stock market’s post-election rally.

The following figure shows the EURJPY in its daily timeframe, revealing the mid-term big-market participants’ sentiment exposed by the 90-day high and low range. In this context, the cross is entering into the bearish sentiment zone. However, the 60-day weighted moving average still doesn’t confirm the short-term bearish bias.

After a rally that carried the cross to advance over 11% since May 07th (when the EURJPY bottomed on 114.397 and then soared, reaching the highest level of the year at 127.075 on September 01st), the cross began to retrace, turning its mid-term market sentiment from extremely bullish to bearish.

Nevertheless, the price action still doesn’t confirm the bearish sentiment. In this regard, the short-term sentiment remains neutral until the price confirms the bias.

Technical Overview

The big picture of EURJPY illustrated in the following daily chart exposes a long-tailed yearly candlestick mostly bullish. However, the upper shadow hints at a bearish pressure near the psychological barrier of 127. Moreover, the next resistance is placed at 127.502, which corresponds to the high of 2019.

The EUJPY long-term trend under the Dow Theory perspective and exposed in the next log scale weekly chart reveals the primary trend identified in blue that remains slightly bullish.

At the same time, the secondary trend exposes the sideways movement developing as a pennant pattern, which began in early December 2016 when the price found resistance at 149.787 and could break soon.

According to the classic chartist theory, the pennant pattern is a technical figure that calls for the continuation of the previous movement. In this case, the pennant could resume the rally developed since late July 2012 at 94.114 ended at 149.787 in early December 2014.

Short-term Technical Outlook

The short-term Elliott wave view for EURJPY shows in its 12-hour chart advancing in an incomplete corrective sequence that began on May 06th at 114.397, where it completed its wave A of Minor degree labeled in green.

Once the price found fresh sellers at the highest level of the year, the cross started to advance in its wave B, still in progress. In this context, the previous chart unveils the intraday upward sequence corresponding to the incomplete wave ((b)) of Minute degree identified in black.

The price action could boost the cross until the next supply zone, located between 125.285 and 126.123, where the EURJPY could start to decline in an internal five-wave sequence corresponding to wave ((c)), in black, that may drop to 120.271, though, the price could extend its drops until 117.124.

The short-term bearish scenario’s invalidation level locates above the end of wave A in green at 127.075.

Categories
Forex Elliott Wave Forex Market Analysis

Is GBPUSD Ready for a New Decline?

Overview

The GBPUSD pair advances in an incomplete bearish corrective formation that corresponds to a wave B of Minor degree. In this context, the completion of wave B could lead to a new decline, which could drag the price below Septembers’ low.

Market Sentiment

The GBPUSD pair suffered another drop for the second day in a row, falling from the extreme bullish to a bullish sentiment zone, where it found support in the psychological barrier of level 1.31.

The following daily chart illustrates the 90-day high and low range, revealing the mid-term market participant’s sentiment. The figure shows the price action moving mostly sideways in a range that oscillates between the bearish and bullish sentiment zones; that is, between 1.27204 and 1.32289.

Furthermore, the 60-day weighted moving average is seen moving below the Pound’s price, which confirms the short-term bullish bias that carries the price.

Considering the indecision, the cable is exhibiting since last August. The intraday bias will stay neutral until the GBPUSD pair confirms its next movement, for example, through a breakout.

Technical Overview

The GBPUSD price reveals a yearly long-tailed candlestick that suggests the price will continue being dominated by the upward bias. As exposed in the following 2-day chart, the Pound erased the first 2020 quarter losses that reached up to 13.89%. The cable currently eases 0.67%(YTD).

The big picture of GBPUSD and under the Dow Theory unfolded in the next daily chart illustrates the cable developing a primary upward trend in progress, which currently could be forming a corrective secondary trend.

In this context, according to Dow Theory, the price retraced below 33% of the first upward movement, which accomplishes with the minimum requirement for a correction of the previous move of a similar level.

Nevertheless, considering that the price remains in a short-term downward trend, the price could continue developing a new bearish sequence.

Short-term Technical Outlook

The short-term Elliott wave outlook for GBPUSD unfolded in its 8-hour chart reveals the corrective rally that corresponds to an incomplete wave B of Minor degree identified in green, which leads us to expect a decline in a five-wave sequence for the following trading sessions.


The previous chart exposes a corrective structural series that began on September 01st when the price found fresh sellers at 1.34832 and dragged the cable until 1.26751 on September 23rd, where the pound started to advance in its wave B that remains in progress. 

In this regard, the current upward movement could find resistance in the first supply zone between 1.32069 and 1.32280. If the price extends its previous progression, creating a bull trap, it could climb until 1.33195. There, the price could start to decline in a five-wave sequence corresponding to wave C identified in green.

The potential next wave C could extend until the demand zone between 1.25658 and 1.24796, which corresponds with the mid-term descending channel’s base.

Finally, the bearish scenario’s invalidation level locates at 1.34832, which agrees with the origin of wave A in green. Nevertheless, before positioning on the downward side, the GBPUSD pair should confirm (or discard) the bearish entry. 


Categories
Forex Elliott Wave Forex Market Analysis

AUDNZD Continues Under Bearish Pressure

Overview

The AUDNZD cross remains moving mostly bearish in the bullish sentiment zone. It alters the price surpassing the 1.10 psychological barrier and begins a corrective sequence that remains in progress; however, this downward movement could end soon.

Market Sentiment

The AUDNZD moves mostly downward in the bullish sentiment zone, piercing July’s low area at 1.056. The Oceanic Cross advances over 1.5% (YTD).

The following figure exposes the AUDNZD cross in its daily timeframe. The chart reveals the long-term market participants’ sentiment bounded by its 52-week high and low range. The price action began a downward sequence; after that, the cross surpassed its last 52-week high of June 02nd, located on 1.08807 in a rally that elapsed six sessions in a row.


Moreover, the 60-day weighted moving average confirms the downward short-term bearish bias that favors the price action. Nevertheless, considering that the cross moves in the bullish sentiment zone, the AUDNZD cross’s decline could be a correction of the upward cycle that began last mid-March.

Technical Overview

The AUDNZD cross under the Dow Theory perspective reveals that the price has started to develop a bullish primary trend that began on March 18th when the price found fresh buyers at 0.99906.

The following chart illustrates AUDNZD in its daily timeframe. The figure exposes the demand incorporation below the parity, which carried up the price until 1.10438, from where the price started to decline in a secondary trend.

The retracement developed by the Oceanic cross beyond the 33% leads us to confirm that the latest decline in progress corresponds to the rally’s corrective movement that began on March 18th.

The mid-term Elliott wave view of the AUDNZD cross illustrates in its 12-hour chart the downward move in a complex corrective structure that looks like an incomplete double-three pattern (3-3-3).

The previous chart reveals the price action is moving in its wave (c) of Minuette degree labeled in blue, which belongs to wave ((y)) of Minute degree in black. Likewise, this entire move corresponds to wave 2 or B, which retraces the upward five-wave sequence that began on March 18th at 0.99906.

Technical Outlook

Once the AUDNZD found sellers at 1.07565, the Oceanic cross began its wave (c) of Minuette degree labeled in green that remains in progress.

As illustrated in the following 8-hour chart, the price could extend its declines to the area between 1.05186 and 1.04870, where the price could find support. Likewise, if the price extends its drops below 1.03511, the next movement’s strength could be limited to a re-test of the August 18th high located on 1.103.

On the other hand, if the price action breaks and closes above the supply zone between 1.06456 and 1.06718, there exists the possibility of a new rally. This new bullish leg could surpass the 1.103 mark.

Finally, the invalidation level for the short-term bearish scenario is located at 1.07565.

Categories
Forex Elliott Wave Forex Market Analysis

Is USDCAD Ready for a Short-Term Rally?

The USDCAD pair reveals a strong bearish movement that seems have found a short-term bottom. In this regard, the price could start a rally that could boost the price toward October’s highs zone.

Market Sentiment

The USDCAD pair continues moving in its extreme bearish sentiment zone, erasing the gains reached during the first quarter of the year when the price advanced over 13%. Currently, the Loonie gains a modest 0.67% YTD.

The next figure illustrates the USDCAD pair in its daily timeframe. The chart exposes the long-term market participants sentiment bounded by the 52-week high and low range. 

The chart reveals the price action continues developing fresh lower lows, which leads us to observe that market participants continue holding bearish positions on the pair. Furthermore, the 60-day weighted moving average continues above the price, which confirms the bearish bias that advances the price.

On the other hand, as long as the USDCAD price remains below 1.33631, the Loonie will stay under bearish pressure.

Technical Overview

The USDCAD pair exposes a bearish reversal formation that erased the progress developed during the first quarter of the year. The following weekly chart reveals a powerful bearish long-tailed candle in terms of a yearly candlestick, suggesting that the price would continue developing more declines in the long-term.


On the other hand, the big picture exposes a long-term sideways formation that persists since mid-2015. Likewise, the last downward movement that began at 1.46674 appears to have found a bottom on 1.29238 the current trading week. 

In this regard, if the price starts to develop a corrective rally, according to the Dow Theory, the USDCAD pair should advance to 1.35022 and up to 1.40761; this upward sequence would correspond to a valid correction of the same degree that the last bearish move developed by the pair since last mid-March.

The mid-term Elliott wave view of USDCAD illustrated in the next 12-hour chart reveals an incomplete corrective sequence that looks like a double three pattern (3-3-3) of Minor degree labeled, in green, which began on March 18th at 1.46674.

Currently, the USDCAD develops its wave ((b)) of Minute degree identified in black, which belongs to wave Y in green. In this context, the wave ((b)) looks like an incomplete flat pattern (3-3-5), which subdivides into a 3-3-5 sequence. Moreover, the actual structural series suggests that the Loonie started to develop its wave (c) of the Minuette degree labeled in blue. 

Short-term Technical Outlook

The short-term Elliott wave view of the USDCAD unfolded in the following 8-hour chart, anticipates its progress in an incomplete flat pattern, which could be starting to advance on its wave (c) of Minuette degree labeled in blue.

If the Loonie find fresh buyers in a retracement to the demand zone between 1.30433 and 1.30086, and the price breaks and closes above 1.31473, then the price could confirm the potential rally that corresponds to wave (c) of Minute degree with a potential target in the supply zone between 1.33970 and 1.34592.

Lastly, the invalidation level for the intraday bullish scenario locates at 1.29283

Categories
Forex Elliott Wave Forex Market Analysis

Euphoric Market’s Sentiment Pushes GBPCHF Up

Overview

The GBPCHF cross began the current trading week, advancing over 1.30%, boosted by the U.S. post-election rally and Pfizer’s Covid vaccine upbeat results. However, the Elliott Wave view anticipates that the euphoric rally could soon end, and the cross could reverse its course toward new lows.

Market Sentiment

The week started with a risk-on U.S. Presidential post-election stock market rally, driving the risk-off currencies to drop. In this context, the GBPCHF cross advances over 1.30% to its highest level since late September.

The following 8-hour chart displays the intraday market sentiment. Although the sideways movement predominates since late September, the strong bullish move developed in the Monday trading session takes the GBPCHF cross to the extreme bullish sentiment zone.

Likewise, we can see the price action developing above the 60-period weighted moving average, which confirms the intraday upward bias that could hold during the following trading sessions.

On the other hand, the euphoric sentiment bolstered by news media’s coverage of the U.S. elections and the continuation of the stock market rally added to the news of the promising vaccine results developed by Pfizer and BioNTech leads us to expect a limited upside in the risk-on currencies.

Technical Overview

The big picture of the GBPCHF under the Elliott wave perspective reveals its progress in a descending broadening formation. Its latest downward sequence began on December 13th, 2019, when the price found fresh sellers at 1.33113. We can see, as well, that this leg still remains in progress.

The following daily chart unveils the advance in the fifth wave of Minute degree labeled in black, which started on 1.22224, where the price action declined in a bearish impulsive movement reaching a new lower low. This decline that ended on 1.15989 completed the first wave of Minuette degree labeled in blue.

Currently, the GBPCHF cross moves in its second wave (in blue). Nevertheless, the psychological barrier of 1.20 could represent a significative intraday resistance.

Technical Outlook

The intraday outlook of the GBPCHF cross reveals the bullish continuation of the current upward momentum. The next 2-hour chart exposes the supply and demand zones according to the potential next move that the cross could develop in the coming trading sessions.

On the one hand, the price advances in its wave c of Subminuette degree identified in green, developing the third internal wave. Likewise, the retracement that should correspond to its fourth internal wave could retrace to the area between 1.19292 and 1.19694. This zone could back the possibility of a new rally that would boost the price toward 1.21012 and 1.21306. 

On the other hand, our first scenario considers the bearish continuation. In this case, if the price action penetrates and closes below 1.1803, the cross could see further declines toward the zone of 1.1650.

Finally, our second scenario considers that if the GBPCHF cross continues its advance beyond 1.22224, the cross could extend its gains toward the descending upper- trendline shown in the daily chart.

Categories
Forex Elliott Wave Forex Market Analysis

AUDJPY Could Develop a Limited Upside

Overview 

The AUDJPY cross advances in an incomplete upward sequence that belongs to a corrective structural series backed by Monday’s trading session’s euphoric sentiment. The Elliott Wave view unveils the likelihood of a limited upside before resuming its declines.

Market Sentiment

The AUDJPY cross retraces on the overnight Tuesday trading session after the surprising weekly kick-off, which jumped the price over 2.2%, climbing until 77.037, its highest level since September 18th.

The AUDJPY 8-hour chart illustrates the 30-day high and low range, which exposes the participants’ intraday market sentiment. The figure distinguishes the price action consolidating in the extreme bullish sentiment zone, backed by the stock market’s euphoric rally on Monday’s trading session.

The breakout of the last 30-day high of 76.274 during Monday’s trading session raised the participants’ extreme bullish sentiment, expecting further upsides on the cross. Moreover, we see that the price action remains above its 60-period linear weighted moving average, which confirms the bullish bias on the AUDJPY.

Nevertheless, the AUDJPY found resistance below mid-September’s consolidation zone. This market context expects a significative retracement or a consolidation movement before continuing the rally experienced in Monday’s session. Finally, a retracement below the 75.087 level would turn the market sentiment from bullish to bearish.

Technical Overview

The AUDJPY cross advances in an incomplete upward bullish sequence of a lower degree, which belongs to a descending structure that began on August 31st when the price topped on 78.462.

The below 8-hour chart exposes the price action running in an upward wave ((b)) of Minute degree labeled in black, which currently advances its fourth wave of Minuette degree identified in blue. Likewise, according to the Dow Theory, considering that the AUDJPY cross advanced over 66% of the bearish decline, the price should develop a bearish connector corresponding to wave ((b)).

In this context, following the Elliott Wave theory and considering the third internal segment of the intraday rally, the price could produce a limited upside toward the supply zone bounded between 77.295 and 77.497. Finally, the bearish divergence on the MACD oscillator may mean a confirmation of the upward movement’s exhaustion corresponding to wave ((b)).

Short-Term Technical Outlook 

The incomplete bullish sequence of the AUDJPY cross unfolded in its 4-hour chart exposes the progress in its fourth wave of Subminuette degree labeled in green. Likewise, considering that the third wave is the extended wave of wave (c), the fifth wave in green should not be extended.

On the other hand, considering that the second wave in green is a simple correction, the fourth wave should elapse more time than the second wave. Additionally, the fifth wave in green could extend itself between 77.140 and 77.654. The price could find fresh sellers expecting to open their shorts on the bearish side of wave ((c)) of Minute degree labeled in black. The invalidation level of the bearish scenario locates at 78.462. 


Categories
Forex Elliott Wave Forex Market Analysis

GBPCAD Advances in a Double-Three Pattern

Overview

The GBPCAD cross advances in a sideways sequence corresponding to an incomplete double-three pattern. The mid-term Elliott Wave view foresees a potential rally that could boost the cross toward last March’s highs.

Market Sentiment

The mid-term market sentiment overview of the GBPCAD cross unfolded by the 90-day high and low range and illustrated in its daily chart, reveals the price action moving in the bearish sentiment zone (SZ).

The previous chart reveals the sideways movement bounded between the extreme bullish SZ located at 1.76759 and the extreme bearish SZ at 1.69214. Likewise, the 60-Day moving average looks flat, suggesting the balance between supply and demand, or bull and bear traders, which in turn, is indicative of sideways action.

On the other hand, considering the year’s opening price at 1.71923, we distinguish that the yearly candlestick pattern corresponds to a narrow body candle identified as a doji, revealing the next direction’s market participants’ indecision that the price will take.

In consequence, while the GBPCAD cross remains moving mostly sideways, the primary bias will continue neutral.

Elliott Wave Overview

The long-term Elliott Wave landscape of the GBPCAD cross reveals the price action is developing an incomplete three-wave sequence of Intermediate degree labeled in blue, which currently advances its wave (B). The internal structure unfolds in a double-three pattern as it exposes the next weekly chart on a log scale.

The previous chart reveals that the double-three pattern in progress looks incomplete. According to the Elliott wave theory, this complex formation follows an internal structural series subdivided as 3-3-3. In this context, the GBPCAD cross advances in its last “three” or the third component of the double-three pattern identified as wave Y of Minor degree labeled in green.

The internal structure of wave Y subdivided into another “three” sequence, which advances in its wave ((b)) of Minute degree labeled in black. Likewise, the wave ((b)) follows the arrangement of a triangle pattern. Thus, the GBPCAD cross should develop an upward movement subdivided into five-waves, corresponding to its wave ((c)) of Minute degree identified in black.

Elliott Wave Outlook

Considering the progress of the GBPCAD cross into a triangle pattern, the following 12-hour chart unveils that the price completed its wave ((b)) with the failure of reaching a new lower low at 1.69014, where the cross began to advance in an upward sequence that corresponds to its wave ((c)) of Minute degree identified in black.

The previous chart illustrates the end of the wave (e) of Minuette degree identified in blue and the upward sequence of a potential leading diagonal pattern, which could follow a 5-3-3-3-3 internal sequence. Simultaneously, the price seems to be advancing in its fifth wave of Subminuette degree labeled in blue, which belongs to the first wave of Minuette degree in blue. 

The first impulsive wave of Minuette degree could find resistance in the supply zone between 1.73665 and 1.74341, from where the cross could start to retrace until the demand zone is located between 1.71151 and 1.70262. Once GBPCAD completes its second wave, the third wave could become the upward cycle’s extended wave. This upward movement could drive the pair toward 1.77356 and continue until 1.79911.

The bullish scenario’s invalidation level locates at 1.69014, which coincides with the wave’s origin ((c)) that remains in progress.

Categories
Forex Elliott Wave Forex Market Analysis

Can EURUSD Re-Test the Level 1.20?

The EURUSD pair advances in an unfinished impulsive formation that raised the common currency from 1.06359 till 1.20114. The price action started to develop a corrective sequence, still progressing, corresponding to its fourth wave of Minor degree. Explore with us what should be the target of the fifth impulsive wave.

Market Sentiment

The long-term market sentiment of the EURUSD pair based on the 52-week high and low range unveils the price moving in the extreme bullish zone. 

The following daily chart illustrates the common currency moving above the 60-day linear weighted moving average, confirming the extreme short-term upward bias prevalent in the current price action.

Likewise, the consolidation formation bounded between 1.16121 and 1.18566, appearing after the rally from mid-May to early September, leads us to anticipate the take-profit activity of big market participants. In other words, the price could begin a new movement toward the 52-week high zone, creating a euphoric sentiment for the euro before developing a corrective move.

Elliott Wave Overview

 EURUSD pair’s long-term outlook under the Elliott Wave perspective reveals the upward advancement of the common currency in an unfinished impulsive wave, which currently progresses in its fourth wave of Minor degree, suggesting further highs.

The following daily chart exposes de uptrend developed by the EURUSD since the March 23rd low located at 1.06359, where the price found fresh buyers, who remain in control of the long-term uptrend.

The Elliott Wave point of view illustrates the EURUSD pair developed and completed a third extended wave of Minor degree labeled in green when the price reached 1.20114 on past September 01st. Once the common currency found resistance at 1.20114, the EURUSD started to develop its fourth wave of Minor degree identified in green.

Considering that the second corrective wave was simple in terms of price and time, by the alternation principle of the Elliott Wave theory, the fourth wave should be a complex correction. In this regard, the complexity could be in terms of price, time, or both.

If the correction were complex in price, the formation could be a flat pattern like an irregular flat. If the complexity were in terms of time, the corrective pattern could be a triangle formation. Finally, if the correction develops a combination of price and time complexity, the structural series could be a double three or a triple three pattern.

Short-term Elliott Wave Outlook

Once the fourth wave ends, the common currency should advance in its fifth wave, shown in green in the following chart. Considering that the third wave is the extended wave, two potential scenarios exist for the fifth wave target.

The first scenario considers the advance slightly higher than the top of the third wave, which could reach the area between 1.2065 and 1.2257.

The second scenario may arise if the fifth wave’s bullish pressure fails and finds resistance in the supply zone, which is located between 1.19361 and 1.20114.

To conclude, the invalidation level corresponding to this bullish scenario is a close below 1.11639.

Categories
Forex Forex Elliott Wave Forex Market Analysis

Is CADJPY Ready for a New Rally?

Overview

The CADJPY cross advances mostly sideways in an incomplete triangle pattern. The corrective structure that remains in progress suggests the possibility of further upsides in the coming trading sessions.

Market Sentiment

The market sentiment on the CADJPY cross looks neutral, although during the overnight trading session, although the US presidential election is driving up volatility.

The following daily chart shows the long-term market participants’ sentiment unfolded between the 52-week high and low range. The figure reveals the price action currently moving on the neutral zone, which moves near the level of 79.274. 

In this context, the neutral sentiment is confirmed by the sideways channel, which began in early June, and the price action moving below the 60-day moving average Nevertheless, the bullish wide range candle of November 02nd leads to expect further upsides in the following weeks.

Technical Big Picture

The CADJPY cross moves in a sideways upward structure that belongs to an incomplete upward sequence that began last March 17th when the price found fresh buyers at 73.803.

The 2-day chart shown below illustrates the big picture of CADJPY under the Elliott Wave analysis perspective. The figure reveals the pair’s action advancing in an incomplete third wave of Minute degree labeled in black.

The consolidation structure of the CADJPY cross, in progress, suggests the possibility of a bullish continuation. Likewise, in terms of the Elliott Wave theory, if the current upward sequence corresponds to an incomplete impulsive sequence, the price could develop an extended wave. Nevertheless, a signal of confirmation of the potential new rally will occur if the price breaks and closes above the pivot level located at 79.823.

The short-term supports and resistance levels are as follows:

  • Resistance 1: 80.542
  • Resistance 2: 81.448
  • Resistance 3: 82.634

Pivot Level: 79.823

  • Support 1: 78.502
  • Support 2: 77.573
  • Support 3: 76.526

Short-term Technical Analysis Outlook

The CADJPY cross in its 4-hour chart unveils the course in a corrective structure that resembles a triangle pattern (subdivided into 3-3-3-3-3). This potential triangle pattern remains unfinished and could be developing its wave (d) of Minuette degree labeled in blue.


From the previous chart, both the breakout and close above the descending trendline connect the top of wave (b) of Minuette degree with the end of wave b identified in green as the close above the level 79.872 could confirm the turning bias from neutral to bullish.

The advance in its wave (d) identified in blue could find resistance between 81.448 and 81.909. Once the potential triangle pattern completes, the price could advance toward 84.739 and even extend its gains until 86.677.

Finally, the upward scenario’s invalidation level is located below the end of wave (a) of the Minuette degree labeled in blue.

Categories
Forex Elliott Wave Forex Market Analysis

EURJPY: Can we Profit Short-Term?

Overview

The EURJPY cross advances in a corrective sequence that began on September 01st; this corrective movement looks incomplete. The short-term Elliott wave outlook foresees a limited recovery prior to its a coming decline corresponding to its fifth wave.

Technical Big Picture

The EURJPY cross, in its 12-hour chart, illustrates an incomplete downward sequence that began on September 01st when the price found fresh sellers at level 127.075. 

The previous figure exposes an upwards structural series subdivided into three-wave identified in Minute degree and labeled in black, which began on the May 06th low located at 114.397 and ended on the September 01st high when the price topped 127.075. 

Once the price found fresh sellers at 127.075, the cross started to retrace, developing a three-wave sequence identified in the Minuette degree labeled in blue. Until now, wave (c) doesn’t show bullish reversal signals, which lead us to expect further declines.

The short-term key supports and resistance levels are as follows:

  • Resistance 1: 123.160
  • Resistance 2: 124.233
  • Resistance 3: 124.999
  • Pivot Level: 122.377
  • Support 1: 121.144
  • Support 2: 120.271
  • Support 3: 119.311

Technical Outlook

The short-term outlook for EURJPY illustrated in its 3-hour chart reveals the intraday consolidation, which coincides with the progress of its fourth wave of Subminuette degree labeled in green.

In this regard, the market participants could mostly drive the price toward the supply zone between 122.550 and 122.890, from where the EURJPY cross could start developing the next decline corresponding to its fifth wave identified in green.

The potential target zone of the next decline locates between 121.038 and 120.051, which coincides with the base-line of the descending channel that extends from the September 01st high to date. 

Finally, the invalidation level of the downward scenario locates at 123.402.

Categories
Forex Elliott Wave Forex Market Analysis

Hang Seng Moves in an Incomplete Flat Pattern

Overview

The Hang Seng Index continues advancing mostly sideways in an incomplete bearish sequence, corresponding to a flat pattern sequence, still in progress. Once the current corrective formation ends, the Chinese benchmark will likely start developing a new long-term bullish cycle.

Market Sentiment Overview

The Chinese benchmark Hang Seng Index (HSI) shows a drop of over 12% (YTD). However, even when it has recovered 16 percent from the lows reached after the massive sell-off occurred during the first quarter of the year, the market sentiment of the Chinese benchmark index continues dominated by the bearish side. 

In the following Hang Seng’s daily chart, we can spot its 90-day high-low range. The figure exposes the index developing in a sideways movement happening since the second quarter of the year. On the other hand, the rejection of the 24,953.4 points suggests that the mid-term market sentiment is slightly bearish. 

Besides, considering that the Hang Seng Index moves on the 60-day weighted moving average, a short-term upward pressure is observed.

In conclusion, the Chinese benchmark’s market sentiment seems neutral, waiting for the price action to unveil the next trend’s direction.

Elliott Wave Outlook

Under an Elliott Wave perspective, Hang Seng’s big picture reveals the incomplete corrective movement from the end of a bullish cycle the Hang Seng Index initiated in mid-February 2016 from 18,278.8 pts. This bullish sequence ended its five-wave structural series when the Chinese benchmark reached its all-time high of 33,484.1 pts in late January 2018.

The next figure illustrates the HSI log chart on a 2-day timeframe. The price pattern reveals the Chinese benchmark moving mostly bearish on its wave (C) of intermediate degree labeled in blue, which seems incomplete. In this context, although HSI reached the minimum requirement for this movement: 100% of equal waves between waves A and C, the internal structure of its C wave is unfinished.

The following 4-hour chart exposes the internal structure of wave 4. We distinguish that the corrective structure has created two Minute degree segments, labeled in black on the figure. Considering that each leg follows an internal sequence subdivided into three waves, the Elliott Wave Theory leads us to expect its progression on a regular flat pattern.

On the other hand, short-term, the Hang Seng Index could develop a new upward movement subdivided into a five-wave sequence, which should complete the ((c)) wave of Minute degree labeled in black. Once this move ends, the Chinese benchmark could develop a new decline corresponding to a wave 5 of Minor degree, which should complete the (C) wave of Intermediate degree.

Finally, considering that the third wave of Minor degree labeled in green was the extended move, and considering the amplitude of wave 4, the fifth wave of Minor degree should not penetrate below the low of wave 3 located at 21,139.3 pts. In other words, the wave (C) of Intermediate degree identified in blue is likely not to end below 21,139.3 pts.