Categories
Forex Daily Topic Forex System Design

Trading Algorithms IX – RSI Failures System

Trading the naked RSI system depicted in this series’s previous video as an overbought/oversold signal generator is too risky, and its long-term results questionable. The system is profitable only in sideways movements. Thus, a trending filter or a detrending step will be needed to avoid the numerous fake signals.

Divergences and Failure swings

Welles Wilder remarks on two ways to trade the RSI: Divergences and Top/Bottom failure swings.

Divergences

A divergence forms when the price makes higher highs (or lower lows), and the RSI makes the opposite move: lower highs (or higher lows). RSI divergences from the oversold area show the market action starts to strengthen, an indication of a potential swing up. In contrast, RSI divergences in the overbought area show weakness and a likely retracement from the current upward movement.

Failures

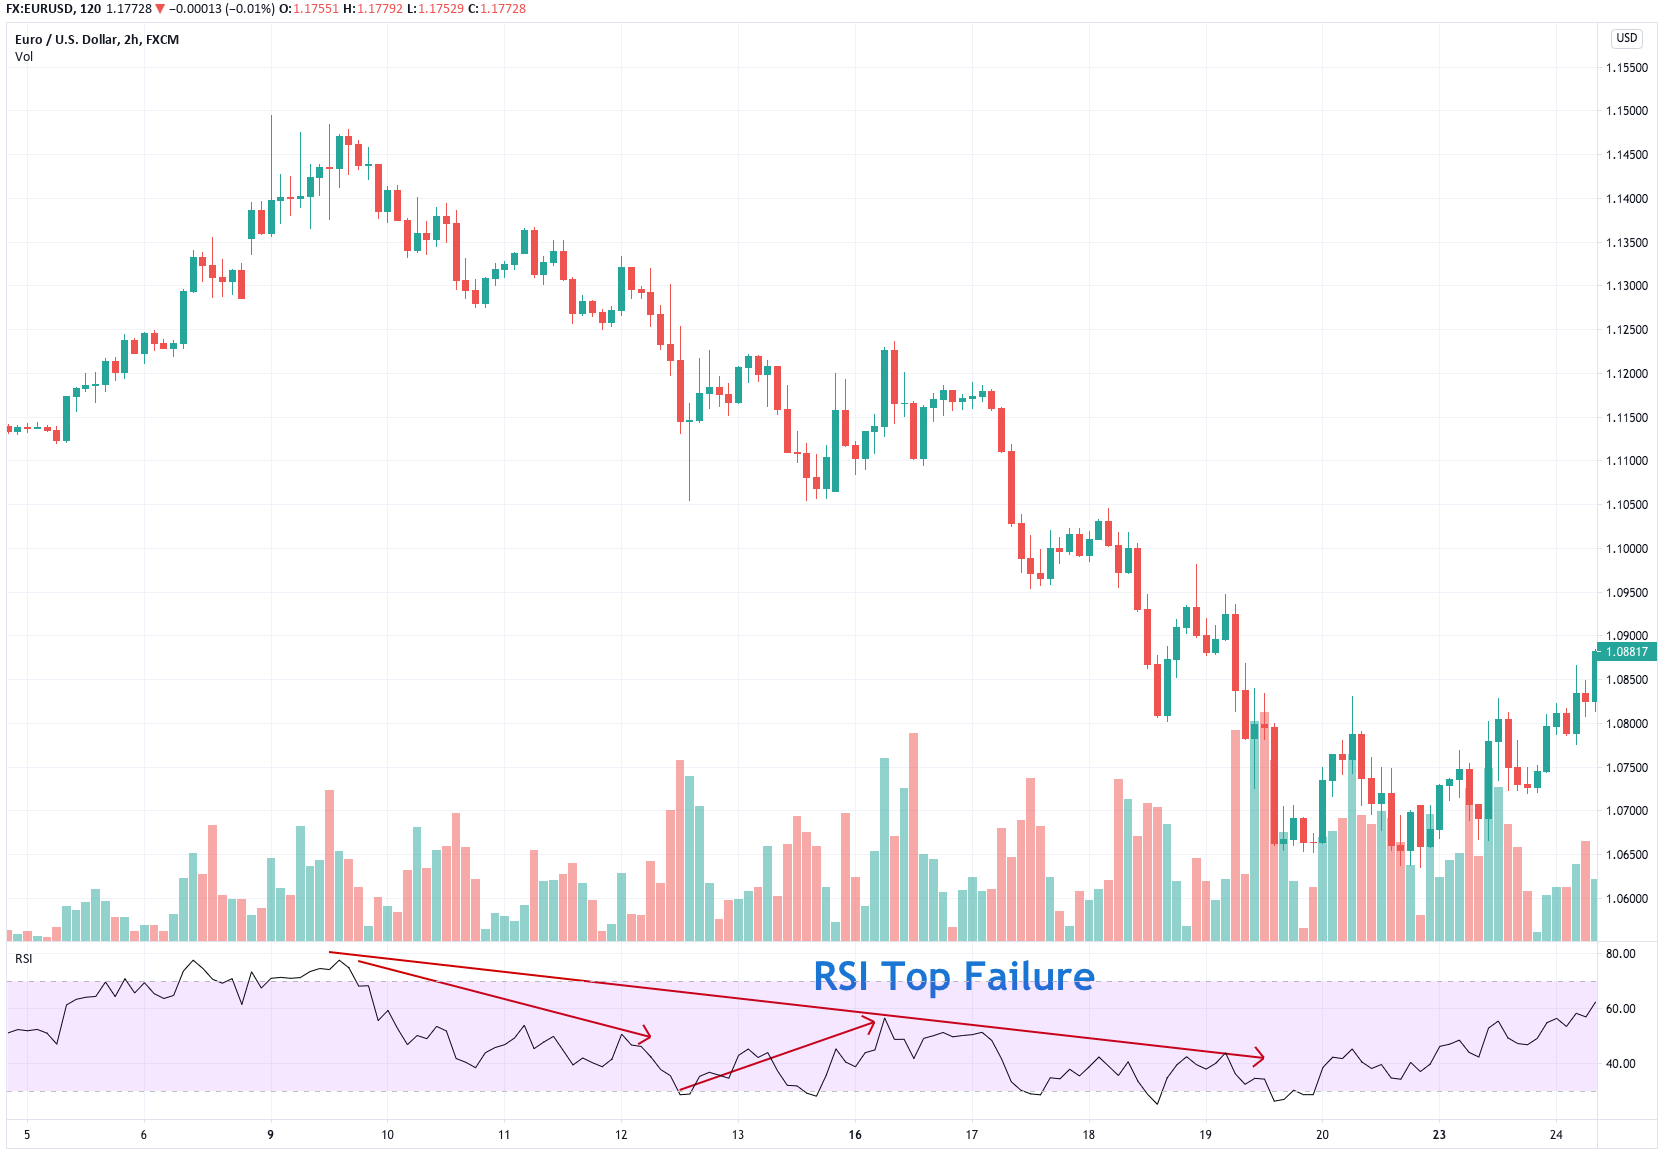
An RSI Top failure occurs with the following sequence of events:

  1. The RSI forms a pivot high in the overbought area.
  2. An RSI pullback occurs, and an RSI pivot low forms.
  3. A new RSI pivot high forms, which is lower than the previous pivot high

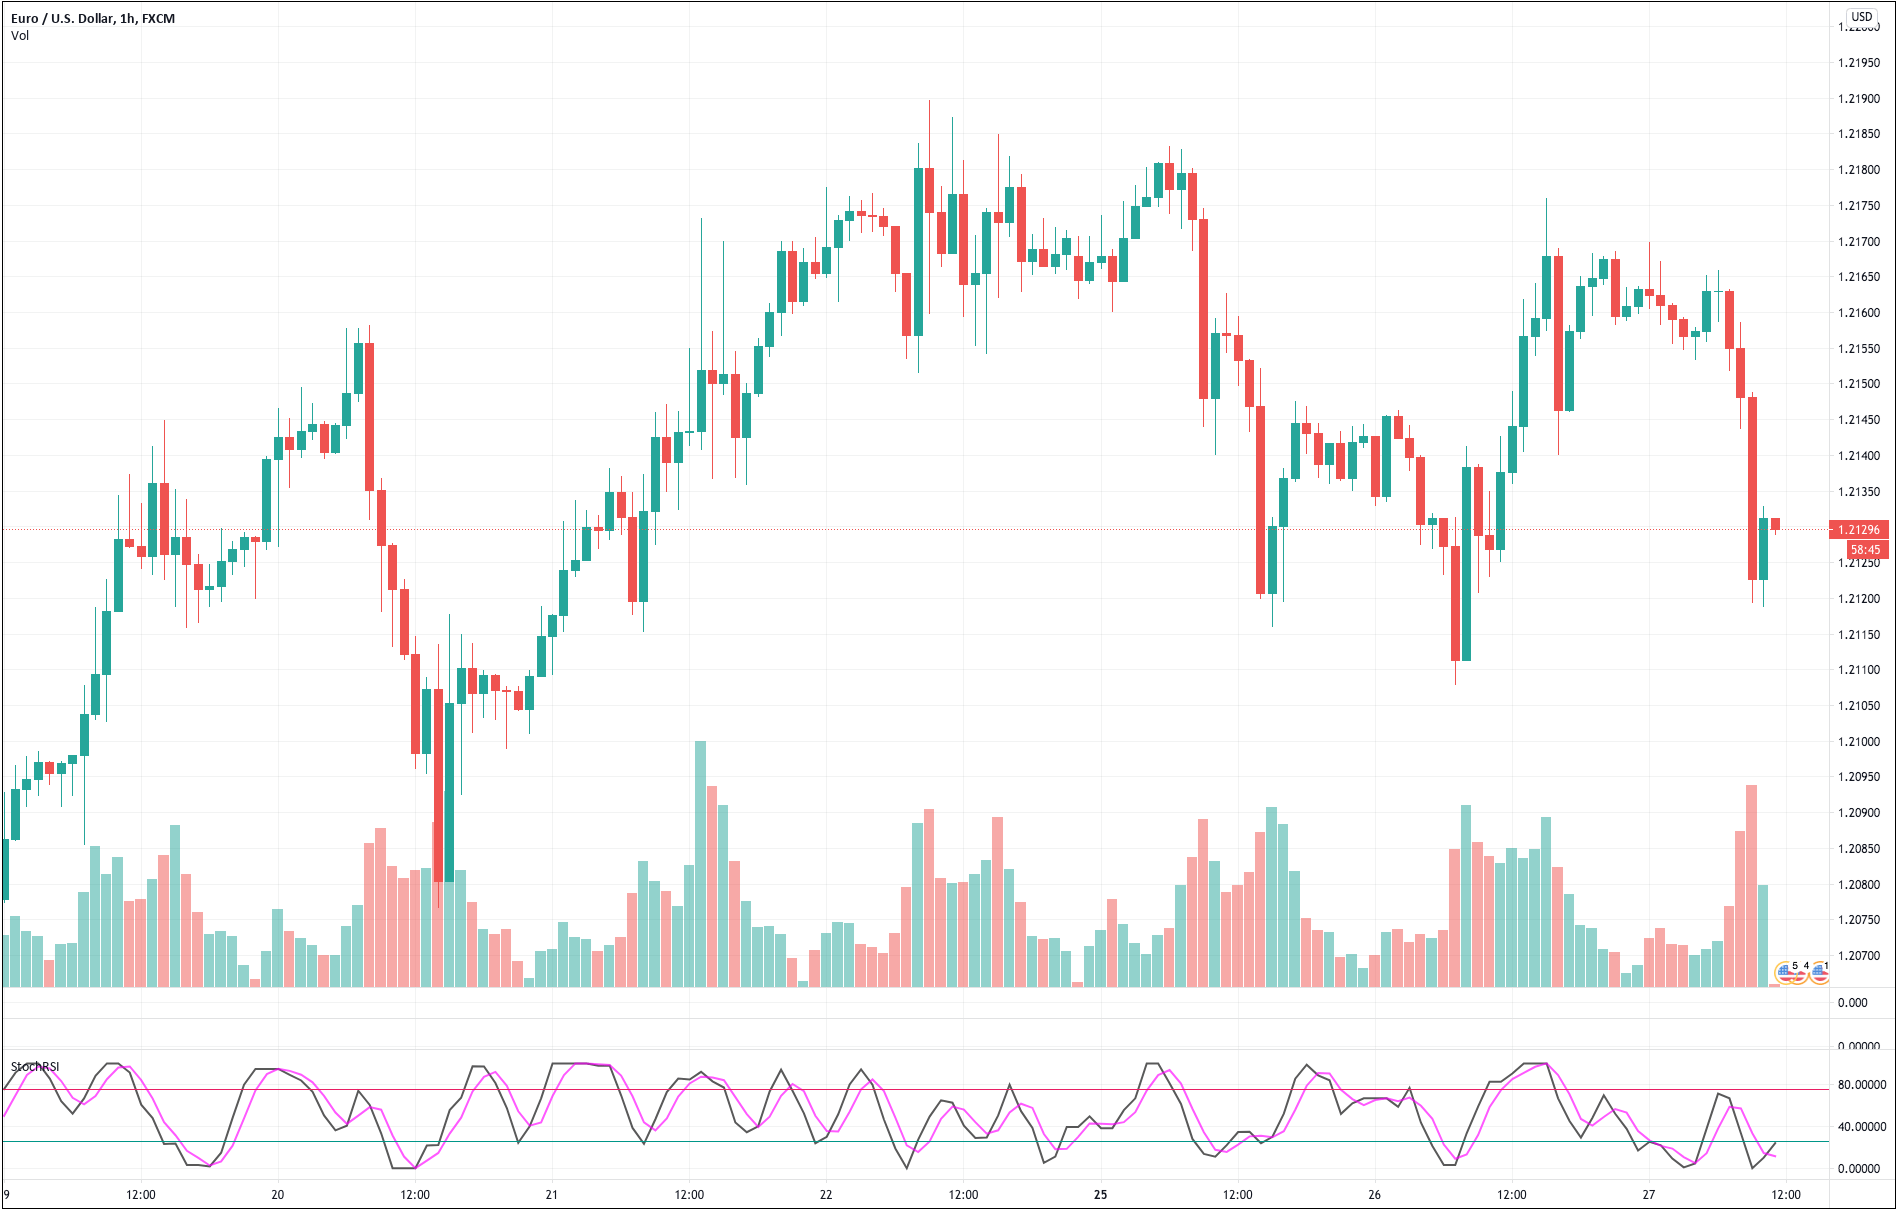
Fig 1 – RSI TOP failures in the EURUSD 4H 2H Chart

An RSI Bottom failure occurs with the following sequence of events:

  1. The RSI forms a pivot low below the oversold area.
  2. An RSI pullback occurs, and an RSI pivot high forms.
  3. A new RSI pivot low forms, which is higher than the previous pivot high.
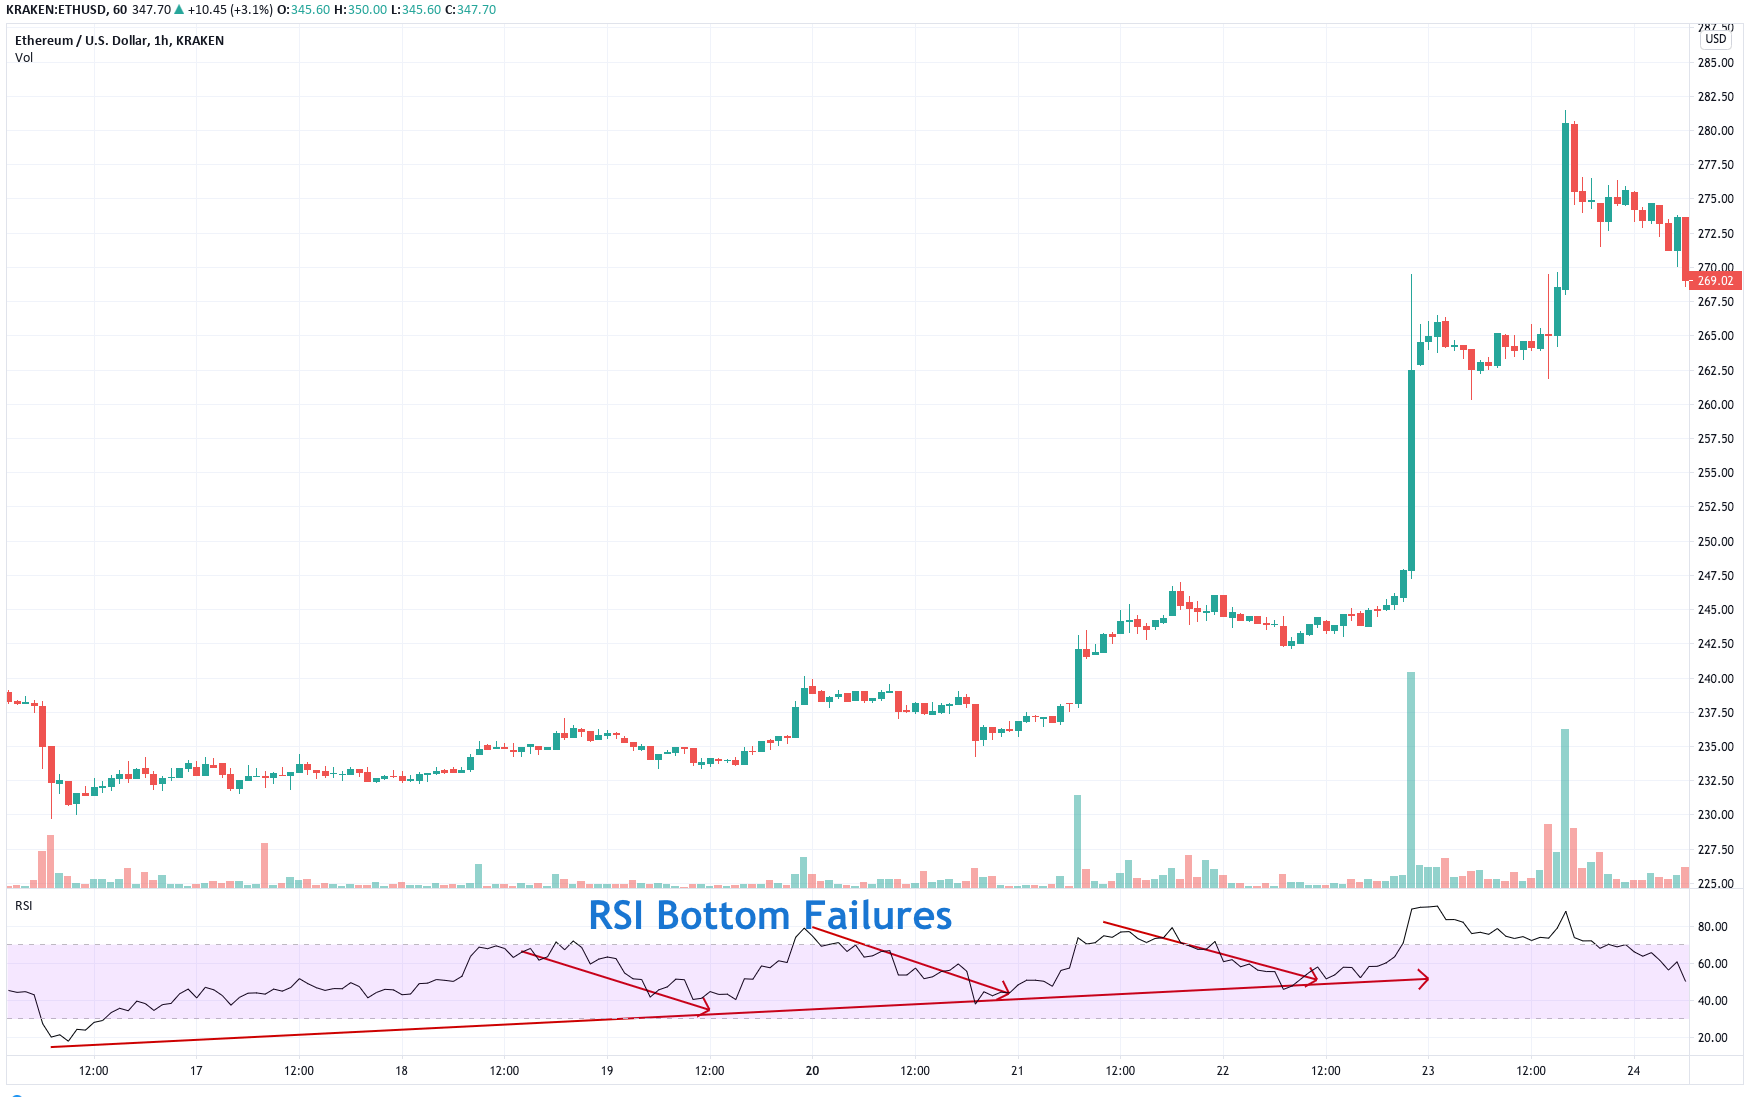
Fig 2 – RSI Bottom failures in the ETHUSD 1H Chart.

According to Welles Wilder, trading the RSI failure swings can be more profitable than trading the RSI overbought-oversold system. Thus, we will test it.

The RSI Failure algorithm

To create the RSI Failure algorithm, we will need to use the Finite State Machine concept, presented in this series’s seventh video.

The Easylanguage code of the RSI system failure is the following:

inputs:  Price( Close ), Length( 14 ), OverSold( 30 ), Overbought( 70 ), 
takeprofit( 3 ), stoploss( 1 ) ;
variables: state(0), state1 (0), state2(0), state5 (0), state6(0), rsiValue(0),
 var0( 0 ), rsi_Pivot_Hi(0), rsiPivotHiFound(False), 
rsiPivotLoFound (False),rsi_Pivot_Lo(0)  ;

rsiValue = RSI(C,Length);

If rsiValue[1] > rsiValue and rsiValue[1] > rsiValue[2] then
      begin
         rsiPivotHiFound = true;
         rsi_Pivot_Hi= rsiValue[1];
     end

else
     rsiPivotHiFound = False;

If rsiValue[1] < rsiValue and rsiValue[1] < rsiValue[2] then
      begin
         rsiPivotLoFound = true;
        rsi_Pivot_Lo = rsiValue[1];
     end

else
     rsiPivotLoFound = False;

If state = 0 then
      begin
        if rsiPivotHiFound = true and rsi_Pivot_Hi> Overbought then
             state = 1    {a bearih setup begins}
     else
           if rsiPivotLoFound = True and rsi_Pivot_Lo < OverSold then
                 state = 5; {a bullish Setup begins}
     end;

{The Bearish setup}    

If state = 1 then
      begin
         state1 = rsi_Pivot_Hi;
         if rsiValue > state1 then state = 0;
         if rsiPivotLoFound = true then
             state = 2;
     end;
    
If state = 2 then
      begin
         state2 = rsi_Pivot_Lo ;
         if rsiValue > state1 then state = 0;
         if rsiPivotHiFound = true then
         if rsi_Pivot_Hi< 70 then state = 3;
     end;

If state = 3 then
     if rsiValue < state2 then state = 4;

If state = 4 then
      begin
        sellShort this bar on close;
        state = 0;
     end;


{The bullish setup}

If state = 5 then
      begin
       state5 = rsi_Pivot_Lo;
       if rsiValue < state5 then state = 0;
       if rsiPivotHiFound = true then
             state = 6;
     end;


If state = 6 then
      begin
         state6 = rsi_Pivot_Hi;
         if rsiValue < state5 then state = 0;
         if rsiPivotLoFound = true then
             if rsi_Pivot_Lo > OverSold then state = 7;

     end;
           

If state = 7 then
     if rsiValue > state6 then state = 8;

 If state = 8 then
      begin
         buy this bar on close;
         state = 0;
     end;
   

If state > 0 and rsiValue < OverSold then state = 0;
If state > 0 and rsiValue > Overbought then state = 0;    

{The Long position management section}

If marketPosition =1 and close < entryprice - stoploss* avgTrueRange(10) then
    sell this bar on close;

If marketPosition =1 and close < entryPrice + takeprofit* avgTrueRange(10) then
    sell this bar on close;


{The Short position management section}


If marketPosition =-1 and close > entryprice + stoploss* avgTrueRange(10) then
     BuyToCover this bar on close;

If marketPosition =-1 and close < entryPrice - takeprofit* avgTrueRange(10) then
     BuyToCover this bar on close;

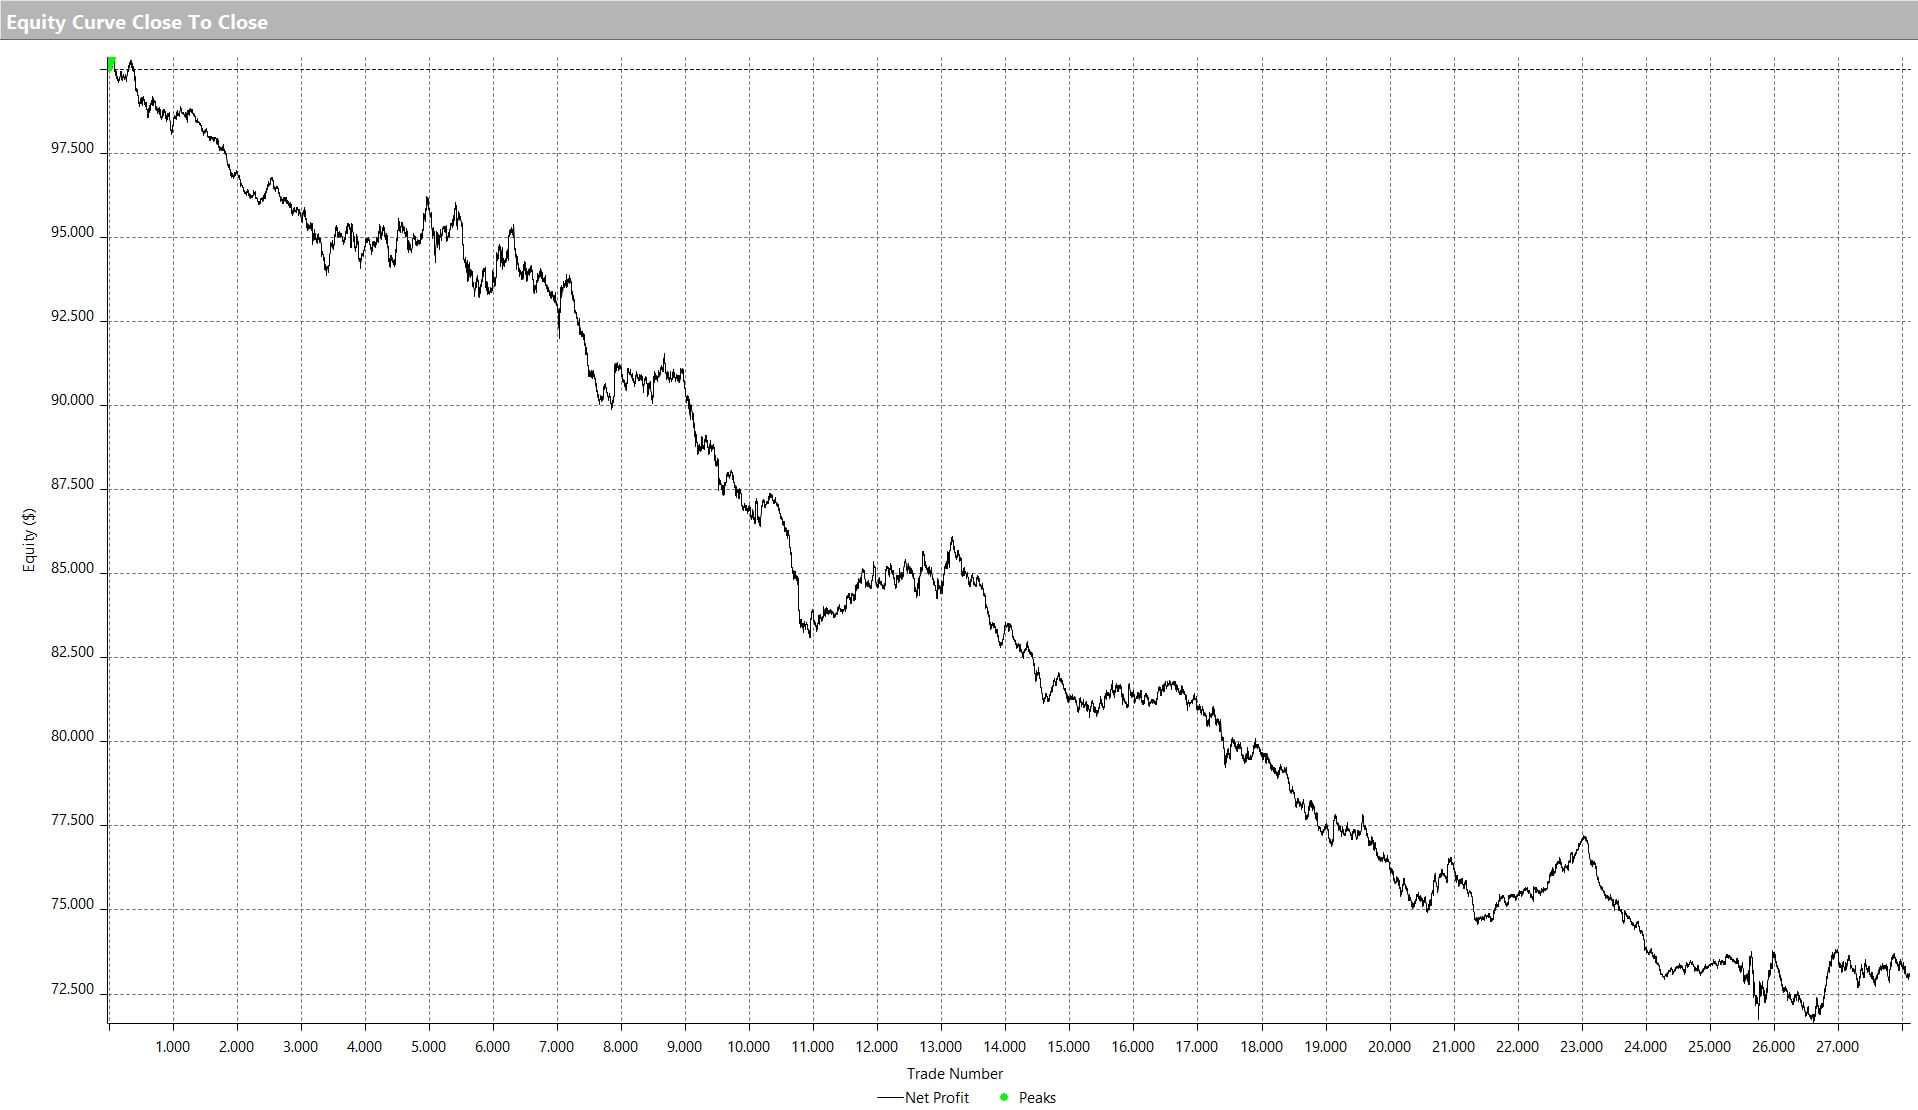
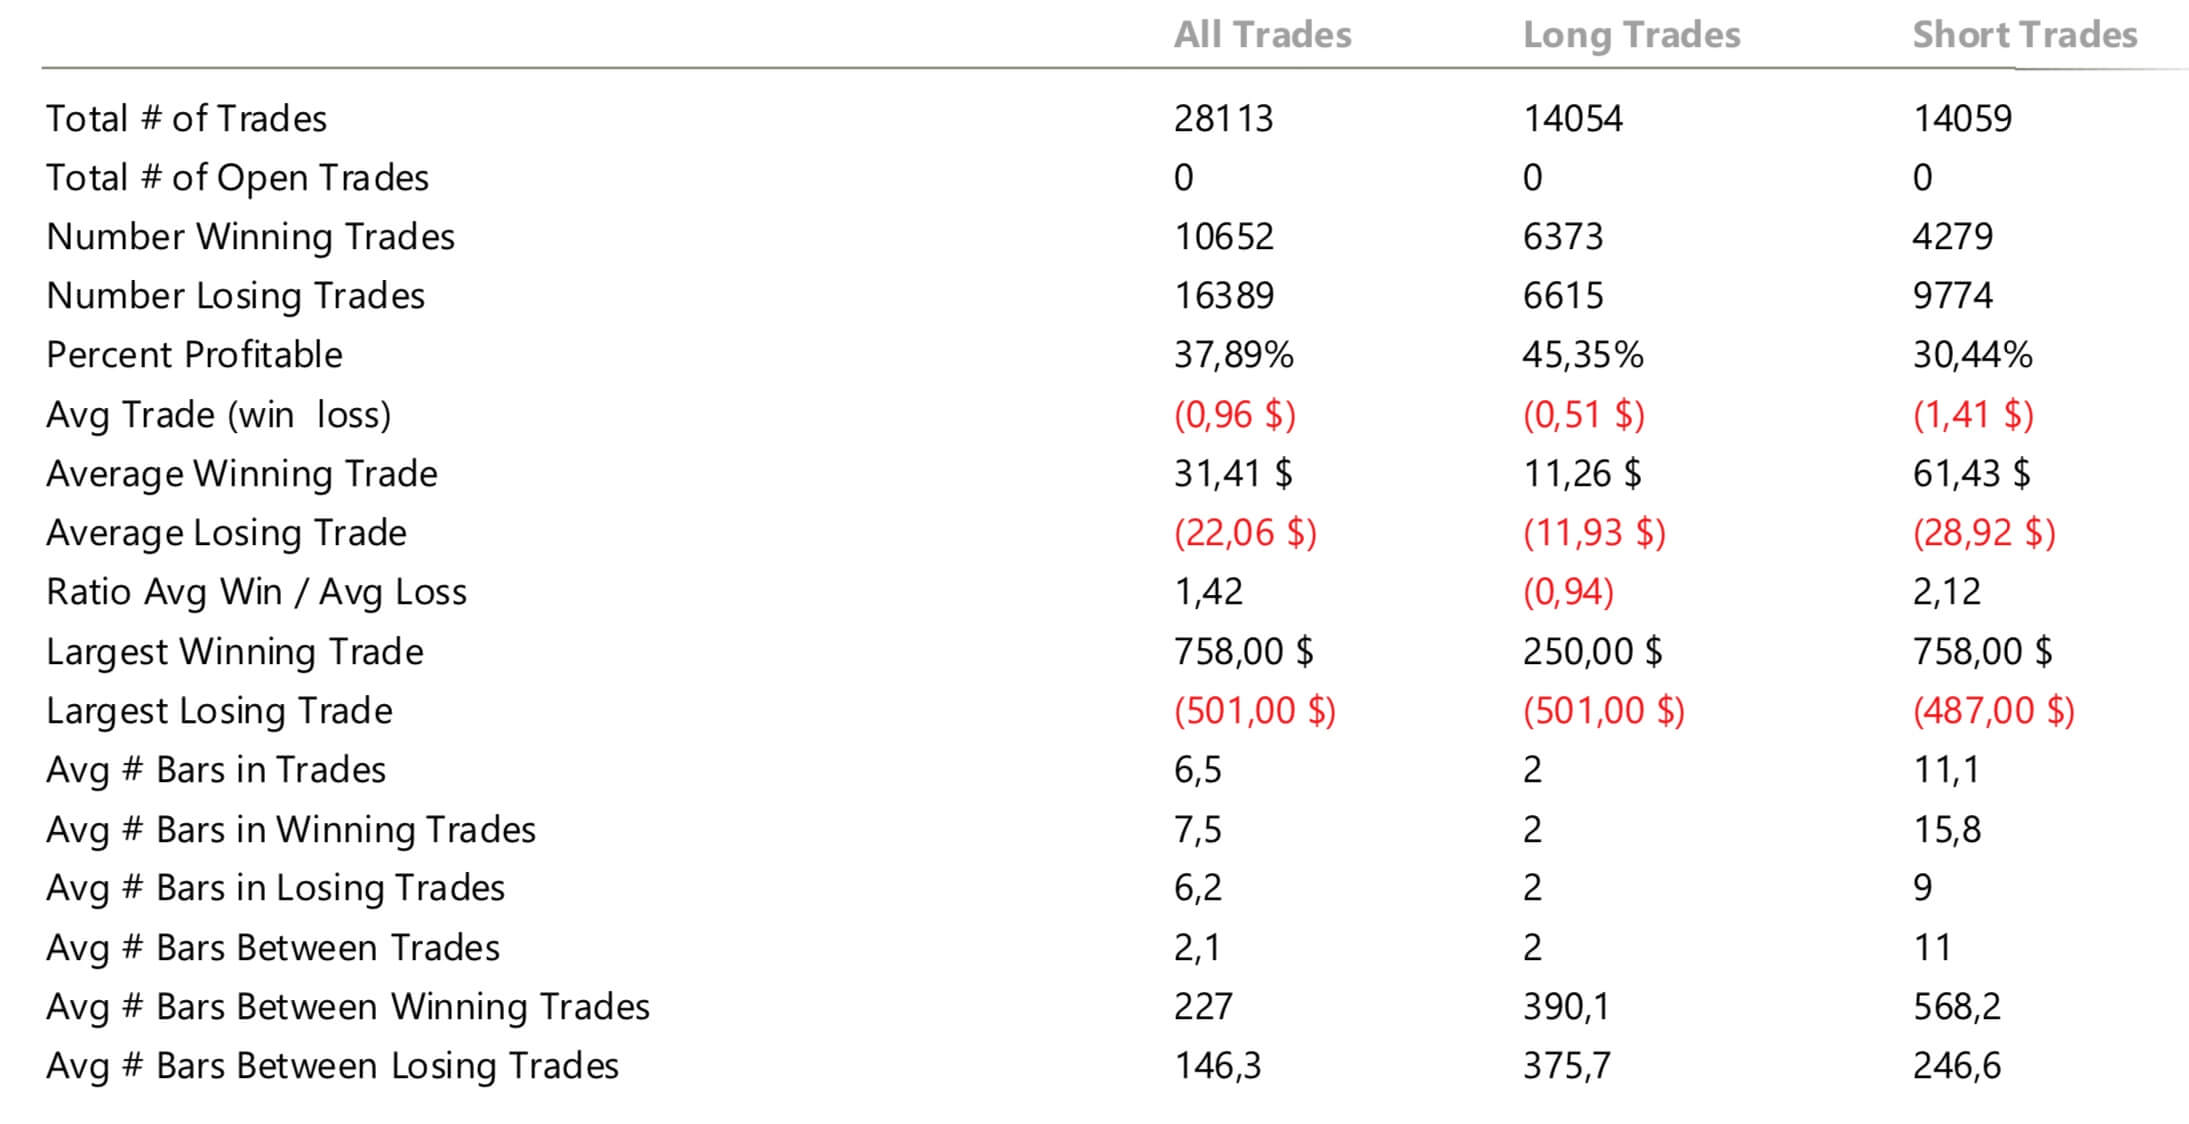
The results, measured on the EURUSD, are not as brilliant as Mr. Welles Wilder stated.

The trade analysis shows that the RSI Failures system, as is, is a losing system. This fact is quite common. It takes time to uncover good ideas for a profitable trading system. In the meantime, we have developed a practical exercise using the finite state machine concept, handy for the future development of our own trading ideas.


Categories
Forex Daily Topic Forex System Design

Trading System design -Creating Your Strategy with Tradingview’s Pine Script – Part 2

In part 1 of this article series, we have created the Stochastic RSI indicator as part of our idea for a scalping strategy. Now that we have it functional, we will make the bull/bear phases and visually inspect whether it captures the turning market’s turning points.

Possible ways to create bull/bear slices

Our Stochastic RSI consists of two lines, k and d, and two trigger lines, ob and os. Therefore we can use multiple variants that may allow the creation of bull/bear price legs. Let’s consider the following 3

Variant 1 – The transition occurs at the SRSI entrance of the oversold or overbought regions.

Bull: The d-line crosses under the ob-line, which indicates it is into the overbought area
Bear: The d-line crosses over the os-line, indicating d‘s entry into the oversold area.

Code:
if crossunder (d, os)
    SRSI_Long := true
    SRSI_Short := false
else if crossover (d, ob)
    SRSI_Long := false
    SRSI_Short := true 
else
    SRSI_Long := SRSI_Long[1]
    SRSI_Short := SRSI_Short[1]

This code creates a condition SRSI_Long at the cross of d under os, which holds until d crosses over ob and reverses it, creating an SRSI_Short state. This condition is only modified by d crossing under os.
The else statement ensures the condition does not change from the previous bar.

Once we have defined the bull and bear segments, we can color-shade them to visualize them in the chart. To do it, we will use the bgcolor() function.

bgcolor(SRSI_Long ? color.green: na)
bgcolor(SRSI_Short ? color.red: na)

The first statement asks the condition of SRI-Long ( the ? sign). If true, the background color changes to green. Otherwise, no change (an). The second statement behaves similarly for SRSI_Short.

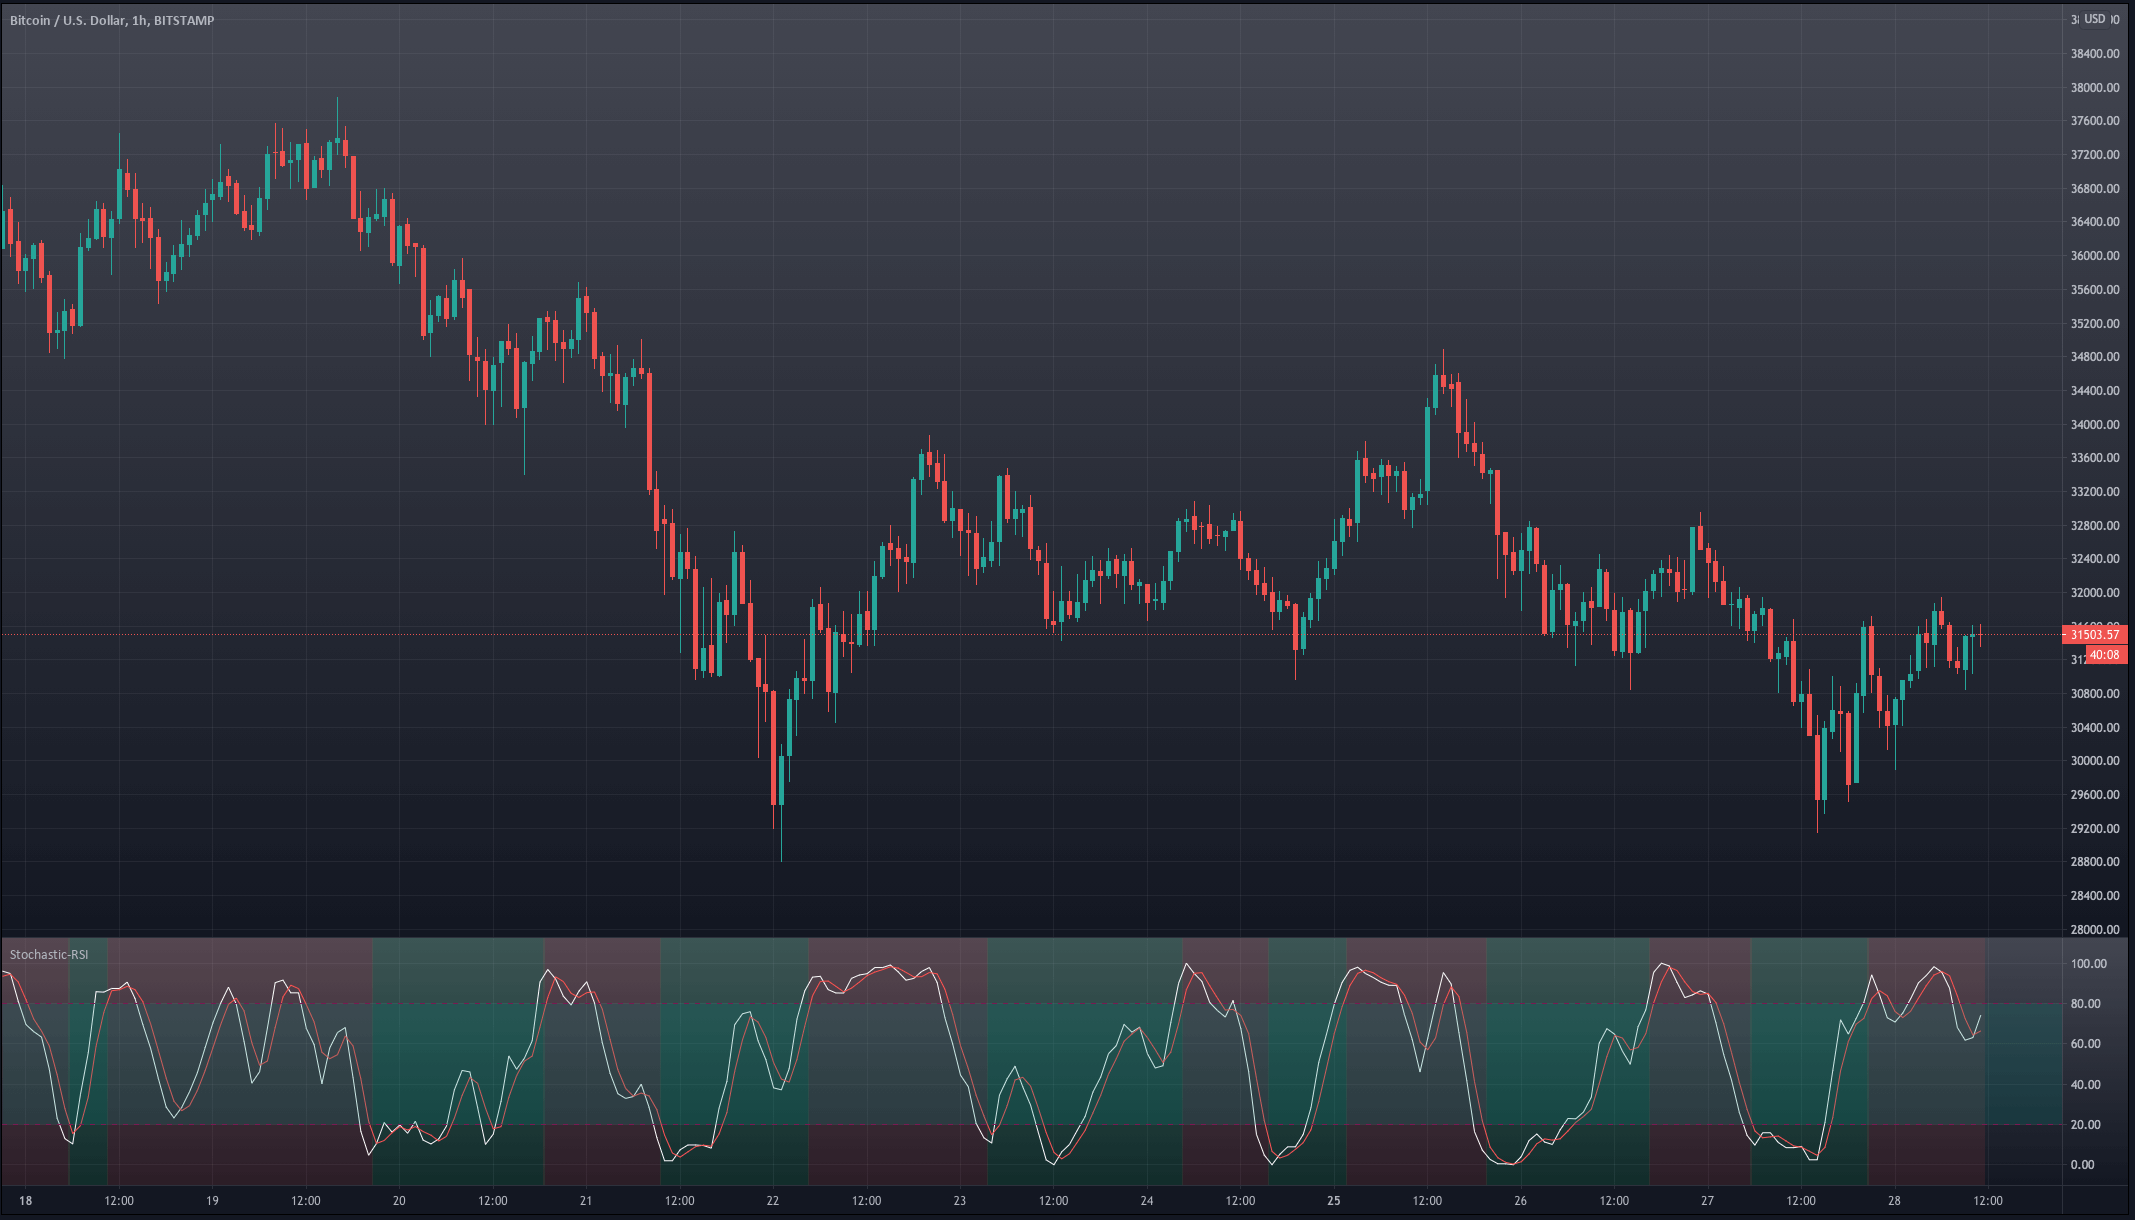
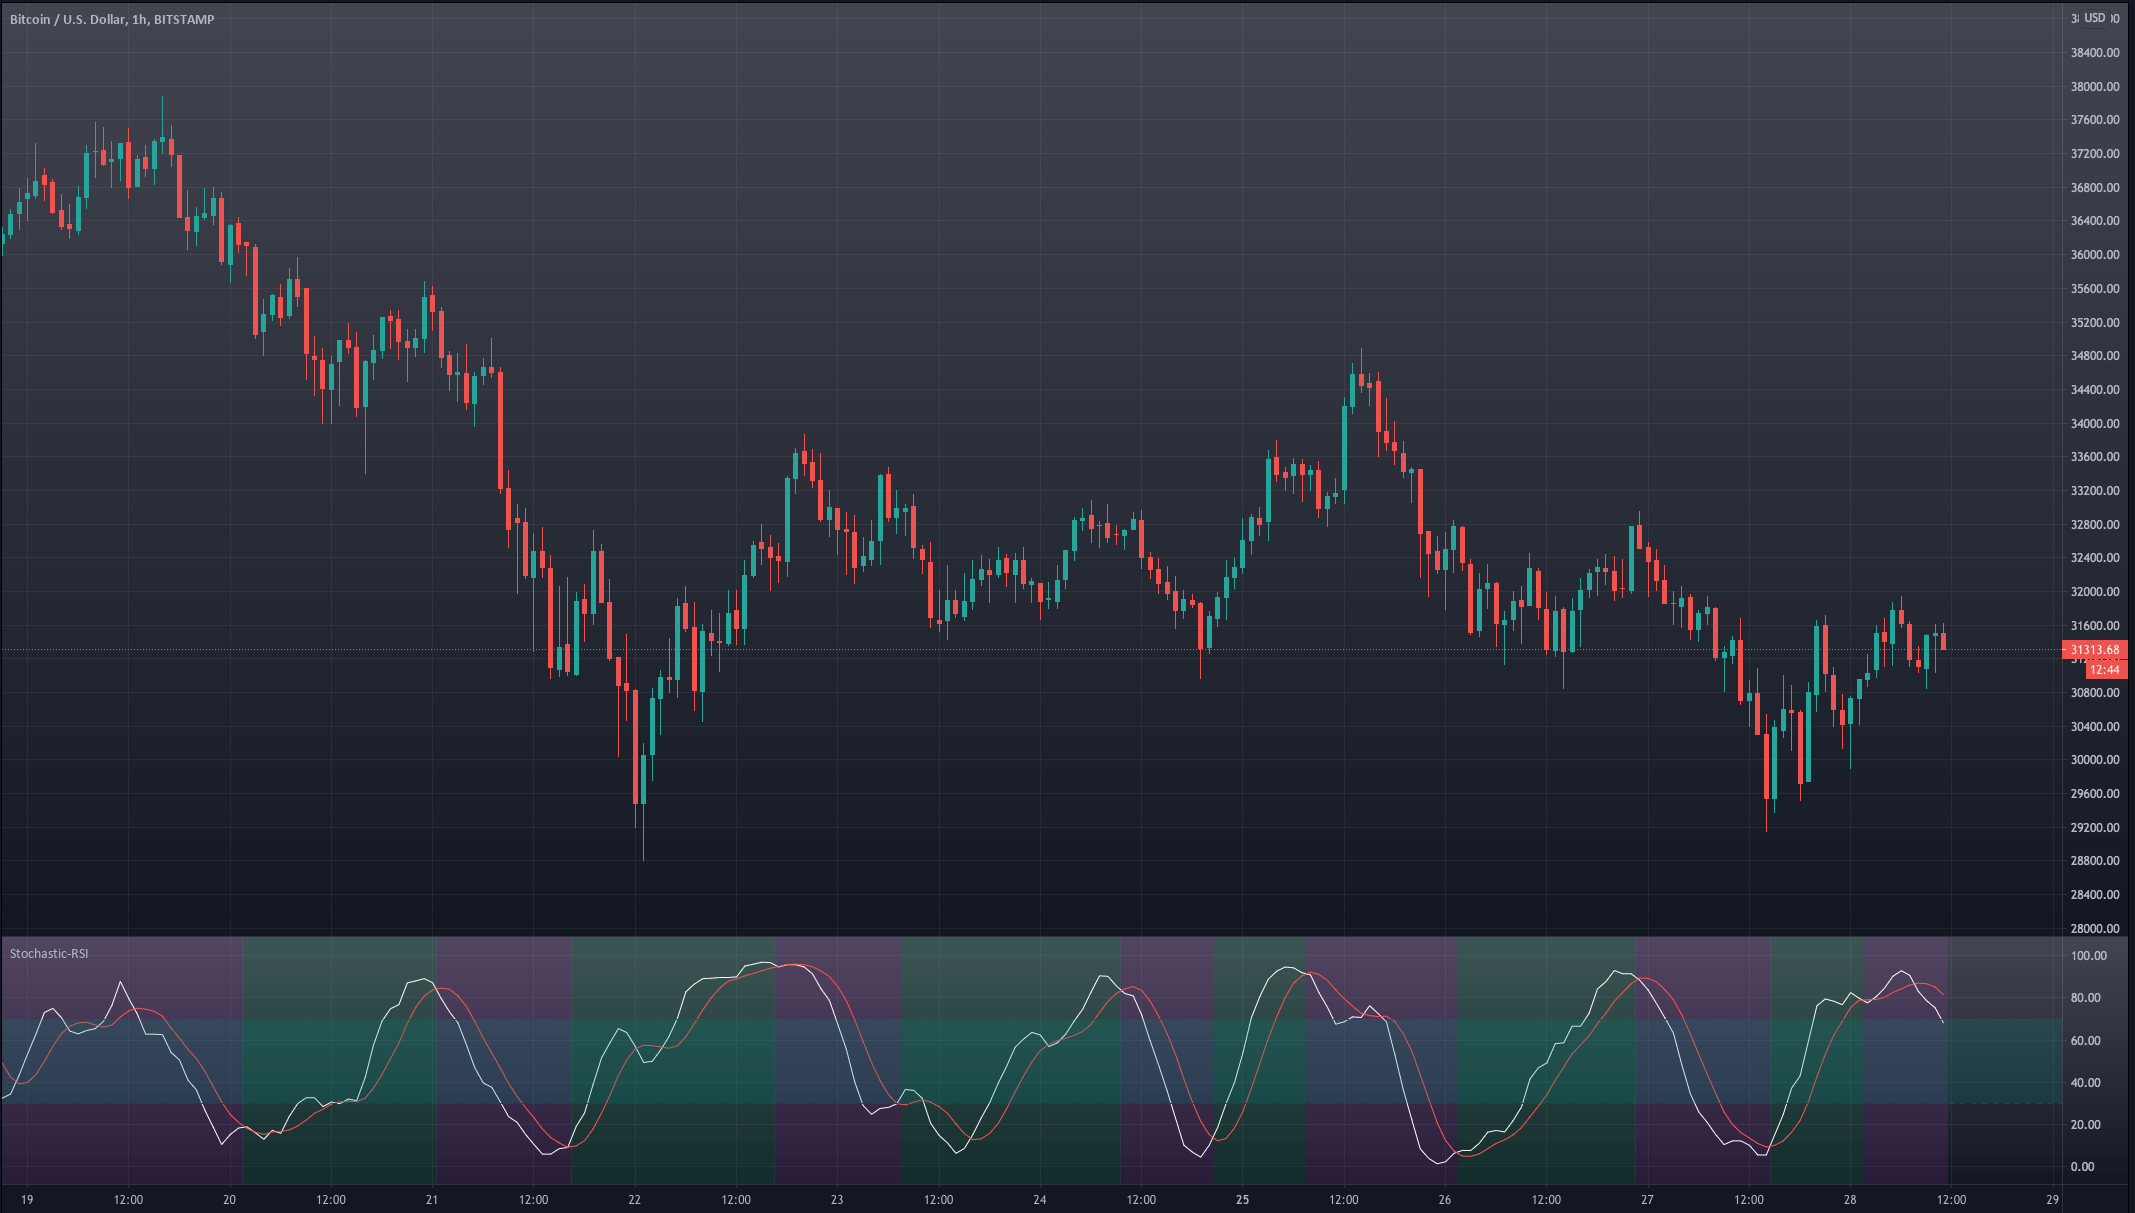
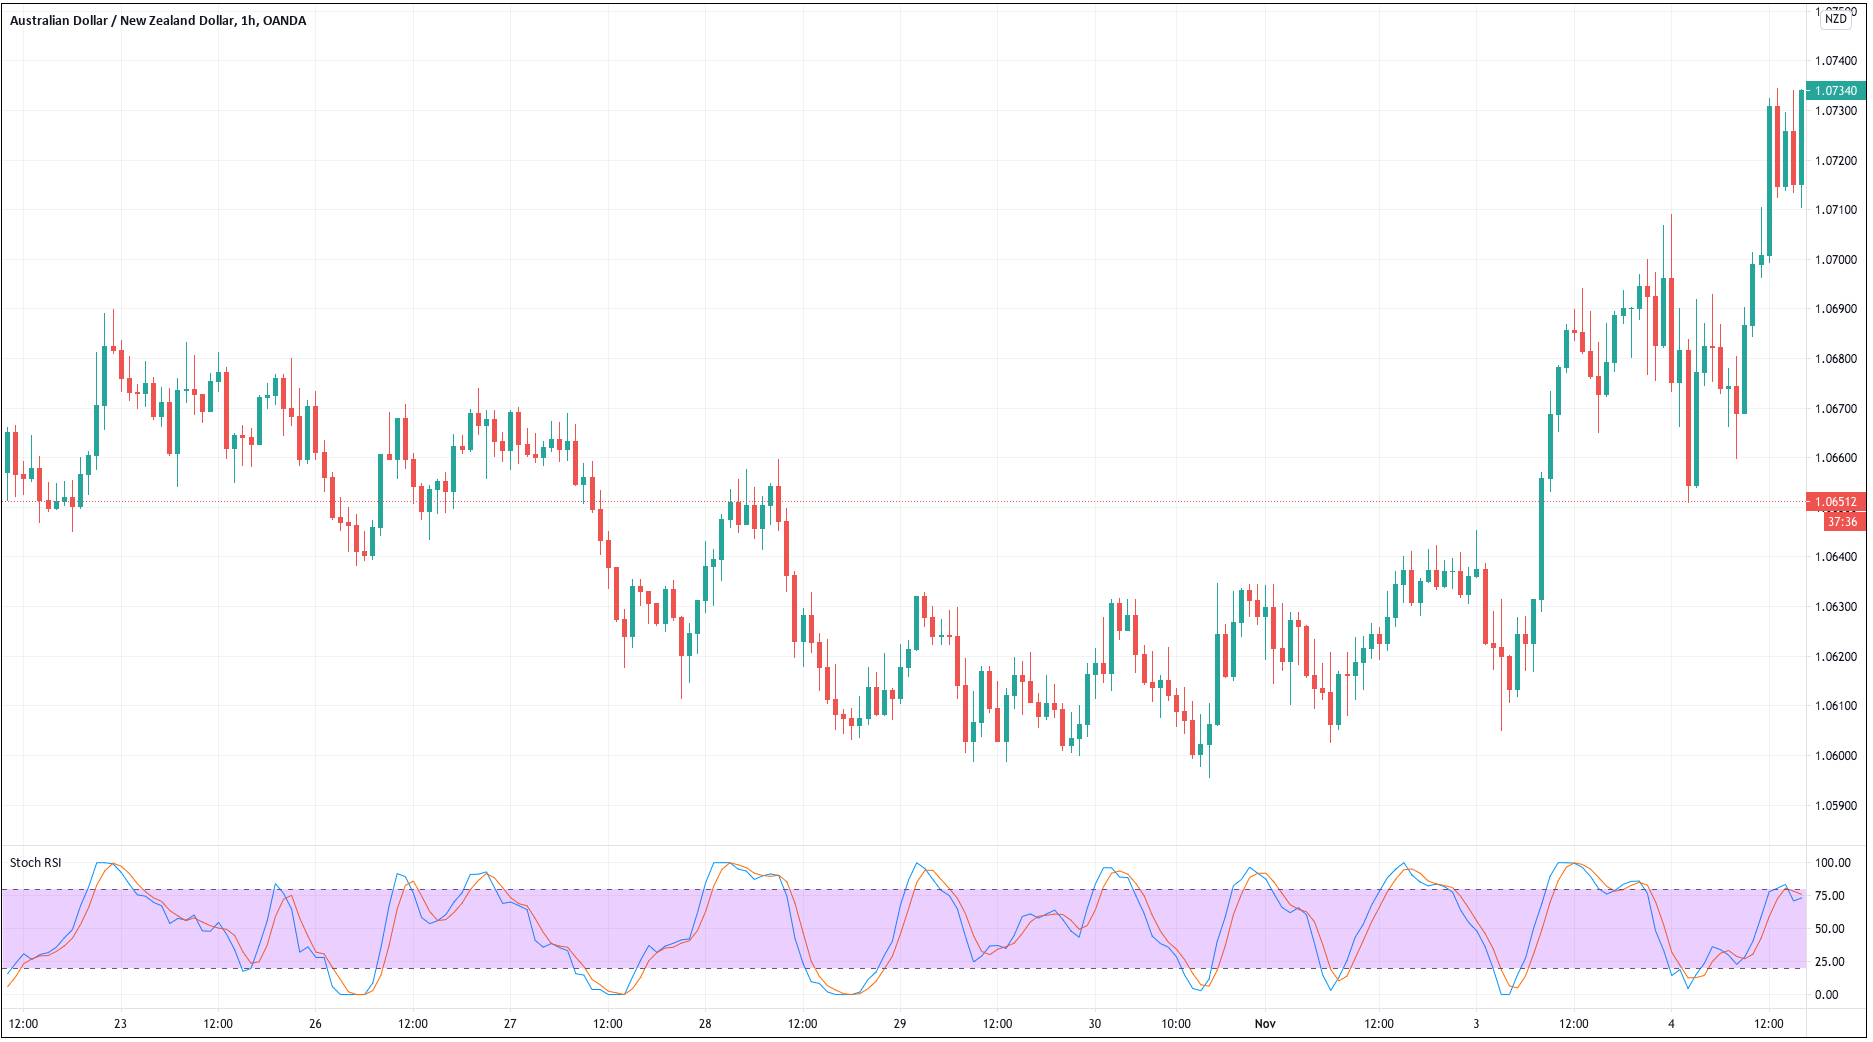
Let’s see how this piece of code behaves in the BTCUSD chart.

Variant 1 triggers the transitions too early. We see that on many occasions when the stochastic RSI enters the overbought or oversold region, it is more a signal of trend strength than a turning point.


Variant 2 – The transition occurs at D and K’s crossovers if in the overbought/oversold regions.

Bull: the k-line crosses over the d-line, if below os ( inside the oversold region. We ignore crosses in the mid-area)
Bear: the k-line crosses under the d-line, if above ob ( in the overbought area. We ignore crosses in the mid-area)

Code:

// creating the long and short conditions for case 2

if crossover(k,d) and d < os
     SRSI_Long := true
     SRSI_Short := false

else if crossunder(k,d) and d > ob
     SRSI_Long := false
     SRSI_Short := true
else
     SRSI_Long := SRSI_Long[1]
     SRSI_Short := SRSI_Short[1]
// bacground color change
bgcolor(SRSI_Long ? color.green: na) 
bgcolor(SRSI_Short ? color.red: na)

The last section for the background change is similar to Variant 1.

Let’s see how it behaves in the chart.

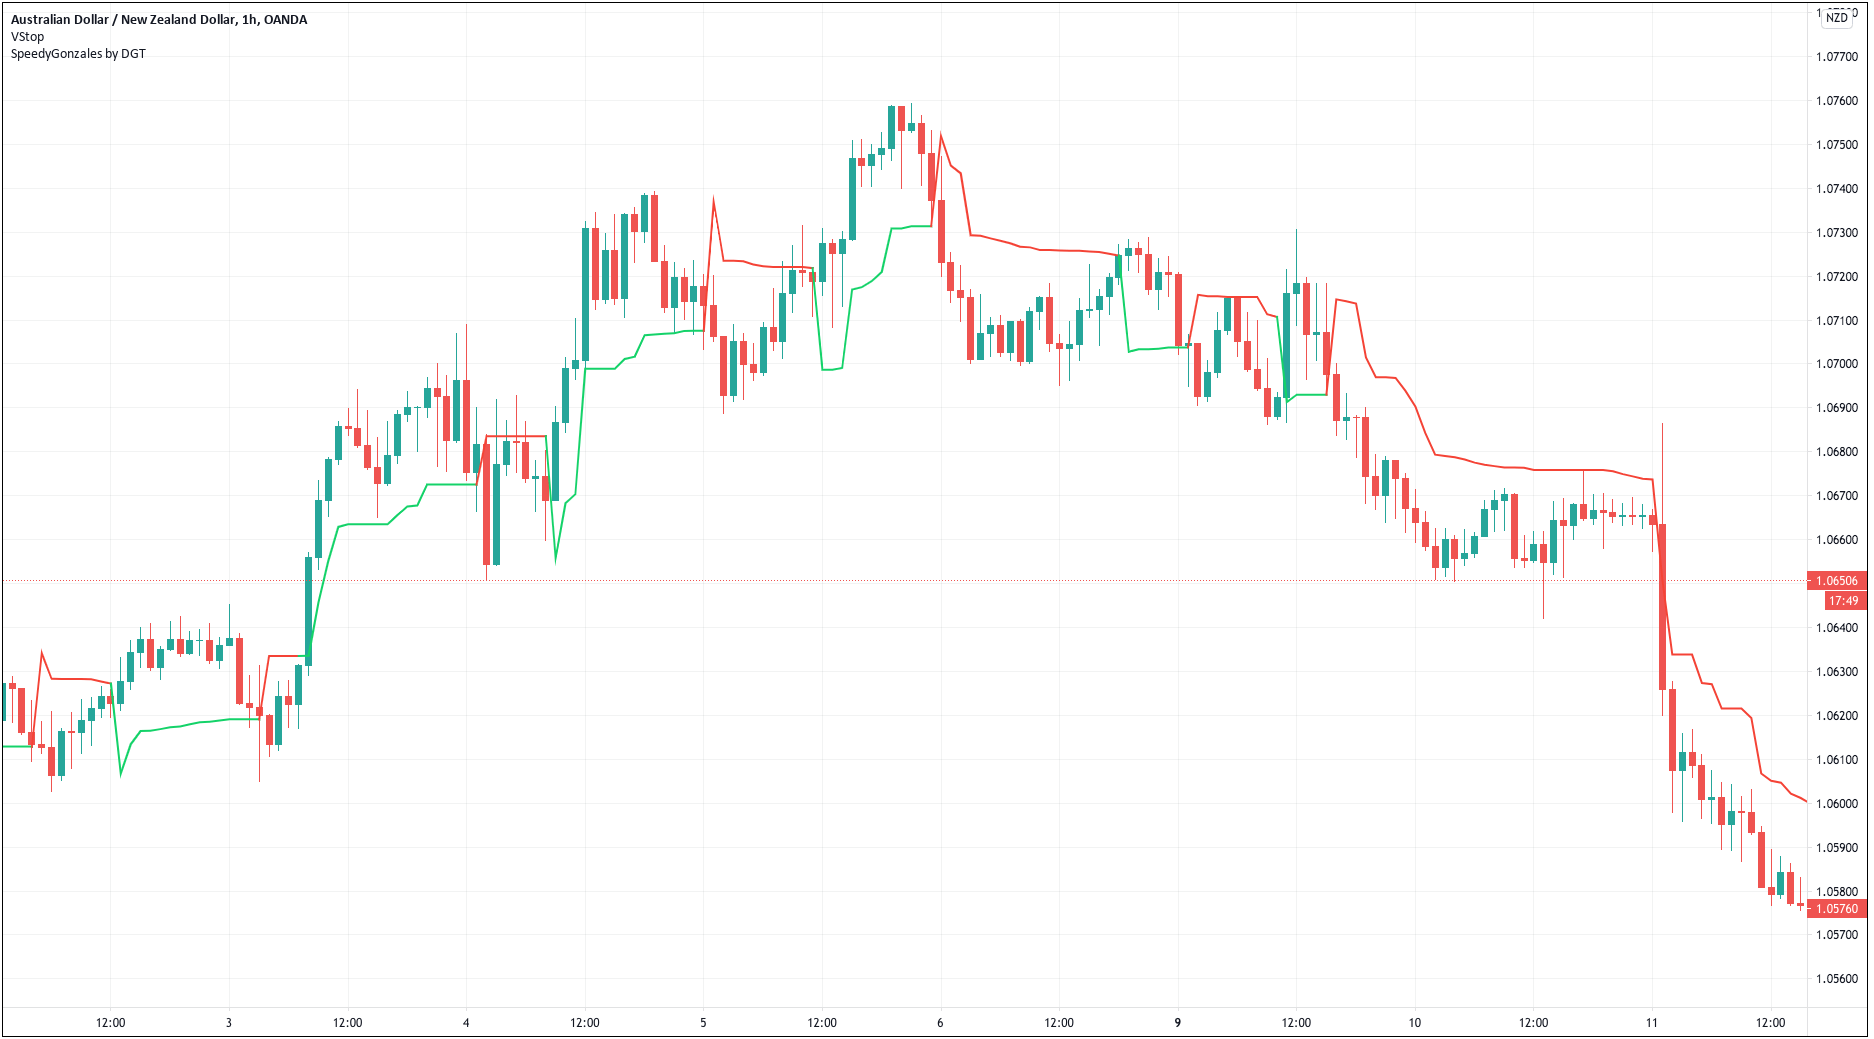
Variant 2 is an improvement. We see that the bull and bear phases match the actual movements of the market, although entries are still a bit early, and in some cases, it missed the right direction. It can be useful as a trigger signal, provided we can filter out the faulty signals.


Variant 3 – the transition occurs when d moved to the overbought or oversold region and, later, crosses to the mid-area.

Bull: the d-line crosses over the os-line
Bear: the d-line crosses under the ob-line.

if crossover (d, os)
    SRSI_Long := true
    SRSI_Short := false
else if crossunder (d, ob)
    SRSI_Long := false
    SRSI_Short := true 
else
    SRSI_Long := SRSI_Long[1]
    SRSI_Short := SRSI_Short[1]
// bacground color change
bgcolor(SRSI_Long ? color.green: na) 
bgcolor(SRSI_Short ? color.red: na)


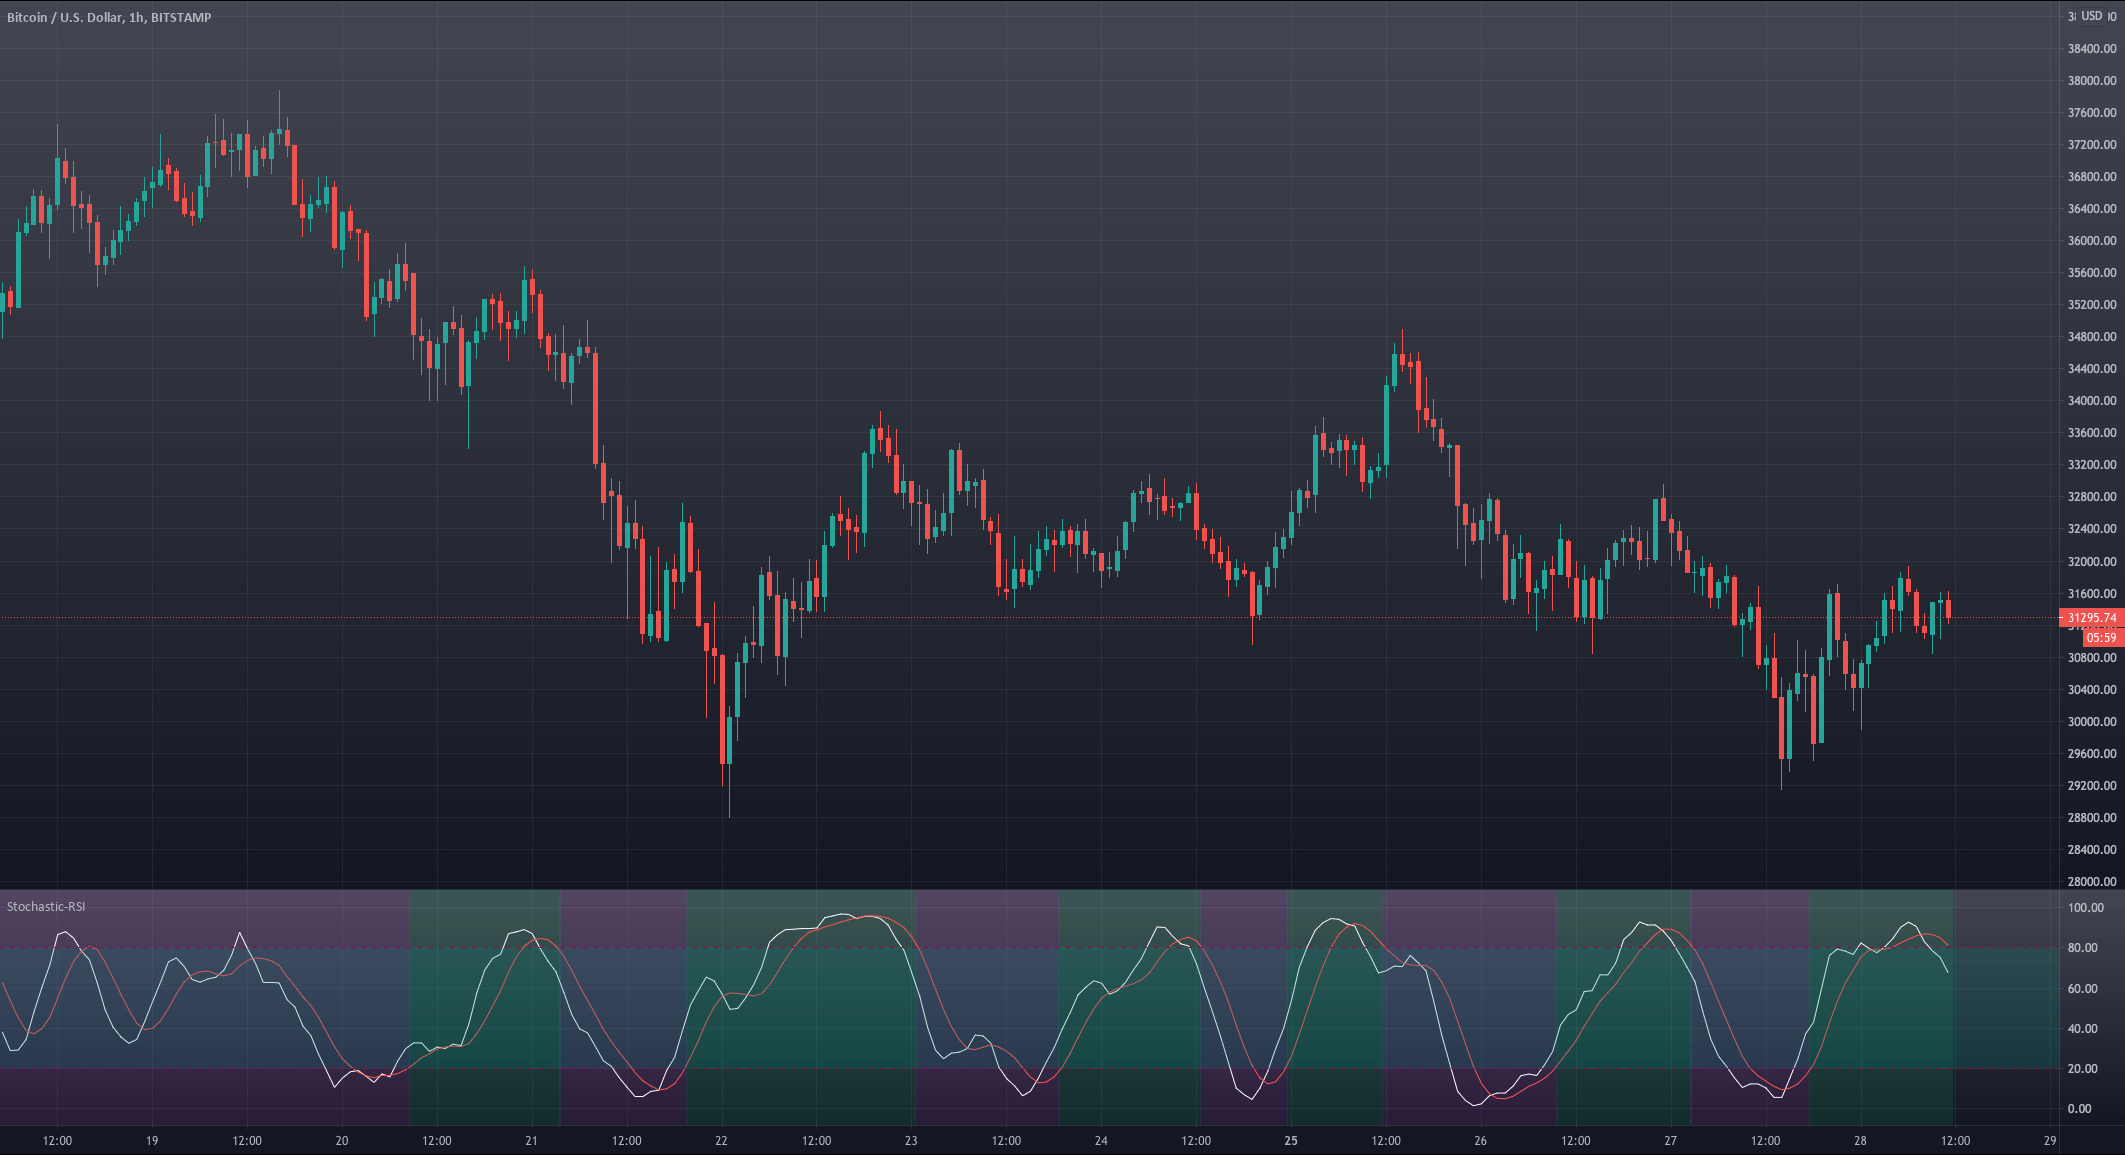
And this is how it behaves in the chart.


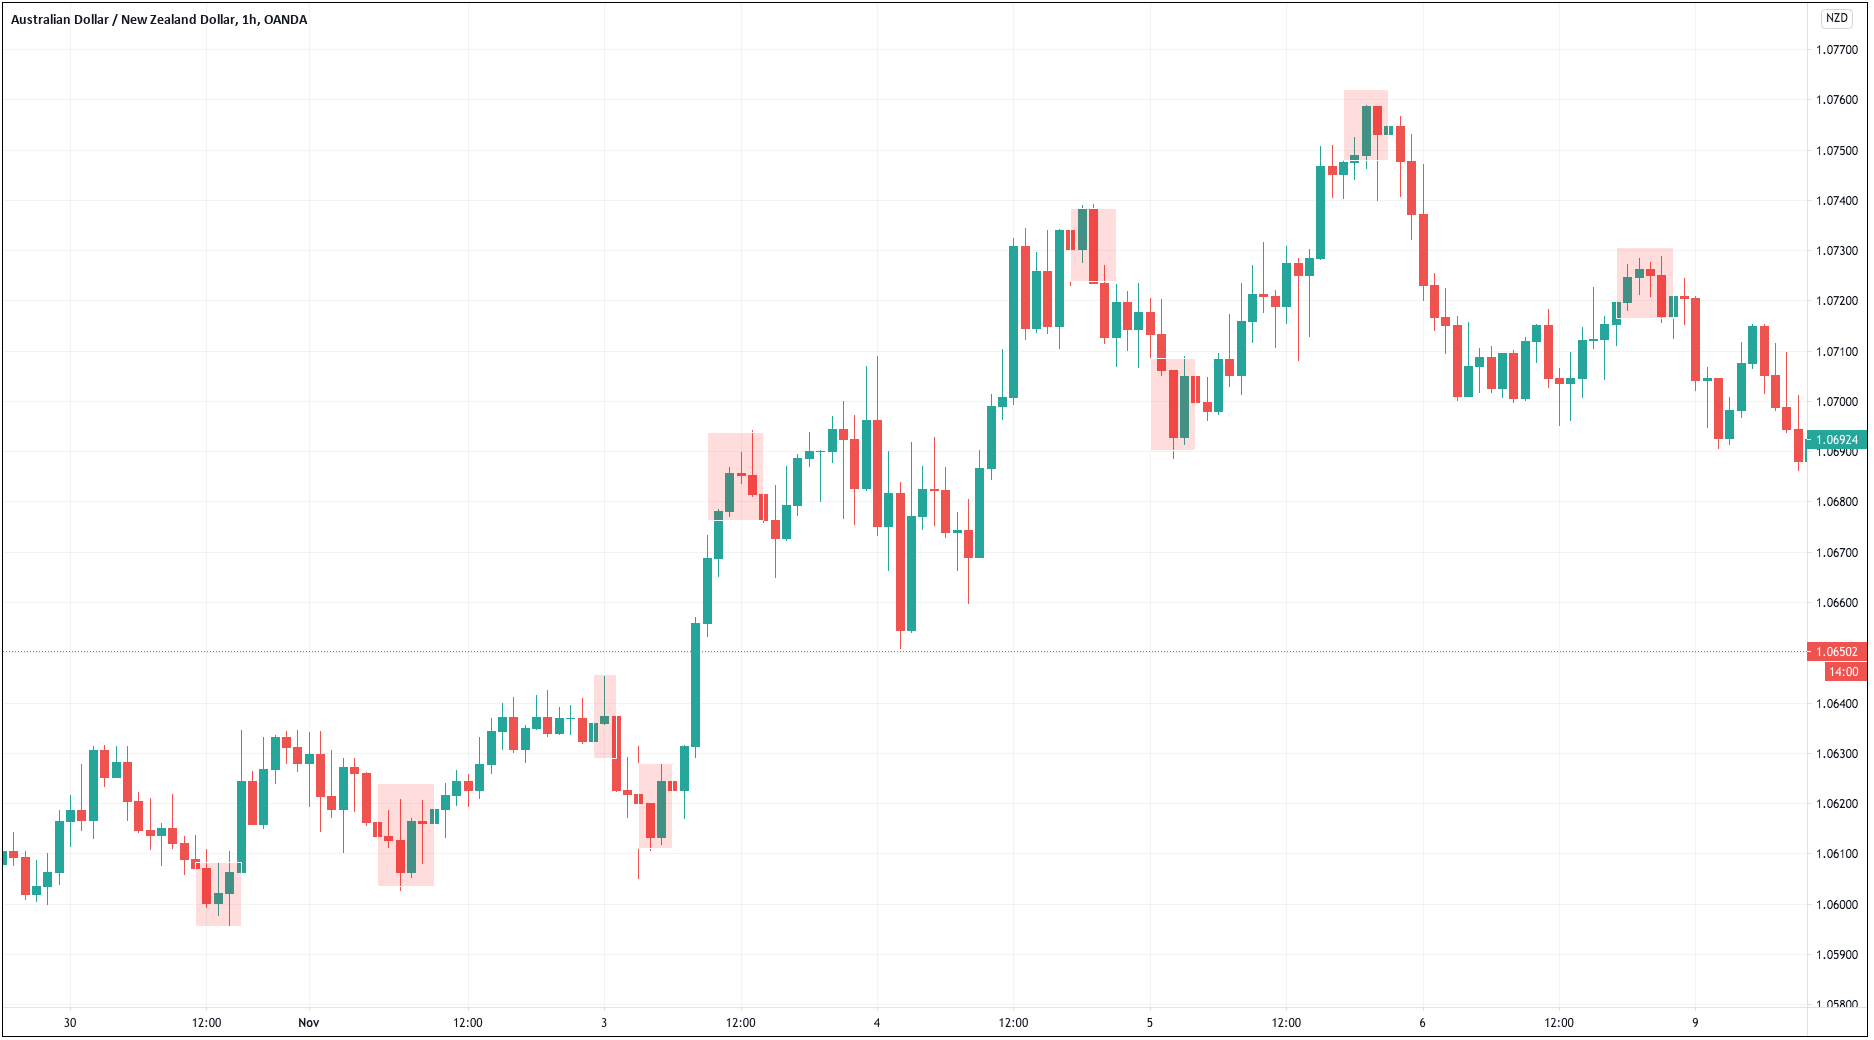
Variant 3 lags the turning points slightly, but this quality makes it more robust, as, on most occasions, it’s right about the market direction. This signal, combined with the right take-profit, may create a high-probability trade strategy.

Let’s try this one. But this will be resolved in our next and last article of this series.

Stay tuned!

Categories
Forex Daily Topic Forex System Design

Trading System design -Creating Your Strategy with Tradingview’s Pine Script – Part 1

As promised, in this article, we will go through the steps to create a custom strategy, from the initial idea to the implementation of signals, stops, and targets.

The skeleton of a trading Strategy

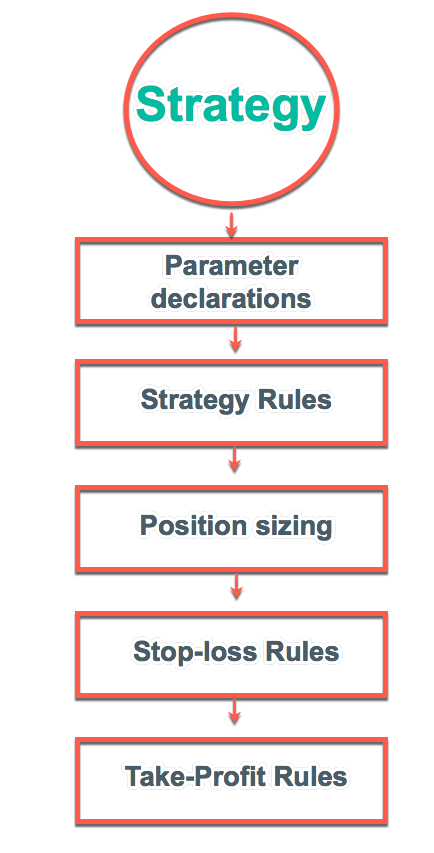
To create a strategy programmatically is relatively simple. We need to define the Parameters and the trade rules first, followed by the position sizing algorithm, the entry commands, and the stop-loss and take-profit settings.

Visualizing the idea

Human beings are visual. We may think our trading idea is fantastic, but translating it into code may not be straightforward. It is much easier to detect the errors if we see our rules depicted on a chart.

With the parameter declarations and trade rules, we can create an indicator first, so we can see how it appears. After we are happy with the visual 

The idea

For our example, we will use a simple yet quite exciting indicator called Stochastic RSI, which applies the Stochastic study to the RSI values. This operation smoothes the RSI, and it reveals much better the turning points on mean-reverting markets, such as in Forex. Let’s see how it behaves as a naked strategy.
Diving into the process

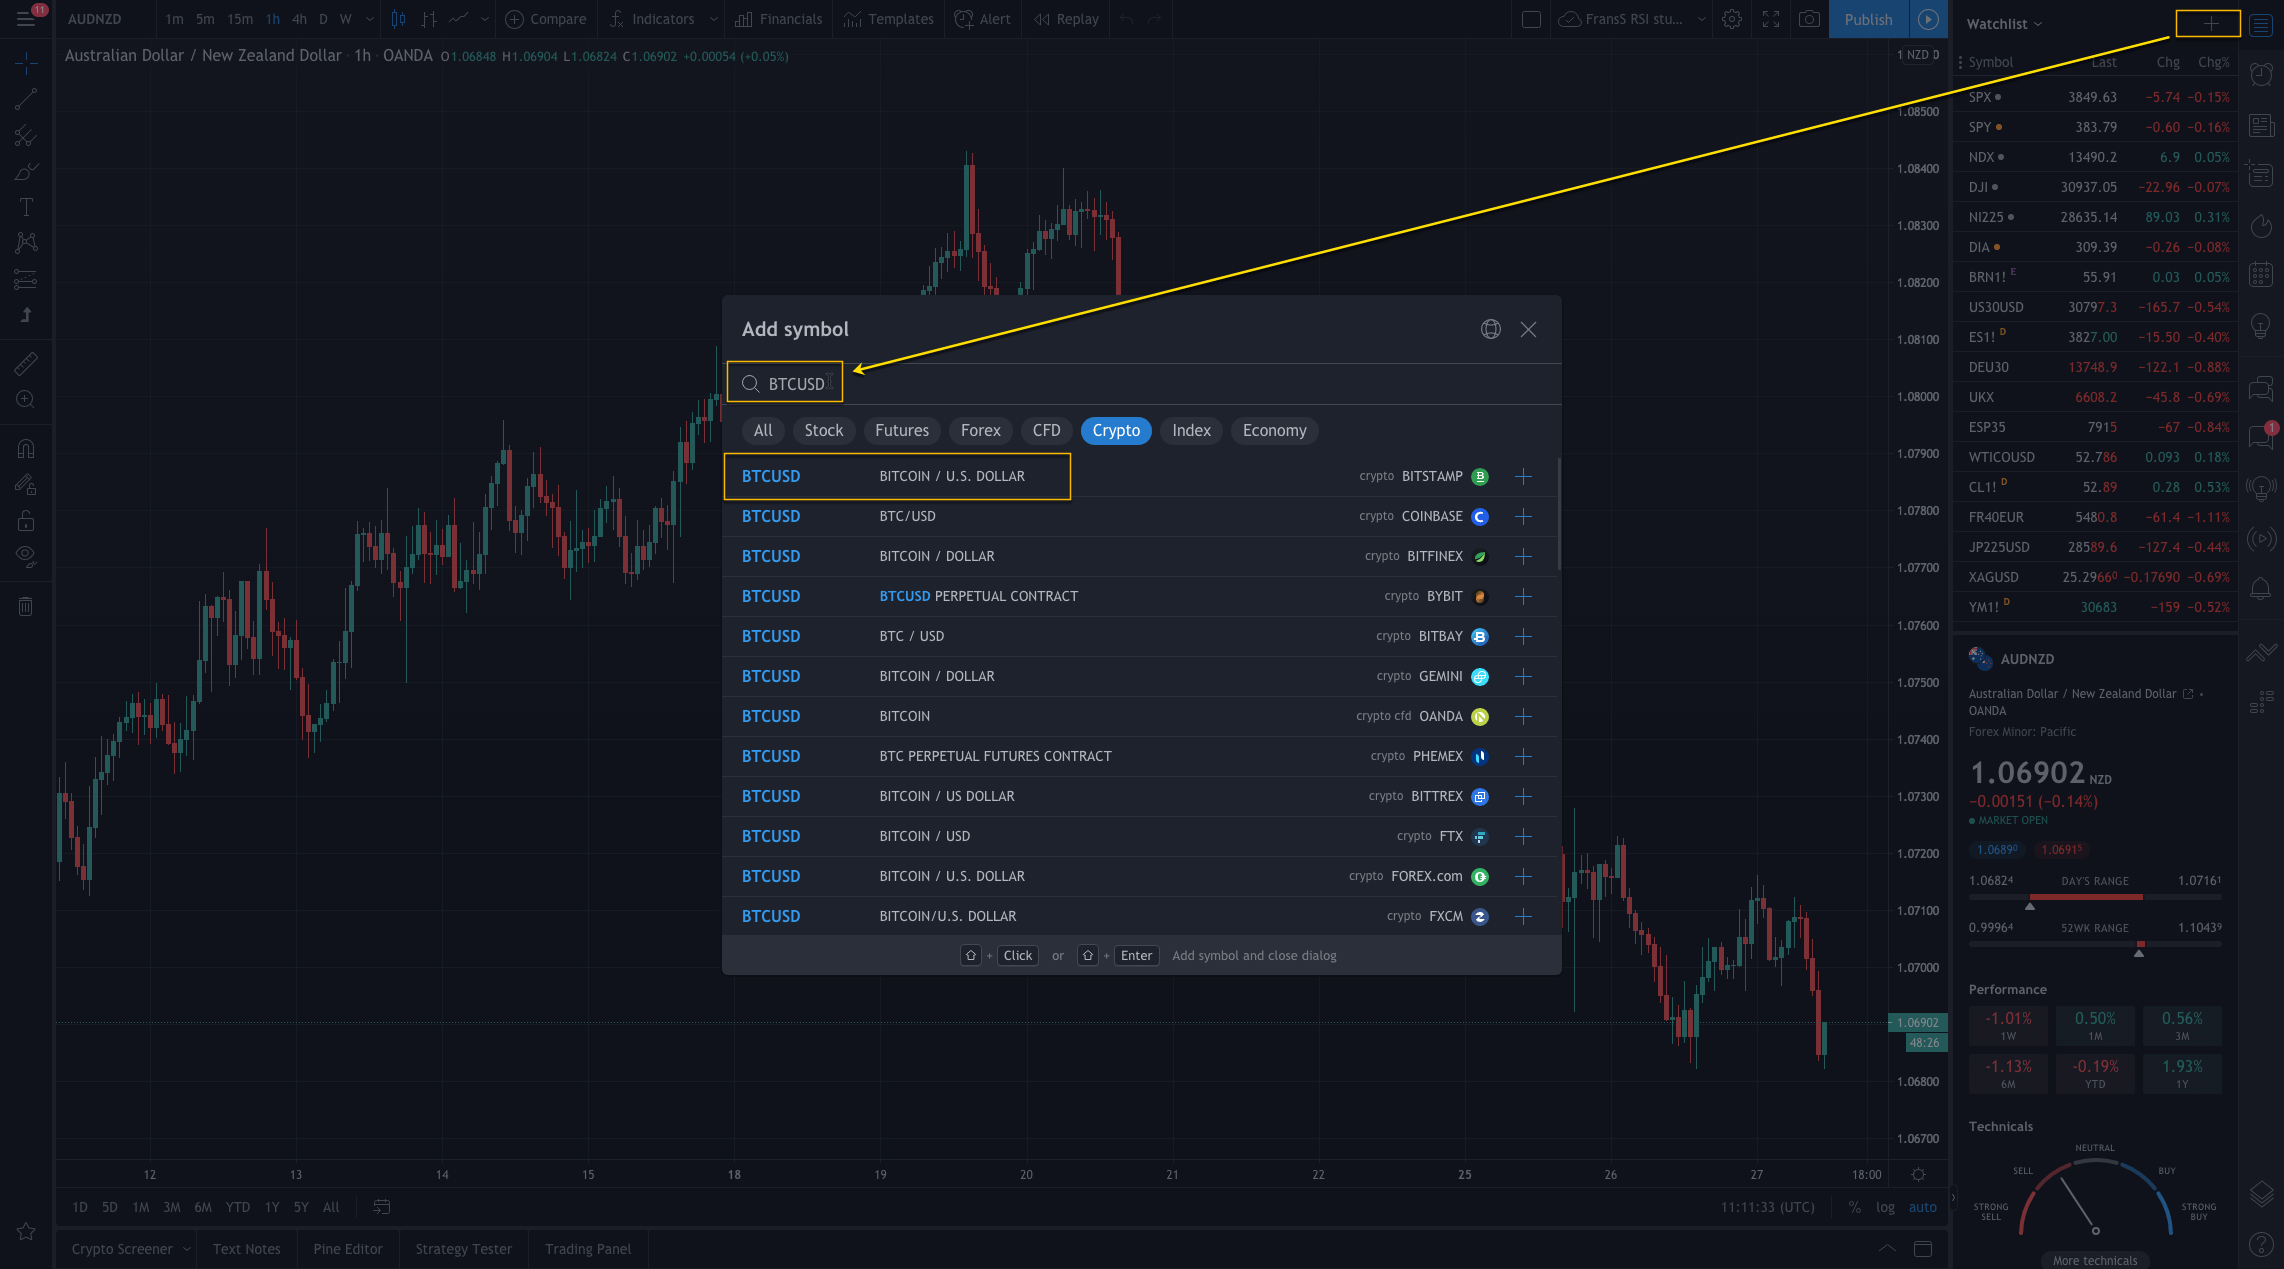
First, you need to open an account with Tradingview. Once we are in, we create a new layout.

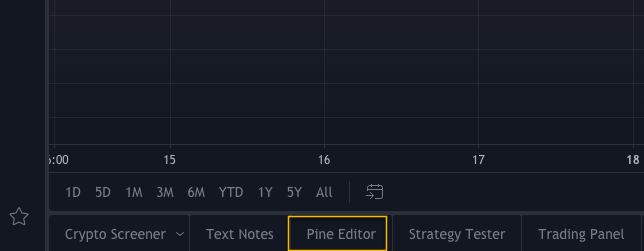
Then we open the Pine Editor.

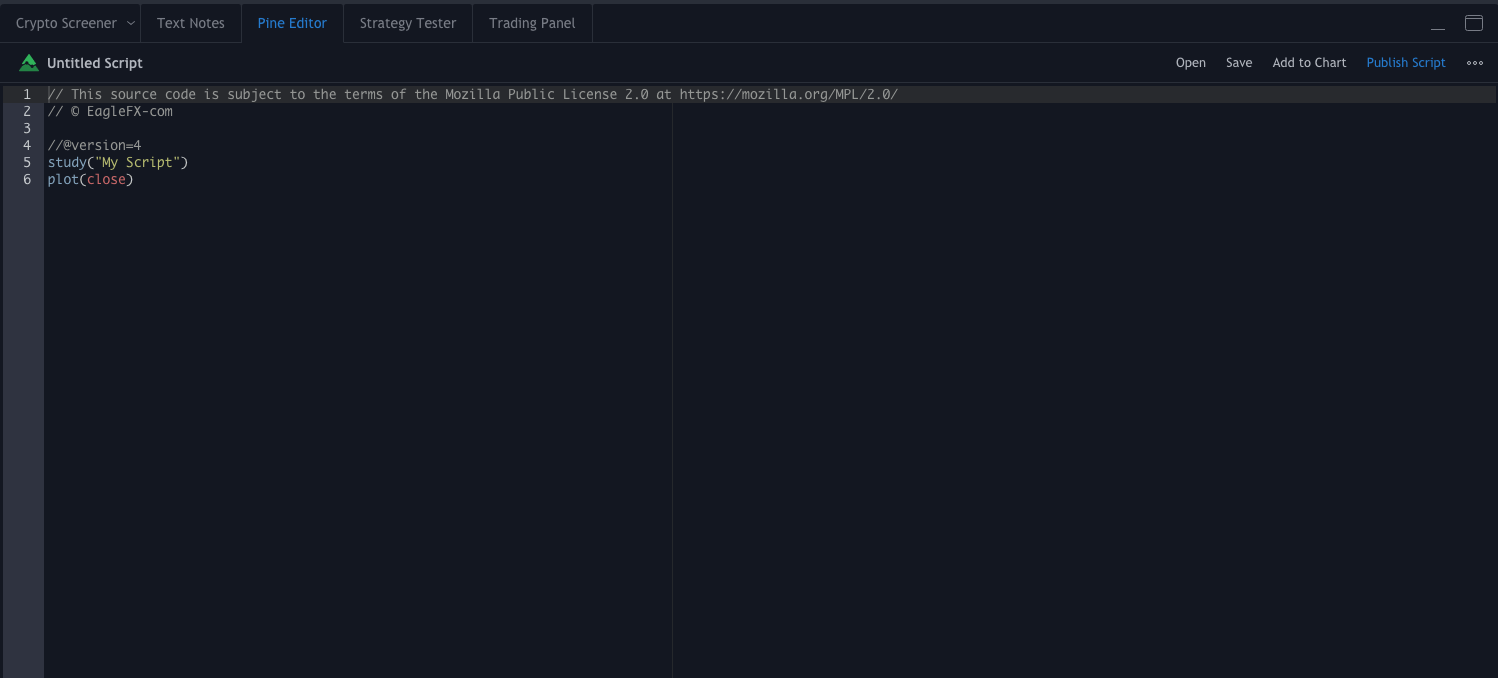
It appears in the bottom left of your layout. Click on it… and it shows with a basic skeleton code.

The Stochastic RSI code.

As said, to create the Stochastic RSI indicator, we will make the RSI and then apply the stochastic algorithm to it.

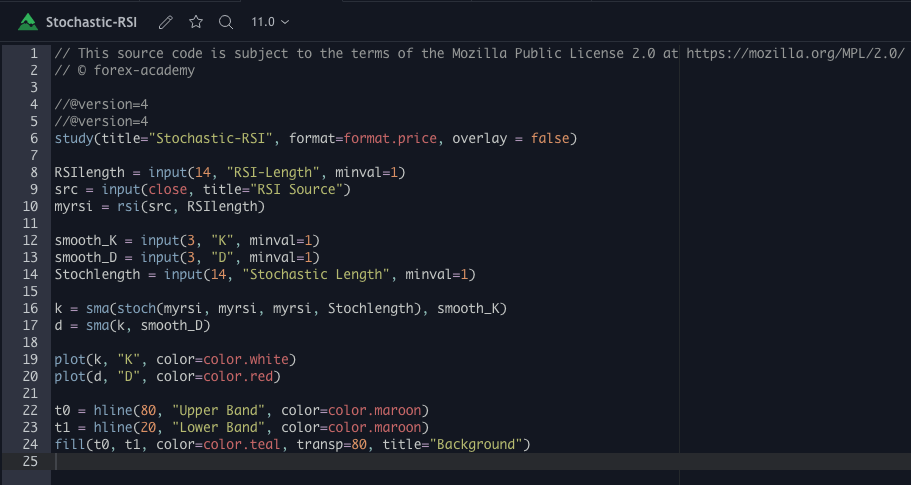
1 study(title="Stochastic-RSI", format=format.price, overlay = false)

This first line declares the code to be a study, called Stochastic-RSI.  

format = format.price is used for selecting the formatting of output as prices in the study function.

Overlay = false means we desire the RSI lines to appear in a separate section. If it were a moving average to be plotted with the prices, overlay should be set to true.

RSIlength = input(14, "RSI-Length", minval=1)

We define the RSI length as an input parameter called RSI-Length.

src = input(close, title="RSI Source")

The variable src will collect the input values on every bar. The default is the bar close, but it may be modified by other values such as (o+c)/2.

myrsi = rsi(src, RSIlength)

This line creates the variable myrsi that stores the time series of the rsi.

This completes the calculation of the RSI. 

smooth_K = input(3, "K", minval=1)
smooth_D = input(3, "D", minval=1)

These two lines create the smoothing values of the stochastic %K and %D. Since it comes from input, they can be changed at will.

Stochlength = input(14, "Stochastic Length", minval=1)

This code defined the variable lengthStoch, computed from the input parameter.

k = sma(stoch(rsi1, rsi1, rsi1, Stochlength), smooth_K)
d = sma(k, smooth_D)

These two lines completes the calculation of the stochastic rsi.

plot(k, "K", color=color.white) - Plot a white k line 
plot(d, "D", color=color.red) - Plot a red d line.

To end this study, we will plot the overbought and oversold limits of 80 and 20, filling the mid-band with a distinctive color.

t0 = hline(80, "Upper Band", color=color.maroon)
t1 = hline(20, "Lower Band", color=color.maroon)
fill(t0, t1, color=color.purple, transp=80, title="Background")

The complete code ends as:


// This source code is subject to the terms of 
// the Mozilla Public License 2.0 at https://mozilla.org/MPL/2.0/
// © forex-academy
//@version=4
study(title="Stochastic-RSI", format=format.price, overlay = false)

RSIlength = input(14, "RSI-Length", minval=1)
src = input(close, title="RSI Source")
myrsi = rsi(src, RSIlength)

smooth_K = input(3, "K", minval=1)
smooth_D = input(3, "D", minval=1)
Stochlength = input(14, "Stochastic Length", minval=1)

k = sma(stoch(myrsi, myrsi, myrsi, Stochlength), smooth_K)
d = sma(k, smooth_D)

plot(k, "K", color=color.white)
plot(d, "D", color=color.red)

t0 = hline(80, "Upper Band", color=color.maroon)
t1 = hline(20, "Lower Band", color=color.maroon)
fill(t0, t1, color=color.teal, transp=80, title="Background")

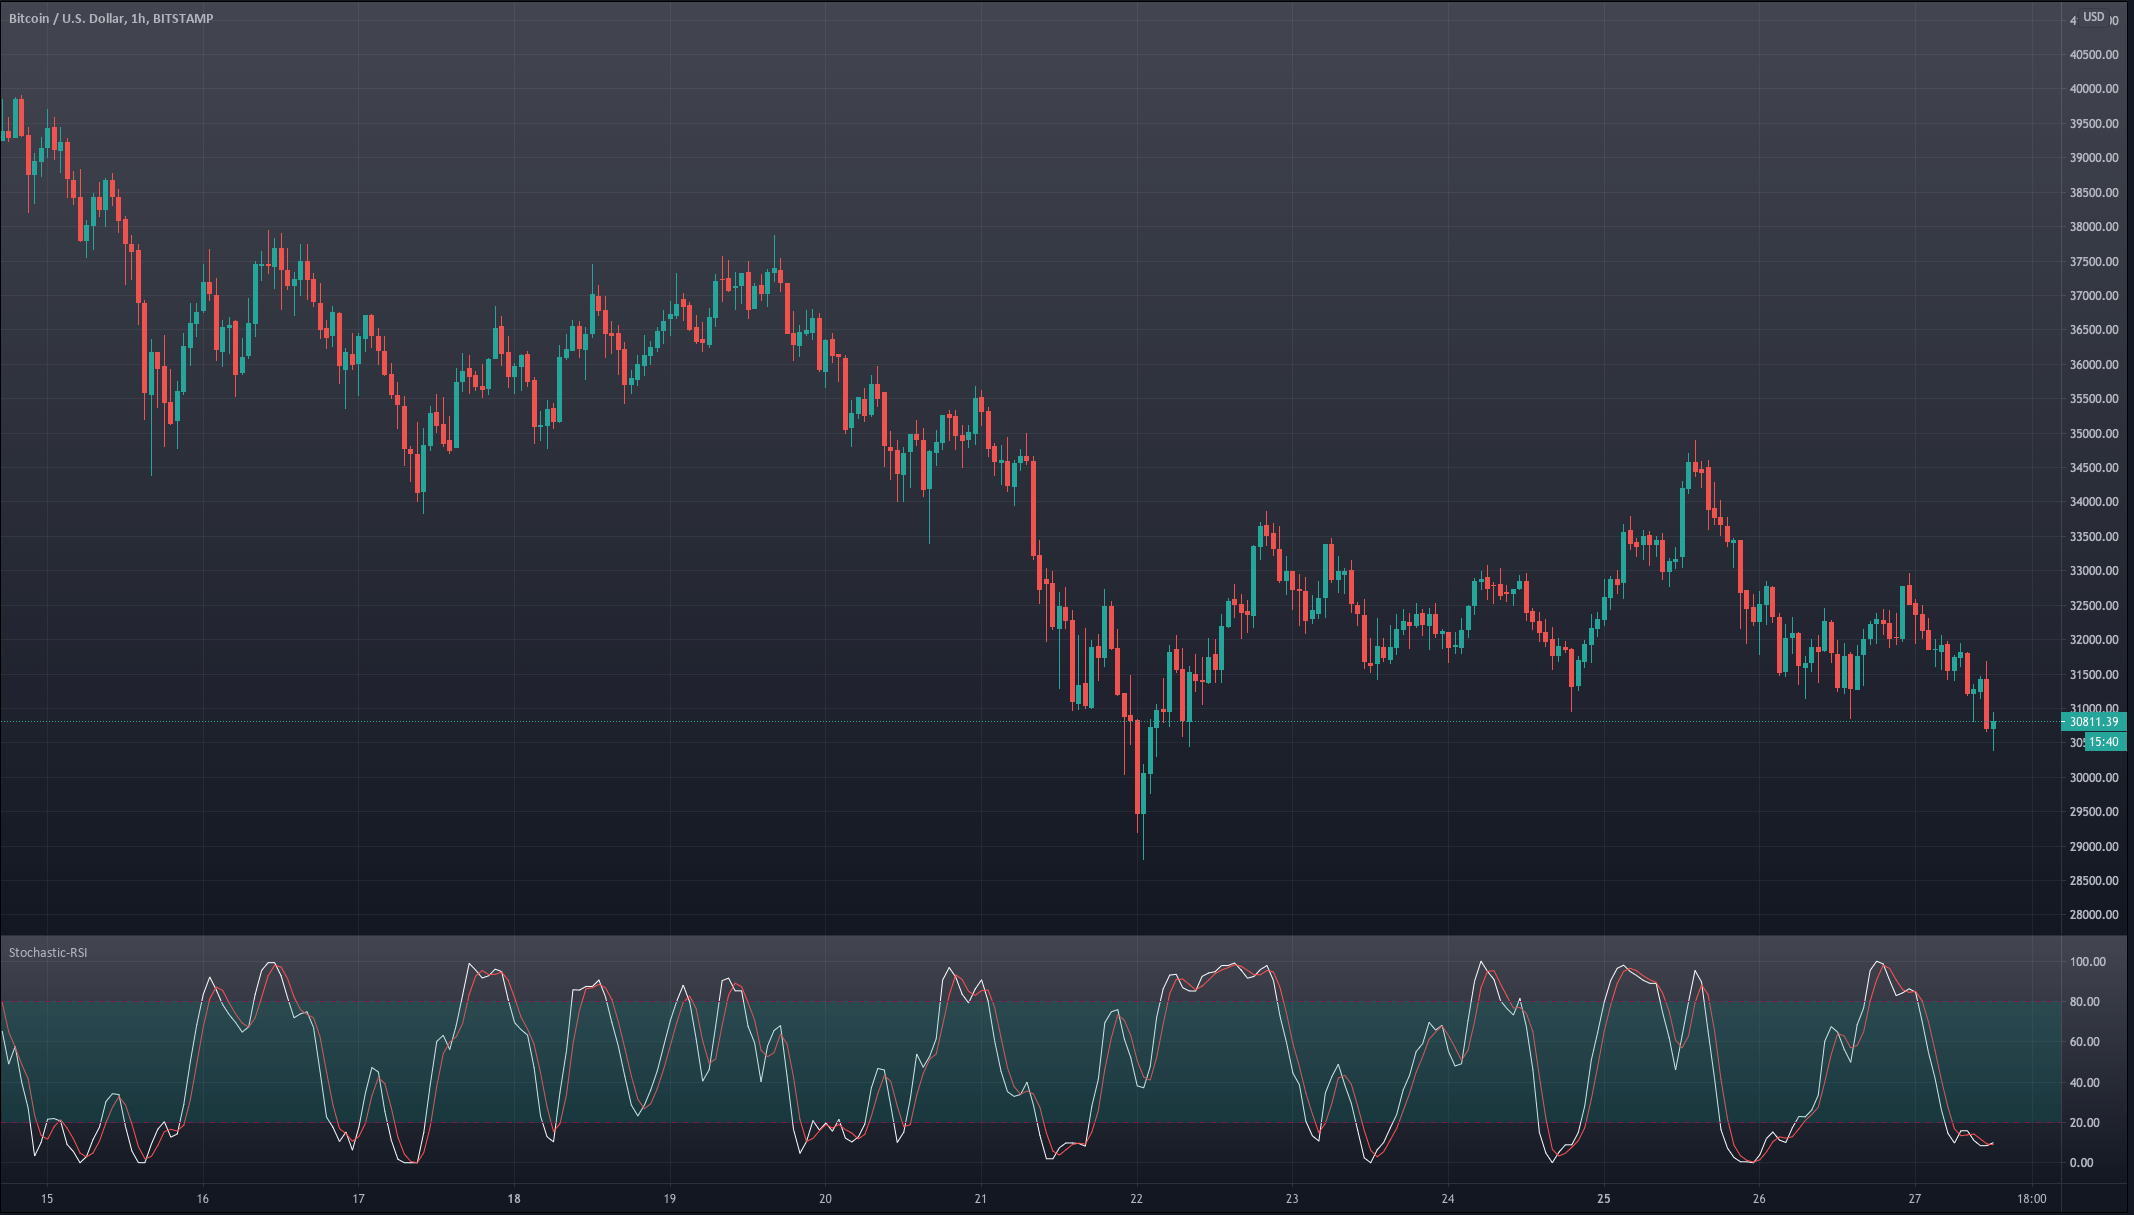
This code is shown in our layout as

Stay tuned for the second part of this article, where we will evolve the Stochastic RSI into a viable strategy.


Categories
Forex Daily Topic Forex System Design

Trading System design – A Summary of your Best Options to Code your Strategy

In our latest article, we have seen that manually backtesting our strategy is cumbersome if performed correctly. Also, It is usually subjected to errors and the interpretation of the trader. Therefore, a basic knowledge of trading algorithm development and computer coding is a desirable task for any trader. The good news is, nowadays, there are many easy ways to do it since high-level languages are very close to natural language.

High-level languages to quickly build your Forex strategies.

MetaQuotes Language (MQL4/5) 

In this respect, the primary language we could think of to build your strategy in Forex is MetaQuotes Language 4 (MQL4). This language is a specialized subset of C++ , holding an extensive built-in library of indicators and trading signals.

Spending your time and efforts to master MQL4/5 is worthwhile because Metatrader 4 includes a suitable trading strategy tester and optimizer.

If you are new to programming, you could start by analyzing and modifying existing free-available EA’s. Starting with simple strategies is excellent because they will be easier to understand and change. Also, in trading, simple usually is much better than complex.

Python

Python is the reference language for data science. Its popularity and its extensive library on data science are well-known. What is less known is, Python also has comprehensive packages dedicated to trading.

As an example, you can have a look at this list taken from Open Source Python frameworks:

With Python, you can go as easy as backtest your strategy with three simple lines of code using the fastquant package.

from fastquant import backtest, get_stock_data
jfc = get_stock_data("JFC", "2018-01-01", "2019-01-01")
backtest('smac', jfc, fast_period=15, slow_period=40) 

source: Backtest Your Trading Strategy with Only 3 Lines of Python

Of course, first, you have to create the code for your strategy.

Market Data 

For backtesting purposes, you will need to download your historical market data with the necessary timeframe. The file, in CSV or Excel format, can be easily read by your Python code.

If, later on, you are going to apply your EA live, you will need a real-time streaming data feed. If this is the case, you will need to create an interface to your broker through an MT5 TradeStation (MT4 is not equipped with it).

Easylanguage and Tradestation / Multicharts

Tradestation and Multicharts are dedicated high-level trade stations. Easylanguage, a specialized subset of Pascal, was developed by the Tradestation team to create indicators and trading signals. Both platforms are terrific places to develop trading algorithms, and backtesting is straightforward.

Easylanguage, as its name indicates, was designed to make it as close to natural language as possible. The ample set of its built-in library makes coding simple, so the developer’s primary focus is the trading algorithm.

As this example, please read the code of an adjustable weighting percent blended moving average.

inputs: period1(50),period(20),factor(0.5);

variables: slow(0),fast(0), blended(0), var1(0), var2(0);

slow= average(close,period1);
fast= average(close,period2);

var1 = factor;

if var1<0 then var1=0;
if var1>1 then var1=1;

var2= 1-factor;
blended= (slow*var1)+(fast*var2);

plot1(blended,"blended");


You will see it is relatively easy to understand and follow. Anyway, it would be best if you dedicated some time to really master the language, to avoid or at least minimize coding errors.

Pine Script and Tradingview

Pine script is another specialized language to easily program your own studies and trading strategies if you have an account on Tradingview (which you may open for free). As in the case of Easylanguage, Pinescript is designed to be easily understood. 

Pine studies are used to display indicator information and graphs on a chart. It is preceded by the study() declaration. If you wished to create a strategy for backtesting, you have to use the strategy() declaration.

As with other languages, the best way to begin is by reading other people’s code and modifying it for your own purposes.

Coding strategies in pine script is similar to Easylanguage or MQL5. You create a code taking in mind that it will cycle on each bar in the chosen timeframe. 

We took this example of a MACD indicator from the Pine script quick start guide:

//@version=4

study("MACD")

fast = 12, slow = 26
fastMA = ema(close, fast)
slowMA = ema(close, slow)

macd = fastMA - slowMA
signal = sma(macd, 9)

plot(macd, color=color.blue)
plot(signal, color=color.orange)

Backtesting in Pine script is easy. But, there is no way to perform automated optimization. You will have to do it manually. You should go to the performance summary and the list of trades to find the causes of the lack of performance, apply parameter changes, and see if you get any improvement of that adjustment.

In our next article, we will go through the steps to develop a strategy using the Pine script.

Categories
Forex Daily Topic Forex System Design

Trading System design – Manual Backtesting your Trade Idea

We have a potential trading idea, and we would like to see if it is worthwhile. Is it really critical to code it? No. But very convenient? Yes.

Manual historical backtesting

There is no need to code the strategy to do an initial validation test. All we have to do is pick a chart, go back in time and start performing trades manually. But how to do it properly?

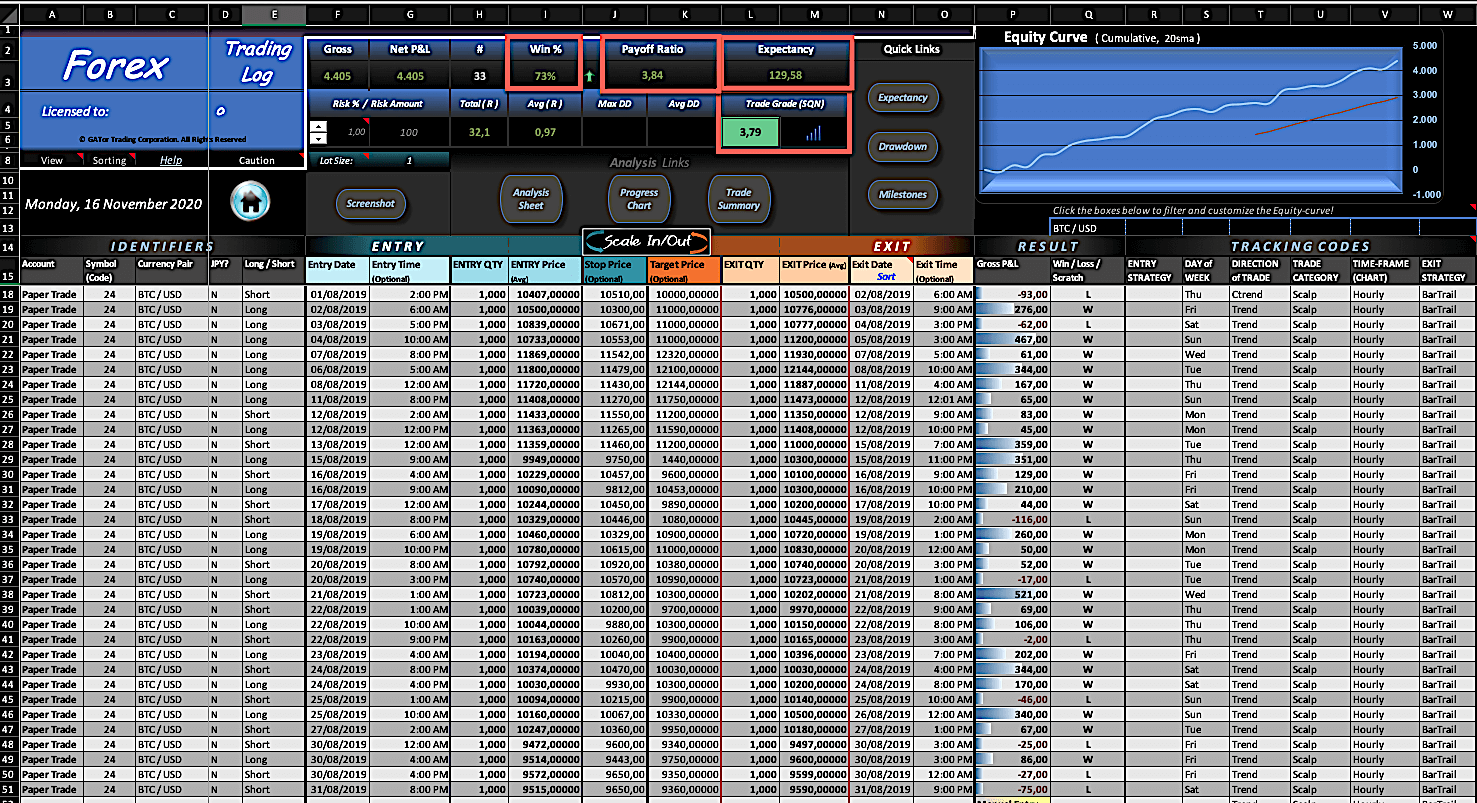
  1.  Use a trading log spreadsheet, as the one forex.academy provides.
  2. Thoroughly describe the methodology, including the rules for entry, stop-loss, and take-profit settings. 
  3. Use a standard 1 unit trade size ( 1 lot, for example) in all the trades.

Once the rules of the game have been set, we position the chart, start moving the action one bar at a time, and trade the chart’s right side. It is critical to take all the signals the strategy offers. Cherrypicking spoils the test.

Market Condition

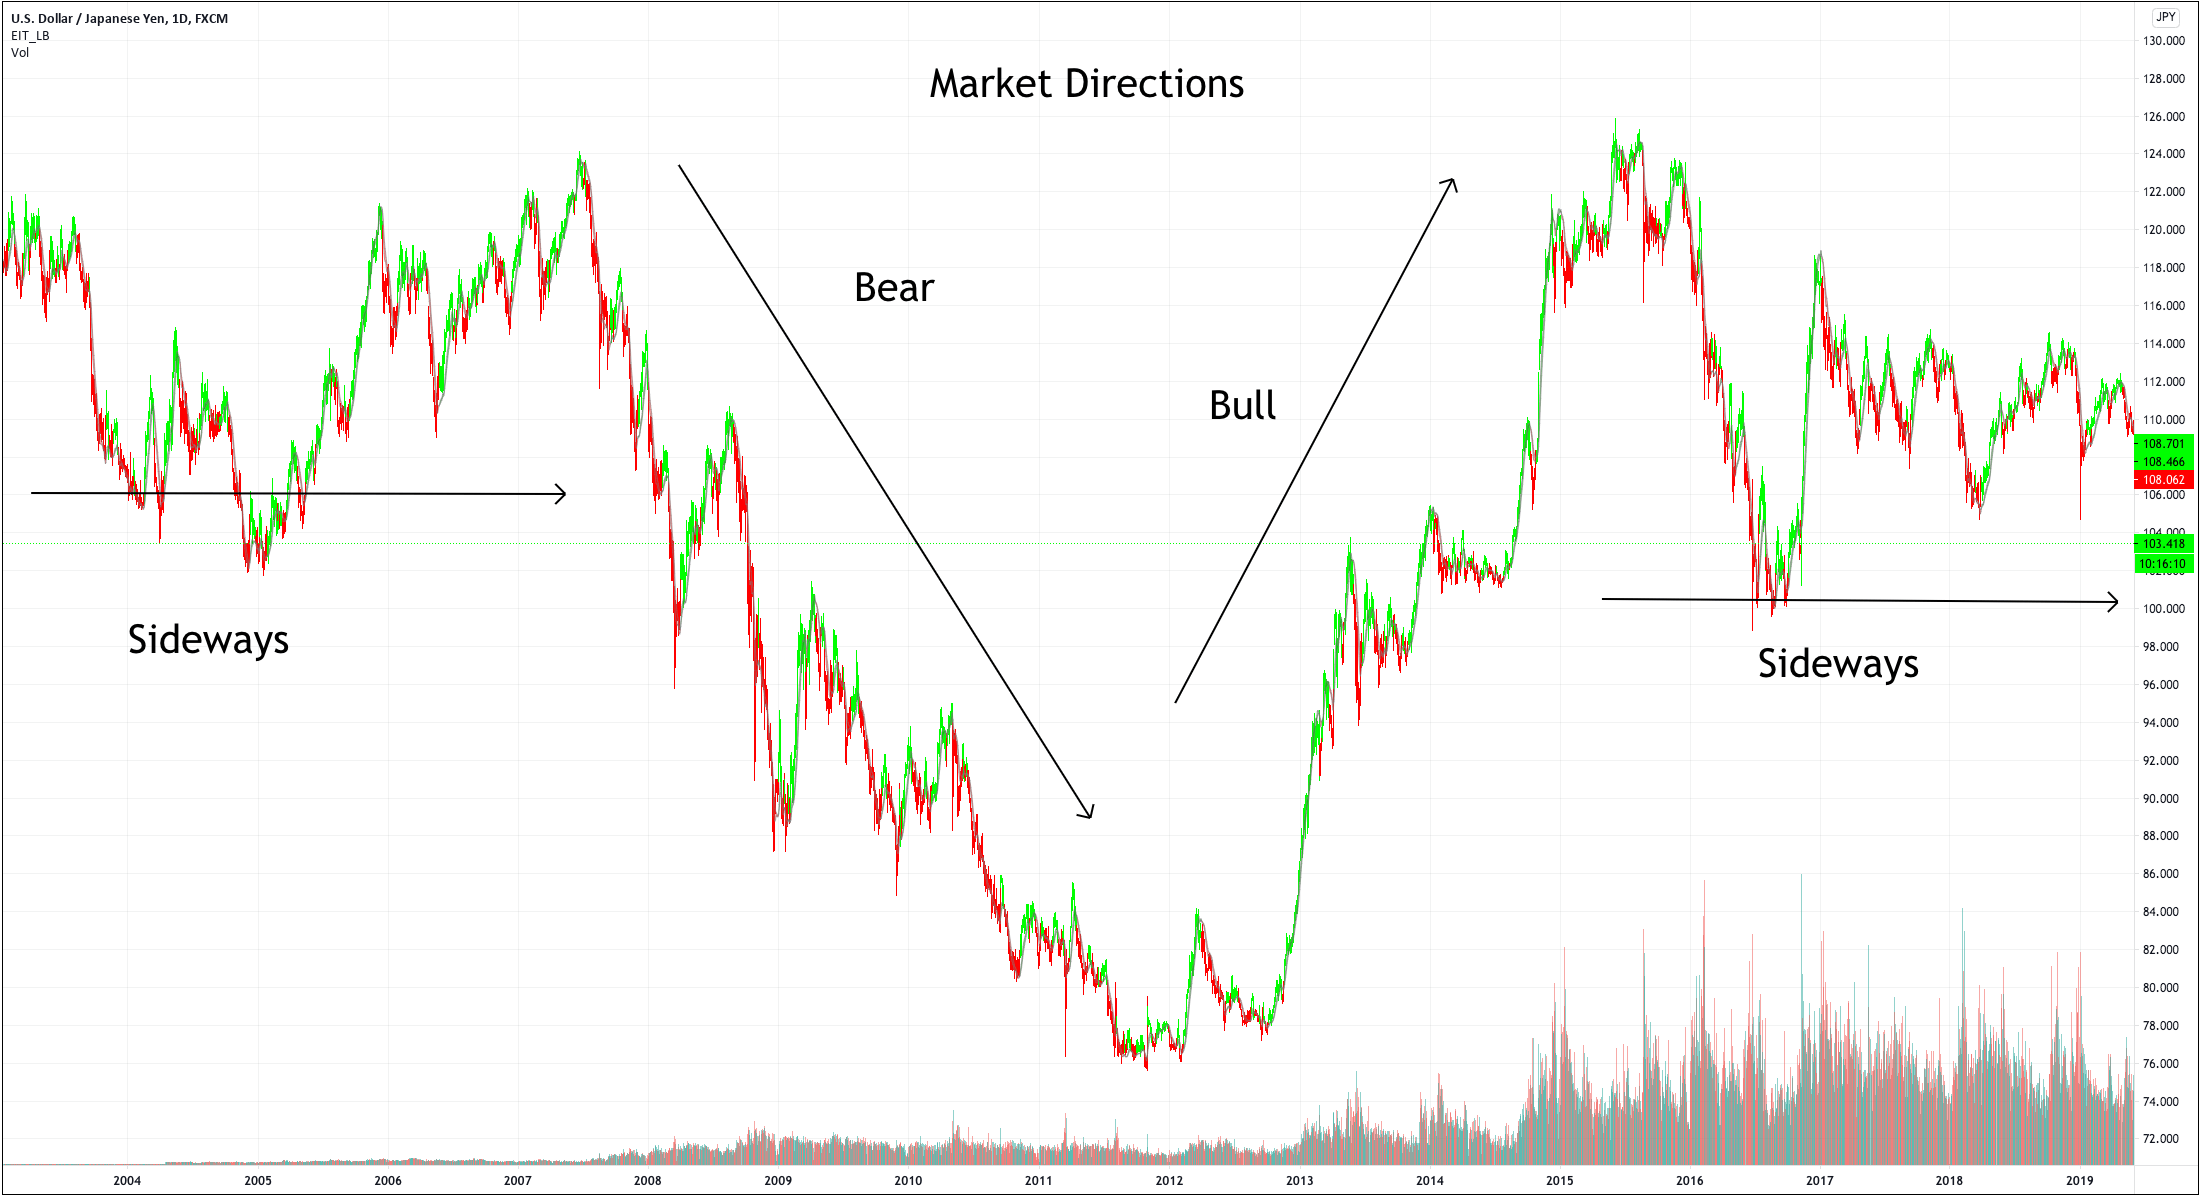
The financial markets move in phases. We should think it has two main phases and three directions.


The two main phases are impulses and corrections.

The three movements are Upward (Bullish), downward (bearish), and sideways (consolidations).

Bear and bull directions are mostly similar in the Forex market because currencies are traded in pairs, so the quote currency’s bear market is the base currency’s bull market and vice-versa. 

With commodities, precious metals, and cryptocurrencies against fiat, this does not hold.

To properly test your strategy, you should apply it in all market directions and phases. Even better is performing a different evaluation for each market state. That way, your evaluation will tell you in which market conditions it works best and in which is not acceptable to apply it; thus, you could create a complementary rule to filter out the market phases in which the strategy fails.

Different markets

You must apply the strategy to all markets you intend to trade using it. As with the market conditions, you should test each market separately. After having all markets tested, you will find useful information regarding how markets the strategy works best and the correlations among markets when using it. That applies, of course, if you use the same timeframes and periods in all markets, which is advisable.

If you do it as said, you can also perform the summation of all markers date by date and assess the overall performance, its main parameters, and system quality.

Pros & Cons of manually backtesting 


  • No programming skills are required.
  • It helps you perceive how a real market evolves trade by trade.
  • You will find the potential logic errors, such as stop-loss wrongly set, take profits too close to the opening, thus 
  • You will be able to correct most of the gross mistakes of the strategy.


  • Cherrypicking. Discipline is key. If you start cherrypicking, you no longer are testing your original idea.
  • Most people doing manual backtesting do not properly trade all phases and markets. Not always thoroughly test all markets and their conditions, as it would require a lot of time. Thus the test is incomplete.
  • Time-consuming. A complete manual backtest takes much longer than a computer-generated backtest.
  • Awkward optimization. Optimization is also tricky and time-consuming. That is so because a parameter change would need another backtesting.

Final words

Manual backtesting allows us to have a first impression of how a new trade idea would fare in real trading, but a thoroughly manual backtest and optimization are time-consuming. Therefore, serious traders should start developing basic programming skills to automate both processes.

Categories
Forex Daily Topic Forex System Design

Trading System design – The pathway to Success

This article outlines the steps needed to find, create, test, and verify a trading system. We have to bear in mind that there is no way to create a forex trading system with an equity curve straight upward. Well, yes, it can be made. I’ve made it, but only optimizing it so much that expecting it to continue performing like this under real trading would be silly. Most trading bots advertise curves like this. If you believe them, your money will be in jeopardy.

It would be best if you’re proficient in coding on a trading platform such as MT4/5, Ctrader, Tradestation, Multicharts, or Ninjatrader. Not all traders can do it, so we will approach this for anyone willing to create a DIY trading system without programming. It would take longer, but the added benefit is you will learn a lot while doing your testing. This methodology will also create simpler and less prone to over-optimization systems.

The results obtained will vary, and not always will we get sound systems. Of course, we should not expect great, drawdown-free equity curves. But, there is no need for that. We will show you that what is necessary is only long-term profitability.


The Idea


The first step to creating a trading system is an idea that will provide us with an edge. Among the most basic concepts are,


  • Breakouts from a range or Fading breakouts from a range


  • price above/below a moving average


  • Moving average crossovers


  • Overbought/oversold conditions using an indicator such as the MACD, the RSI, or the Stochastic


  • Volatility spikes


  • Support/resistance levels


Please bear in mind that the market already knows all these key concepts. Therefore, their direct application would probably fail.


Testing the Idea

The first step to see if the idea has merit is to test it in a historical sample under the market conditions it was supposed to operate. Of course, a trading idea is almost always referring to a market entry, as the concept is supposed to time the market. This entry is usually combined with a stop-loss and a take-profit to create a complete solution.

But, to test the efficacy of the idea, we should forget the stop-loss and take-profit and use a standard exit, be it,

  • After n bars
  • After a percentage profit
  • A random exit.

If you don’t have the means or skills to code, the best solution is closing after a determined number of bars. You can even register the results of closing after 5, 10, and 20 bars, so we test the predicting power at increasing time intervals.

You could also use Tradingview.com to perform the test; therefore, we recommend you open a free account there. The free account gives most of the capabilities of a pro account but is limited to fewer indicators.

There are four kinds of testing:

  • Historical backtest
  • Out‐of‐sample test. Also called forward test
  • Walk‐forward test
  • Real‐time testing

Historical backtest

The Historical backtest is the simplest test. You will need to create a spreadsheet with the required fields and computations.

After defining the rules of the trading idea, you define a start date, for instance, one year ago. For initial testing, it is recommended not to register the trades with spreads and commissions. Just the brute profit.

  1.  Set the desired timeframe and move your chart so that the initial date is near the chart’s right end.
  2. From there, you shift your chart one by one.
  3. When you spot an entry point, you write it down in your trading log:
    1. Trade #
    2. Entry date and time
    3. Trade size: enter one lot
    4. Entry price
    5. Expected stop-loss: use a standard 2 ATR
    6. Expected target: use also 2ATR
    7. Exit price
    8. Exit date and time
    9. Maximum Adverse Excursion: Written down after the trade ended.
    10. Maximum Favorable Excursion: Write down the next pivot point higher/ lower than your exit.
    11. Compute the profit of the transaction.
  4. Continue the test until you reach at least 100 trades.
  5. Compute the statistical figures of your exercise
  6. Average profit: Sum of the profits / N, the number of trades
  7. The standard deviation of the profit = STD (profits)

Optimization

After 100 backtested trades, the developer has enough information to detect the basic mistakes of the strategy. Maybe the entry has a large lag that hurts profits, or, worse, it is too early, thus triggering the stop-loss too often.

We could also spot if the stop-loss can be improved. Maybe it’s too close, so the percent winners are low or too far. The use of the Maximum Adverse Excursion info will surely help in deciding the best placement.

On the profit side, we can use the Maximum Favorable Excursion to check if the system is leaving money on the table. The idea is to adjust the profit target, so most of the trades end close to the MFE level.

Walk-forward Test / Real-time trading

After optimizing the strategy’s main parameters, we could begin a forward test, using a demo account and live market data. We should proceed as if it was a real trade. In this stage, if we use a demo account, you’ll be able to add the costs of the trade: Spread, slippage, and commissions.

This last stage before committing real money should last at least one month, preferably two or three months, during which you should continue detecting errors, improving the strategy, and having a feel of its behavior. In this stage and the coming use with real money, the trader needs to be disciplined and accept all signals the system delivers. You cannot cherry-pick the trades because this introduces a random factor that will change your system’s parameters, so you’re losing information about it.

Changing the parameters of the system

When trading it live for several trades, you may feel you need to optimize your system. This is wrong. Of course, you may adapt the system to the market, but modifying it too often is a mistake. You need to have statistical evidence that something has changed and the system is now underperforming. Therefore, at least 30 trades must occur before doing a change. In fact, since the distribution of results is not normally distributed, it would be optimal to wait for about 60-100 trades for a measure with statistical significance.

Starting light

That means you need to start slow, risking no more than 0.5 percent on every trade, or whatever you consider is small for you. That way, you won’t be affected psychologically, follow the system for the required time to have propper stats, and get a grip on the normal behavior of your strategy.

Categories
Forex Daily Topic Forex System Design

Trading System design – Basic Concepts

In previous articles, we explained the importance of a plan to succeed in Forex and described its general features. In this article, we will describe the concepts that need to be considered when designing a trading system.

A trading strategy is what most traders call a trading system, but it is not. A trading strategy is just a set of loose rules discretionary traders use to trade. A trading system is a set of closed rules used to systematically trade the market, usually through a computer EA, although a disciplined trader could also use it.

Traders, especially novice traders, get emotional and lose money because their emotions interfere and stop making rational decisions in the battle’s heat. Thus, the first thing to avoid is discretionary trading. Please read the article Know the Two Systems Operating inside Your Head. That’s why what we aim to create is a trading system that should be systematically traded.

Price imbalances

There are plenty of criteria to find these imbalances. There are two visual clues we can think of. The first one is a rubber band. The rubber band idea describes the price as if it was a rubber band or spring. When it moves far away from equilibrium, we expect the force to pull it to its center to increase and eventually drive it back to equilibrium.

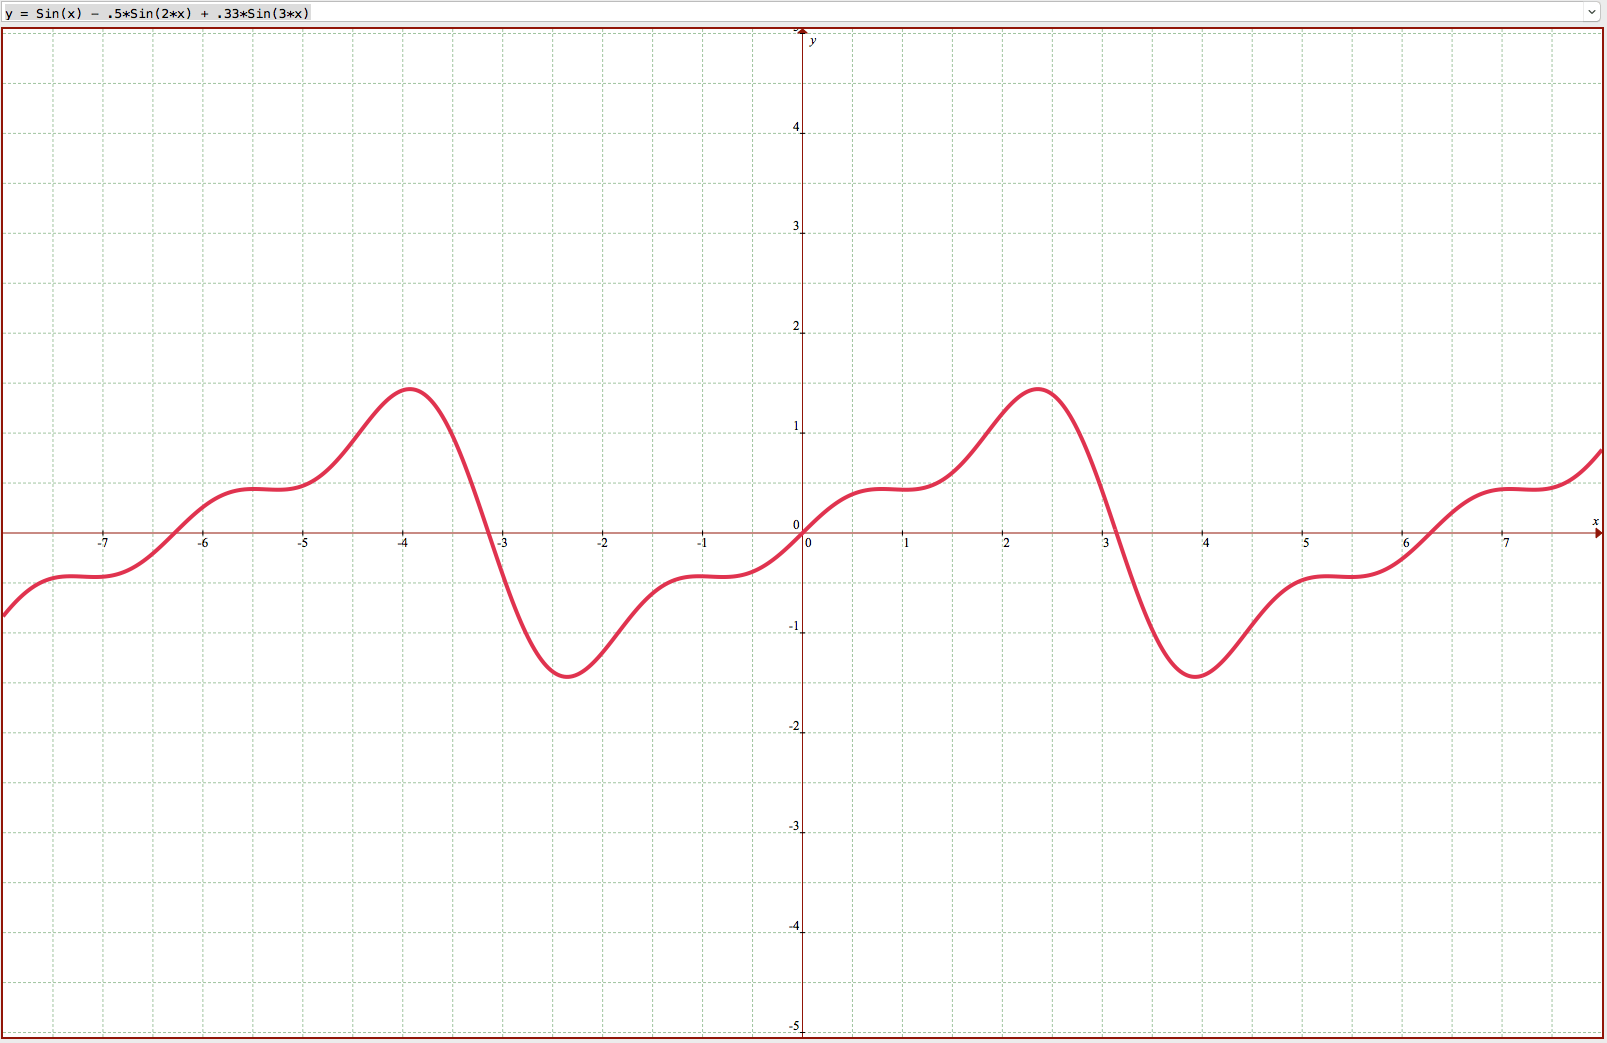
The second visual clue is looking at the price moving in waves. Since there are numerous traders, their goals set in different timeframes, we can expect waves of different periods and amplitudes. A trend form when the combination of different waves are in sync, and chaotic moves occur when waves desync.

The main idea of a trading system is to find imbalances in the price and profit from it. Essentially, it takes the form of “buy low and sell high,” “sell high to buy back low,” or its variants “buy high sell higher,” “sell low, sell lower.”

The Effect of timeframes and a portfolio in the trading results

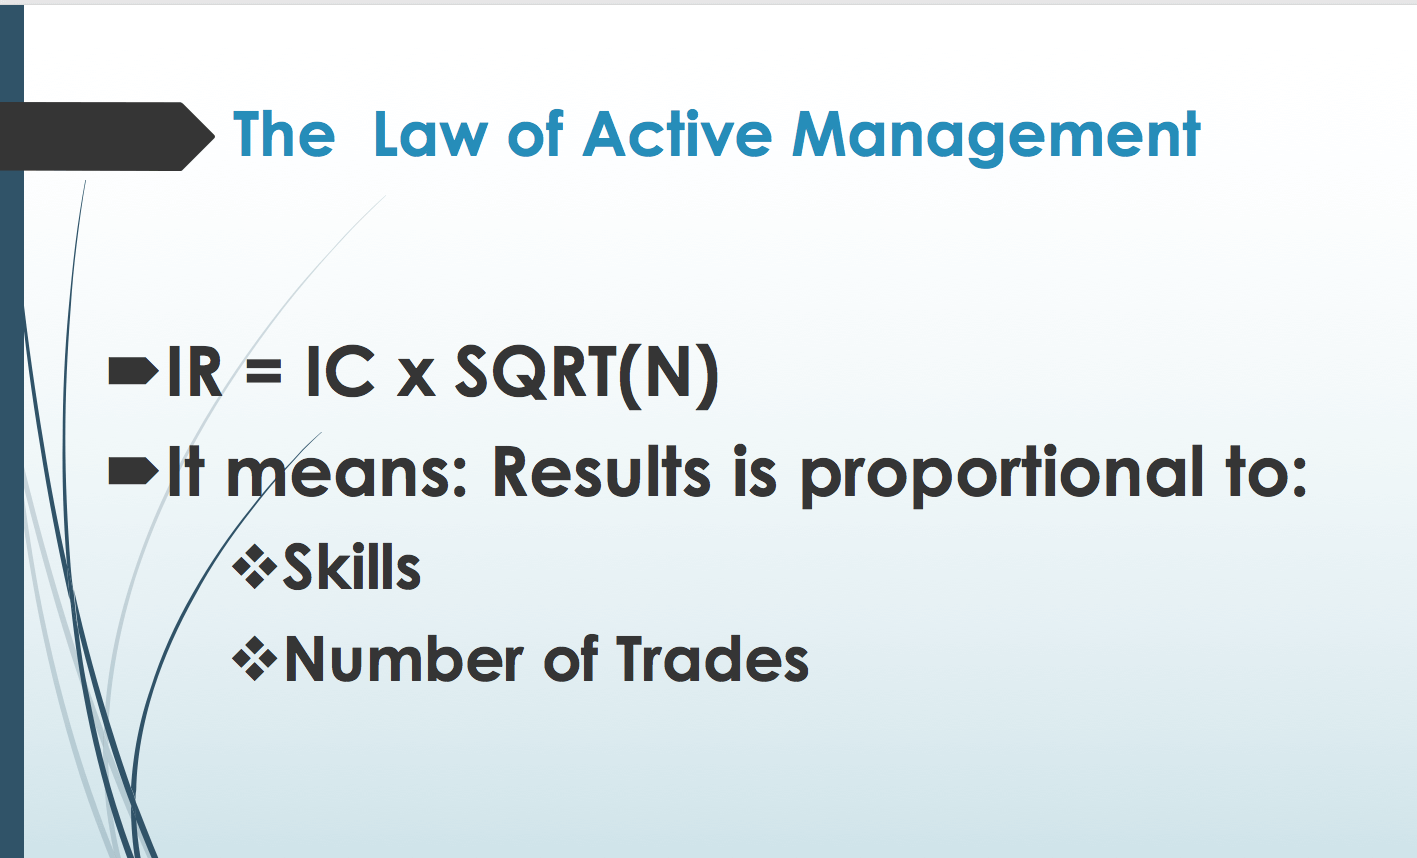
In their book Active portfolio management, Grinold and Kahn described the fundamental law of active management. The formula has two variables: The manager’s skill (IC) and the number of investments performed (N).

We could think of IR ( Information Coefficient) as a quality index of the results.

If we analyze the equation, we see that IC measures a trader’s ability to produce profits, since if N is constant, IR grows if IC grows.

But, if we keep the IC constant, we see that IR grows with the number of trades (N).

This explains that a portfolio of assets will be more profitable than only one asset. It also explains why shorter trading timeframes would produce higher results. Of course, with very short timeframes, the trading costs would eat a growing portion of the profits, so there is a limit to how short we could go.

Diversification

Diversification is a key concept to reduce the overall risk in trading. The idea is simple. Let’s say we have a long position the EURUSD with an overall dollar risk of 10 pips. If the dollar moves up and drives the pair southwards, we lose $100 on every lot. If we have an equivalent long position on the USDJPY, we will cover the risk on the EURUSD with the gains on the USDJPY, driving it to zero or, even, being positive overall.

If the assets are uncorrelated and the risk on each trade is similar on all trades, the overall basket’s risk will less than 50% of the sum of all open trades risk.

The profitability rule

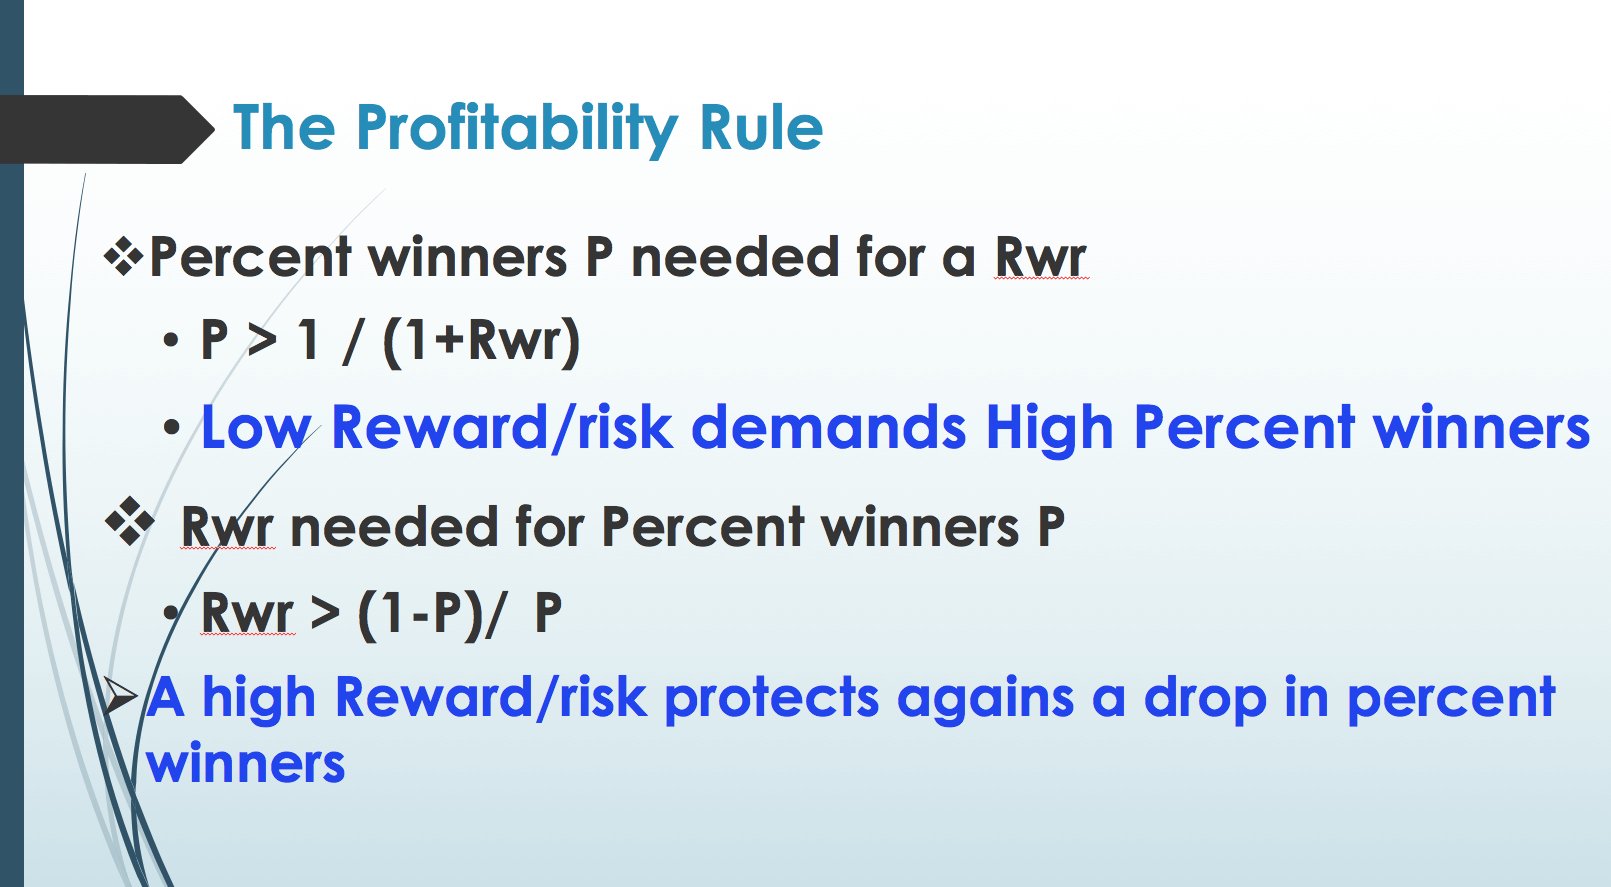
Two parameters define the profitability of a system: the percent winners and the reward risk ratio.

The formula that tells the minimum percent winners (P) required with a determined reward/risk ratio (Rwr) for the system to be profitable is:

P > 1 / (1+Rwr) 

Conversely, below is the formula of the minimum reward/risk ratio needed with a determined percent winners figure on a profitable system:

Rwr > (1-P)/P

If you play with the second formula, you will see that at reward/risk ratios below one, the system should grant winners higher than 50 percent. Furthermore, Systems with high reward risk ratios would need less than 50% winners to be profitable.

The conclusion is we must look for systems with high reward/risk ratios to protect us from periods of low winner’s percent.

Assessing the quality of a trading system

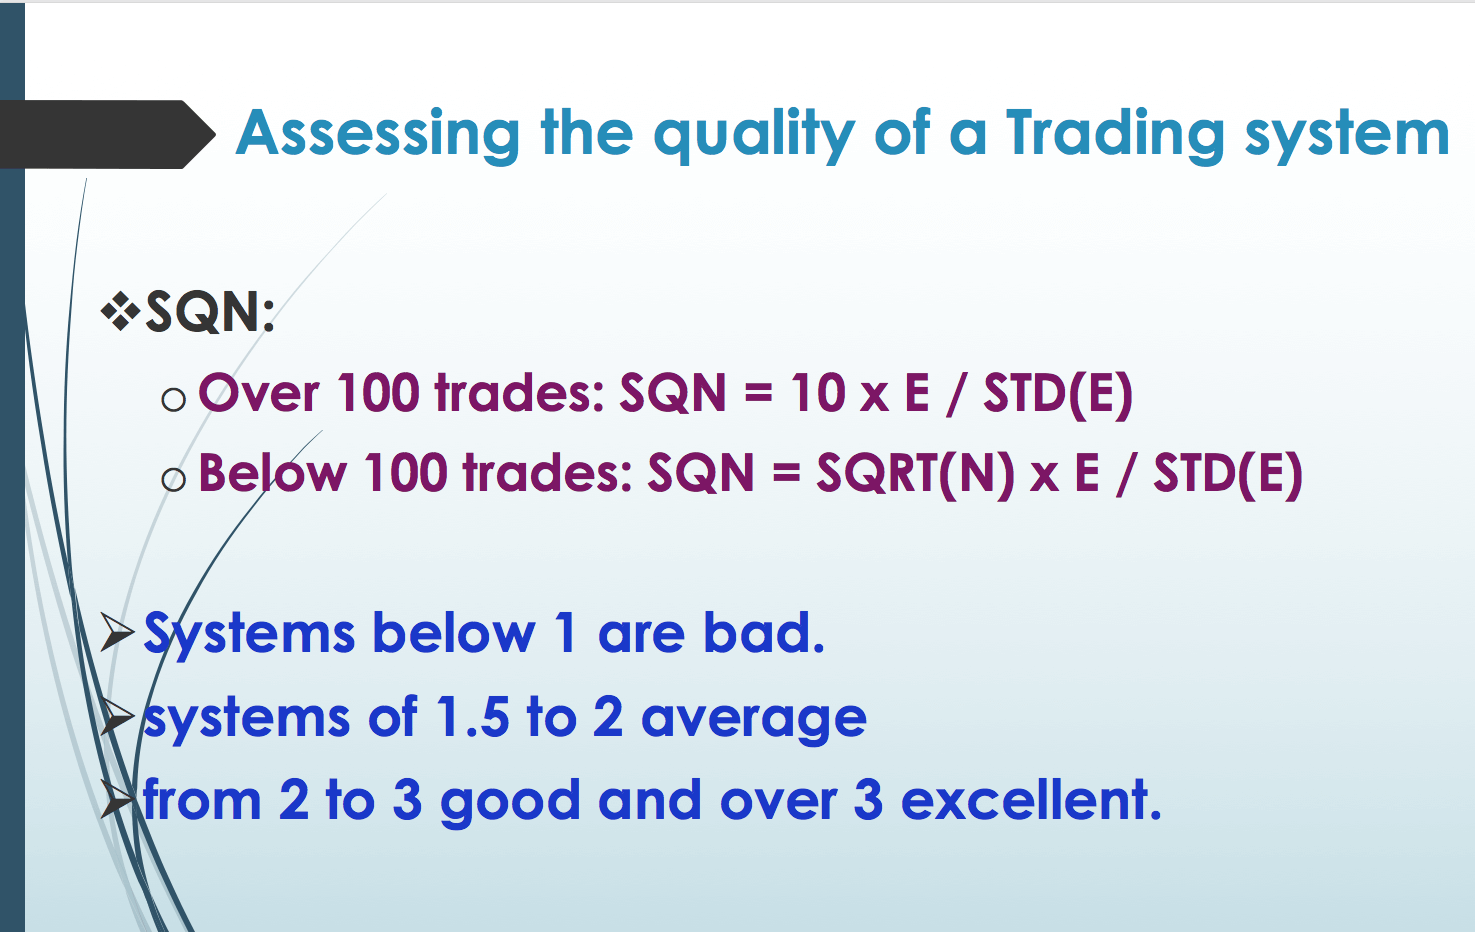
There are several methods to measure the quality of a trading system. We propose the use of Van Tharp’s SQN, which is a variation of the chi-square test, a well-known method to evaluate the goodness of a sample against a random distribution. The SQN test is a Chi-square test that is capped to 100 samples so that the length of the sample does not modify its value.

  SQN = 10 x E / STD(E)

Where E is the expected profit on each trade, which is the sum of all profits divided by the number of trades, and the denominator is the standard deviation of E.

But if the sample is less than 100 instead of 10, the multiplier is the square root of N, the number of trades.

SQN = √N x E / STD(E)

Systems below 1 are bad. systems of 1.5 to 2 average, and from 2 to 3 good and over 3 excellent.

Elements of a Trading System

We can decompose a trading system into its several elements, although not all of them need to be present.  We have already discussed this, but let’s describe its basic elements.

A Setup: The setup is a market state where we think there is an imbalance in the price, or a condition we expect can be resolved with a price move, for example, the price reaching a top or a bottom of a channel.

A permissioning filter: This forbids trading under specific market conditions: Low volume, extreme volatility, particular hours or days.

Entries: This the stage that times the market. It can be a breakout, a candlestick pattern, or an indicator signal.

Stop-loss: This defined an invalidation level, under which the trade is likely no longer profitable. This level will limit our losses and save our capital for further trades.

Take-profit: It defines our planned profit. It may be set using support/resistance levels or any other sign the current trade movement is over, such as a reversal signal or the crossover of averages.

Re-entry rule: You may also consider this rule in your findings. For instance, a market failing to do something, for example, continue moving up, may signify it will move down. Thus, you could stop and reverse instead of close the position. Also, if you got out of a position, you could consider re-entry if the market flags a continuation of the previous movement. That way, you could tight your stops keeping most of your profits and reenter instead of loose stops, which may eat a large portion of your hard-earned profits if the market does not recover.

Categories
Forex Daily Topic Forex System Design

Building a Trading System: Elements of a Trading Plan

Now that we know the importance of having a plan, let’s discuss the necessary components of a trading plan.

A trading plan should consist of at least these elements:

  1. A basket of instruments
  2. A trading system consisting of timeframes, permissioning filter, entry rules, trade management: stop-loss, take profits.
  3. A position sizing methodology
  4. A trading record
  5. Trade-forensics analysis.

In this article, we will provide an overview of these elements.

A basket of Instruments

Every asset has its characteristics, and its market movement differs from others on volatility, liquidity, and ranges. Therefore, professional traders track a limited basket of instruments to trade. A few, even, specialize and trade just one instrument.


The best criteria to decide which are best are:

  • Liquidity: It means how much trading volume it moves. Illiquid assets are easy to manipulate, spreads (the difference between the bid and ask prices) are wider, and the trading rules fail more often.
  • Price Action: The instrument should have enough swings in the trading timeframe to merit trading it. Instruments that do not move or move too erratically are prone to failed trades. A security that trends are the best.
  • Familiarity: As said, your trading results improve if you’re familiar with how an asset moves, its usual support and resistance levels, the typical length of swings, and so on.
  • Economic Data: Economic news releases affect the security and trading signals fail at the time of the release. Therefore, it is advisable not to trade it in the vicinity of a news release.

The Trading System

As said in our previous video, financial markets are unbounded territories where each trader needs to set his own rules; otherwise, they will be influenced by his emotions and fail. A trading system is their set of rules that enable them a long-term success.


Timeframes

The chosen timeframe should match the availability to trade. A trader with a day job would need to select a daily or a 12-hour timeframe, whereas a full-time trader could use shorter frames, such as 15-min, one, two, or four-hour timeframes.

Similarly to asset selection, the trader must familiarize himself with how his assets move in these timeframes and evaluate the liquidity and range at different times and weekdays to choose the best periods to trade.

Permisioning filter

A permisioning filter is a way to avoid trading under determined circumstances. It can be a filter that allows only trading in the direction of the primary trend or an overbought/oversold sign that should be on for a determined candlestick or pattern formation to be valid.

The key idea of the permisioning filter is to screen the trades and pick the ones with the best odds of success.

Entry rules

Entry rules can be technical or fundamental rules to time the market, although we will focus on technical rules.


There are two philosophies regarding entries.

  • Enter on the trend’s weakness

This methodology aims to profit from pullbacks of a primary trend to optimize the price entry. Different indicators and patterns may help time the entry: MA crossovers, Oscillators, or reversal candlestick patterns such as the engulfing pattern or morning star and evening star.

  • Enter on the trend’s strength.

Enter on strength aims to profit from an increasing momentum of the price. We acknowledge the trend’s strength is increasing and recognize the trend will continue for a while. Technical indicators such as the Momentum, RSI, and MACD may help time the entry. Price action patterns, such as range breakouts, are quite useful too.

Trade Management

Trade management is a vital element of any trading system. It is responsible for getting out of unprofitable positions, trails the stops to break-even, and above to optimize profits or close the trade when the target is hit or when a technical signal warns of a trend reversal.

Many top traders value more trade management than entries. The money is won on exits, they say.

Money management should be consistent with the concept of cutting losses short and letting profits run. A sound trading system should present an average reward/risk ratio at least over 1.5, and ideally above 2.

Position sizing

Position sizing is the part of your plan that tells you how much risk you should take on a trade. We have had a complete video section on this subject, which we encourage you to study. To summarize it here, position sizing is the tool to help you reach the trading objectives and put drawdown under the levels that fit you. Finally, proper position sizing enables you to minimize the risk of ruin while optimizing your trading account’s growth.

The trading record / Trade-forensics

The path to improvement is an analysis of past results. Nobody is perfect, and, also, markets aren’t immutable but changing. A trading record is necessary to evaluate your system’s performance, detect and correct weaknesses, such as stops or target placements, errors in timing – too late or too early on a trade, and evaluate how permisioning filters work. Finally, the trading record will help traders know their system’s key parameters: the average profit and its standard deviation, percent winners, and average reward/risk.

Key Elements of the trading record:

The main data you should record on the spreadsheet record are:

  • Entry date/time
  • entry price
  • trade size
  • entry level
  • stop-loss level
  •  $risk of the trade
  • planned take-profit level
  • Exit price
  • Exit date/ time

Other desirable parameters that would help optimize stops and take-profit targets are:

maximum adverse price of the trade if there were no stops.

maximum favorable price of the trade if not considering the take-profit

The first one would help you find better places for the stops, and the second one will show you the best place for the take-profit placement.

Main Parameters:

With the suggested trading record entries, you will be able to measure the key parameters of your system:

Average profit: Total profits/ number of trades

Standard deviation of profits: Use Excel’s Standard Deviation formula

Percent winners: Nr of Winners/ total trades x 100.

Average Reward/ risk:  Sum of Profits / sum of $risk

You may find an example of a trading record in this forex.academy article. Furthermore, since we consider it an essential element to your trading success, we offer you to download our freely available trading log. You are free to adapt it to your taste and needs.

Forensics

After the closure of a trade, you should analyze its quality, regarding execution and goals. A losing trade does not have to be of low quality if executed according to your system’s rules. But it is necessary to determine if you’re acting according to the rules and assess how much of the available profit did you take.

Points to consider

  • Percent of the available profit ( if any)
  • percent of the loss you’ve taken ( if any)
  • Timing: has it been right, too early, or too late?
  • Exit timing: right, too early, or too late?
  • Stop-loss: Can stop-loss settings be improved?
  • Take profit: Can they be improved?
  • Average Reward/risk: is it according to your settings?

Also, after  a determined number of trades/weeks, you should assess:

  • Is the system improving or worsening over time?
  • Losing streaks: are normal for the system you’re using or due to bad stop-loss settings?
  • How many trades could be on profit if you’ve loosened your stops?
  • How much profit could you pocket if your take-profit levels were moved here/there, based on the maximum favorable price data?


This ends our overview of the main elements of the trading plan.

Categories
Forex Daily Topic Forex System Design

Building a Trading System: Why do you need a trading plan?

The necessity of a trading system has been discussed many times. Still,  new traders don’t consider it important when, in fact, it is a crucial element.  Could you conceive building a bridge without a project, playing tennis, or chess, with no strategy?


The trading profession is alike. If you take this business seriously, you’ll need to have a plan. Else, you’ll be in the loser team, in which are 90 percent of traders.

Reasons for a trading plan

1.- The financial markets are not deterministic

A market is a strange place where you cannot predict an outcome. An engineer can design a bridge, knowing that he can predict the bridge’s strength and behavior under heavy loads with proper calculations.  In the financial markets, you don’t have the benefit of an analytical formula to success. All you can expect is a small edge. Not following your plan is comparable to random trading; thus, losing the edge.

2.- Not following a plan weakens you psychologically

When you buy a lottery ticket or play roulette, you’re entering a bounded game. You know the cost of your ticket, the reward associated with a successful bet, and you don’t need to make any other decision. All parameters of the play, including the exit time, are fixed.

The financial markets are different. Everything there is unrestricted. The trader decides when, how much, exit time, stops, and target levels.  With so many parameters, a trader needs to define his rules and stick to them. Otherwise, he will be shattered by his emotions and lose money.

3.- The need to measure

Traders need to record and analyze their trades for many reasons.  The first is the need to analyze their performance and see if it has improved or not. Also, if the system performs as expected or lags its past performance. The most important reason is that traders need to know the strategy’s main parameters: percentage of winners, reward/risk ratio, the average profit and its standard deviation.

A trading plan that fits you

New traders don’t know much about statistics, and trading is about odds and their properties. One of them is streaks. There are winning streaks and losing streaks. The point is, streaks are mathematically linked to the ods of the system.

Let’s think of a system as a loaded coin, in which the odds of a winner can be different from 50 percent. Let’s say the odds of a system is 60 percent instead.  That means there is a 60 percent chance the next trade is a winner, and, consequently, a 40 percent chance it is a loser.

But what are the odds of a loser after a previous losing trade (a two-losing streak)? For the second trade to be a loser, the first one should also be a loser.  So the odds of two consecutive losing trades in a row is 0.4 x 0.4 = 16%. The odds of three successive losers would be 0.4×0.4×0.4 =6.4%, and so on.

The general formula for the probability of a losing streak is

n-losing-Streak = prob_lossn

which is the probability of one loss to the power of n, the size of the losing streak.

What we have shown here is that streaks are inherent to trading. In fact, inherent to any event with uncertainty. Golf pros, football players, and spot teams are subject to streaks, which are entirely expected. Trading systems are no different.

So, what’s the problem?

There are a variety of trading systems. Some, such as the well-established Turtles Trading System, which is trend-following, have less than 38 percent winners, although with average reward/risk ratios over 5. Other systems show over 70 percent success but reward/risk ratios of less than 1.

The odds of a 10-losing streak on the Turtles system, assuming 38% winners or 62% losers, is about 0.84%. That means we can expect ten losers in a row every 120 trades.

On a 70% winner system, the odds for ten losers in a row are one every 200 thousand trades.

The rationale behind the turtle is to lose small and profit big. When a Turtle trader sees they are right, they add to their position, and on and on, following the trend.

People who use the later system are scalpers that jump for the small profit and get our fast before the movement fades.

Nobody is wrong. They trade what best fits their psychology. You need to know your limits, as well. Many wannabe traders move from system to system after only a five-losing streak, discarding a sound strategy when its first perfectly normal streak occurs. Also, most traders use sizes inconsistent with the expected streaks and lose their entire account.

By now, you should have learned the importance of having a plan that fits your psychology and trading tastes.

In the coming article, we will discuss the components of a trading strategy or system. Stay tuned!

Categories
Forex Education Forex System Design

How to Optimize a Trading Strategy

Introduction

Once the developer successfully ends both the multi-market and multiperiod test of a trading strategy, he can move to the optimization process. However, there are some risks associated with its execution that the developer should recognize.

In this educational article, we’ll present the different stages of a trading strategy’s optimization process.

Preparing for the Optimization

After passing the multimarket and multiperiod test, the developer has verified that the trading strategy works. Therefore, he could move toward the next stage that corresponds to the trading strategy optimization.

Optimization is used to determine the optimal parameters for the best result of a specific process. In terms of trading strategy, the optimization corresponds to selecting the most robust parameter set of a strategy that would provide the peak performance in real-time markets. 

Nevertheless, selecting the highest performance that provides the most robust set of parameters can result in challenging work. This situation occurs because each set of parameters will correspond to a specific historical data range used in each simulation.

In this regard, the developer’s top parameter selection must be part of a set of evaluation criteria defined before executing the optimization process.

Risks in Optimization

The optimization has pitfalls that the developer must consider at the time of its execution; these traps can lead to increased risks when applying the trading strategy.

The first risk is overconfidence that the results obtained during optimization will produce the same market results in real-time. The developer must understand the strategy and each effect of the results obtained in each part of the optimization stage.

The second risk involves excessive overfitting of the strategy’s parameters. This risk is due to the execution of the optimization without considering the guidelines and appropriate statistical procedures.

Finally, using a wide range of parameters can lead to obtaining extremely positive backtested results. However, such positive returns generated during the optimization stage do not guarantee that they will happen in real-time markets.

Optimizing a Trading Strategy in MT4

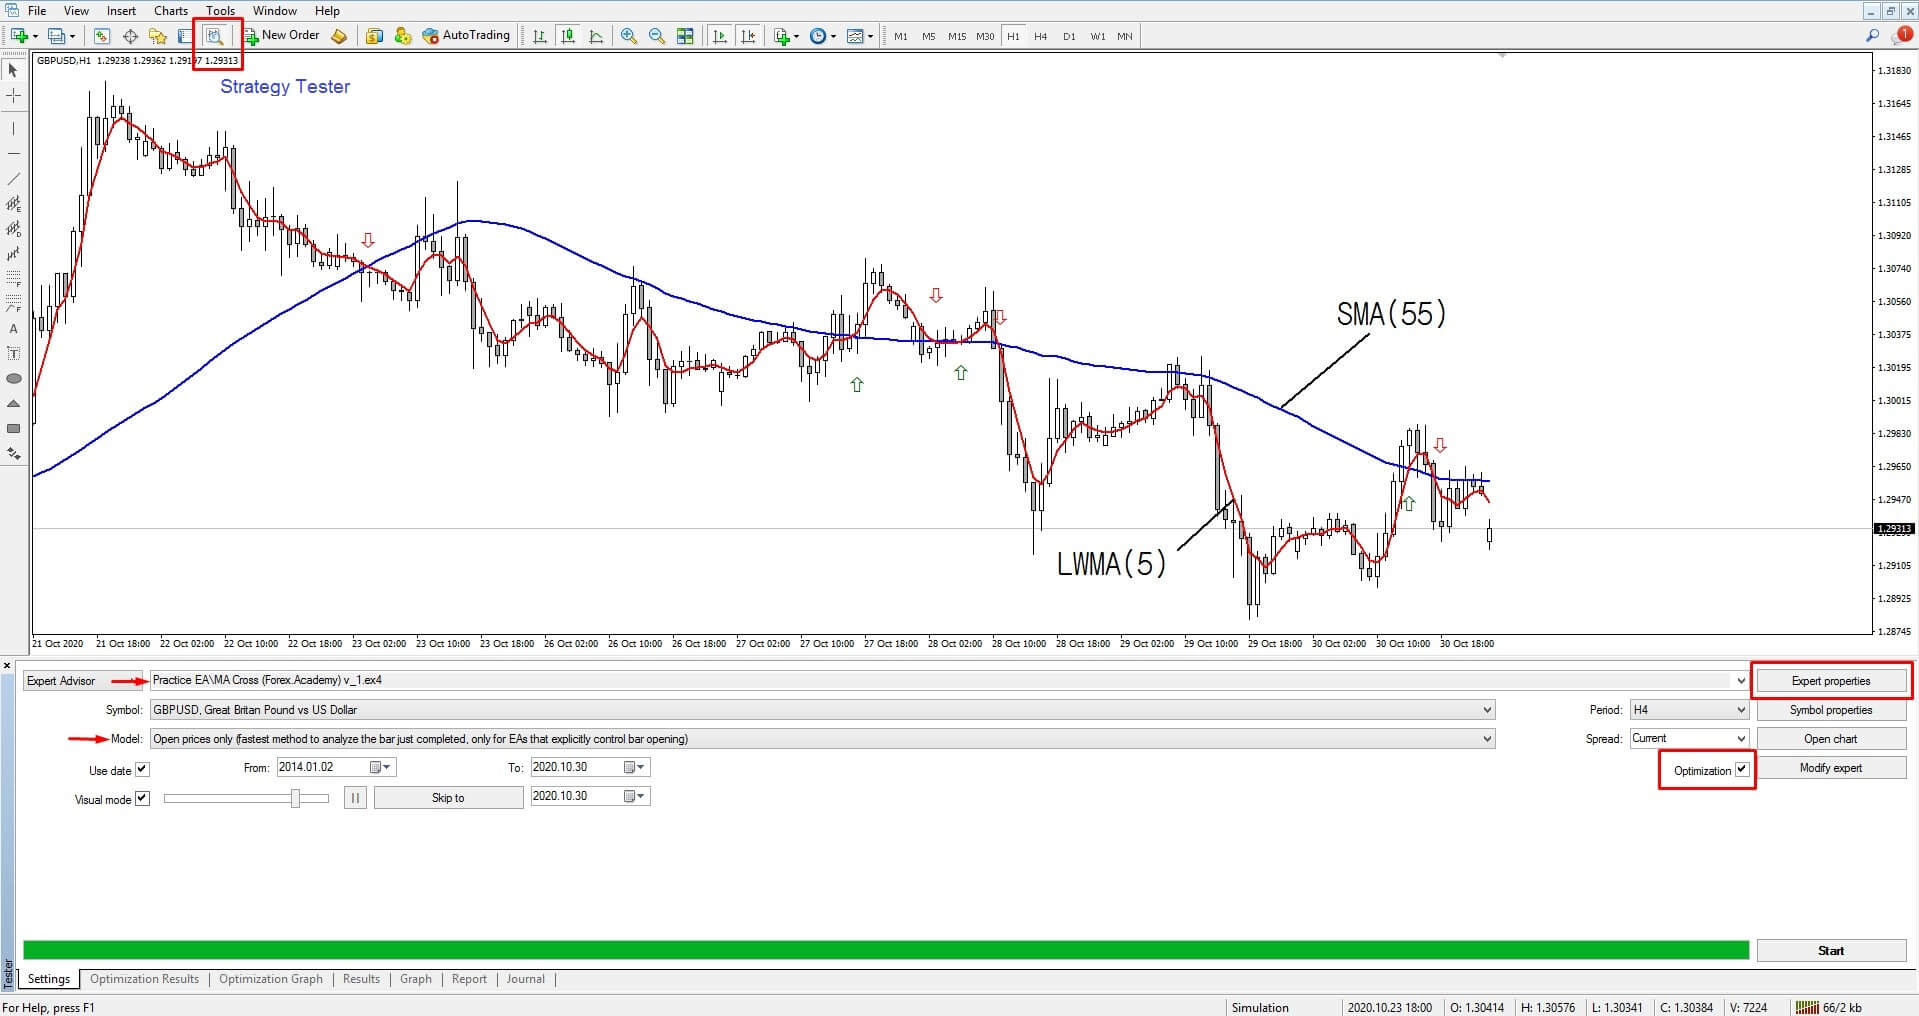
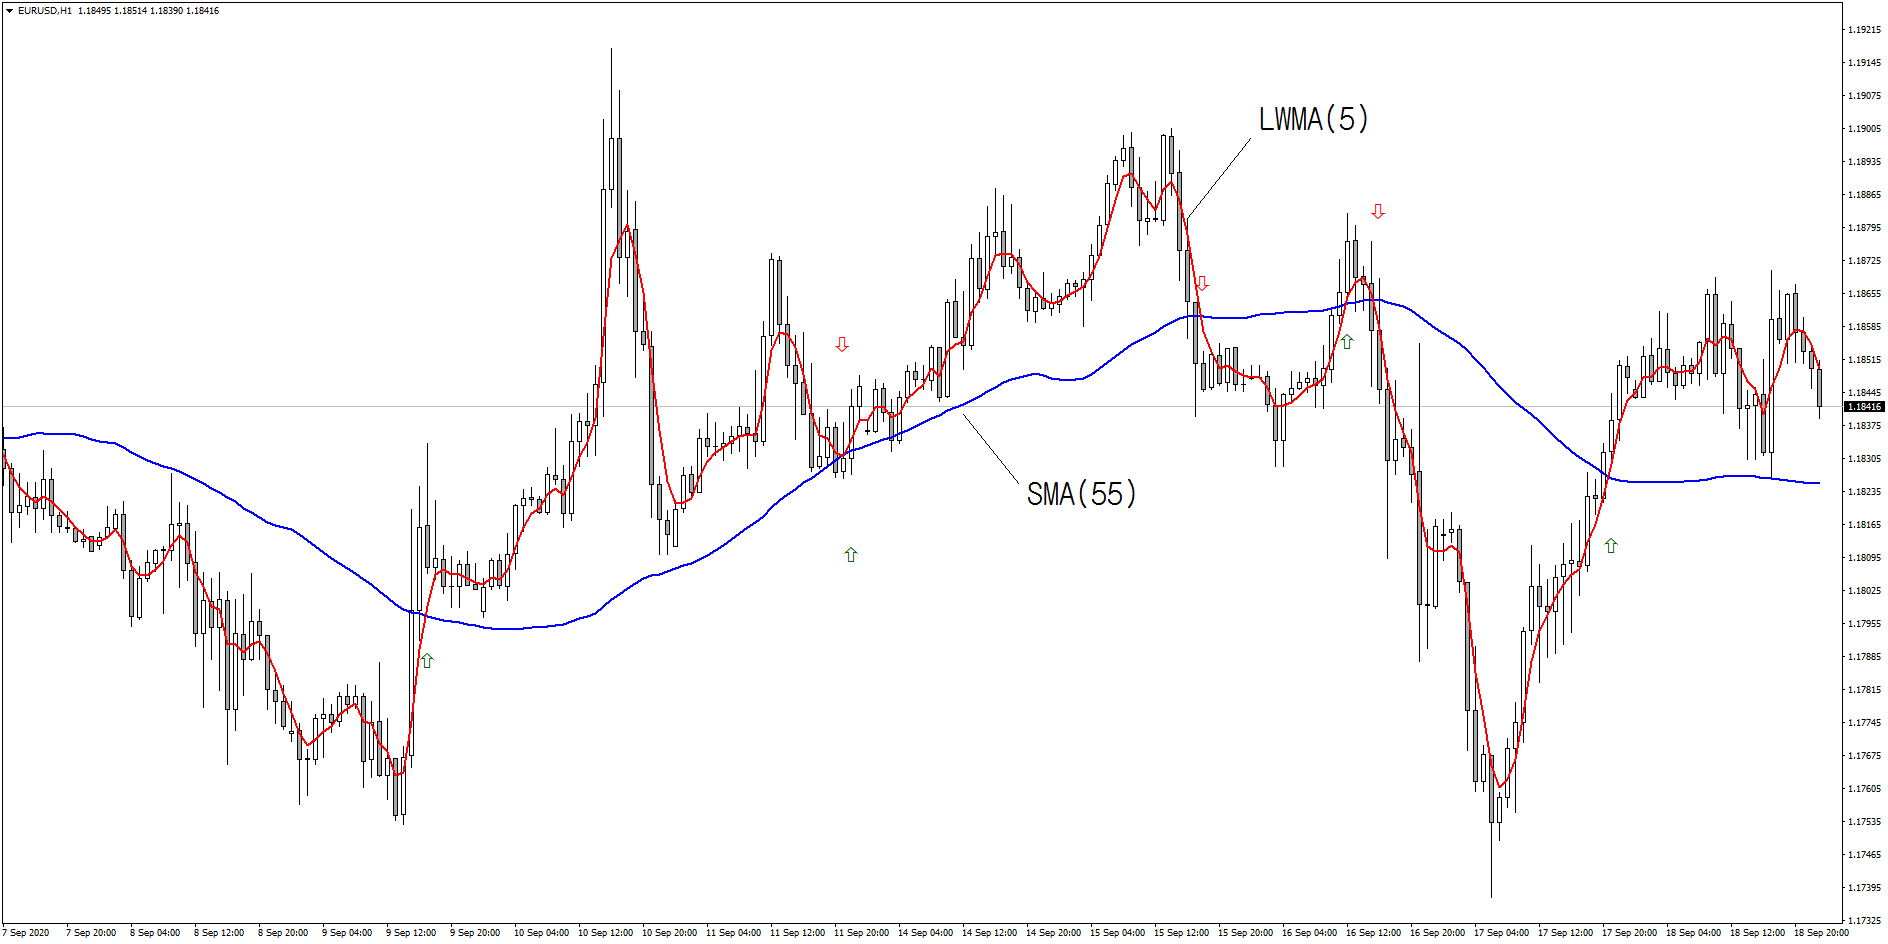
In a previous educational article, we presented the development process of a trading strategy based on the crossings of two moving averages, which corresponds to a linear weighted moving average (LWMA) of 5 periods and a simple moving average (SMA) of 55 periods. 

This example considers the execution of an optimization corresponding to both moving averages, and the optimization’s objective will be to find the highest profit.

Before executing the optimization, the developer must select the Strategy Tester located in the toolbar, as illustrated in the next figure.

Once picked the trading strategy to optimize, it must select “Expert Properties,” where the developer will identify and define the parameters to optimize.

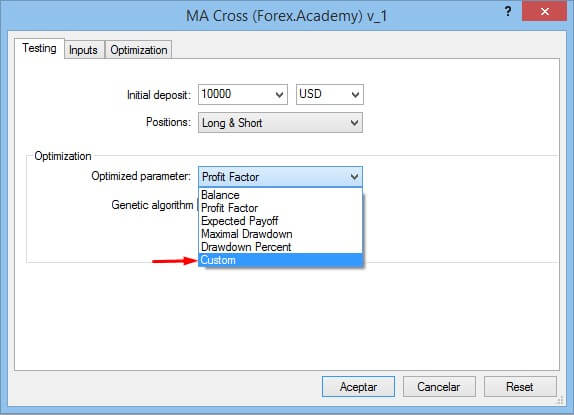
The next figure illustrates the “Expert Properties” box. In the first tab, the developer will select the Testing properties, where the “Custom” option will provide a broad range of outputs for each scenario obtained during the simulation stage. 

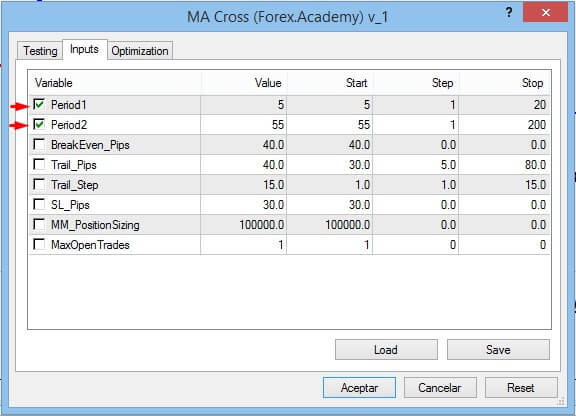
After the Testing selection criteria, the developer can select the parameters to optimize during the historical simulation. In the example, the parameters to optimize will be the fast (LWMA(5)) and the slow (SMA(55)) moving averages. The developer must consider that as long as it increases the parameters to optimize simultaneously, the simulation will increase its length of time.

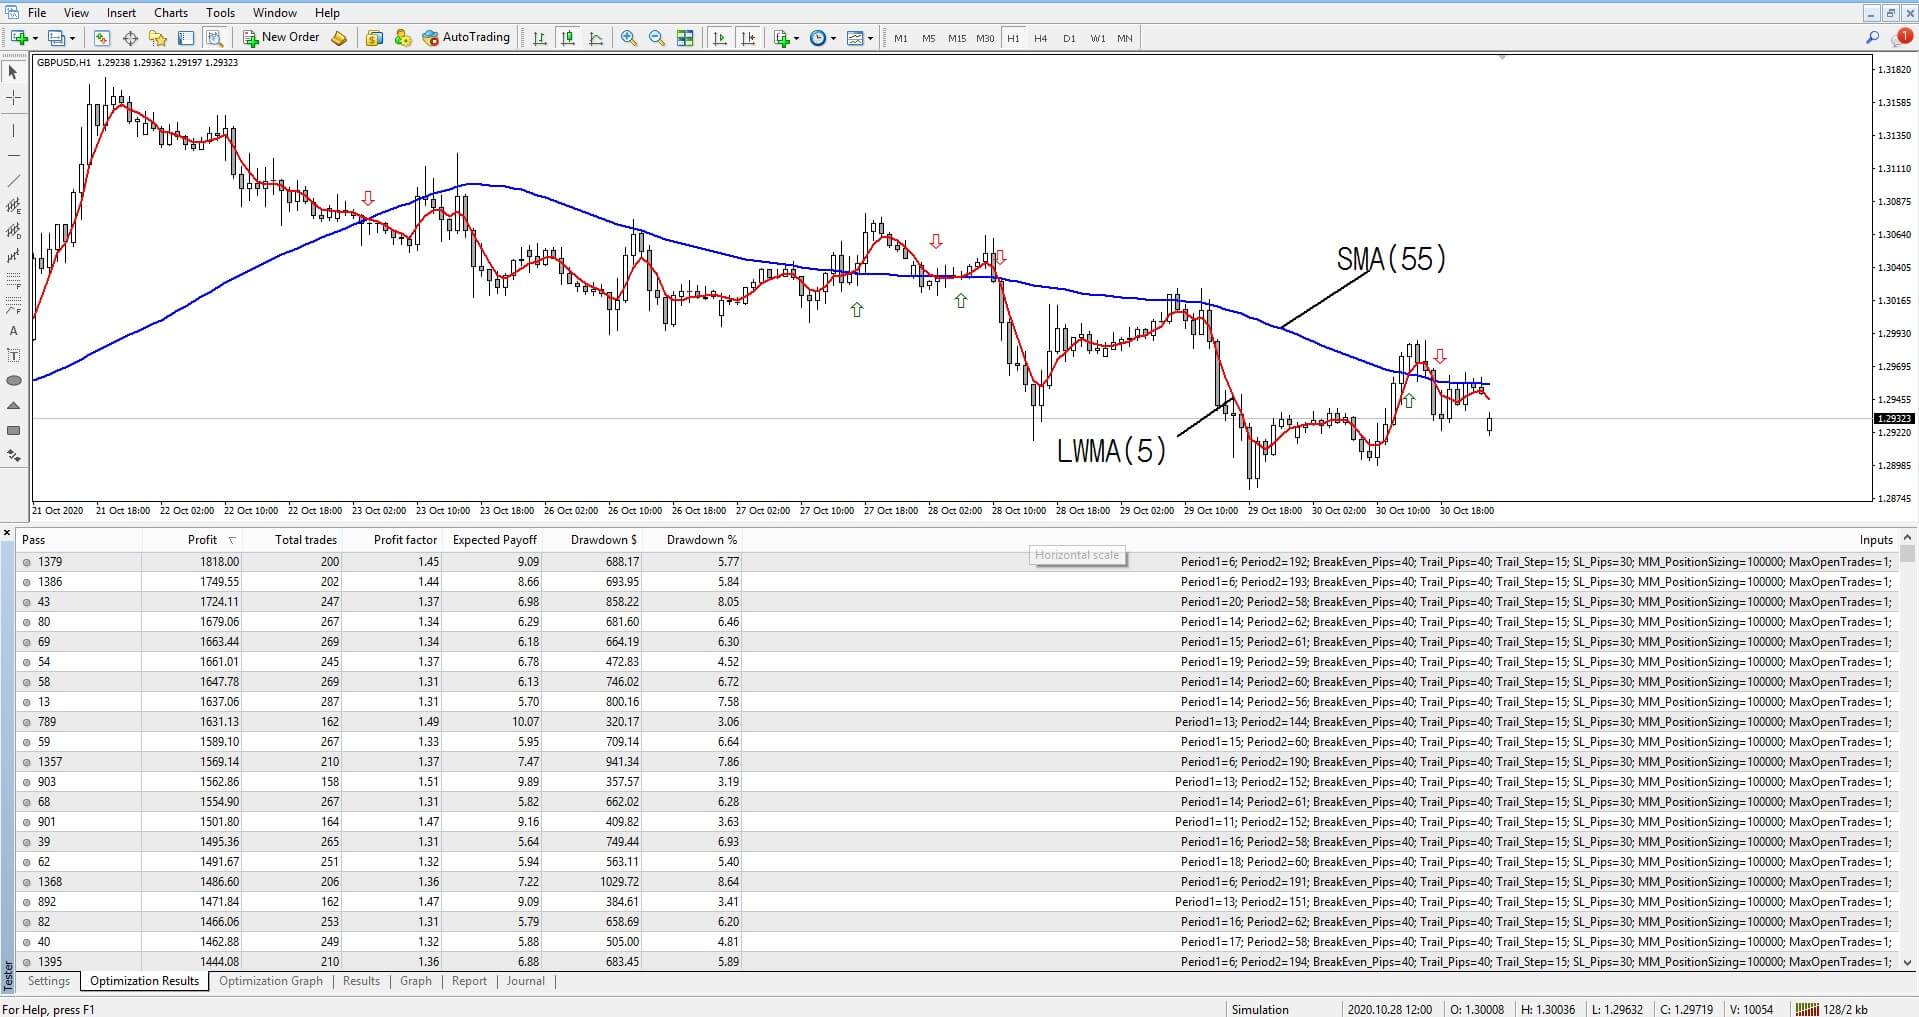
Once the “Start” button is pressed, the Strategy Tester in the “Optimization Results” tab will reveal each parameter variation’s output. In the case illustrated in the following figure, the results are listed from the most to less profitable. 

The results also expose the Total Trades, Profit Factor Expected Payoff, Drawdown ($), and Drawdown (%), and the inputs for each historical simulation.

In conclusion, the trading strategy based on the cross between LWMA(6) and SMA(192) in the historical simulation returned $1,818 of profits with a Drawdown equivalent to 5.77% or $688.17. Likewise, these parameters are valid only for a 4-hour chart

Nevertheless, analyzing the criteria described by Robert Pardo, which considers that a trading strategy should provide three times the drawdown, the strategy should generate three times the dropdown, in this case, the parameters applied into the model returned 2.64 times more profits over the drawdown. 

Next Tasks After the First Optimization

Once the first optimization was performed, the developer should analyze the trading strategy behavior with non-correlated assets and its performance in other timeframes. 

If the strategy passes this stage, the developer could make a walk-forward analysis. Among other questions, the strategist should answer whether the strategy will make money in real-time trading.  He also should evaluate the strategy’s robustness, where he would determine if the strategy is sufficiently robust and ready to trade in real-time.

Finally, once these stages are successfully passed, the trading strategy should be tested with paper money before its implementation in the real market.

Conclusions

In this educational article, we presented the steps for executing a simple optimization corresponding to a trading strategy based on the cross between two moving averages.

Before starting to optimize a trading strategy, the developer must weigh both the risks involved by the optimization process and the optimization analysis’s objective as the results that the study will generate.

Finally, although the optimization process reveals that the trading strategy is robust, the developer must continue evaluating if it can generate real-time trading profits.

Suggested Readings

  • Jaekle, U., Tomasini, E.; Trading Systems: A New Approach to System Development and Portfolio Optimisation; Harriman House Ltd.; 1st Edition (2009).
  • Pardo, R.; The Evaluation and Optimization of Trading Strategies; John Wiley & Sons; 2nd Edition (2008).
Categories
Forex System Design

Starting the Testing Process of a Trading Strategy

Introduction

The development of a trading strategy requires steps to evaluate its reliability during its execution in real markets. To achieve this, the developer must develop a testing process to determine its robustness and viability as a previous step before its optimization.
In this educational article, we’ll introduce the steps of a trading strategy’s testing process.

Getting Started with Testing the Trading Strategy

Once the developer completed the programming of a  candidate trading strategy, it’s time to confirm if the strategy works as the conceptual model assumes. In this regard, the strategist should follow the following steps:

  1. Verify the preliminary profitability of the trading strategy.
  2. Assessing the robustness delivered by the strategy.

The robustness concept relates to the ability to continue generating substantial profits despite adverse market conditions, such as trend changes or extremely volatile conditions. An alternative method for verifying the strategy’s robustness is by assessing if it continues being profitable under a wide basket of markets.

Another critical part of the testing process is to verify the trading rules. As the strategy’s complexity increases, rules also increase in complexity. In this context, the developer must validate that the execution of the buy and sell signals happens at the levels triggered by the strategy’s rules. The verification of entry and exit signals will allow the developer to identify any programming error.

Analyzing Profitability

Once the programming stage is verified, the developer should estimate the trading strategy’s profitability considering a reasonably lengthy historical price series. 

As a guide, a short-term strategy may be tested using two years of price data, a mid-term would need up to four years, and a long-term up to eight years of historical data. Nevertheless, the window size may vary depending on the strategy type or the market conditions.

With this information, the strategist will have a panoramic overview of the trading strategy’s profitability and risk. In this regard, if the strategy’s performance is deemed acceptable, the developer could advance to the next stage of the testing process.

Nevertheless, if the strategy has a poor performance, the developer should judge if it could be redesigned or discard it.  

Finally, for a proper evaluation, the strategy must be run using a standard one unit trading size. This way, the profits would result in multiples of the risk.

The Multimarket and Multiperiod Test

The multimarket and multiperiod test corresponds to the last stage of the testing strategy’s performance. During this historical simulation, the developer must study a set of parameters of the strategy considering a small basket of diversified markets over a broad range of historical periods. In other words, the developer must develop a historical simulation taking a group of different assets using different timeframes.

The developer must select a small portfolio of non-correlated assets; in other words, markets that don’t relate to each other. An example of a non-correlated portfolio is a mix of a commodity, a bond, and a stock index.

Concerning the length of the test period, Robert Pardo suggests that to obtain solid results, the developer should use ten years of historical data for each market. However, it could start from five years of historical prices. Pardo’s figures are related to long-term stock trades using daily timeframes. Intra-day trading systems, as already stated, would require smaller data ranges.

The results obtained from the historical simulation will provide an objective overview of the trading strategy’s profit and risk.  Depending on the results obtained, the developer may terminate if the strategy is robust and produces reasonable returns or if it performs poorly and should be rejected. Likewise, the strategist may observe that the strategy presents mixed results, so it should not be rejected entirely.

Conclusions

During the testing process of a trading strategy, the developer must evaluate a broad range of aspects that ensure the correct work during its evaluation.

For example, the developer must verify if the opening and closing trades’ programming rules execute as the strategy requires. After this step, the robustness degree will drive the strategist to conclude if it is viable in real markets, needs improvements, or should be rejected.

Finally, on a multimarket and multiperiod test, the developer must evaluate the strategy’s performance in a small non-correlated portfolio using different timeframes. Once this historical simulation is made, the strategist would be able to confirm if the strategy is robust and viable or reject it before continuing with the optimization stage.

Suggested Readings

  • Jaekle, U., Tomasini, E.; Trading Systems: A New Approach to System Development and Portfolio Optimisation; Harriman House Ltd.; 1st Edition (2009).
  • Pardo, R.; The Evaluation and Optimization of Trading Strategies; John Wiley & Sons; 2nd Edition (2008).
Categories
Forex Education Forex System Design

How to Determine the Size on a Historical Simulation

The simulation of a trading strategy requires a historical data series to assess the stability of the strategy’s results over time. Likewise, the strategist must consider the strategy before determining the window’s size before starting the historical simulation.

This educational article presents the concepts that will allow developers to estimate the data requirements to assess a trading strategy’s stability through a historical simulation process.

Setting the Requirements of Historical Data

As said, the strategy’s simulation process requires historical price data. Of this data, the developer must select a test window to perform the evaluation.

In this regard, in deciding the size of the historical data window, the strategy developer should consider both the statistical robustness and the relevance of the data for the trading system and the market.

However, these requirements will not accurately determine the test window’s size, either in hours, days, or even months. Instead, they provide a guideline for selecting a range of data suitable for developing the historical simulation process.

Suffice to say that the data window selection will have a significant influence on the results of a historical simulation.

Statistical Requirements

In statistical terms, the data window’s length must be large enough for the trading strategy to develop a sufficiently large number of trades to allow the strategy developer to reach meaningful conclusions about its performance. 

On the other hand, the data window should be large enough to allow sufficient degrees of freedom for the number of variables used in the trading strategy.

The standard error is a measure used in statistical analysis. The strategist can use this value as a measurement of the sample size impact in the historical simulation.

A high standard error suggests that each trade’s result is far from the strategy’s average profit. On the contrary, a low reading would indicate that the variation in an individual trade result will be closer to the average of the strategy’s benefits.

In other words, the standard error provides the strategy developer with a measure of the reliability of the average win based on the number of winning trades.

Quantifying the Required Amount of Trades 

According to the statistical theory, the larger the sample size is, the more reliable the trading strategy’s historical simulation results will be. However, several technical factors, such as data availability, avoids getting as many trades as the developer would like. 

The number of required trades increases in long-term systems, which tend to trade less frequently. In this case, the best option is to search for a sufficient amount of trades; another option is to make the data window wider.

In this regard, the statistical theory asks for a minimum sample size of 30 observations to be statistically acceptable. However, the strategy developer must aim for a much larger number of trades because the minimum of 30 samples requires the phenomenon under observation to follow a gaussian distribution, with is unlikely the financial markets would do.

Stability and Frequency of trades

The stability of a trading strategy corresponds to its results’ overall consistency during the strategy’s execution. In this way, as the strategy becomes more stable, it will tend to be more reliable over time.

The developer can distinguish the trading strategy’s stability by verifying whether the trades are distributed uniformly within the test window. Likewise, the strategist can confirm that the strategy is more stable as the standard deviation of the size and duration of the profits/losses shortens.

The frequency of trades will influence the length of the trading window. Thus, the higher the trading frequency, the shorter the historical data needed for historical simulation. 

In other words, a fast trading strategy running in markets with high volatility will require a small data window, which could reach up to three years. By contrast, a slower trading strategy, such as daily trend following, will require a larger data window, exceeding five years. 

One rule of thumb is: The strategist should make sure the trading system be tested under all market conditions, Bull, bear, sideways markets – under high, medium, and low volatility.

Conclusions

The execution of a trading strategy’s historical simulation requires a data size enough for the developer to evaluate its profitability and stability.

A high-frequency trading strategy will require less data than a long-term strategy, which will require a significant quantity of data, which could exceed three years of data.

The standard error can be used to evaluate the simulation’s results and determine the historical data window’s validity.

The strategist should ensure the trading system is tested under all market conditions: Bull, Bear, Sideways, and under all volatility types in which it is supposed will be used live.

Suggested Readings

  • Jaekle, U., Tomasini, E.; Trading Systems: A New Approach to System Development and Portfolio Optimisation; Harriman House Ltd.; 1st Edition (2009).
  • Pardo, R.; The Evaluation and Optimization of Trading Strategies; John Wiley & Sons; 2nd Edition (2008).
Categories
Forex Daily Topic Forex System Design

Understanding Slippage Effect in a Trading Strategy

Introduction

Slippage is one of the hidden costs any trading strategy is exposed to. Usually, this type of cost tends to be overlooked from studies of historical simulation. However, a strategies’ developer must understand its nature and assess its impact on its performance.

Increasing Reality in the Historical Simulation

To properly create a historical simulation of a trading system, it needs to consider certain assumptions that, although they may seem insignificant, they are not inconsequential. Their omission could lead to the accuracy of the results obtained. The most critical assumptions that the strategy developer should consider are related to the trading strategy’s deviations.

Slippage in Price and Trade

Each executed trade has a cost that occurs when it is filled. This cost is made of two parts, one fixed and another one variable. The fixed cost is known as the commission, which corresponds to a broker’s fee when it places the order into the market.

The variable element corresponds to the slippage. Slippage can have a significant impact on the profitability of the strategy. The slippage’s origin and size depend on various factors, such as the order type, size, and market liquidity.

There exist three types of orders that the strategist can place into the market; these are as follows:

  • Market Order: this is an order to buy or sell an asset at a price quoted in the current market. This order is guaranteed, but not the level at which it is finally filled. Thus, slippage may be high.
  • Stop Order:  A Stop buy Order is placed above the current price, whereas a Stop Sell order is located below the market’s price. Stop orders can be employed to enter and exit the market. The problem with Stop orders is that they usually fill at a worse price than set by the stop level. This situation occurs because when the price touches the stop level, the order changes to a market order and is executed at the first available price.
  • Limit Order: A Limit Buy order is placed below the current price, whereas a Limit Sell order should be above the current price. Unlike stop orders, Limit orders are placed to get better fills than the current market’s price. But its execution is not guaranteed. However, when they are filled, they will at the same or better price than initially established.
  • Market If Touched (MIT) Order: this type of order is a combination of the limit with a stop order. In the case of a buy trade, an MIT order is placed at a price below the current level. In the case of a sell position, an MIT order is set above the current price. The MIT order seeks a desirable price by buying at declines and selling at rallies. In turn, MIT orders seek to ensure the order is filled at a price close to where the strategy identifies a desirable entry level. However, although MIT orders combine the best of both types, they are also subject to price slippage.

Opening Gap Slippage

Markets tend to have price gaps. Usually, a price gap happens from the current close to the next day’s opening. In most cases, this gap is not large enough to significantly impact the outcome of the strategy. However, there may be larger gaps caused by significant political or economic events, while markets are closed.

These high volatility situations can lead to large slippages, particularly on pending orders. Consequently, the strategist must consider the impact of this type of slippage on historical simulation results.

Slippage by Order Size

The size of the position has a proportional impact on the slippage. In other words, as the order size increases, the possibility of a higher slippage grows, since the order gets progressively filled at worse prices. In this case, the strategy developer should design a methodology to scale in and out trades to execute the desired total size with minimal slippage.

Conclusions

The slippage is a variable cost that cannot be avoided in the real market. It may not be significant in some cases, as on long-term strategies with fewer entry and exit orders.

However, it becomes more significant in high-frequency systems, characterized by being short-term and active. In this context, the developer must consider the effect of slippage and reflect it in the historical simulation process.

Finally, the strategist should not neglect the slippage impact since its presence can considerably reduce the profits a trading strategy can generate.

Suggested Readings

  • Jaekle, U., Tomasini, E.; Trading Systems: A New Approach to System Development and Portfolio Optimisation; Harriman House Ltd.; 1st Edition (2009).
  • Pardo, R.; The Evaluation and Optimization of Trading Strategies; John Wiley & Sons; 2nd Edition (2008).
Categories
Forex Education Forex System Design

Seeking Accuracy in the Historical Simulation

Introduction

A historical simulation may seem like a simple process to perform; however, it goes beyond creating trading rules and introducing them into the simulation software. Within the software itself, some limitations can diminish the accuracy of the results and, in this way, overestimate or underestimate the possible results that the strategy would achieve in the real market.

This educational article explores the importance of precision in the simulation process and some simulation software problems.

Importance of the Accuracy 

The developing process of a trading strategy that systematically creates trades can be tested on a historical simulation procedure with relative confidence and accuracy. However, like all software, it can be affected by precision and lead to errors, which can increase, especially when looking for a historical simulation.

In this regard, the developer should not rule out a possible error in the simulation software, nor can it leave to chance the computer simulation’s lack of precision, as this may drag unpleasant results to the investor. In consequence, the developer should address the software errors in the best possible way.

The developer must seek to make the simulation as realistic as possible to address the accuracy problem. To achieve the desired accuracy, the historical data exchange must be as close as possible to real-time executions.

Thus, according to Robert Pardo (2008), achieving greater accuracy in the historical simulation will require two things: understanding software limitations and using conservative assumptions about costs and slippage in their various forms.

Software Limitations

Ignorance of historical simulation software limitations can lead the developer to a false confidence sentiment or be overly pessimistic about the historical simulation results. The most common constraints are:

Rounding of Data

The absence of the actual market price for the use of data rounding may have a cumulative effect on market entry and exit orders, which could lead to a cumulative effect, both positive and negative, on the trading strategy’s performance.

The problem of rounding in the historical simulation may lead to recording orders that, on a real market, would not have been executed or orders that would have been executed in real-time but not recorded by the simulation. A second error is a recurring understatement or overstatement in the strategy’s profits due to rounding.

The developer must determine if the historical simulation results are consistent with its real market results.

Finally, rounding errors will significantly impact a strategy that seeks small profits per trade. On the contrary, the impact will be less on those strategies that are slower or longer-term.

Price on Limit Orders

This error is a recurring problem in simulation software, and, in particular, it is presented in counter-trending strategies, which use pending orders to enter the market. In other words, the countertrend strategy places a buy limit when the market is falling and a sell limit when it is developing a rally. Contrary to a stop order, the execution of the limit order is not guaranteed.

The problem arises when the developer performs the historical simulation, and the software assumes that all limit orders will be executed during the simulation. However, according to Perry Kaufman (1995), up to 30% of all limit orders are not filled.

Faced with this problem, the strategy developer must define a security level to ensure that the order will be filled, increasing the probability of execution in the real market. This additional rule might consider that the price penetrates an additional distance to consider the order as executed.

Finally, this rule will not necessarily ensure that all limit orders will be executed; however, it will produce a more realistic approach to the simulation process.

Conclusions

The historical simulation process may present some problems generated by the code that the developer should be aware of. These inaccuracies can create false confidence by overestimating the results or drive it to be too pessimistic due to underperformance. These problems are mainly price rounding and limit-order executions.

In the first case, price rounding may induce the simulation software to execute input or output orders at levels other than those filled in the real market. To overcome this limitation, the developer must verify whether the strategy’s results are the same as the strategy would obtain in the real market.

The second error arises from counter-trend systems making use of limit orders. In this case, the developer must consider that not all limit orders are filled in the real market. Thus, the simulation could lead to overestimating the strategy’s results, creating a false optimism of the obtained performance. To mitigate this problem, the developer could introduce an additional requirement of an extra distance that the price should penetrate for the limit order to be executed.

Finally, in view that historical simulation software has limitations, the strategy developer should verify whether the simulation results are similar to those obtained in the real market.

Suggested Readings

  • Pardo, R.; The Evaluation and Optimization of Trading Strategies; John Wiley & Sons; 2nd Edition (2008).
  • Kaufman, P.J.; Smarter Trading – Improving Performance in Changing Markets; McGraw Hill; 1st Edition (1995).
Categories
Forex System Design

How to Read a Simulation Report

Introduction

When the developer performs the trading strategy design, it evaluates through a historical simulation process to overview its results under certain conditions. However, once finished the simulation, the software delivers a series of data that could confuse the developer with a broad kind of information provided by the report.

In this educational article, we will present the main elements of the historical simulation report.

Essential Data of the Historical Simulation Report

Within the wide variety of platforms that allow historical simulations, there is a set of essential data that the software provides at the end of the simulation process. These data are grouped into three large blocks: Performance Summary, Equity Chart, and Trades List.

The following figure shows the example of a report of a historical simulation performed in Strategy Tester of MetaTrader 4.

The report presents three blocks, which are detailed as follows.

Performance Data Summary

This section provides summarized statistical data from the historical simulation of the trading strategy. The key performance indicators are as follows:

  • Total Net Profit: This is the financial result of all trades executed during the simulation period. This value corresponds to the difference between the “Gross Profit” and the “Gross Loss.” A reading above zero is indicative of a trading strategy with positive mathematical expectation.
  • Maximal Drawdown: This is the highest local maximum loss expressed in the deposit currency and percentage of the deposit. In general terms, this value should be as low as possible. The criterion of maximum permissible drawdown will depend on the risk target of the trading strategy developer.
  • Total Trades: Corresponds to the total number of trades executed during the historical simulation. The developer might consider this value to assess the level of aggressiveness of the strategy. Also, it can use it to value the strategy in terms of its operational costs. For example, a strategy with a high number of trades could be more aggressive for a conservative investor. In turn, it implies a high operational cost in terms of paying commissions.
  • Percentage of Trades Winners: This is the number of profitable trading positions divided by the total number of positions. 
  • Profit Factor: This is the relationship between Gross Profit and Gross Loss. A reading lower than 1 suggests that the strategy generates more losses than gains. On the contrary, if it is greater than 1, then the strategy provides more profit than losses for each currency unit invested.
  • Sharpe Ratio: Some historical simulation platforms of trading strategies provide the Sharpe Ratio. This indicator represents the expected return on a risk-adjusted investment of an asset. In general, investors tend to consider as risk-free return the rate of the United States Treasury bond. A reading of less than 1 suggests that the trading strategy provides more volatile results. In other words, the developer could assume that the trading system is riskier than another with a ratio greater than 1.

Balance Curve

The balance curve chart presents the cumulative result of the trading strategy using a line chart. The information provided in this chart represents the result of the strategy execution under conditions and parameters in which the developer carried out the historical simulation.

Considering the investor’s objectives, the developer could improve its performance by optimizing the initial parameters.

List of Trades

This section of the report shows in detail each trade that the strategy performed during the simulation period. This list usually shows the following data:

  • Date of entry.
  • Type of order (buy, sell).
  • Entry price.
  • Size of the position.
  • Date of close.
  • Closing price.
  • Profit or loss of the trade.
  • Profits and losses accumulated or Balance.


Conclusions

The historical simulation process provides an overview of trading strategy behavior according to the developer’s parameters initially defined. This information is reflected in the simulation report, which provides a wide variety of information about the strategy’s performance under predetermined conditions.

Within the information provided at the end of the historical simulation, there are key data that the developer should not fail to value these are: Total Net Profit, Maximal Drawdown, Total Trades, Percentage of Trades Winners, Profit Factor, and Sharpe Ratio, which some simulation software does not provide it. However, the lack of availability of this data is not a limitation for assessing the strategy’s performance but will depend greatly on the criteria and experience of the developer of the trading strategy.

The developer can use this information to confirm that the trading strategy is proceeding as specified initially. Also, it can use this data to understand the strategy’s behavior during each trade.

This information is also important to spot potential improvements in the strategy. For instance, you could detect that several large losses may be trimmed with a better stop-loss replacement. You could also find out that a good portion of the trades was closed at a less than optimal level. The developer may conclude that the system would greatly improve with a better take-profit algorithm.

Also, the information gathered from the simulation may help improve the entries. For instance, you could find out that there are large losses at the beginning of the trade most of the time. That could signal the entries flag too quickly, or you may notice that the strategy would benefit from early entries to improve profits.

Finally, according to the developer’s objectives and the information analysis, the developer could attempt to adjust and optimize the needed parameters that could improve the strategy’s performance.

Suggested Readings

  • Pardo, R.; The Evaluation and Optimization of Trading Strategies; John Wiley & Sons; 2nd Edition (2008).


Categories
Forex Daily Topic Forex System Design

Designing a Trading Strategy – Part 5

Introduction

In a previous article, we presented the effect of incorporating additional rules in a trading strategy during the design process. In particular, we intuitively proposed a rule that opens a position using a size considering a percentage level of equity in the trading account.

In this educational article, corresponding to the last part of the series dedicated to designing trading strategies, we will expand position sizing concepts.

Position Sizing

The determination of the position size in each trade corresponds to the third element of a trading strategy. This decision will determine the capital that the investor will risk in each trade.

The position sizing corresponds to the volume committed in each trade. This volume can be the number of contracts, shares, lots, or another unit associated with the asset to be traded. The complexity of the position sizing is based on the efficient determination of the position to ensure maximum profitability with an acceptable risk level for the investor.

Programming the Position Sizing

To visualize the difference between some methods of position sizing, we will apply the criteria to the strategy of crossing moving averages analyzed in previous articles:

Fixed Size: This method is probably the most typical when developing a trading strategy. The rule consists of applying a fixed volume per trade. For example, consider the position size of 0.1 lot per trade, the code for our strategy is as follows:

extern double TradeSize = 0.1;

   //Open Buy Order, instant signal is tested first
   if(Cross(0, iMA(NULL, PERIOD_CURRENT, Period1, 0, MODE_LWMA, PRICE_CLOSE, 0) >
 iMA(NULL, PERIOD_CURRENT, Period2, 0, MODE_SMA, PRICE_CLOSE, 0))
 //Moving Average crosses above Moving Average
   )
     {
      RefreshRates();
      price = Ask;
      SL = SL_Pips * myPoint; //Stop Loss = value in points (relative to price)   
      if(IsTradeAllowed())
        {
         ticket = myOrderSend(OP_BUY, price, TradeSize, "");
         if(ticket <= 0) return;
        }
      else //not autotrading => only send alert
         myAlert("order", "");
      myOrderModifyRel(ticket, SL, 0);
     }
   
   //Open Sell Order, instant signal is tested first
   if(Cross(1, iMA(NULL, PERIOD_CURRENT, Period1, 0, MODE_LWMA, PRICE_CLOSE, 0) <
 iMA(NULL, PERIOD_CURRENT, Period2, 0, MODE_SMA, PRICE_CLOSE, 0))
 //Moving Average crosses below Moving Average
   )
     {
      RefreshRates();
      price = Bid;
      SL = SL_Pips * myPoint; //Stop Loss = value in points (relative to price)   
      if(IsTradeAllowed())
        {
         ticket = myOrderSend(OP_SELL, price, TradeSize, "");
         if(ticket <= 0) return;
        }
      else //not autotrading => only send alert
         myAlert("order", "");
      myOrderModifyRel(ticket, SL, 0);

Percentage of Risk per Trade: this criterion considers the account’s size given the account’s capital and estimates the stop loss distance needed to execute the trade according to the devised strategy. The common practice is to risk 1% of the equity currently available in the trading account. In this case, the implementation of the strategy is as follows:
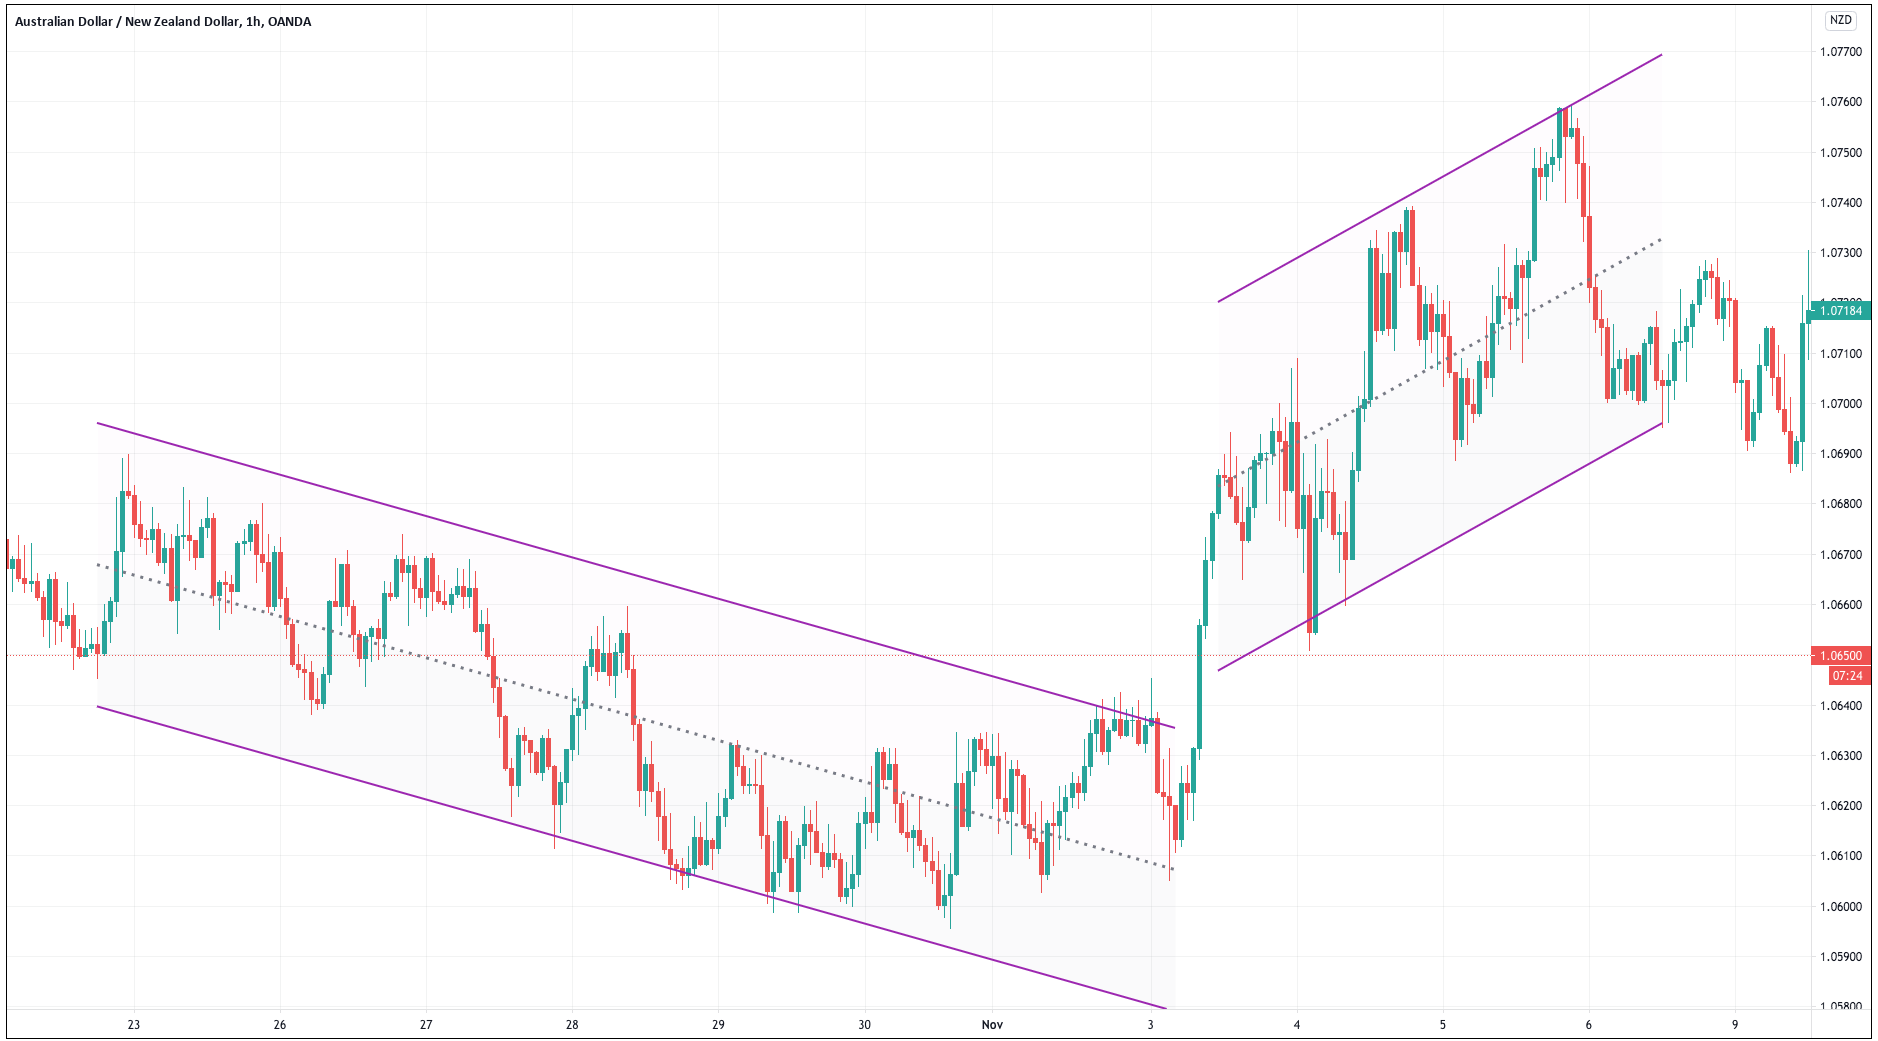
double MM_Percent = 1;
double MM_Size(double SL) //Risk % per trade, SL = relative Stop Loss to
 calculate risk
  {
   double MaxLot = MarketInfo(Symbol(), MODE_MAXLOT);
   double MinLot = MarketInfo(Symbol(), MODE_MINLOT);
   double tickvalue = MarketInfo(Symbol(), MODE_TICKVALUE);
   double ticksize = MarketInfo(Symbol(), MODE_TICKSIZE);
   double lots = MM_Percent * 1.0 / 100 * AccountBalance() /
 (SL / ticksize * tickvalue);
   if(lots > MaxLot) lots = MaxLot;
   if(lots < MinLot) lots = MinLot;
   return(lots);
  }

Position Sizing to Equity: this method executes the trading order according to the trading account’s equity. For example, the developer could place one lot per $100,000 in the trading account. This method will increase or reduce each transaction’s volume as the capital of the trading account evolves.

extern double MM_PositionSizing = 100000;
double MM_Size() //position sizing
  {
   double MaxLot = MarketInfo(Symbol(), MODE_MAXLOT);
   double MinLot = MarketInfo(Symbol(), MODE_MINLOT);
   double lots = AccountBalance() / MM_PositionSizing;
   if(lots > MaxLot) lots = MaxLot;
   if(lots < MinLot) lots = MinLot;
   return(lots);
  }

There are other methods, such as martingale and anti-martingale, discussed in a forthcoming educational article. For now, we present your definition.

  • Martingale: this rule is based on the money management of gambling. This method doubles the position size after each losing trade and starts at one position after each win. This method is extremely dangerous and should be avoided.
  • Anti-Martingale: this method opposes martingale, that is, doubles the position size after each winning trade and starts with a position after a losing trade. This method plays with what the trader considers to be “market’s money.” It is advisable to reset the size after a determined number of steps since the logic bets on a winning streak, which will end at some point. A 3-step is good enough to increase profits substantially. 4-step may be an absolute maximum on most trading strategies.

Conclusions

Position sizing is one of the critical decisions that the trading strategy developer must make. This choice will influence both the trading account’s growth and the capital risk to be exposed in each trade.

On the other hand, we have seen three examples of position sizing, representing a criteria guide that the trading strategy developer can use.

Finally, the developer of the trading strategy should explore and evaluate which is the best option of position sizing to use, taking into account the benefits of each of the impacts on the strategy’s execution.

Suggested Readings

  • Jaekle, U., Tomasini, E.; Trading Systems: A New Approach to System Development and Portfolio Optimisation; Harriman House Ltd.; 1st Edition (2009).
  • Pardo, R.; The Evaluation and Optimization of Trading Strategies; John Wiley & Sons; 2nd Edition (2008).
Categories
Forex System Design

Designing a Trading Strategy – Part 4

Introduction

In our previous article, we presented diverse types of filters, which work as additional rules. We also showed how to incorporate these filters into a trading strategy so that they can help improve its performance. 

In this educational article, the fourth section of the series dedicated to developing a trading strategy, we will discuss the profit management.

Profit Management

Profit management is an aspect of risk management that characterizes by its high level of complexity. The difficulty lies in that profit management seeks to preserve the profits obtained during the trade and also to prevent a premature exit from a market that still moves in a trend not over yet.

There are two available methods with which the trading strategist may manage the profits realized in an opened position. These are the trailing stop and the profit target order.

Trailing Stop

This type of order is dynamic. It moves only in the same direction of the position as it moves in the direction of the trend. In other words, a trailing stop will move upward in a buy positioning and downward in a sell trade. 

Another characteristic of the trailing stop is that it steadily advances during the life of the trade. It will never retrace when the price develops a movement against the trade’s direction.

The trailing stop has two components, which are detailed as follows:

  • Trailing stop: corresponds to the number of pips in which the stop loss order will move once the price moves in the trade direction. For example, if an order has set a 40-pip stop-loss, and the price advances 30 pips in favor of the trend, the new stop-loss will shift to 10 pips below the opening price. In general, there are several ways to establish a trailing stop: by fixed pip variation and by volatility using the Average True Range (ATR) indicator, or using SAR (Stop and reverse) stops. 
  • Step: this corresponds to the variation in pips that the dynamic stop will move behind the price when it has been activated.

Profit Target Order

The second mechanism to manage profits is by using a profit target order. This type of order is conditioned to the prince advance to a predetermined level. Likewise, compared with the trailing stop case, this order is not affected by the price decrease. However, its activation is subjected to the price reaching a specific level.

 A profit target order can be set using a specific number of pips, by a multiple of the Average True Range (ATR), a percentage of price increase ( or decrease), specific levels of resistance or support, or a specific dollar gain.

Using the Trailing Stop in a Trading Strategy

This example illustrates the impact of using a trailing stop with a two moving averages crossover strategy, corresponding to LWMA(5) and SMA(55) periods using the EURUSD pair.

 We have evaluated the performance of a 40-pip trailing stop with a variable step from 1 to 15 pips. The results are as follows.

In the table above, we distinguish the impact on drawdown reduction with respect to the base scenario, after the incorporation of a trailing stop rule to the MA crossover strategy. The base case, on which the exit rule is the MA cross in the opposite direction to the opening of the position, exhibits a 22.66% drawdown. However, the addition of trailing stops led to a reduced 10.44% drawdown and a net profit of -525.88 (USD).

Each trailing stop step variation scenario, including the base exit scenario of the trading strategy, is shown in the following figure.

Finally, we observe that a 7-pip step provides the lowest losses. We also highlight that as the step increases, the drawdown also increases, confirming the growing losses.
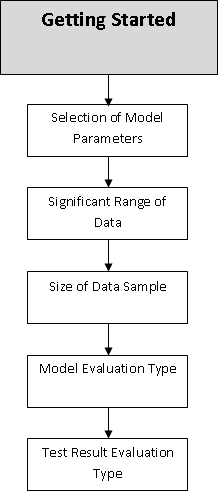
Conclusions

The application of Profit Management represents a significant challenge for the developer of the trading strategy. This complexity arises due to a wide variety of combinations that can be used to ensure the strategy’s gains as each trade moves in the trend direction.

In this context, as we have seen, the parameter setting to be considered, the trailing stop, profit target orders, or its combination, should be carefully evaluated before applying them to the trading strategy, to ensure the optimal settings.

In the next educational article, we will present the fifth and last part of the series dedicated to developing trading strategies that will explain the position sizing process.

Suggested Readings

  • Jaekle, U., Tomasini, E.; Trading Systems: A New Approach to System Development and Portfolio Optimisation; Harriman House Ltd.; 1st Edition (2009).
  • Pardo, R.; The Evaluation and Optimization of Trading Strategies; John Wiley & Sons; 2nd Edition (2008).
Categories
Forex Education Forex Indicators Forex System Design

Designing a Trading Strategy – Part 3

Introduction

In our previous article, we presented the first component of a trading strategy, which corresponds to the market entry and exit rules. Likewise, we exposed the case of a basic trading system based on the crossing of two moving averages.

In this educational article, we will present the filters and how they can help the trader refine a trading strategy.

Setting Additional Filters in Trading Strategy

Signals originated in a trading strategy can use filters to improve the entry or exit signals that the system generates. The purpose of incorporating filters is to improve both the accuracy and reliability of the strategy. 

A filter can be an indicator’s level or additional instructions to the initial entry, or exit rules. Some examples of filters can be:

  1. Avoid buy entries if the reading of the 60-period RSI oscillator is less than 49. 
  2. Allow Buy entries if the price closes above the high of the previous day or allow sell-short signals if the price closes below the last day’s low.

Also, rules can be established to control the strategy’s risk, and preserve the trading account’s capital. In this context, two elements that can help to manage the risk are:

  1. Initial stop-loss, which can be a fixed amount of pips or depending on some previous periods’ volatility. In turn, this rule can be fixed or dynamic, its level moving as the trade progresses through time.
  2. limiting the number of simultaneously opened trades. This rule can be useful, mainly when the market moves in a sideways path.

Measuring the Risk of Strategy

The risk of trading strategy corresponds to the amount of capital that the investor risks with the expectation of a possible return on the financial market by applying a set of rules with positive expectations.

One way to measure the risk of trading strategy is through the maximum drawdown, which corresponds to the maximum drop in equity from the peak of the equity value to the subsequent equity low.

The developer can obtain this measure as well as other strategy performance indicators by running a historical simulation.

Incorporating Additional Rules into Trading Strategy

The following example corresponds to the addition of rules to the trading strategy formulated and developed in the previous article, based on  moving averages crossovers with 5 and 55 periods. 

Before incorporating additional rules and evaluating their subsequent impact on the trading strategy, we will display the results of a historical simulation, developed using the EURUSD pair in its hourly timeframe. Likewise, the size of each trade position corresponded to 0.1 lot in a $10,000 account.

The following figure illustrates the strategy’s performance in its initial condition, which executed 652 trades providing a drawdown level of 22.66% and a net profit of -$716.93.

The additional proposed filter rules are as follows:

  • The strategy must have an initial stop loss of 30 pips. This stop will limit the possible maximum amount of loss per trade.
extern double SL_Pips = 30;
  • We propose using a Break-Even rule to ensure the opened trades’ profits, which will be used when the price advances 40 pips. Likewise, the strategy will apply a Trailing Stop of 40 pips of advance and a 3-pips step
extern double BreakEven_Pips = 40;
extern double Trail_Pips = 40;
extern double Trail_Step = 3;

The function that computes the Trailing Stop is as follows:

void TrailingStopTrail(int type, double TS, double step, bool aboveBE, double 
aboveBEval) //set Stop Loss to "TS" if price is going your way with "step"
  {
   int total = OrdersTotal();
   TS = NormalizeDouble(TS, Digits());
   step = NormalizeDouble(step, Digits());
   for(int i = total-1; i >= 0; i--)
     {
      while(IsTradeContextBusy()) Sleep(100);
      if(!OrderSelect(i, SELECT_BY_POS, MODE_TRADES)) continue;
      if(OrderMagicNumber() != MagicNumber || OrderSymbol() != 
Symbol() || OrderType() != type) continue;
	  RefreshRates();
      if(type == OP_BUY && (!aboveBE || Bid > OrderOpenPrice() + TS + aboveBEval)
 && (NormalizeDouble(OrderStopLoss(), Digits()) <= 0 ||
 Bid > OrderStopLoss() + TS + step))
         myOrderModify(OrderTicket(), Bid - TS, 0);
      else if(type == OP_SELL && (!aboveBE || Ask < OrderOpenPrice()
 - TS - aboveBEval) && (NormalizeDouble(OrderStopLoss(), Digits()) <= 0 ||
 Ask < OrderStopLoss() - TS - step))
         myOrderModify(OrderTicket(), Ask + TS, 0);
     }
  }
  • Also, the strategy must allow a maximum limit of one trade at a time.
extern int MaxOpenTrades = 1;

In this context, the code that will determined the limit reached will be as follows:

   //test maximum trades
   if((type % 2 == 0 && long_trades >= MaxLongTrades)
   || (type % 2 == 1 && short_trades >= MaxShortTrades)
   || (long_trades + short_trades >= MaxOpenTrades)
   || (type > 1 && type % 2 == 0 && long_pending >= MaxLongPendingOrders)
   || (type > 1 && type % 2 == 1 && short_pending >= MaxShortPendingOrders)
   || (type > 1 && long_pending + short_pending >= MaxPendingOrders)
   )
     {
      myAlert("print", "Order"+ordername_+" not sent, maximum reached");
      return(-1);
     }
  • The trading strategy must preserve the account equity using a position size that should be proportional to 1 lot per $100,000 of equity.
extern double MM_PositionSizing = 100000;
double MM_Size() //position sizing
  {
   double MaxLot = MarketInfo(Symbol(), MODE_MAXLOT);
   double MinLot = MarketInfo(Symbol(), MODE_MINLOT);
   double lots = AccountBalance() / MM_PositionSizing;
   if(lots > MaxLot) lots = MaxLot;
   if(lots < MinLot) lots = MinLot;
   return(lots);
  }

Now, the entry rules with the Stop-Loss rule will be as follows:

   //Open Buy Order, instant signal is tested first
   if(Cross(0, iMA(NULL, PERIOD_CURRENT, Period1, 0, MODE_LWMA, PRICE_CLOSE, 0) >
 iMA(NULL, PERIOD_CURRENT, Period2, 0, MODE_SMA, PRICE_CLOSE, 0)) 
//Moving Average crosses above Moving Average
   )
     {
      RefreshRates();
      price = Ask;
      SL = SL_Pips * myPoint; //Stop Loss = value in points (relative to price)   
      if(IsTradeAllowed())
        {
         ticket = myOrderSend(OP_BUY, price, MM_Size(), "");
         if(ticket <= 0) return;
        }
      else //not autotrading => only send alert
         myAlert("order", "");
      myOrderModifyRel(ticket, SL, 0);
     }
   
   //Open Sell Order, instant signal is tested first
   if(Cross(1, iMA(NULL, PERIOD_CURRENT, Period1, 0, MODE_LWMA, PRICE_CLOSE, 0) <
 iMA(NULL, PERIOD_CURRENT, Period2, 0, MODE_SMA, PRICE_CLOSE, 0))
 //Moving Average crosses below Moving Average
   )
     {
      RefreshRates();
      price = Bid;
      SL = SL_Pips * myPoint; //Stop Loss = value in points (relative to price)   
      if(IsTradeAllowed())
        {
         ticket = myOrderSend(OP_SELL, price, MM_Size(), "");
         if(ticket <= 0) return;
        }
      else //not autotrading => only send alert
         myAlert("order", "");
      myOrderModifyRel(ticket, SL, 0);
     }
  }

Finally, the position’s closing code including the trailing stop will be as follows:

  {
   int ticket = -1;
   double price;   
   double SL;
   
   TrailingStopTrail(OP_BUY, Trail_Pips * myPoint, Trail_Step * myPoint, false,
 0); //Trailing Stop = trail
   TrailingStopTrail(OP_SELL, Trail_Pips * myPoint, Trail_Step * myPoint, false,
 0); //Trailing Stop = trail
   
   //Close Long Positions
   if(iMA(NULL, PERIOD_CURRENT, Period1, 0, MODE_LWMA, PRICE_CLOSE, 0) <
 iMA(NULL, PERIOD_CURRENT, Period2, 0, MODE_SMA, PRICE_CLOSE, 0)
 //Moving Average < Moving Average
   )
     {   
      if(IsTradeAllowed())
         myOrderClose(OP_BUY, 100, "");
      else //not autotrading => only send alert
         myAlert("order", "");
     }
   
   //Close Short Positions
   if(iMA(NULL, PERIOD_CURRENT, Period1, 0, MODE_LWMA, PRICE_CLOSE, 0) >
 iMA(NULL, PERIOD_CURRENT, Period2, 0, MODE_SMA, PRICE_CLOSE, 0)
 //Moving Average > Moving Average
   )
     {   
      if(IsTradeAllowed())
         myOrderClose(OP_SELL, 100, "");
      else //not autotrading => only send alert
         myAlert("order", "");
     }

The historical simulation with the inclusion of the additional rules to the trading strategy  is illustrated in the next figure and reveals a reduction in the Drawdown from 22.66% to 10.49%. Likewise, we distinguish a variation in the Total Net Profit from -$716.93 to -$413.76.

Although the trading strategy continues having a negative expectation, This exercise shows the importance of including additional rules to improve the trading strategy’s performance.

Conclusions

This educational article presented how the inclussion of filters into a trading strategy can improve the performance of two key indicators such as the Drawdown and the Total Net Profit.

On the other hand, we did not consider the parameters optimization during this step. Optimization will be discussed in a future article.

In the next educational article, we will extend the concepts of Profits Management and Position Sizing.

Suggested Readings

  • Jaekle, U., Tomasini, E.; Trading Systems: A New Approach to System Development and Portfolio Optimisation; Harriman House Ltd.; 1st Edition (2009).
  • Pardo, R.; The Evaluation and Optimization of Trading Strategies; John Wiley & Sons; 2nd Edition (2008).
Categories
Forex System Design

Designing a Trading Strategy – Part 2

Introduction

Our previous article presented the three key elements of a trading strategy, which is the base of a trading system. In this second part of the designing process of a trading strategy, we will present the first component of a trading strategy corresponding to the entry and exit.

Trade Positioning and Trading Strategy

trade is made of at least by a buy order and a sell order. In other words, when, for example, the trader places a long position (buy), he should close it using a sell (cover) order.

On the other hand, a trading strategy with a positive expectation can identify and provide both long and short trading opportunities under a specific condition. Similarly, the strategy must be able to determine when to close the trading position and exit the market.

Generating Trading Opportunities

As we have seen in previous articles, a trading strategy is born from an idea that we believe might generate profits in any financial market. In this regard, the entry signals can vary from the simplest to the most complex requirement.

A buy position will arise when the price meets a condition for a bull market. On the contrary, a short position will activate if the market accomplishes the conditions for a bear leg. Some examples of long entries are:

  1. The 5-period fast moving average crosses over the 55-period slow moving average.
  2. The 65-period RSI oscillator closes above a reading of the 52-level.
  3. The price surpasses and closes above the high of the previous day.
  4. The price breaks and closes above the high of the 55-day range.

The definition of the exit rule of the trade must be considered from the basis that an open position in one direction must be closed with a position of equal size and opposite direction. For example, if the trader has opened a long trade, it will be closed with a selling trade. In this way, the developer should define a set of criteria that allow the execution of the closing of the trade. For example:

1) Closing the trade if the price advances 1.5 times the risk of the transaction.
2) The price reaches 3 times the ATR of 14 periods.
3) The rolling average of 5 periods crosses the average of 21 periods.

An example of Trading Signals using Metatrader 4

Metatrader 4 is one of the most popular trading platforms in the retail trading segment. Despite other trading platforms, such as TradeStation, Multicharts, or VisualChart, we will use Metatrader for our example. This platform includes the MetaEditor application, with which the creation of trading strategies can be developed through the programming of custom indicators.

In the following example, we show the creation of a custom indicator based on the crossing of two moving averages. This trading strategy uses a 5-period Weighted Linear Moving Average (Fast LWMA) and a 55-period Simple Moving Average (Slow SMA). 

Now it is time to define the entry and exit rules of our trading strategy as ideas and code rules for MetaEditor of MetaTrader 4.

The setting of each moving average period is as follows:

extern int Period1 = 5;
extern int Period2 = 55;

The entry criterion will occur as follows:

  • buy position will be activated when the LWMA(5) crosses above the SMA(55).
//Open Buy Order, instant signal is tested first
   if(Cross(0, iMA(NULL, PERIOD_CURRENT, Period1, 0, MODE_LWMA, PRICE_CLOSE, 0) >
 iMA(NULL, PERIOD_CURRENT, Period2, 0, MODE_SMA, PRICE_CLOSE, 0)) 
//Moving Average crosses above Moving Average
   )
     {
      RefreshRates();
      price = Ask;   
      if(IsTradeAllowed())
        {
         ticket = myOrderSend(OP_BUY, price, TradeSize, "");
         if(ticket <= 0) return;
        }
      else //not autotrading => only send alert
         myAlert("order", "");
     }
  • sell position will trigger when the LWMA(5) crosses below the SMA(55).
//Open Sell Order, instant signal is tested first
   if(Cross(1, iMA(NULL, PERIOD_CURRENT, Period1, 0, MODE_LWMA, PRICE_CLOSE, 0) <
 iMA(NULL, PERIOD_CURRENT, Period2, 0, MODE_SMA, PRICE_CLOSE, 0)) 
//Moving Average crosses below Moving Average
   )
     {
      RefreshRates();
      price = Bid;   
      if(IsTradeAllowed())
        {
         ticket = myOrderSend(OP_SELL, price, TradeSize, "");
         if(ticket <= 0) return;
        }
      else //not autotrading => only send alert
         myAlert("order", "");
     }
  }

The exit criterion will occur as follows:

  • buy position will be closed if the LWMA(5) crosses below the SMA(55).
//Close Long Positions
   if(iMA(NULL, PERIOD_CURRENT, Period1, 0, MODE_LWMA, PRICE_CLOSE, 0) <
 iMA(NULL, PERIOD_CURRENT, Period2, 0, MODE_SMA, PRICE_CLOSE, 0) 
//Moving Average < Moving Average
   )
     {   
      if(IsTradeAllowed())
         myOrderClose(OP_BUY, 100, "");
      else //not autotrading => only send alert
         myAlert("order", "");
     }
  • sell position will be closed if the LWMA(5) crosses above the SMA(55).
//Close Short Positions
   if(iMA(NULL, PERIOD_CURRENT, Period1, 0, MODE_LWMA, PRICE_CLOSE, 0) >
 iMA(NULL, PERIOD_CURRENT, Period2, 0, MODE_SMA, PRICE_CLOSE, 0) 
//Moving Average > Moving Average
   )
     {   
      if(IsTradeAllowed())
         myOrderClose(OP_SELL, 100, "");
      else //not autotrading => only send alert
         myAlert("order", "");
     }

Until now, we have not defined a money management rule or the position size for our trading strategy, just entries, and exits.

Conclusions

Entry and exit criteria are the basis of a trading strategy, which arises from an idea. The trading strategy’s essential objective is to obtain an economic profit from applying specific rules in both long and short positioning in the financial market.

In this educational article, we presented the case of a trading strategy based on two moving averages crossovers. In particular, we used the LWMA(5) as the signal moving average with an SMA(55) as the slow m.a.

In the following article, we will present some filters to avoid false signals.

Suggested Readings

  • Pardo, R.; The Evaluation and Optimization of Trading Strategies; John Wiley & Sons; 2nd Edition (2008).
  • Jaekle, U., Tomasini, E.; Trading Systems: A New Approach to System Development and Portfolio Optimisation; Harriman House Ltd.; 1st Edition (2009).
Categories
Forex Education Forex System Design

Designing a Trading Strategy – Part 1

Introduction

In a previous article, we introduced the basic concepts that should include a trading strategy. In this context, a trading strategy tends to be confused with a trading system. In this educational article, we start to present a series focused on developing a trading strategy that could end as a trading system.

The Trading Strategy Concept

Before advancing in designing a trading strategy, it is necessary to explain the difference between a trading strategy and a trading system.

trading strategy is a set of objective and formalized rules, such as parameters from a mathematical formula; these values can vary in different types of markets. Additionally, this set of rules are characterized by being independent of the emotional trader’s behavior. 

trading system is a systematic application of a trading strategy designed to achieve a profitable return by positioning in long or short financial markets. The main advantage of using a tested and validated trading system is significant confidence in producing profits.

Trading strategies can vary from the simplest to the complex rules criteria. Some classical trading strategies are moving average crosses, channel breakouts, bar patterns, candlestick patterns, and strategies based on oscillators such as MACD or RSI.

According to the complexity level of the trading strategy, as complexity increases, the construction, testing, optimization, and evaluation process will become more difficult. In this context, if the system developer does not control the trading strategy complexity, the optimization process results can become challenging, even could lead to the over-fit of the trading strategy.

The Basic Components

Each trading strategy must contain three essential components identified as follows:

Entry and Exit: Both entry and exit are the core of a trading strategy. The entry and exit criterion can vary in its complexity level. Similarly, the strategy could consider an entry in a specific price as a pending order (limit or stop), a market entry, open, or the closing price. On the other hand, the exit criteria could use a broad kind of methods such as percentage of price advancement or key support/resistance levels. As the reader may realize, the possibilities on entries and exits are unlimited.

Risk Management: It is a fact that any trading strategy will generate losing trades. In this regard, all trading strategies must contain a set of objective rules to reduce the risk. Risk management’s main objective is to limit losses in the trading account while allowing the trader to continue trading despite losing streaks.

Position Sizing: The third element a trading strategy must include is the amount to be traded. The position size may correspond to a fixed number of units, such as contracts, lots, shares, etc. The problem of position sizing becomes critical, especially when the trading strategy is profitable. In this context, Pardo suggests that it is more effective to allocate resources to improve the strategy’s entries and exits.

Conclusions

In this educational article, we have introduced the difference between a trading strategy and a trading system. In this regard, we can understand a trading strategy as the basis of a trading system.

A trading strategy can be based on the simplest or the most sophisticated criteria. However, as the complexity level of the strategy increases, the level of complexity in the trading system’s development will also increase.

On the other hand, a trading strategy must contain three elements, which are as follows:

  1. Entry and Exit.
  2. Risk Management.
  3. Position Sizing.

Finally, in the next educational article, we will expand the concepts of inputs and outputs in a trading strategy.

Suggested Readings

  • Pardo, R.; The Evaluation and Optimization of Trading Strategies; John Wiley & Sons; 2nd Edition (2008).
  • Jaekle, U., Tomasini, E.; Trading Systems: A New Approach to System Development and Portfolio Optimisation; Harriman House Ltd.; 1st Edition (2009).
Categories
Forex System Design

Introduction to Walk-Forward Analysis – Part 2

Introduction

In the previous part, we introduced the walk-forward analysis concept, its objectives, and its advantages. This educational article will continue discovering the benefits of using the WFA and how to set it up.

Walk-Forward Analysis and Market Impacts

The walk-forward analysis provides information about the impact of changes in trends, volatility, and market liquidity on the performance of the trading strategy or system. Generally,  when these changes occur, they arrive at a fast pace, heavily degrading the trading performance.

The WFA may extend its study in a wide range of time; however, analyses and evaluates the trading performance by separate windows. The broad range of results obtained by the study could provide the developer with a piece of useful information about the market changes impact the trading strategy performance.

Parameters Selection

As a robust optimization system, the WFA can provide the most appropriate parameters for real-time trading.

Simultaneously, the walk-forward analysis provides the strategy developer with the duration of the optimal period of time in which the set of parameters will consistently produce real-time benefits before the deterioration in trading system performance occurs.

Statistical Rigor in the Walk-Forward Analysis

As mentioned above, a large amount of data provides greater confidence in any phenomenon’s statistical study. This concept is also valid in the walk-forward analysis.

In this context, the walk-forward analysis must be large enough to produce several trades such that a large amount of data can be generated for the study. According to Pardo, in his work, he says that a WFA must be as long as possible, usually at least 10 to 20 years, whenever possible. Finally, he adds that these multiple walk-forwards combined performance will often be sufficient to produce the statistical rigor required in the analysis.

As a result, WFA’s multiple optimization windows will be able to give the developer a better idea of how the trading strategy will behave in the face of market changes.

Developing the Walk-Forward Analysis

A walk-forward analysis consists of two stages. In the first section, traditional backtest optimization is developed. The parameters of the trading strategy are analyzed using a sample established according to the developer’s objectives.

The second stage, which is the one that characterizes a walk-forward analysis, evaluates the performance of the parameters using an additional sample that was not used during the previous optimization stage.

The walk-forward analysis process requires the following elements to be set:

  1. Scan range for variables to optimize. The developer must define the time frame in which the trading strategy’s optimization should be performed. The developer should consider that the scan range uses a computational resources level that it will use to evaluate and weight the parameter to be optimized. In this regard, an exploration in a small number of historical simulations will consume less computational resources than a more extensive optimization.
  2. Identify a target or a search function. The developer must define what the purpose of the optimization study is.  A usual target can be a mix of the normalized average trade return (the reward/risk factor), the standard deviation of this figure, and the percentage of winning trades. These three factors will define the quality of any trading system. A fourth key factor is the number of monthly trades delivered by the system.
  3. Size of the optimization window. Generally, this optimization range can vary from 3 to 6 years. This duration depends on different factors such as, for example, the market, the type of trading strategy, the confidence level required by the developer in the optimization results, among other factors determined by the developer.
  4. Size of the walk-forward out-of-sample window. This period is defined based on the optimization window. In most cases, this window can be between 25% and 35% of the optimization time.

The length of the optimization window is determined by:

  1. Availability of data. Depending on the type of market and accessibility of the data to perform the analysis, the developer might find a restriction on the amount of historical data needed to perform strategy optimization.
  2. Trading strategy style. A short-term trading strategy should require a smaller optimization window than a long-term strategy.
  3. The pace of trading strategy. The pace of strategy is highly variable and tends to vary from strategy to strategy. For example, a long-term strategy, such as swing trading, will slower than a short-term trading strategy, which will require less time to produce the same number of trades.
  4. The relevance of data. The relevant data depends on a large number of factors that could empirically be determined. However, Pardo proposes a basic guideline stating that a short-term strategy can be tested using one or two years of data, whereas an intermediate-term strategy would require two to four years, and a long-term strategy four to eight years of data.
  5. The validity of the strategy’s parameters. The developer expects the parameters employed will generate benefits in the historical simulation. Furthermore, it also requires a trading strategy to produce profits in real-time market trading.

Finally, the walk-forward analysis is a post-optimization method, highly effective and revealing when it comes to discriminating a trading system’s robustness. Regarding that, the market is dynamic and changes periodically; the trading system should be re-optimized with a certain periodicity.

For example, a properly optimized short-term strategy could be re-optimized between three and six months of real-time trading. While the long-term between one and two years.

Conclusions

In this second and final part, we reviewed the basics of walk-forward analysis, characterized by providing the trading system developer with a powerful tool for testing, validation, and measuring trading strategy. Among the benefits that this stage of the development of a trading system provides we can mention:

  1. Measurement of robustness.
  2. Reduction of overfitting.
  3. Assessment of market changes in the trading strategy.
  4. Selection of optimal parameters for the strategy.
  5. Statistical reliability, when correctly applied.

Finally, despite the benefits provided by this analysis methodology, the strategy developer should consider that the trading system may need to be re-optimized with a certain periodicity.

Suggested Readings

  • Jaekle, U., Tomasini, E.; Trading Systems: A New Approach to System Development and Portfolio Optimisation; Harriman House Ltd.; 1st Edition (2009).
  • Pardo, R.; The Evaluation and Optimization of Trading Strategies; John Wiley & Sons; 2nd Edition (2008).


Categories
Forex System Design

Introduction to Walk-Forward Analysis – Part 1

Introduction

Once completed the optimization process of a trading system, the developer could develop an advanced strategy optimization method, the walk-forward analysis. In this educational article, we will introduce the basic concepts of this methodology.

What is Walk-Forward Analysis?

The Walk-Forward Analysis (WFA) is an advanced method for testing, validating, and optimizing a trading strategy, by measuring its performance using out-of-sample results. The WFA attempts to achieve the three objectives identified as follows.

  1. Determine if the trading strategy continues being profitable using unseen or out-of-sample price history.
  2. Find out the optimal values of the parameters to be used in real-time trading.
  3. Delimit the optimization window size and the period at which the system should be reoptimized.

Measuring the Robustness of a Trading System

A robust trading system is profitable, even when the actual market conditions change. These profits tend to be consistent, with the results obtained in the historical simulation stage. In other words, a walk-forward analysis allows the system’s developer to determine if the trading strategy can produce real-time profits.

The system’s developer is able to compute the robustness of a trading strategy using a statistical criterion called Walk-Forward Efficiency (WFE) ratio, which measures the current optimization process’s quality.

The WFE ratio is computed by the out-of-sample annualized rates of return divided by the in-sample returns. A robust trading strategy should achieve reliable performance, both in-sample and out-of-sample data. A 100% ratio would indicate that the out-of-sample figures match exactly the returns obtained with the backtests. That would indicate the system is sound and reliable.  Pardo, in his book The Evaluation and Optimization of Trading Strategies, comments that “robust trading strategies have WFEs greater than 50 or 60 percent and in the case of extremely robust strategies, even higher.”  A WFE ratio below 50% would indicate poor performance. Finally, ratios over 100% are suspicious, and the system should be analyzed to discover the reason for this behavior.

WFA and Overfitting

Overfitting is a condition resulting from an excessive readjustment of the strategy’s parameters aimed at artificially improve its performance. An overfitted strategy is likely to lose money in real-time trading, even when a historical simulation would present terrific gains.

By its nature, a walk-forward analysis is a cure for overfitting abuse. This edge comes from the fact that the WFA evaluates the strategy’s performance using data not belonging to the optimization process.

By using WFA, the developer is certain about the robustness of a trading strategy. In other words, a not too robust trading strategy would not pass a walk-forward analysis.

Considering that a large number of samples increase the statistical validity and confidence, it is unlikely that an unprofitable trading strategy would make significant profits using a large number of samples. Consequently, a poor trading strategy delivering gains could be the product of chance.

Conclusions

The Walk-Forward Analysis (WFA) is a powerful tool for testing, validating, and measure the quality of a trading strategy, which is characterized by the use of out-of-sample data to evaluate its performance. In this educational article, we have presented the advantages of using WFA to evaluate the strategy’s robustness and how WFA can help the developer avoid overfitting, increasing confidence through an objective statistical measure.

In the next educational post, we will continue reviewing the benefits of using the walk-forward analysis and setting up the walk-forward analysis.

Suggested Readings

  • Jaekle, U., Tomasini, E.; Trading Systems: A New Approach to System Development and Portfolio Optimisation; Harriman House Ltd.; 1st Edition (2009).
  • Pardo, R.; The Evaluation and Optimization of Trading Strategies; John Wiley & Sons; 2nd Edition (2008).
Categories
Forex System Design

Creating Your First Trading System – Part 1

Introduction

In our previous articles, we presented the introductory concepts to design, create, test, optimize, and evaluate a trading system. In this section, we will be using a practical example of the development process of a trading system.

Starting to Build the Trading System

In his work, Robert Pardo exposes a seven-step methodology that must be followed to develop a trading system. These steps are as follows:

  1. Formulate the trading strategy.
  2. Write the rules in a precise form.
  3. Test the trading strategy.
  4. Optimize the trading strategy.
  5. Trade the strategy.
  6. Monitor the trading performance and compare it to test performance.
  7. Improve and refine the trading strategy.

Picking a Trading Strategy

A trading system starts with an investment idea that could arise from a publication in a specialized trading site or another related source. In our case under study, we are going to develop a trading strategy based on the Turtle Traders. 

Our reader must consider that the process applies to any other strategy.

The Turtle Trading System Rules

The Turtle System uses the following set of rules:

  • Timeframe: Daily range.
  • Entry:
  • Richard Dennis defined two systems; the first one corresponds to a short-term strategy considering the 20-day breakout. In parallel, He added a long-term system using the 55-day breakout. In our system, we will be conservative and use the long-term strategy based on the 55-day breakout.
  • Stop Loss: The stop loss should be placed a the distance corresponding to one time the Average True Range (ATR) of the 20 days.
  • Exit: The system developed by Richard Dennis doesn’t consider a specific take-profit level as it happens with some chartist patterns. Instead, Dennis defines the exit criterion after the price moves against the position for a 10-day and a 20-day breakout. For long positions, the exit will be a 20-day low, and for short positions will correspond to 20-day high. However, to simplify our system, we will consider a profit target level at one  20-day Average True Range distance (1 20-ATR).
  • Position Size: The size will correspond to 1% of the capital available in the trading account.
  • Adding Positions: For educational purposes, we will not consider increasing the positioning criterion.

Charting the Turtle Trading System

As a way to visualize what our first version of the trading system should do, we will illustrate the strategy on a chart for both long and short positions.

In the previous figure, we can observe the set of rules for the entry, stop-loss, and profit-target.  The rule of position sizing will correspond to 1% of capital in the trading account.

Conclusions

In this first part, we identified a trading strategy and specified a set of rules corresponding to what the system should do. In the next educational article, we will start to transform the ideas into a set of instructions.

Suggested Readings

  • Jaekle, U., Tomasini, E.; Trading Systems: A New Approach to System Development and Portfolio Optimisation; Harriman House Ltd.; 1st Edition (2009).
  • Pardo, R.; Design, Testing, and Optimization of Trading Systems; John Wiley & Sons; 1st Edition (1992).
  • Faith, C. M.; Way of the Turtle. New York: McGraw-Hill; 1st Edition (2007).


Conclusions


Suggested Readings

  • Jaekle, U., Tomasini, E.; Trading Systems: A New Approach to System Development and Portfolio Optimisation; Harriman House Ltd.; 1st Edition (2009).
Categories
Forex Daily Topic Forex System Design

Introduction to the Evaluation of Trading Systems

Introduction

Once the trading system has been tested and optimized, the developer must achieve its evaluation with a pre-defined set of criteria, which would allow him to decide if the strategy is viable to use or not. To develop this stage, the developer needs to identify which criteria he should use to perform this process.

Why Evaluate a Trading System?

The evaluation of the trading system is the step that the system developer uses to decide if the strategy performance fits the investor’s objectives or if it would be necessary to further optimize the strategy.

Criteria to Evaluate a Trading System

There is a broad range of indicators to evaluate a trading system and compared it with itself or with other strategies. However, the most common indicators are listed below.

Net Profit 

Net Profit is a widely used indicator in the finance world and plays an important place in financial analysis. It measures how much money returns the strategy during the test period. The Net Profit is the result of the sum of all trade results.

Net Profit = SUM ( res(i))

where res(i) are the individual results

The use of this parameter could drive the system developer toward making a biased decision without a risk level consideration, especially when comparing different trading systems. Net Profit is dependent on many factors, such as the frequency of trades and position size; therefore, this figure by itself says nothing about the system except that it is profitable.

Average Trade

The average trade measures the trading system goodness of how much money could return or lose per trade the strategy. Its calculation is the result of Net Profit divided by the number of trades N.

Average Trade = Net Profit/ N

Net Profit should also consider the slippage and commissions spent during the test period.

Percentage of Profitable Trades

This indicator shows the number of winning trades over the total trades. The developer should understand that a trend following system could produce a low percentage of profitable trades and still be a feasible system. However, the developer should weigh how the system is balanced with the average winning trade/average losing trade ratio.

The percentage of profitable trades is computed, as

Percent Profitable = 100 x(Nr of wins/ N) where N is the total number of trades.

Profit Factor

The profit factor is an indicator that measures the gross Profit in relation to gross loss. This ratio is ideal for comparing different systems or the same system compared with different markets. According to Jaekle and Tomasini, a good trading system should have a profit factor higher or better than 1.5.

The profit factor is computed as

Profit Factor = Gross Profit/ Gross loss

where Gross Profit is the total Profit of the profitable trades, and Gross Loss is the total loss of the losing trades.

Drawdown

This popular indicator measures the largest loss or capital decline of a trading system. In other words, the drawdown is the reduction of the equity level. Jaekle and Tomasini, in their work, exposes three types of drawdown identifies as follows:

  1. End trade drawdown measures how much of the open Profit the trader give back before the exit from a specific trade.
  2. Close trade drawdown corresponds to the difference between the entry and exit price without considering what is going on within the trade.
  3. Start trade drawdown tells how much the trade went against the position side after the entry and before it started to go in the direction of the trade.

For simplicity, Jaekle and Tomasini propose closing trade drawdown because they consider it the “most significant.” At the same time, the developer should be careful to use this measure because it is dependent on the trade size

The average drawdown accepted by professional traders and money managers vary from 20% to 30%. Although 10% is considered an ideal drawdown, looking for too small drawdowns may limit the growth of a trading system.

Time Averages

Time averages measure the average time spent in all completed trades during a specific test period of the strategy. The developer should weight the average time elapsed for each trade and the risk taken on each position.

Proposed Preliminary Step

To perform the evaluation properly, a fundamental step is to normalize the trade record, by transforming it to trade only one unit per trade, and also by computing the results in terms of Profit versus risk. Once this is done, the results of a trading system can be properly compared to other similarly normalized systems or its previous variations.

Conclusions

In this educational article, we presented a group of indicators that could allow the system developer to decide with objective evidence what could be the best configuration to apply in the trading strategy or if the system is unviable.

At the same time, the evaluation process must weigh the potential profits with the risk involved during its execution and not make decisions based on a unique criterion, such as the Net Profit or the drawdown.

Suggested Readings

  • Jaekle, U., Tomasini, E.; Trading Systems: A New Approach to System Development and Portfolio Optimisation; Harriman House Ltd.; 1st Edition (2009).
Categories
Forex System Design

Introduction to Optimization of a Trading System

Introduction

Once the system developer tested and validated the trading system, the next stage corresponds to the optimization process. The developer will estimate different values for the key model parameters.
This educational article will introduce the basic concepts in the optimization process of a trading system.

The Optimization Process

Before getting started into the optimization process, the developer must weigh and adjust the investor’s interests with the purpose of the optimization and limitations both the strategy and reality. In this regard, the optimization must align with realistic objectives. For example, the drawdown should not exceed 10% of the trading account, or to obtain a yearly net profit of 15% from the invested capital.

The optimization of a trading system is the stage that seeks the best or most effective use, which allows investors to obtain the highest performance of the trading system. In this context, the optimization could be the search of what inputs could maximize the profits or accomplish the investor’s requirements to minimize the drawdown. To achieve this, the developer must evaluate the variables that conform to the rules and formulas that define and models the system’s structure.

The system developer must consider that an incorrect optimization can drive to obtain serious errors. For this reason, the optimization process is a critical stage in trading system development.

What is the Optimization of Trading Systems?

In general terms, the optimization process is a mathematical method oriented to improve or find an “optimal” solution to a specific problem. In the trading system development, the optimization corresponds to the best parameter selection that allows the strategy to obtain the peak performance in the real market.

Getting Started

Once the system developer tested the trading strategy’s capability to catch market movements, the steps to start the optimization are as follows:

  1. Selection of the model parameters that have the most significant impact on the system’s performance; if a model’s variable is not relevant, it could be fixed.
  2. Selection of a significant range of data needed to test the parameter to be optimized. This range must generate a significative sample to study the model. For example, the amount of data required to evaluate a 20-day moving average is lower than the one needed to assess a 200-day moving average.
  3. Selecting the data sample size. It must be representative enough to ensure the statistical validity to make estimations. The size also must be representative of the market as a whole.
  4. Selection of the model evaluation type, this stage will depend on the evaluation type, objective, or test criteria; this selection will change depending on the kind of trading model.
  5. Selection of the test result evaluation type, this stage must evaluate the results of the optimization process with a statistical significance, meaning the results are not due to chanve. For example, a P-value below 5% would be statistically “significant,” and below 1% would be “highly significant.” Additionally, the average and the standard deviation of the results must be evaluated. As a final note, profit spikes should be considered as abnormal and be discarded.

The figure summarizes the five selections that the system developer must take before to start the optimization process.

Conclusions

The optimization process is a critical stage that comes after the testing process. In this stage, the system developer seeks to determine the appropriate value for the most robust trading strategy implementation. 

Nevertheless, before starting with the optimization, the developer must take a set of decisions, such as which the objective of the optimization? Is it realistic?

Once defined the target of the optimization, the developer must select which parameters to optimize, the range of data to be used in the analysis, how much data will require the sample, which will be the evaluation type of the model, and the evaluation criteria of the test results.

Finally, when all these five steps have been completed, the system developer is ready to start to perform the optimization.

Suggested Readings

  • Jaekle, U., Tomasini, E.; Trading Systems: A New Approach to System Development and Portfolio Optimisation; Harriman House Ltd.; 1st Edition (2009).
  • Pardo, R.; Design, Testing, and Optimization of Trading Systems; John Wiley & Sons; 1st Edition (1992).
Categories
Forex System Design

Testing Process of a Trading System

Introduction

Upon completion of the first steps of the process to build the trading system, the developer must validate the model with a defined confidence level. This evaluation should provide specific metrics to assess the model’s capability to generate profits and the risk of using it.
In this educational article, we will discuss the testing process of a trading system, including the evaluation and optimization process.

Testing Process

The testing process is a critical stage in the trading system development; in this phase, the developer must validate the system’s behavior in a simulated market context with real data. This process leads the developer toward deciding how much data will be needed to verify the model. 

The data size should be significant enough to provide results with a confidence level, such as in statistical terms, a 95% confidence. Considering that volatility and market dynamics changed in the last 40 years, the consideration of 40 years of data could not be adequate to evaluate the model. In this regard, 5 to 15 years of market data could be enough for the right estimation of the system’s performance.

In the first step, the system developer should realize a back-test evaluating the system’s construction logic and the performance with historical data. The results must be studied with an objective quantitative method as the statistical inference. This process’s results could drive the system’s developer to discover some optimization model based on the market’s synchronicity. 

After this optimization, the next step in the testing process is in terms of Jaekle and Tomasini, the walk-forward analysis. A walk-forward analysis is a series of multiple and successive out-of-sample test over different chunks of the data series. The data used in the walk-forward tests should be unused portions of the historical data.

Once verified the trading system capability to generate profits with an acceptable risk level, the system could be tested using real-time data and paper money to evaluate its performance in front of new market conditions. In this context, the time to run the system should be flexible and dependent on the developer’s experience.

A Question of Samples

A sample is just a portion of the whole phenomenon under study; in a trading system, the event under analysis corresponds to the results from a trading entry series. In this context, the final result corresponds to the profit/loss level generated on each trade. In other words, a sample with one trading signal could not represent the trading system’s capability to generate profits. Therefore, the trading signals generated by the system should be significatively bigger to evaluate its performance, and in consequence, the sample used should be representative of the whole series.

The result from the sample evaluation will be an average of the potential returns of the trading system. Considering the variability of the results, the trading system developer will have to analyze the degree of variation of the returns with respect to the average return. In statistical words, the developer will have to study the standard deviation of the trading system.

An example of this analysis could be the return average of the trading system is $100 per trade with a standard deviation of $15 per trade, this means that the trading system may show returns between $85 to $115 per trade 68 percent of the time. 

Is it Necessary to Optimize the System?

The optimization process is a way to adjust some variables oriented not only to maximize the profits but also to reduce the risk taken on each trade and improve the trailing stop methodology. It could also have to target the reduction of false trade signals, for example, to avoid the market entries when the price action realizes a false breakout. However, according to Jaekle and Tomasini, there exist the possibility of incurring an over-optimization, which could reduce the system’s performance.

Conclusions

The testing process is a step intended to evaluate the trading system’s ability to generate profits and identify the variability level of its results with a confidence level. In this way, the system developer must analyze the system’s performance, using both historical and real-time market data. At the same time, the period required to study the system’s performance in real-time will depend on the developer’s experience. 

The requirement of optimization will depend on the variable to need to be improved. This process could carry the trading system to reduce its efficiency in its capability to generate trading signals. 

Finally, in our next educational article, we will expand the optimization process and some metrics to evaluate the trading system performance.

Suggested Readings

– Jaekle, U., Tomasini, E.; Trading Systems: A New Approach to System Development and Portfolio Optimisation; Harriman House Ltd.; 1st Edition (2009).

Categories
Forex System Design

First Steps to Build a Trading System

Introduction

A trading system can be defined as a specific set of rules that automatically determine what to buy or sell without human intervention. What to buy or sell? Where entry and exit of the market? How many positions will place on the market?
In this educational article, we’ll review the first steps to build a trading system.

Difference Between Trading Systems and Trading Strategy

In general terms, a trading system is a precise set of rules which automatically and without any external kind of human intervention, will place an order into the market, including the entry and exit levels. In consequence, since the trading system does not need any human intervention, the results can be verified objectively. 

trading strategy typically features components such as a money management rule, and a portfolio rule that will define when entry and exit from the market.

The money management rule should not be confused with risk management because risk management considers where to place the stop loss and the profit target level. Conversely, money management answers the “how much” question; it determines the position size on a particular trade entry. 

Now, when the developer of a trading system includes a set of rules for portfolio construction, using non-correlated assets, this process corresponds to the portfolio management section of that system, which should target the maximization of its returns relative to the risk incurred.

The First Steps to Build a Trading System

As we commented, a trading system is a set of rules that defines, under certain market conditions, an entry order to buy or sell, which must include predefined stop loss and take profit levels. In this context, an example of pseudo-code of a trading system could be:

  • If the price(close) is higher than the price(high) of 10 days, then buy 0.1 lots.
  • If the price(close) is lower than the price(low) of 10 days, then sell 0.1 lots.
  • Set a stop-order at 1.5*AverageTrueRange(14)
  • Set a take-profit at 2.0*AverageTrueRange(14)

Our example is a basic idea for a trading system that will buy when the price surpasses the highest level of 10 previous days, and sell when the price pierces below the lowest level of 10 previous days. In both cases, the position size will be 0.1 lots, assuming that the system developer risks 1% of its trading account. Our model of the trading system proposed will place a stop-loss at 1.5 times the Average True Range (ATR) of 14 days, and the take profit will locate at 2.0 times the ATR of 14 days. This example did not consider a portfolio management rule. Until now, we assume the trader will work on a single market.

Considering that a trading system can be validated objectively using statistical methods, a system developer should consider these five steps to building a trading system:

  1. Observation of the financial market activity to discover a relationship between a group of variables.
  2. Hypothesis definition originating from the relationship between variables that causes some effect in the market.
  3. A Forecast arising from the potential effect of the interaction of the variables under study.
  4. Verification of the model employing real market data, using statistical methods.
  5. Conclusion based on the results obtained on the verification process and considering a determined confidence level. 

Conclusions

A trading system is a specific set of rules oriented to take market entries, including stop-loss and take profit levels, without human intervention.

The development process of a trading system requires a systematic methodology before placing it to work into the real market. The steps that the developer should have in consideration are as follows:

  1. Observation.
  2. Hypothesis.
  3. Forecast.
  4. Verification.
  5. Conclusion.

Suggested Readings

Jaekle, U., Tomasini, E.; Trading Systems: A New Approach to System Development and Portfolio Optimisation; Harriman House Ltd.; 1st Edition (2009).