General Overview
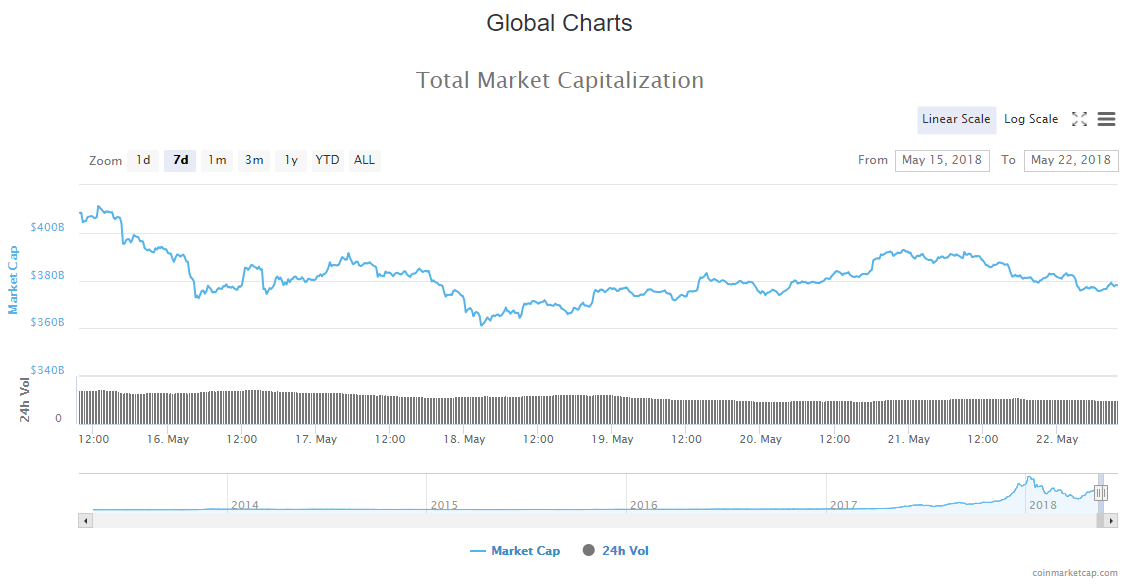
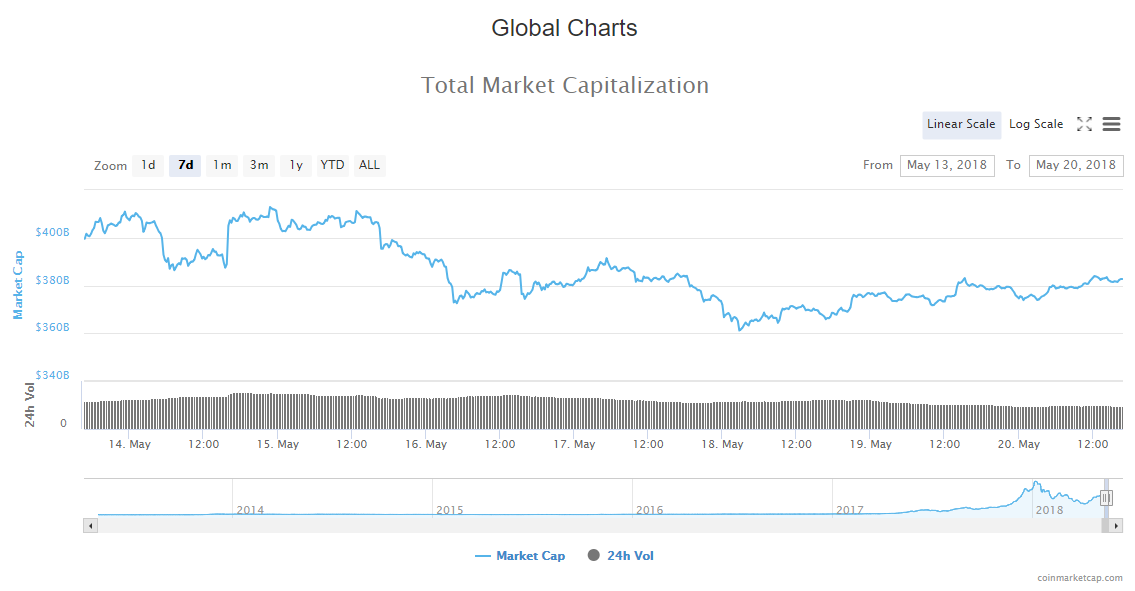
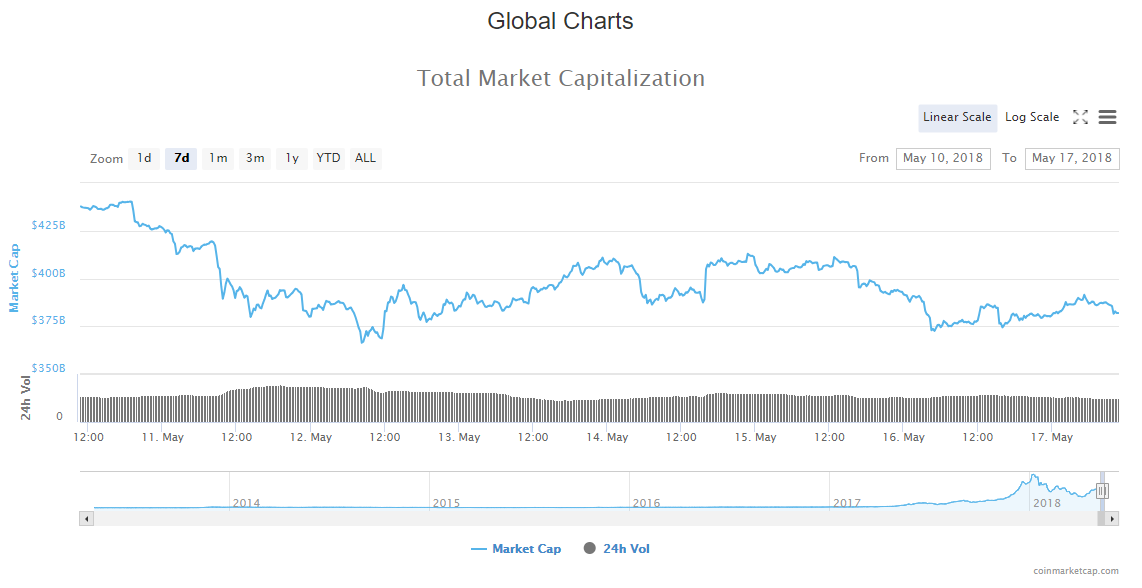
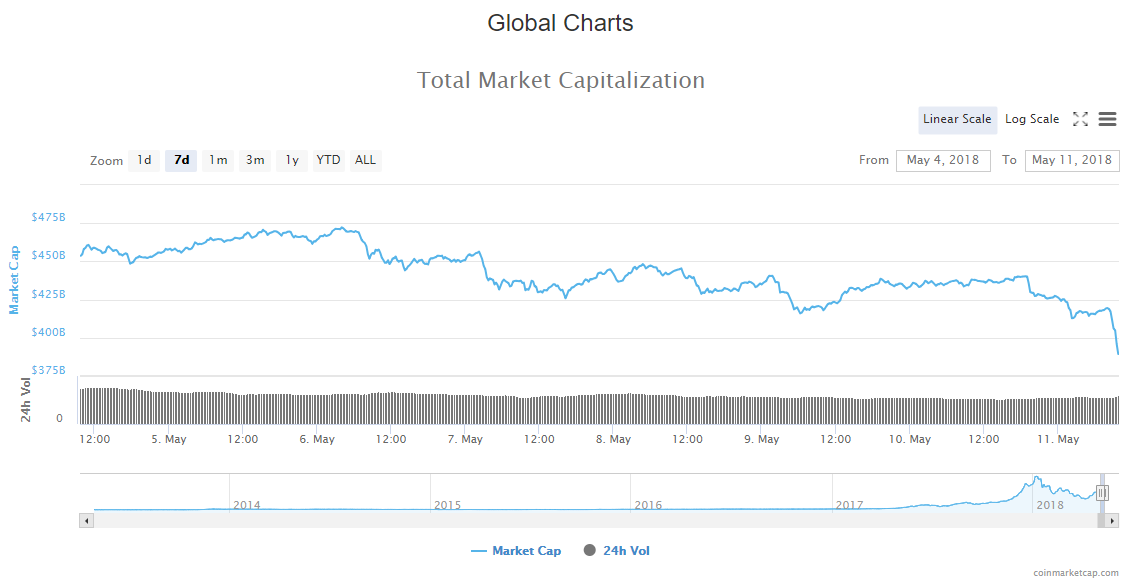
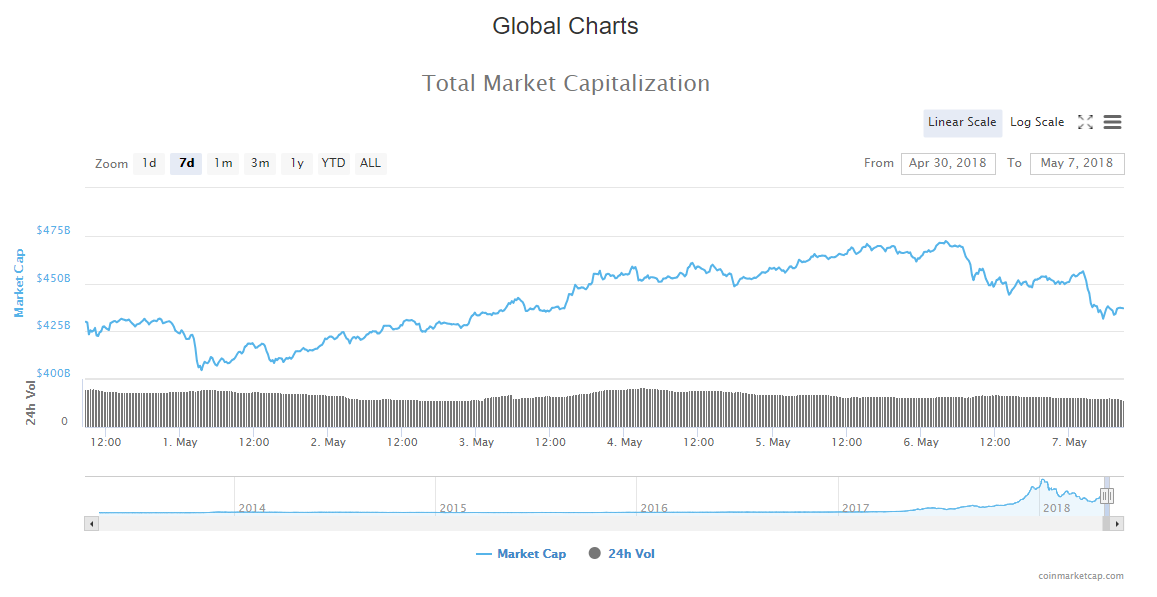
Market Cap: $406,983,271,081
24h Vol: $22,745,382,371
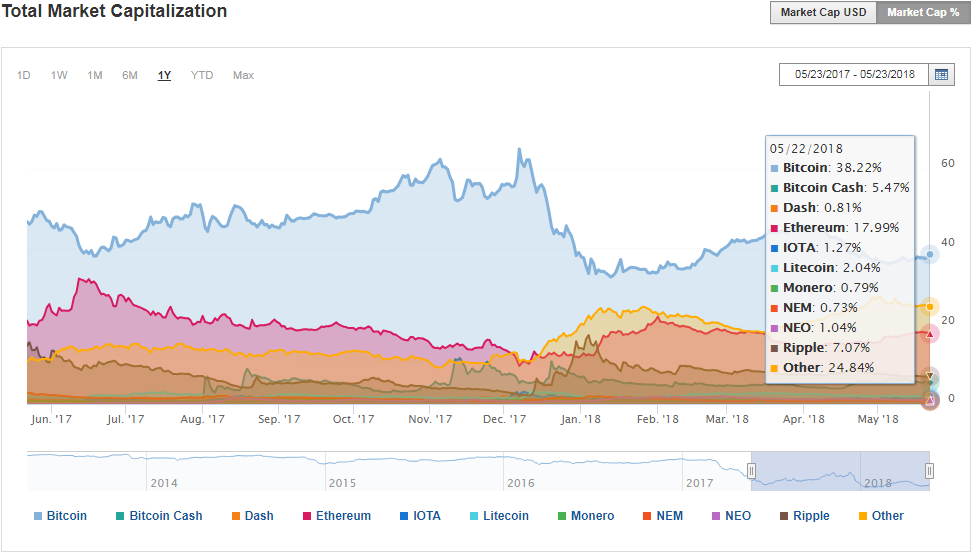
BTC Dominance: 36.6%

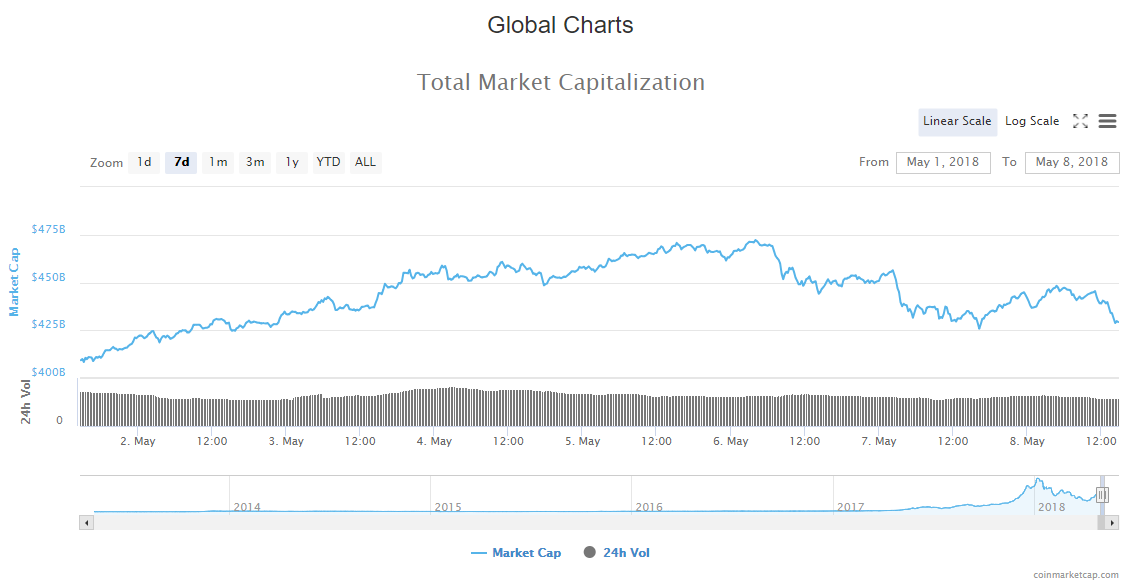
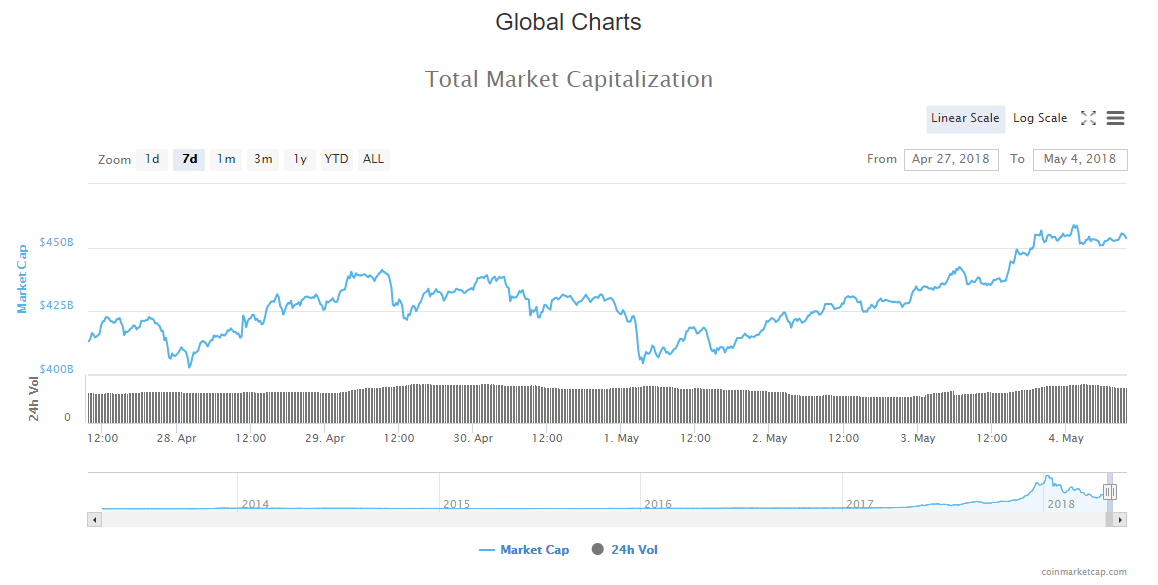
Since yesterday’s low at $386,345,000,000, the Cryptocurrency Market Capitalisation has been increasing rapidly and has reached $413B, from which it has retraced a bit to $407B, where it is now sitting.
As you would presume, the market is in green, with small exceptions on those cryptos that experienced a rise in price while everything was decreasing. Biggest gainers among top 100 are Zcash (44%), Salt (17%), Enigma (16%), and average increase is from 5-12% among the top 100.
News
Top stories that came out in the last 24 hours are extremely positive. These are some of the significant headlines:
HSBC Completes ‘World’s First’ Blockchain Trade Finance Deal, Ships Soybeans
UK-based banking giant HSBC has reportedly completed the world’s first ever trade finance transaction powered by blockchain, the Financial Times (FT) reported today, May 14.
New York City Wants To ‘Lead The Way In Blockchain’, Unveils Industry Initiatives
The President and CEO of the New York City Economic Development Corporation (NYCEDC) announced blockchain-related initiatives for the city today, May 14. The initiatives include the launch of the NYC Blockchain Resource Center and a public competition for blockchain apps to improve the public sector.
Forex Platform Serving Goldman Sachs and Morgan Stanley Adds Crypto Trading
Software developer Kx Systems has launched cryptocurrency trading on its white label forex (FX) trading platform Kx for Flow, the company reported in a blog post May 14. Starting today, Kx for Flow customers are able to conduct spot trading of Bitcoin (BTC), Ethereum (ETH), Bitcoin Cash (BCH), Litecoin (LTC), and Ripple (XRP).
CFO of Australia’s Commonwealth Bank Quits Role To Join EOS Token Developer Block.One
Rob Jesudason, the Chief Financial Officer (CFO) of Australia’s Commonwealth Bank (CBA), has left the bank to join a blockchain company, the Sydney Morning Herald reports May 14. Jesudason resigned with immediate effect in order to become the group president and chief operating officer of blockchain software firm Block.one.
CME Group Launches Ethereum Price Indexes In Partnership With Ethereum Futures Exchange
The Chicago Mercantile Exchange (CME Group) in partnership with Crypto Facilities, a UK-based digital asset exchange specializing in crypto futures, have launched the CME CF Ether-Dollar Reference Rate and Real Time Index, according to an announcement May 14. The indexes will provide users access to a real-time Ether (ETH) price in US dollars.
US: Seminole County Florida To Accept Crypto For Tax Payment
The Seminole County, Florida, tax collector Joel M. Greenberg announced May 14 that the county will begin accepting cryptocurrency for payment for various services this summer in order to eliminate heavy fees and improve payment accuracy and efficiency.
‘Global Blockchain Leader’ At Deloitte Resigns To Join Blockchain-Based Startup
Eric Piscini, former Global Blockchain Leader and Partner at one of the “Big Four” consulting firms, Deloitte, has left the company, Forbes reports May 14. Piscini, who helped build a $50 mln global blockchain practice, is joining the startup Citizens Reserve to move supply chain networks to a blockchain.
Taiwan: Taipei Bank Launches First Blockchain Payment System In The Country
Privately-held Taipei Fubon Commercial Bank has reportedly become the first bank in Taiwan to deploy a blockchain-based payment system, local media Taipei Times reports May 14. The bank announced that it deployed its blockchain-based payment system for restaurants and merchants near the National Chengchi University. Taipei Fubon Bank first revealed its plans to introduce a blockchain-based payment network in March 2017 when it signed a contract with the university to carry out “key technology and engineering R&D for [a] blockchain payment network.”
First Crypto Exchange Using Nasdaq’s Tech Announces Launch, Excluding US Customers
The first cryptocurrency exchange to use US stock market giant Nasdaq’s technology revealed it plans to launch next month in an exclusive with Finance Magnates Monday, May 14. Nasdaq, the second largest stock exchange in world by market capitalization after the New York Stock Exchange (NYSE), is providing the technology to power the new centralized crypto exchange, DX, according to the project’s CEO Daniel Skowronski. Skowronski called the upcoming exchange a “one-stop-shop” for “exchanging fiat and crypto, holding coins and as well as wallet services.”
Source: cointelegraph.com
Analysis
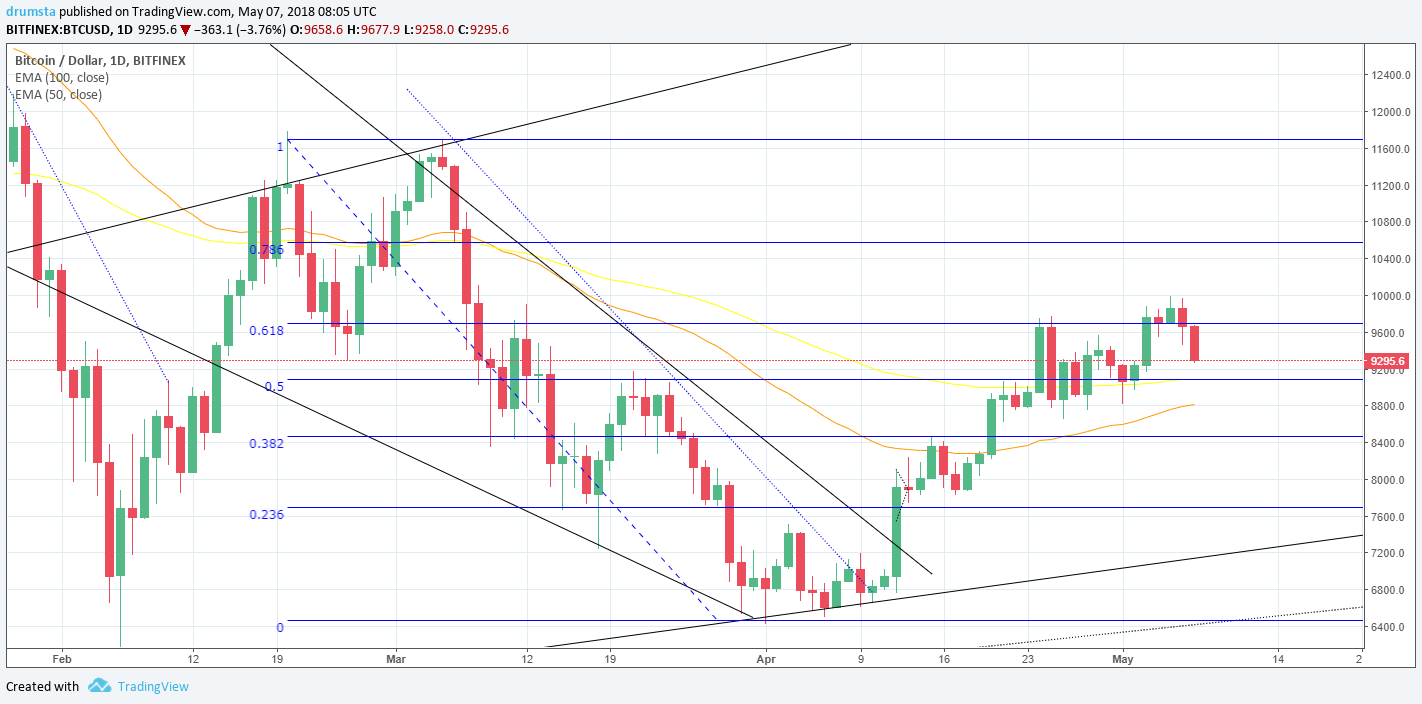
BTC/USD
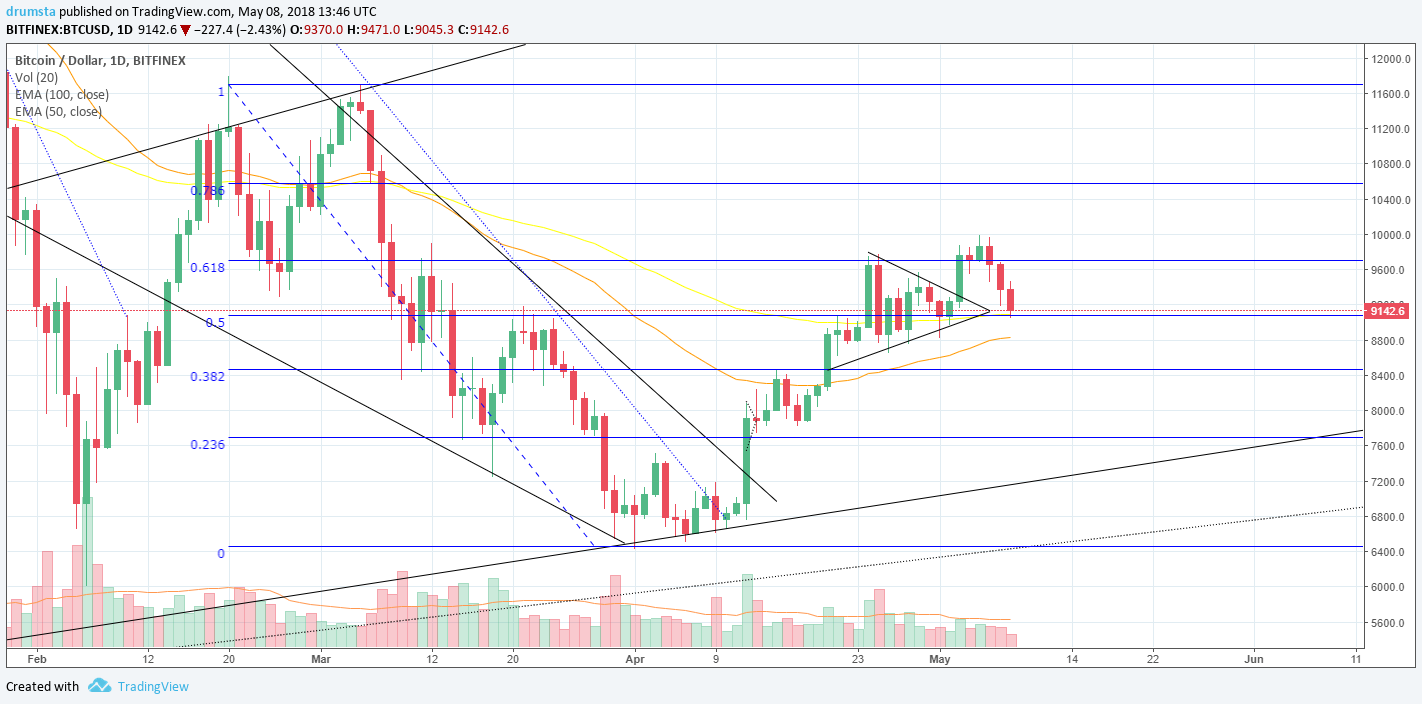
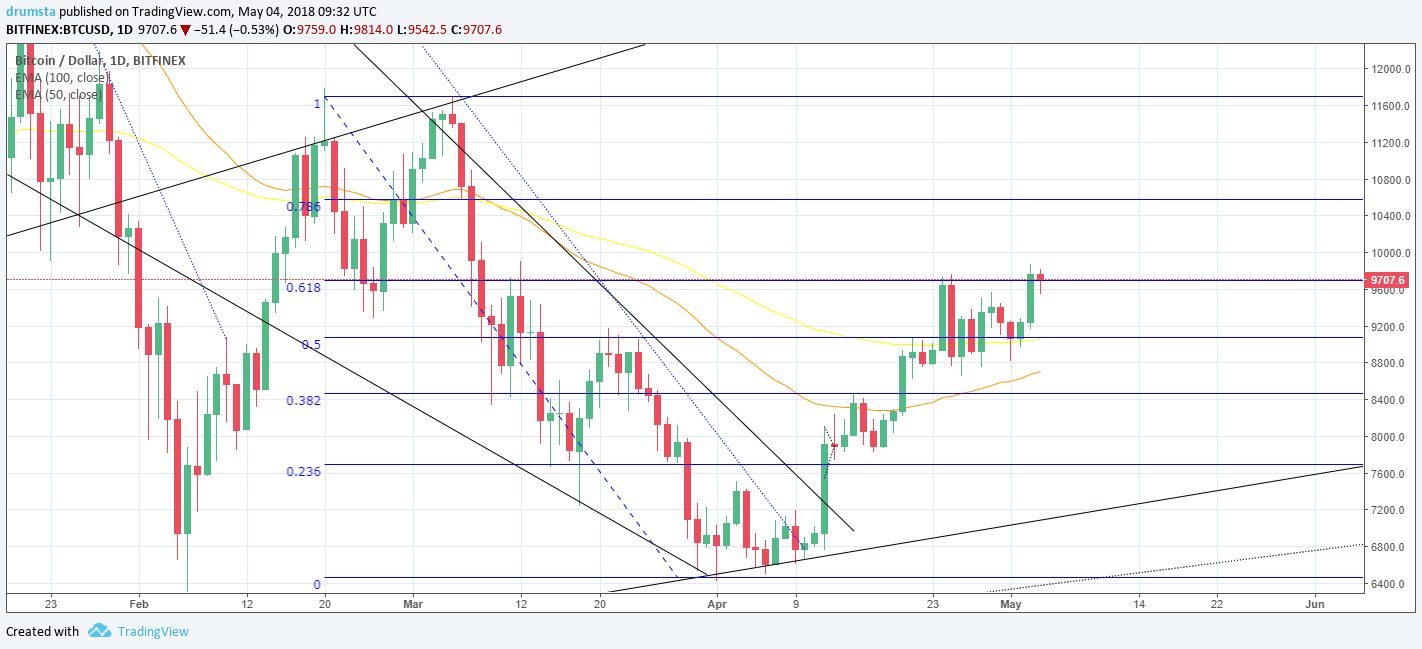
Since yesterdays low at $8362, the price of Bitcoin has increased to $8726, which is a 4.28% increase.
Looking at the daily chart, we can see that the price is currently below the 50-day EMA with which it interacted with and bounced back, leaving a wick from the upside. Yesterday’s candle closed as a Doji with a higher wick from the downside which indicates buying pressure.
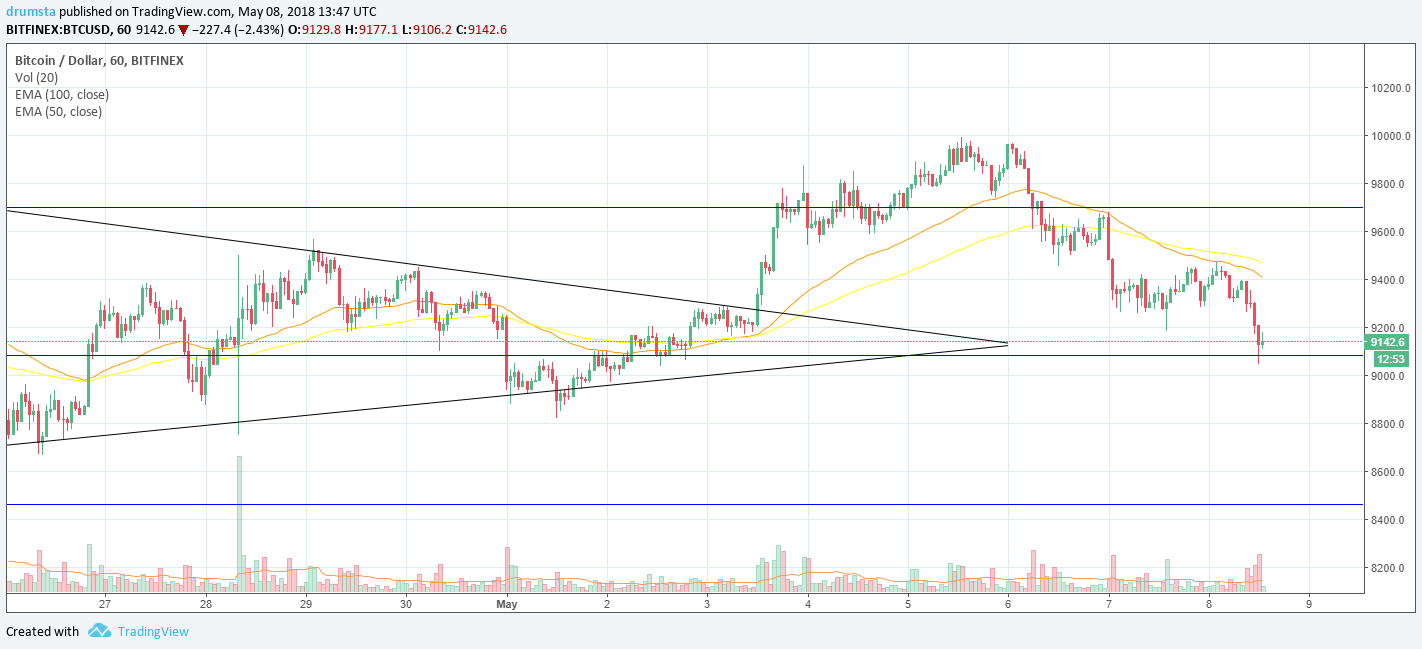
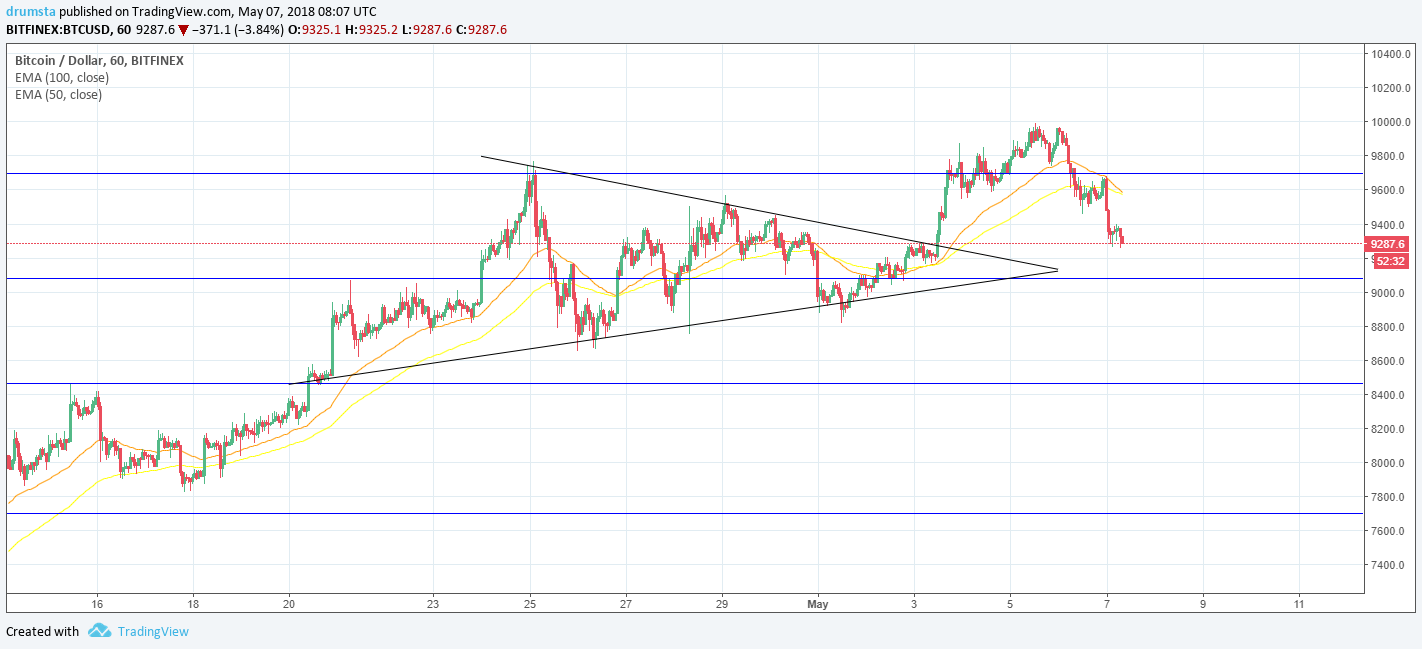
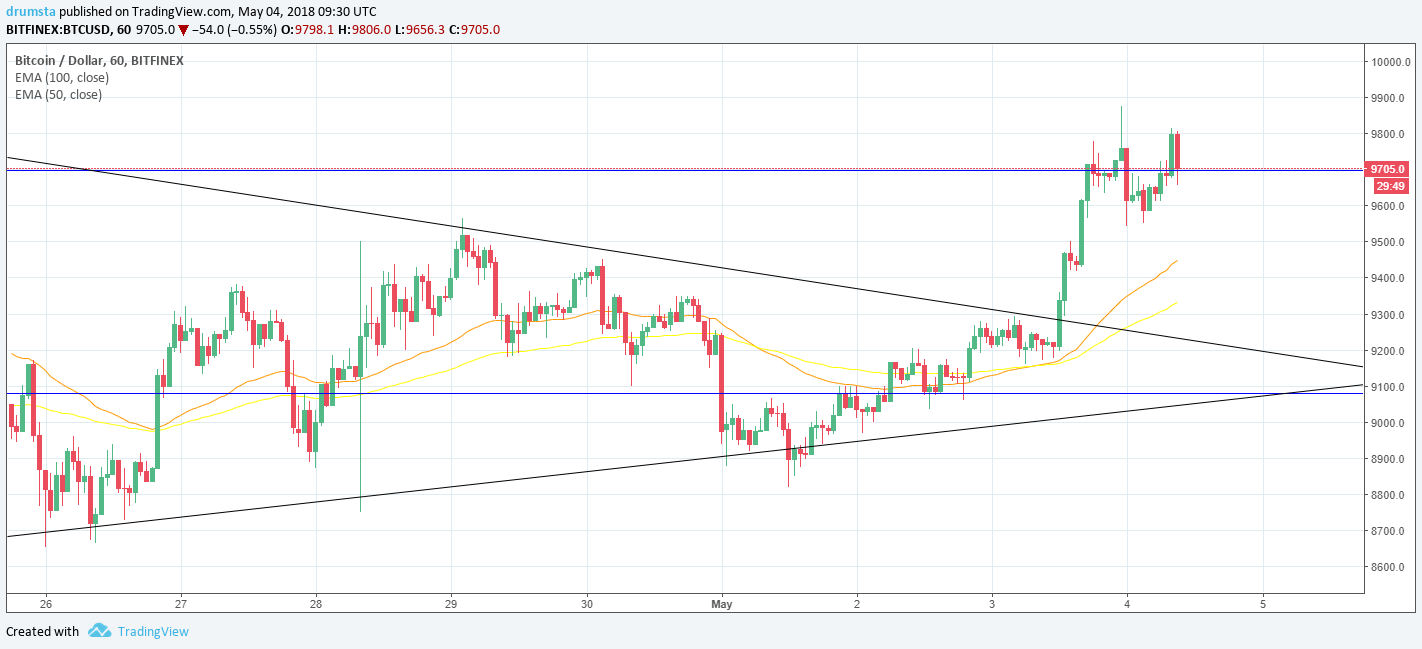
Zooming into the hourly chart, we can see that the price is currently in an upward channel that intersects the downward one. The price has broken the upper resistance line of the downward channel and retested it for support.
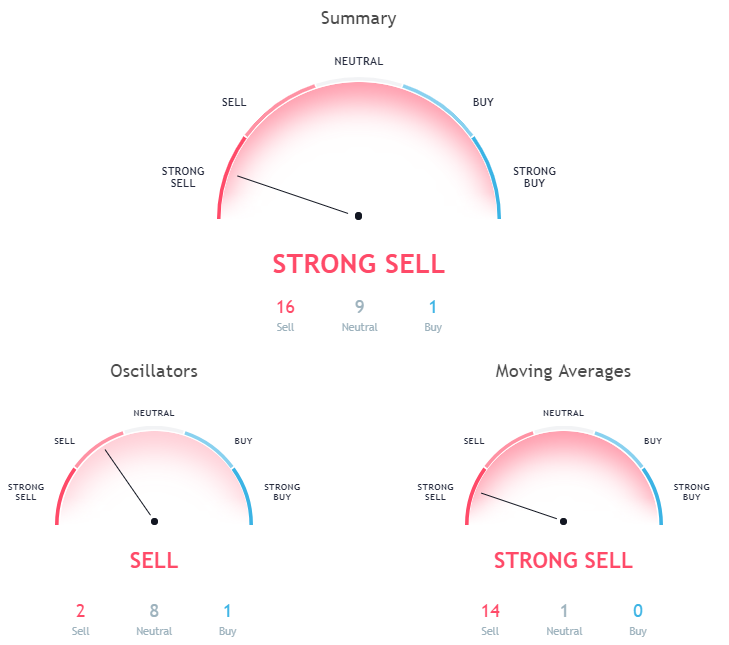
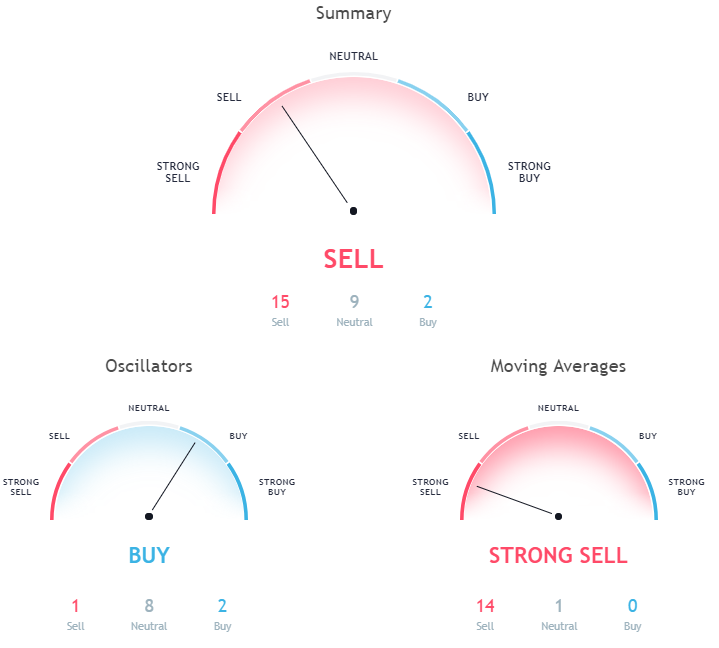
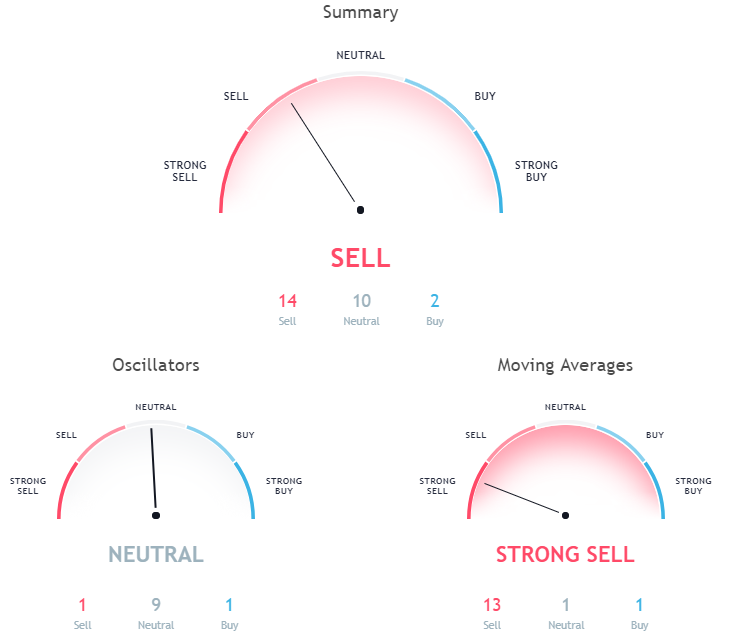
Market sentiment
Hourly chart technicals are on neutral.
Oscillators and moving averages are both on neutral.
Pivot points
S3 7381.8
S2 7995.3
S1 8333.0

P  8608.8

R1 8946.5
R2 9222.3
R3 9835.8
ETH/USD
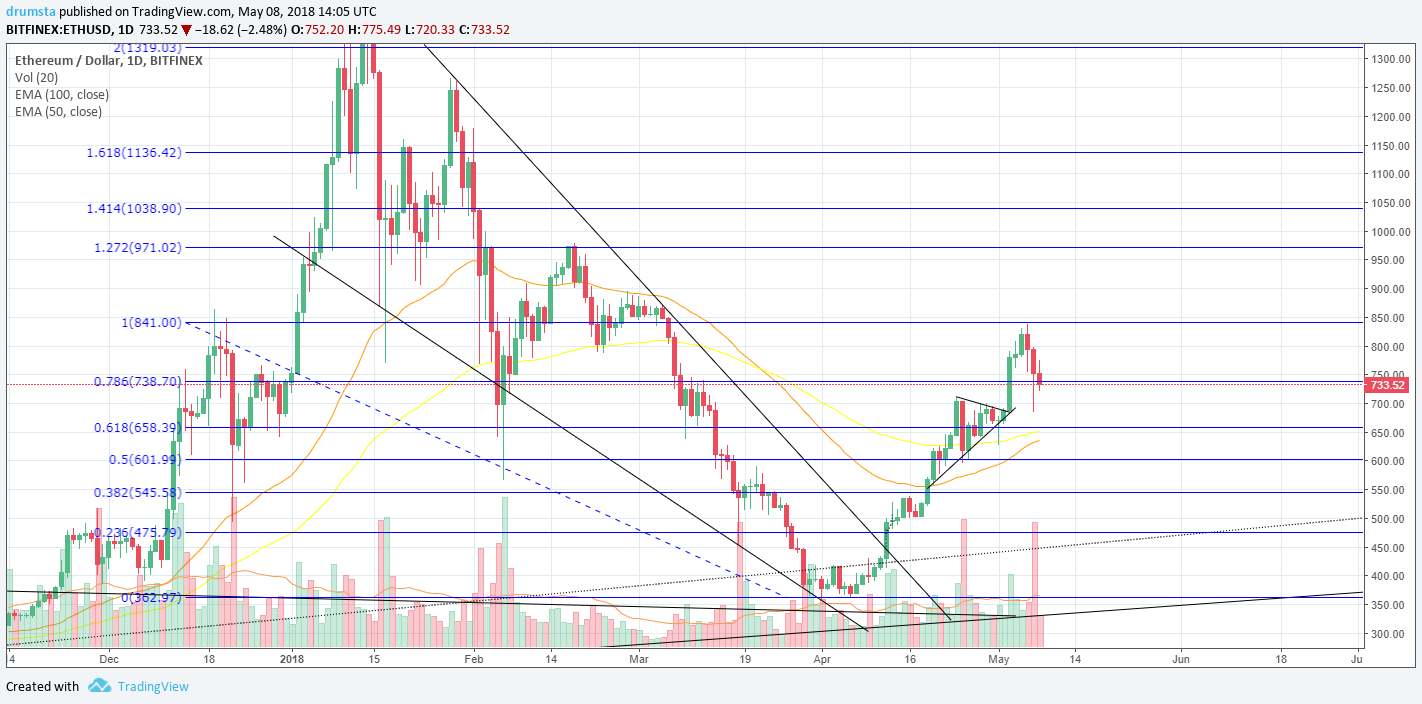
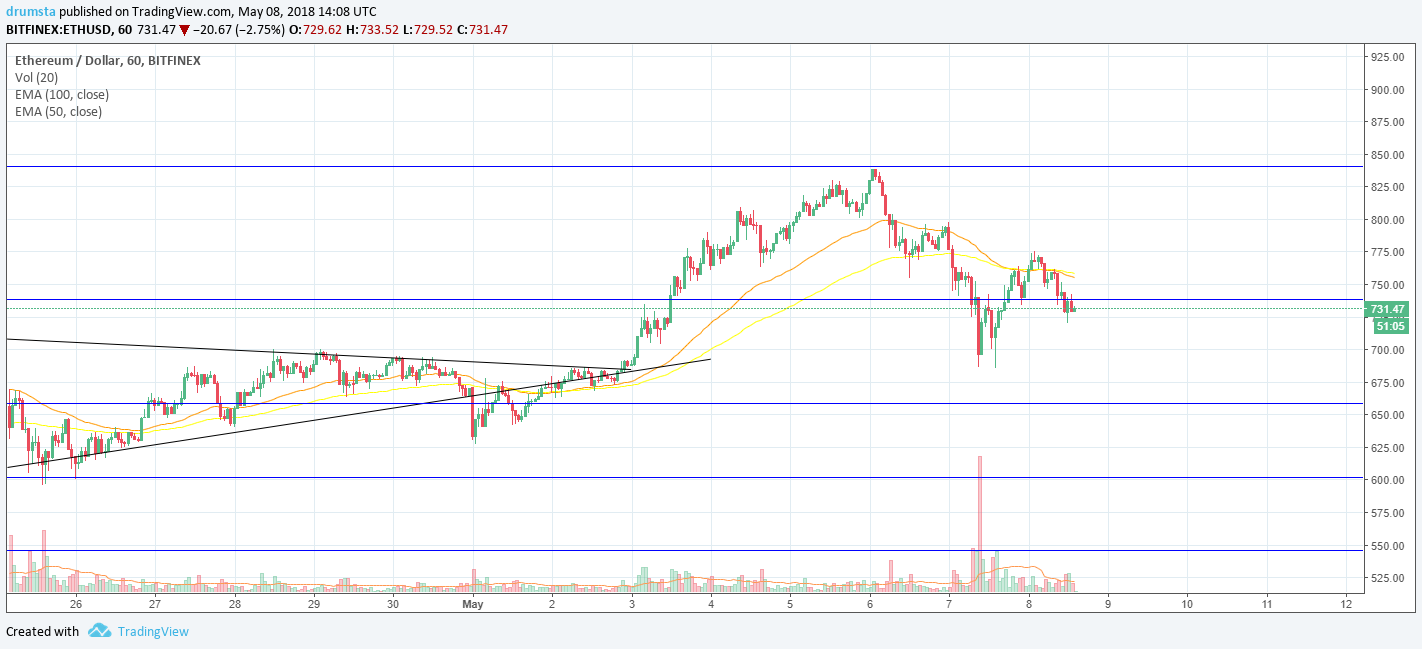
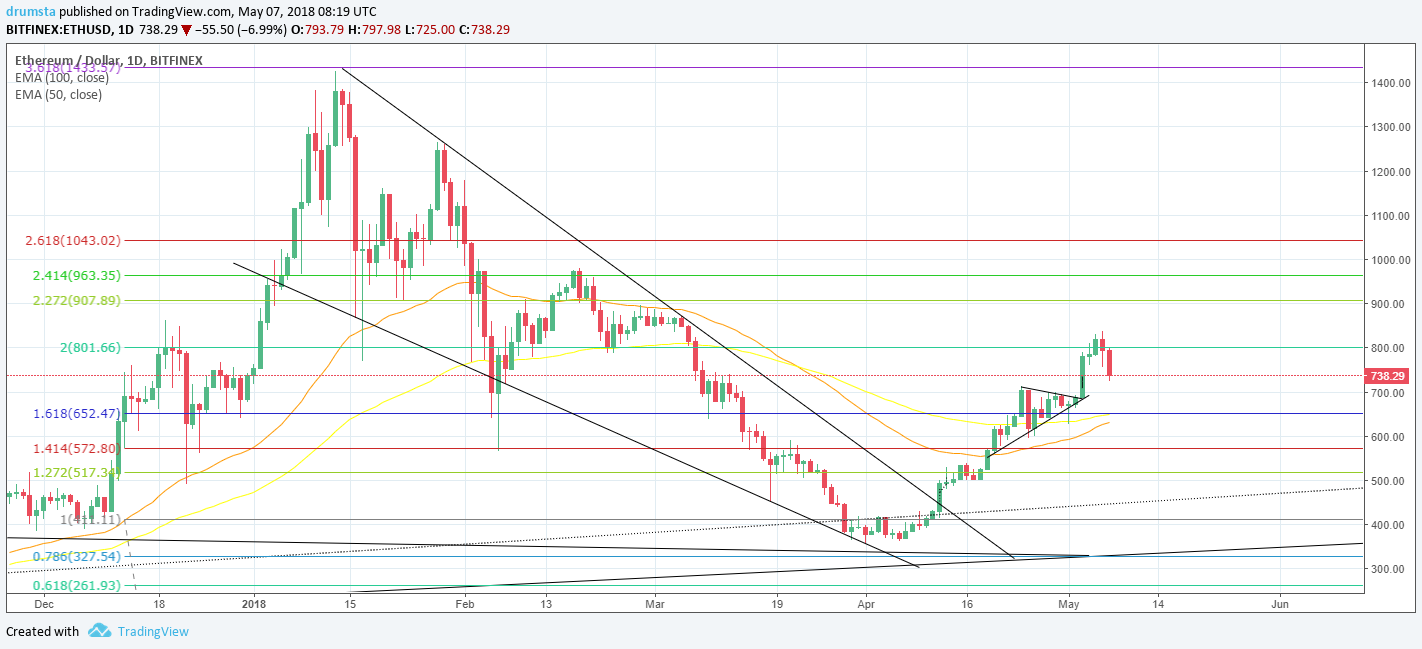
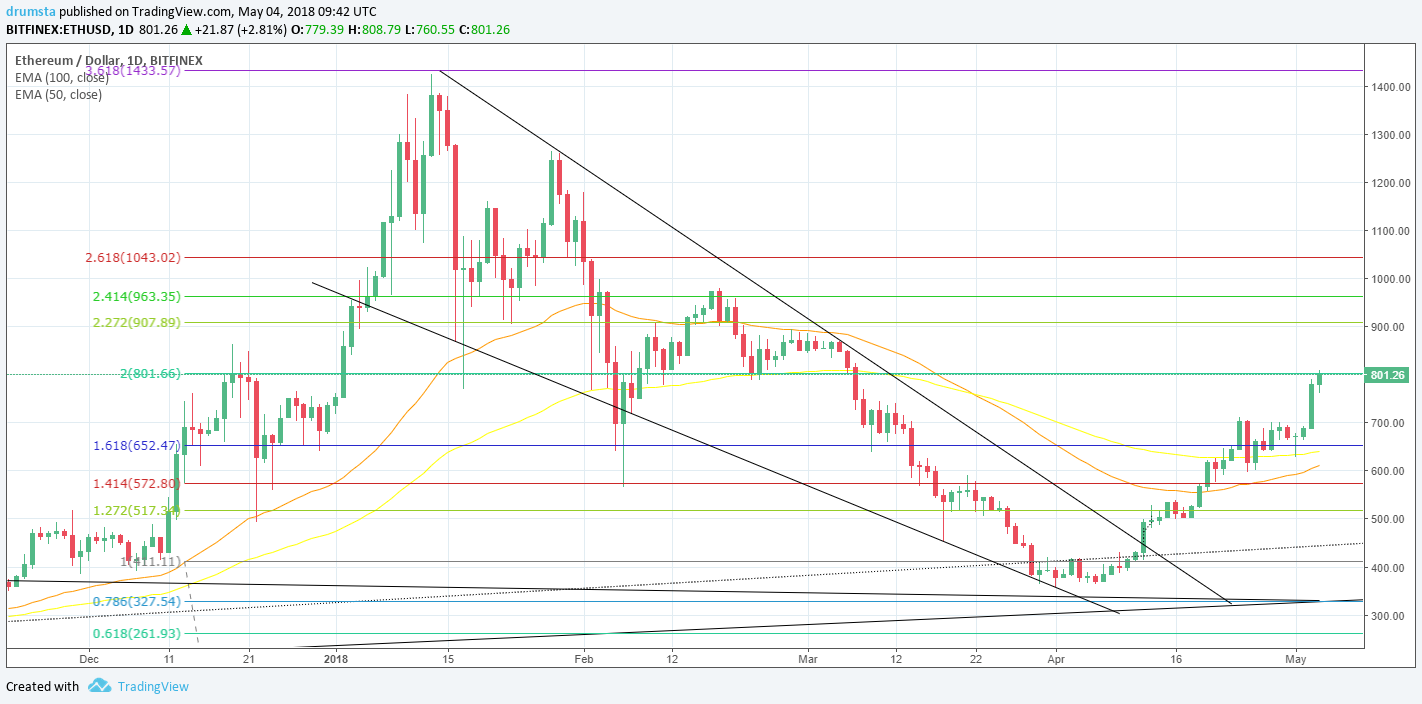
From yesterday’s low at $695, the price of Ethereum increased by 4.71%, going to $728.
On the daily chart, we can see that the price interacted with its 0.618 Fibonacci retracement level yesterday, and has retraced since closing as a shooting star. Today’s candle is currently a doji which means indecision.
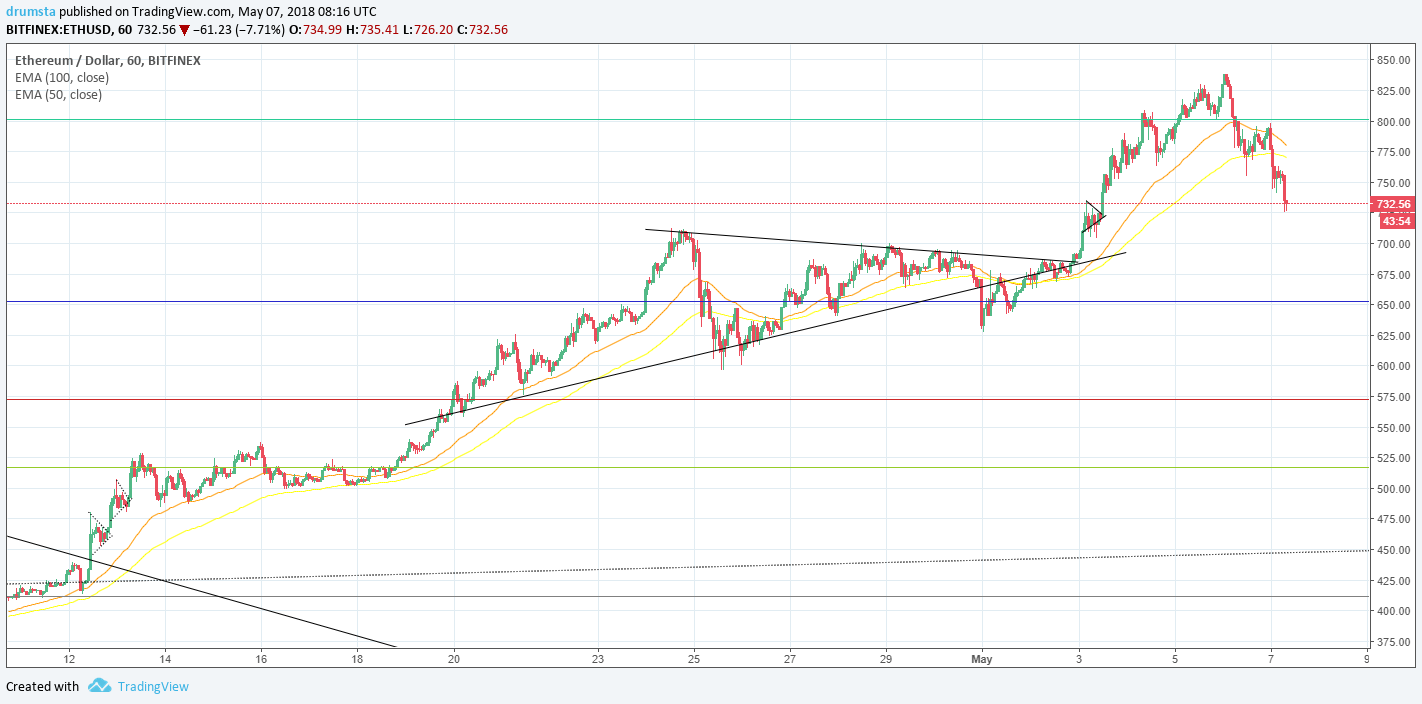
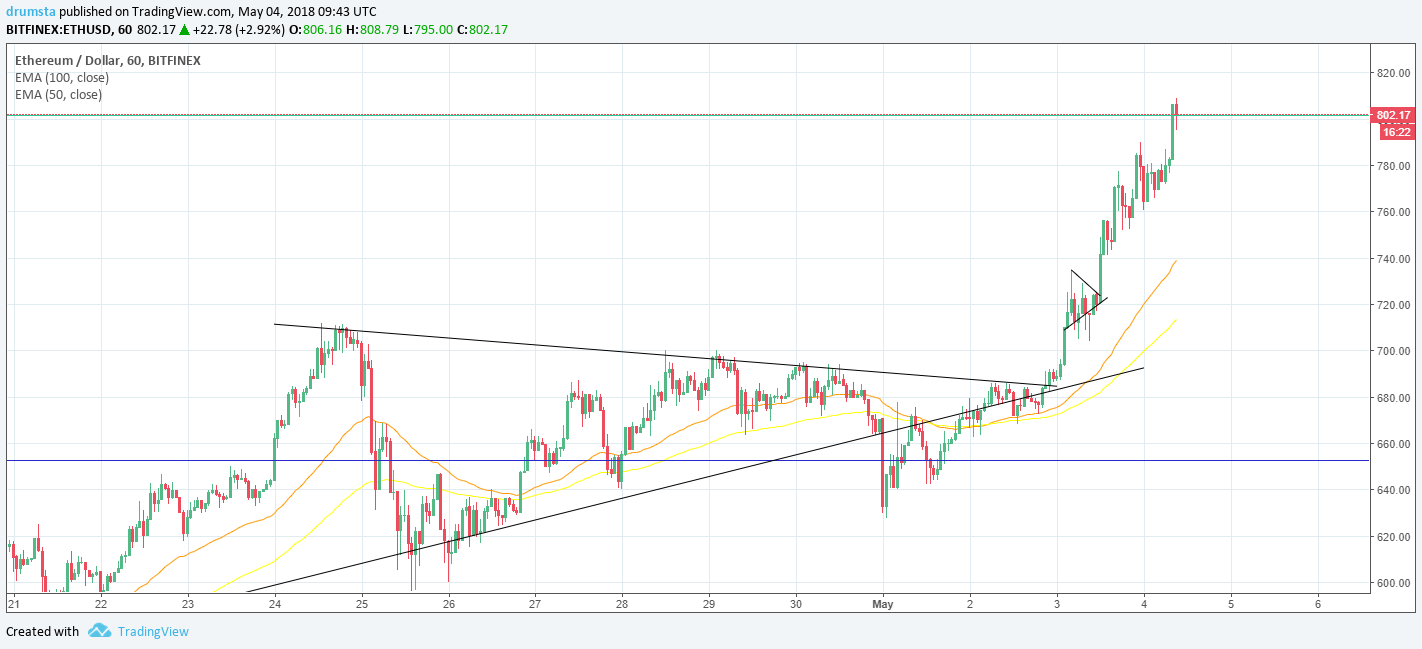
As in the case of Bitcoin, the price of Ethereum is in an upward channel on the hourly chart and is currently interacting with the support line.
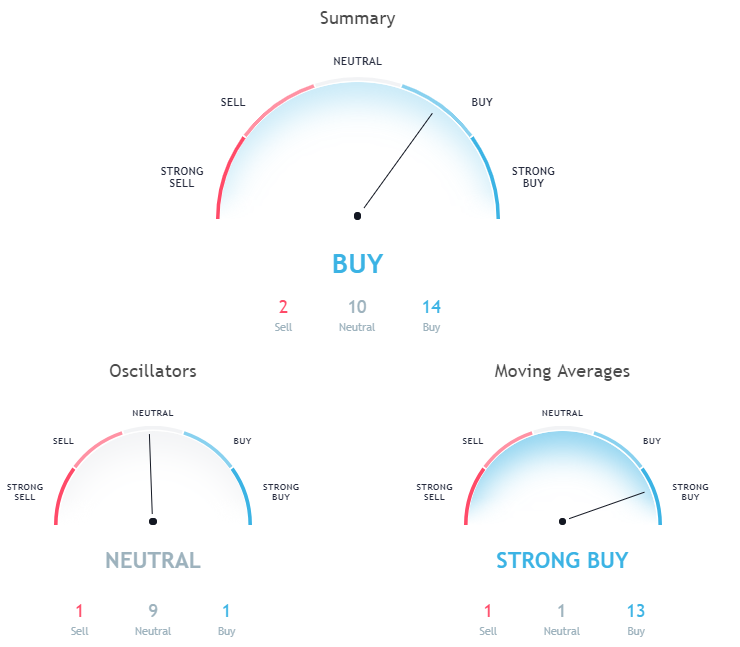
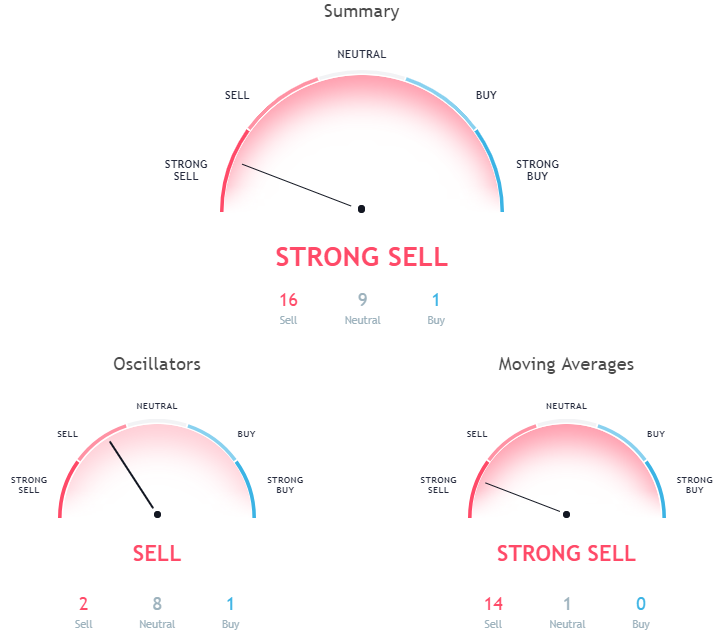
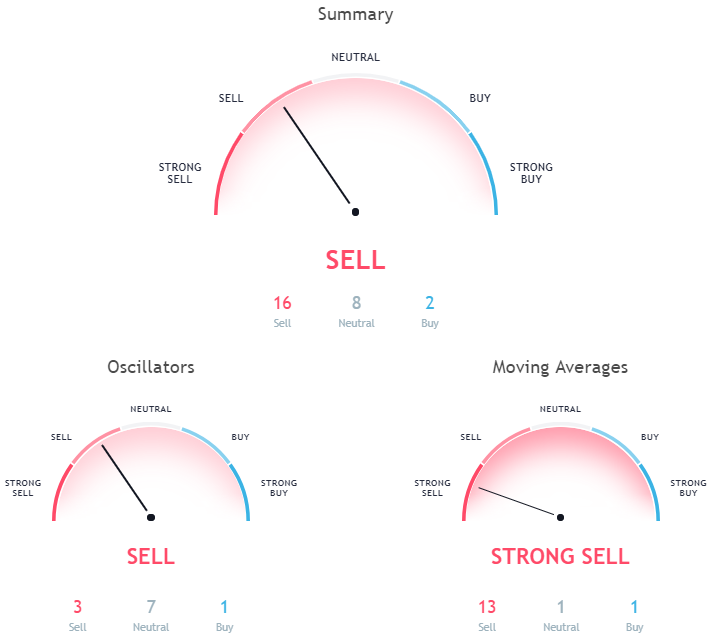
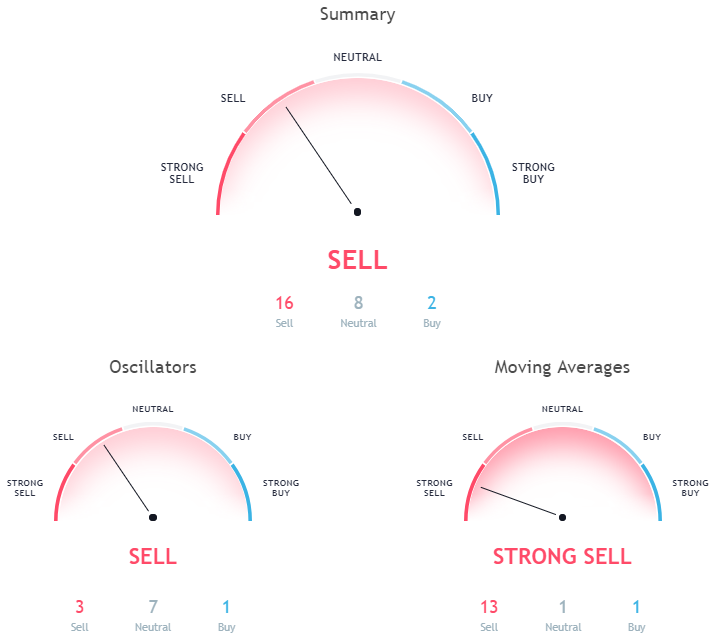
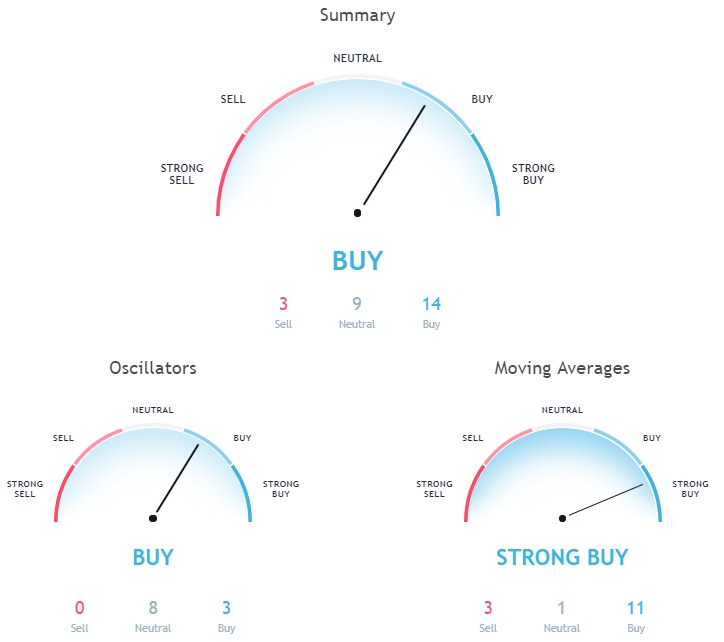
Market sentiment
Hourly chart technical signal buy.
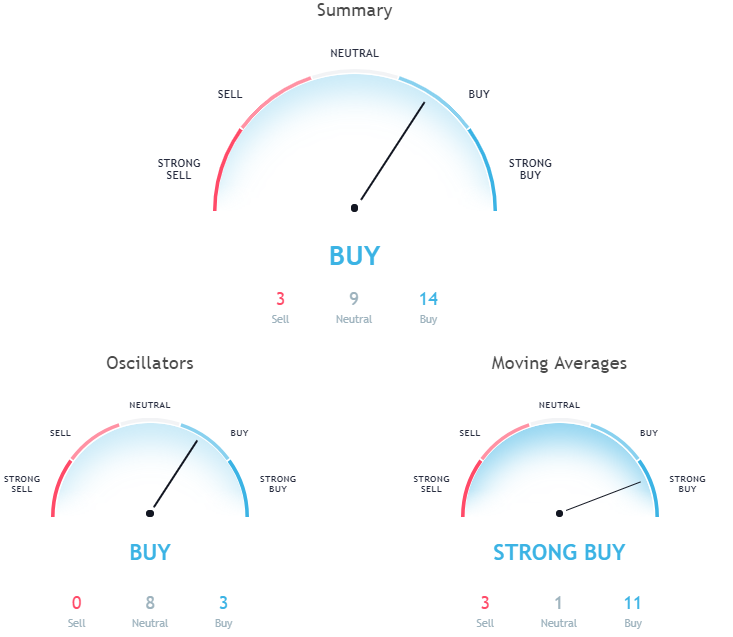
Oscillators are on neutral, and moving averages are signaling a buy in a 6:8 ratio.
Pivot points
S3 601.44
S2 659.80
S1 693.61

P  718.16

R1 751.97
R2 776.52
R3 834.88
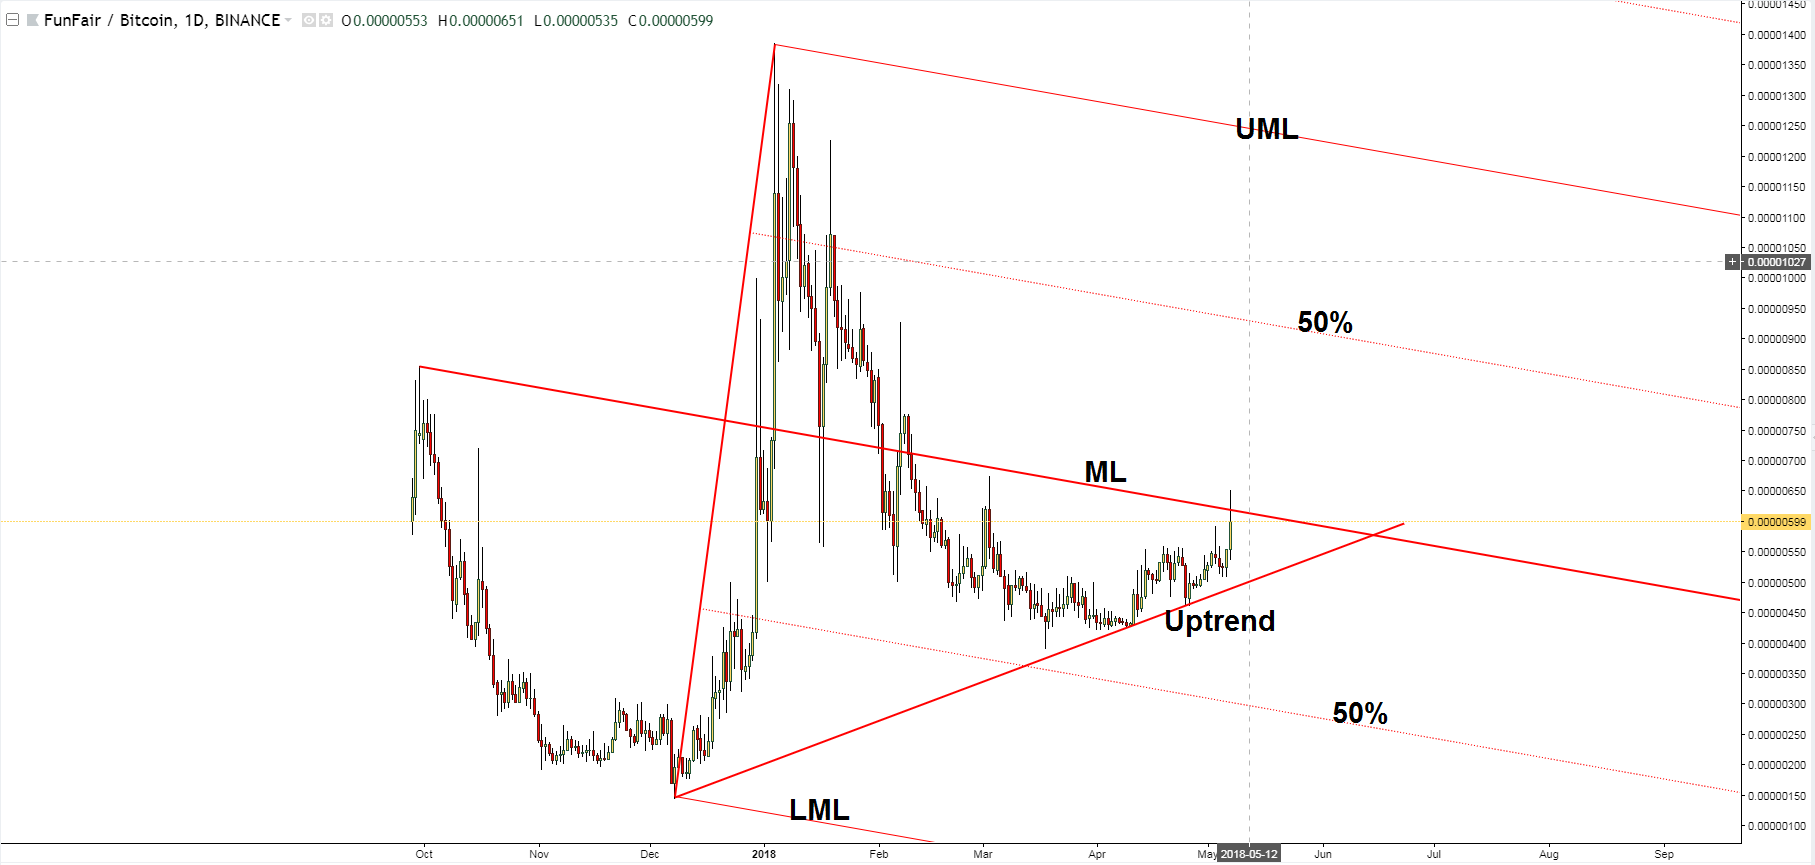
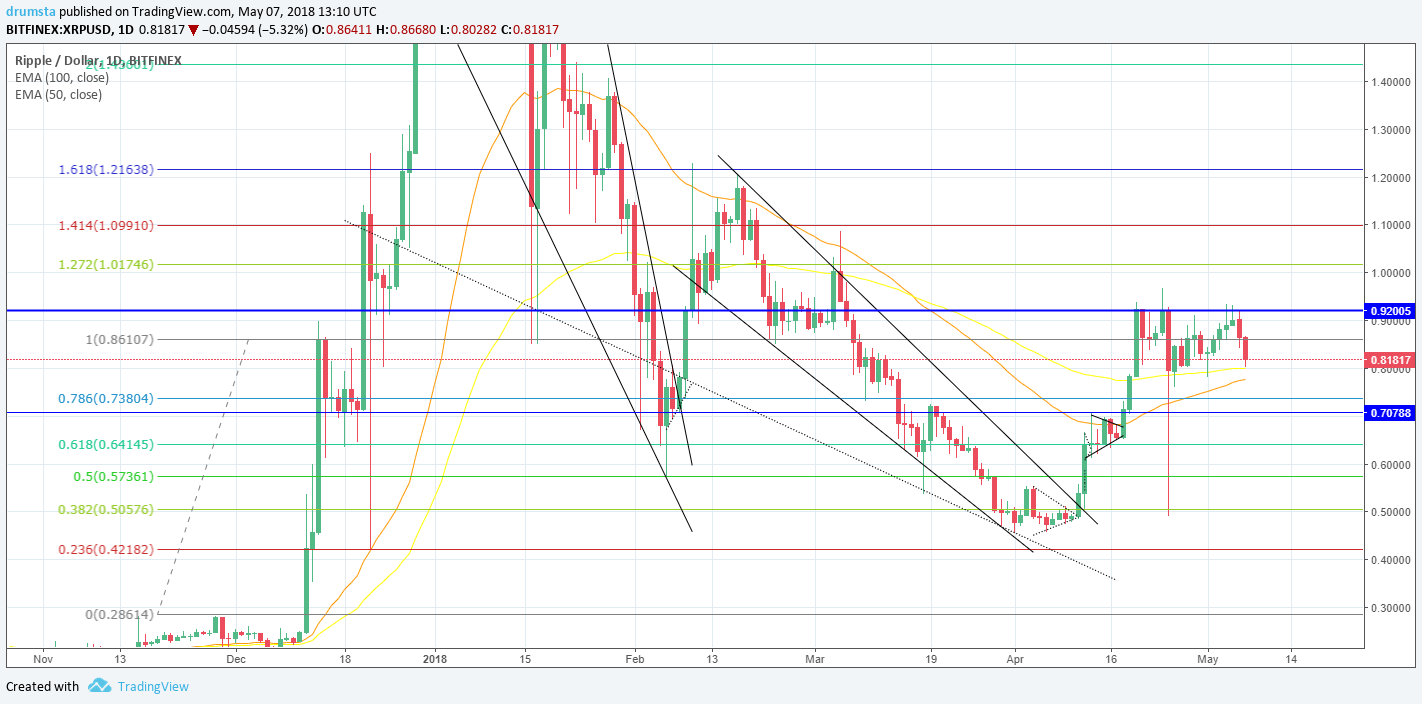
XRP/USD
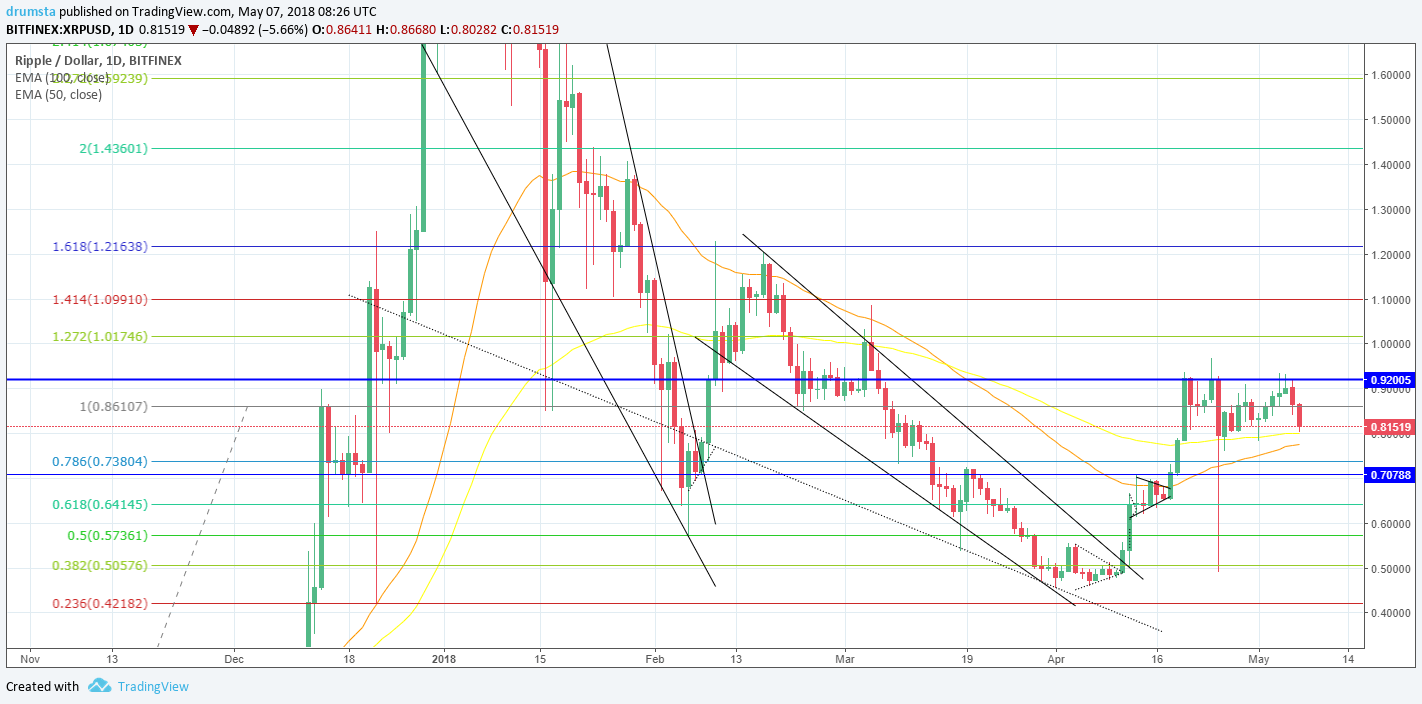
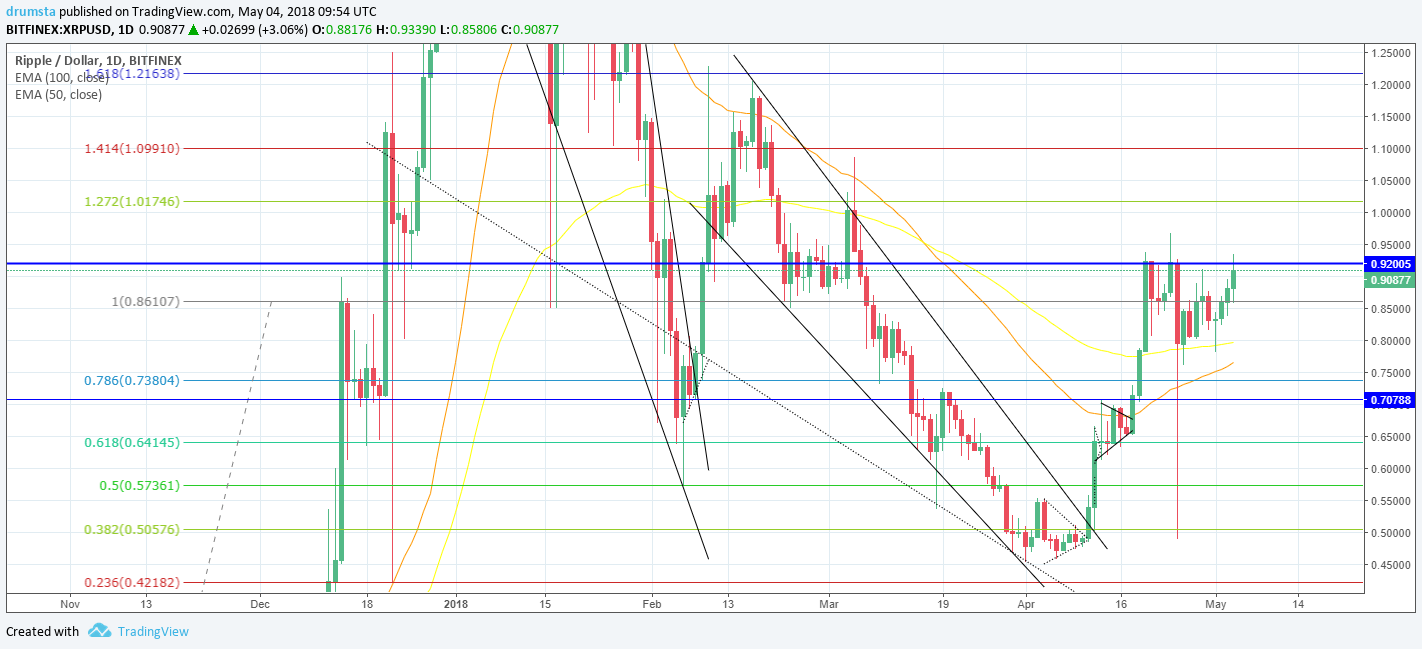
From yesterday’s low at $0.692, the price of Ripple has increased by 5.56% and is currently sitting at $0.73.
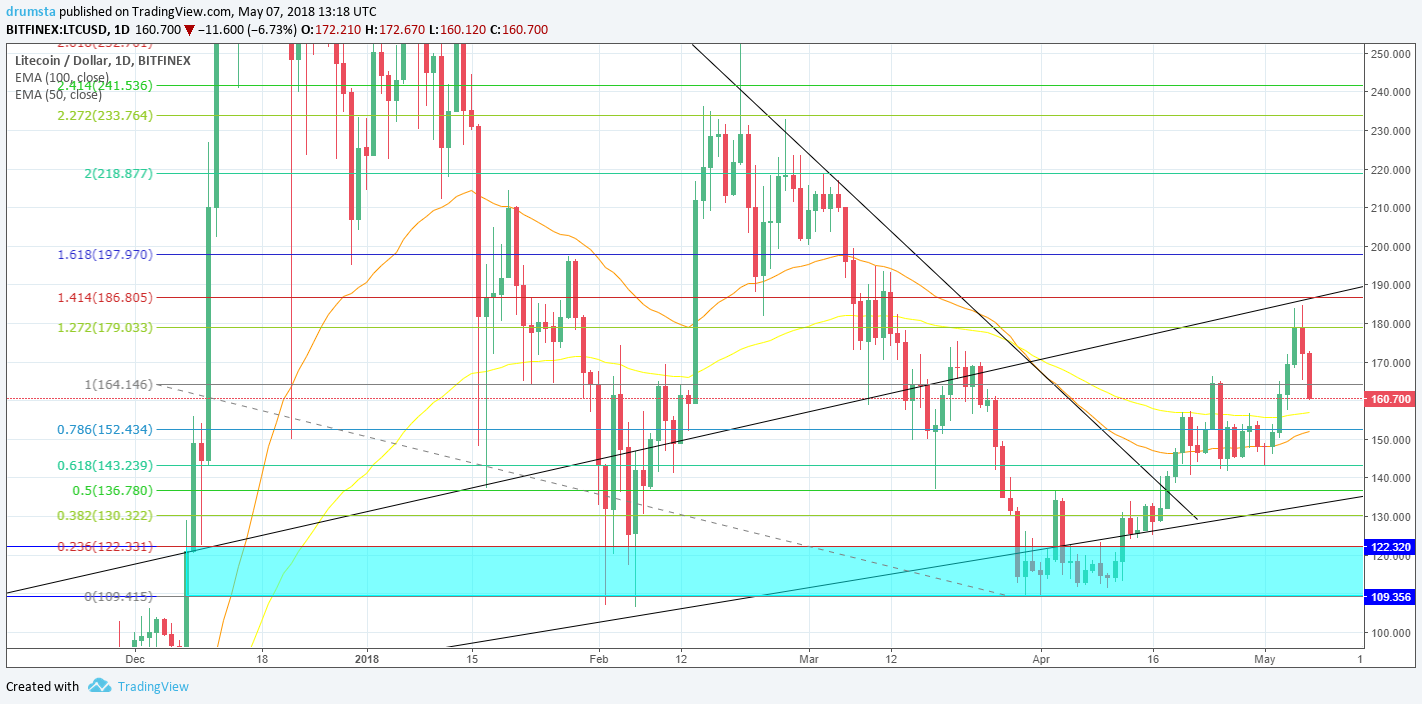
Looking at the daily chart, we can see that the price of Ripple interacted with its support at $0.7 and quickly bounced back, closing on a Doji yesterday. Since then the price is slightly up, as indicated by today’s green candle, but it hasn’t exceeded the 0.382 Fibonacci retracement level which serves as resistance.
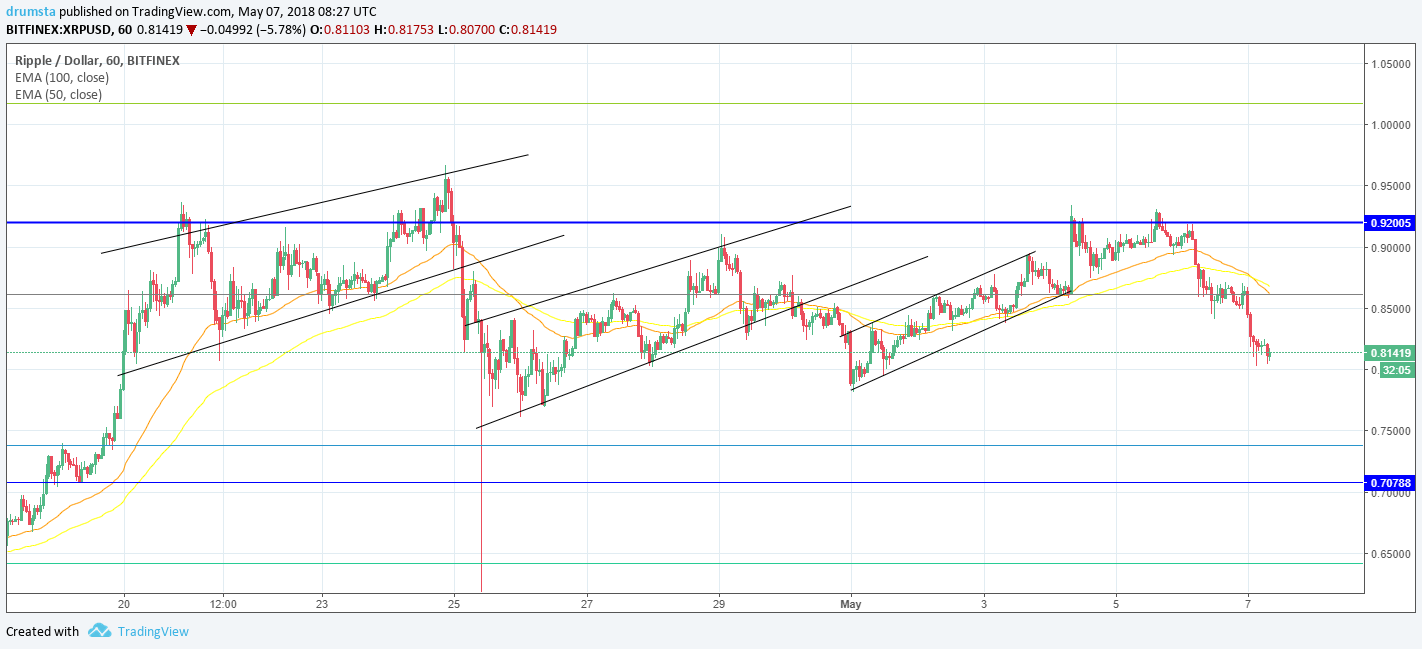
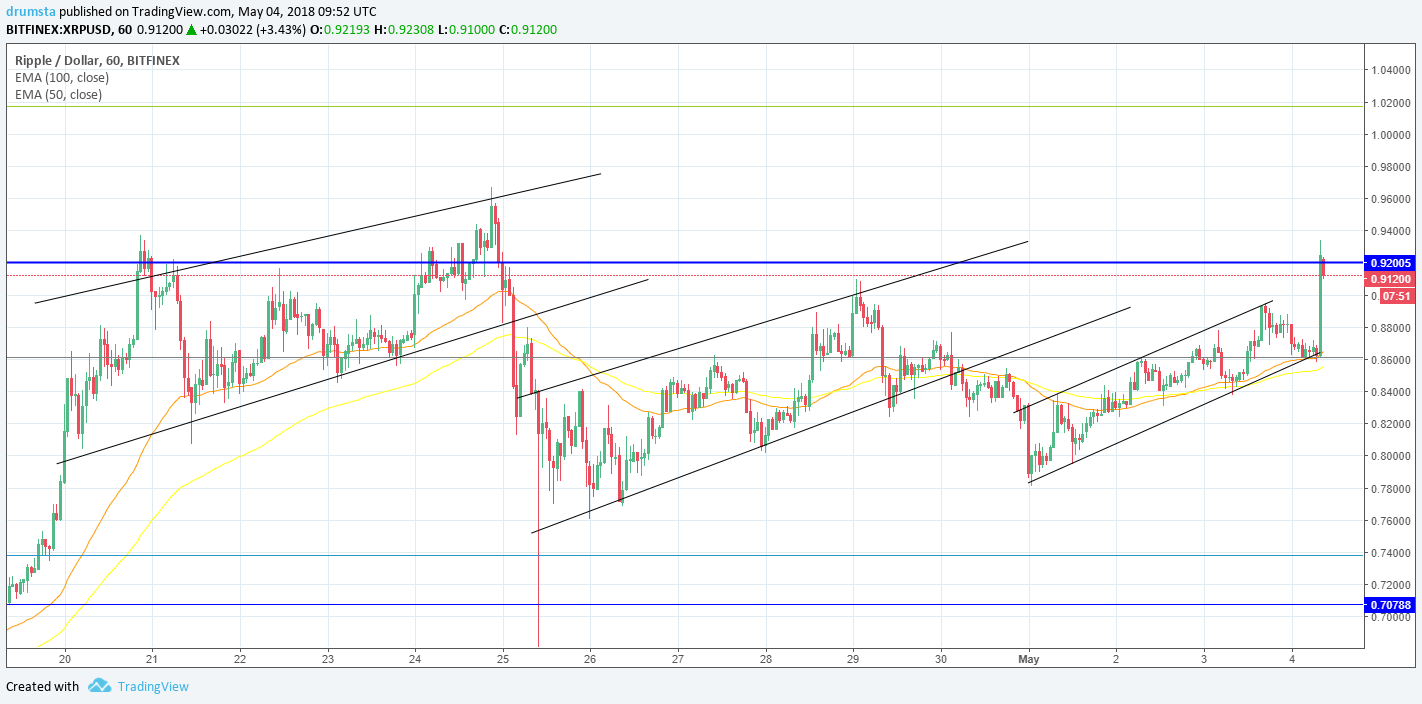
Zooming into an hourly chart, we can see the interaction with the 0.382 Fibo level. The price is above 50 and 100 hourly EMA’s which look like they are about to cross in a bullish manner. The price action is currently forming an ascending triangle, which usually means that the price will drop the same hight as the triangle, which would be somewhere around $0.692 in this case.
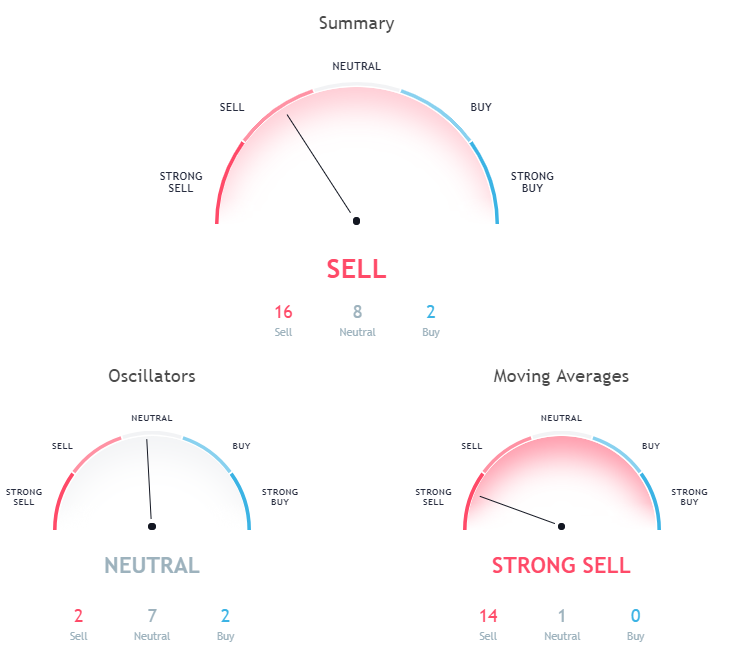
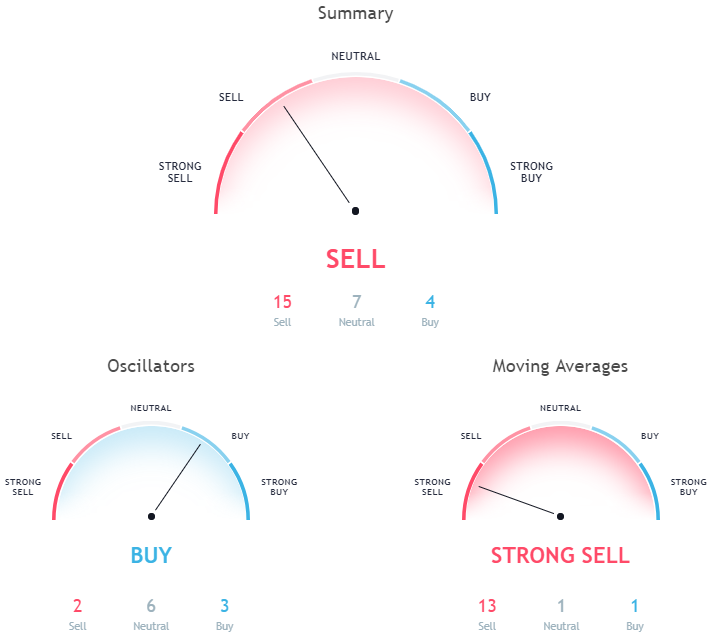
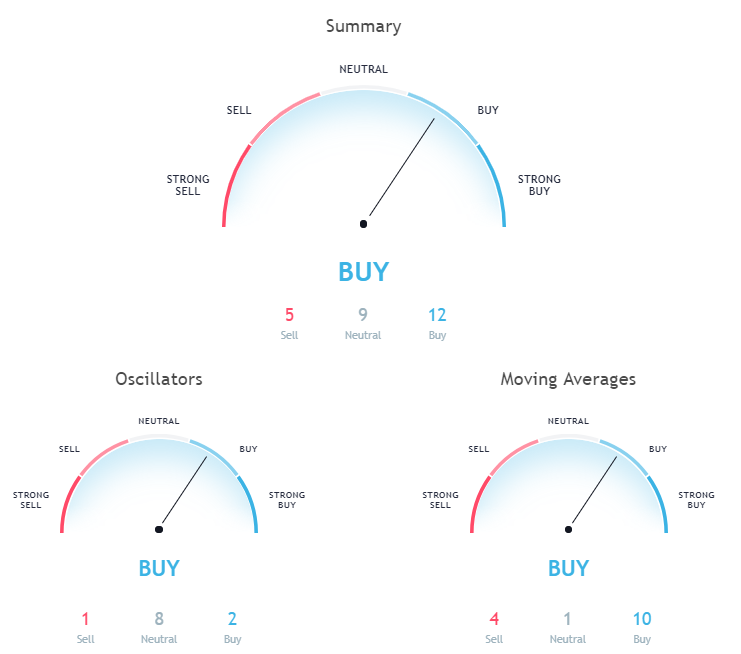
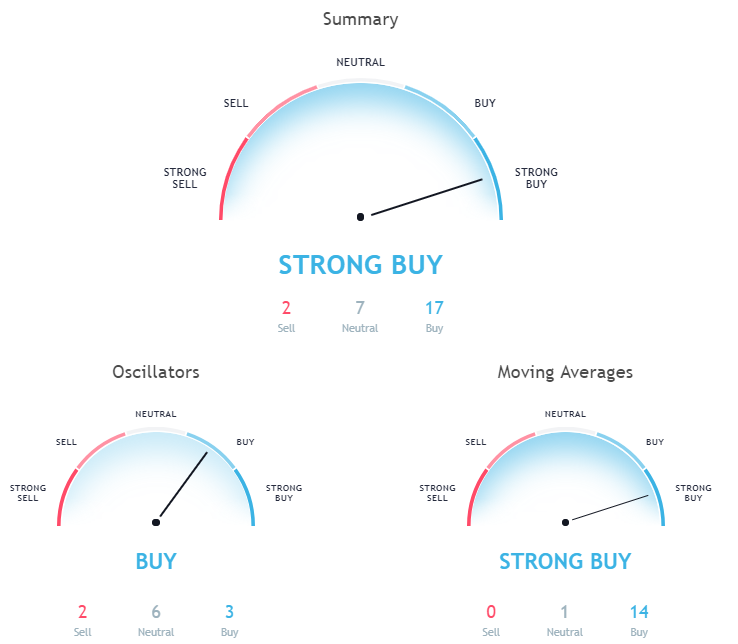
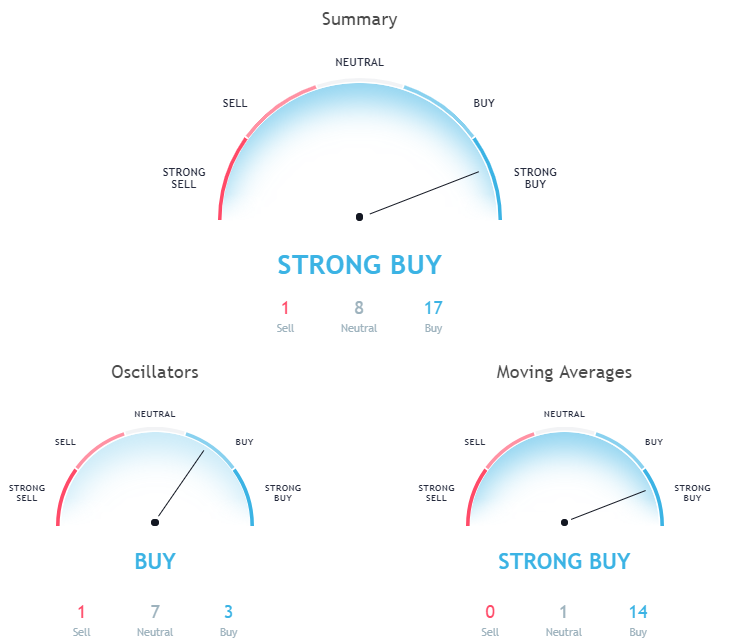
Market sentiment
Hourly chart technicals signal a sell.
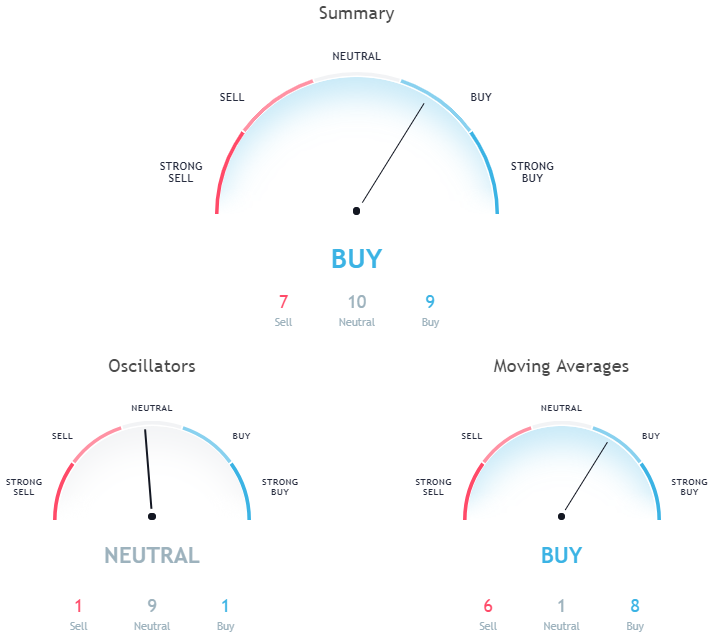
Oscillators are on sell, and moving averages on neutral in a 7:1:7 ratio.
Pivot points
S3 0.59291
S2 0.65694
S1 0.69195

P  0.72097

R1 0.75598
R2 0.78500
R3 0.84903
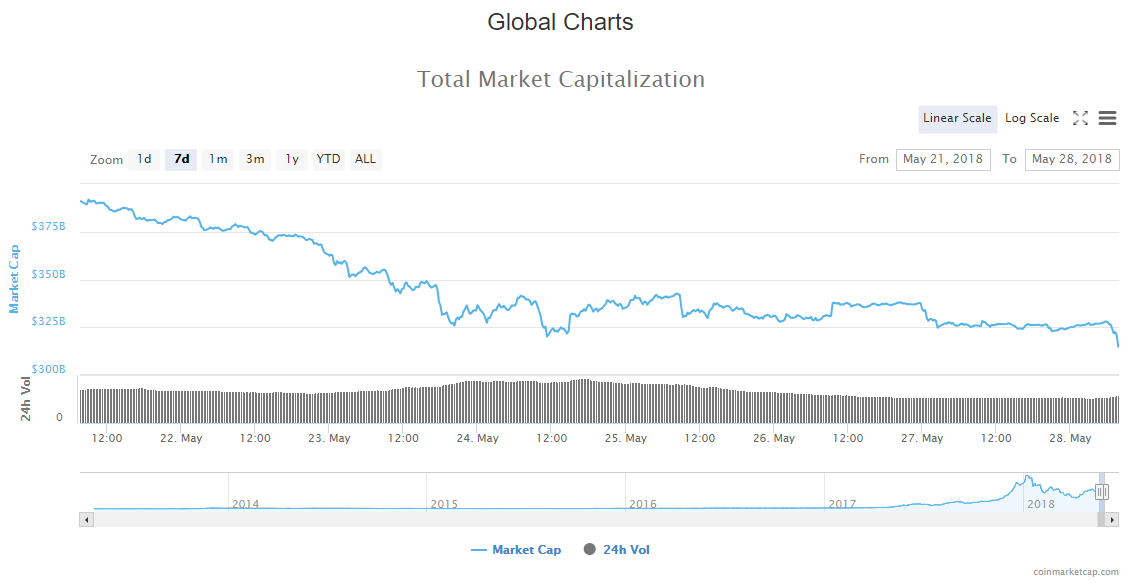
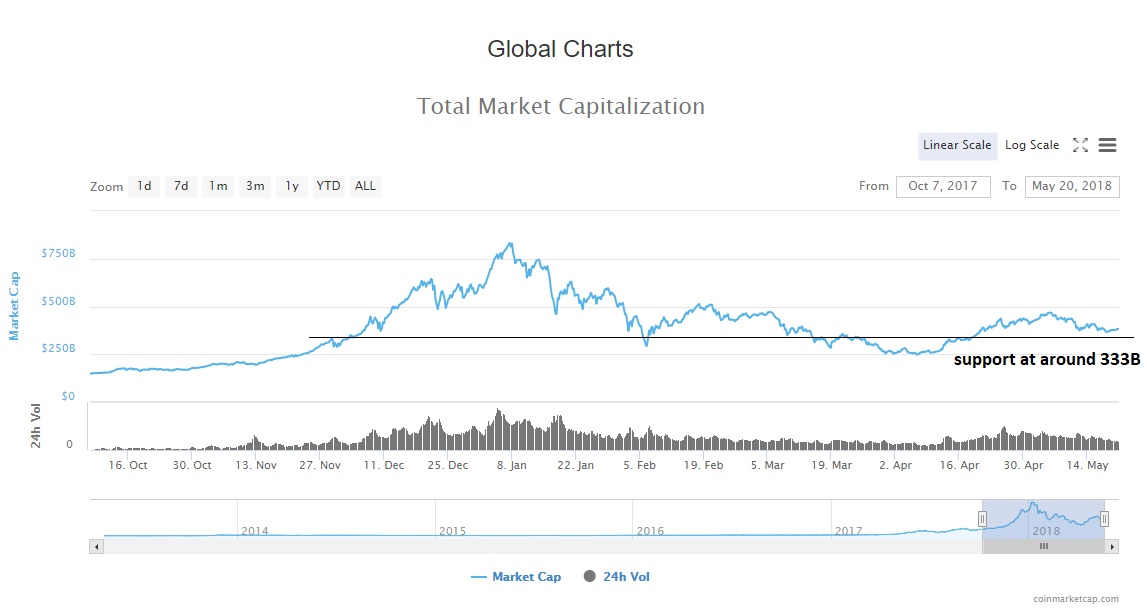
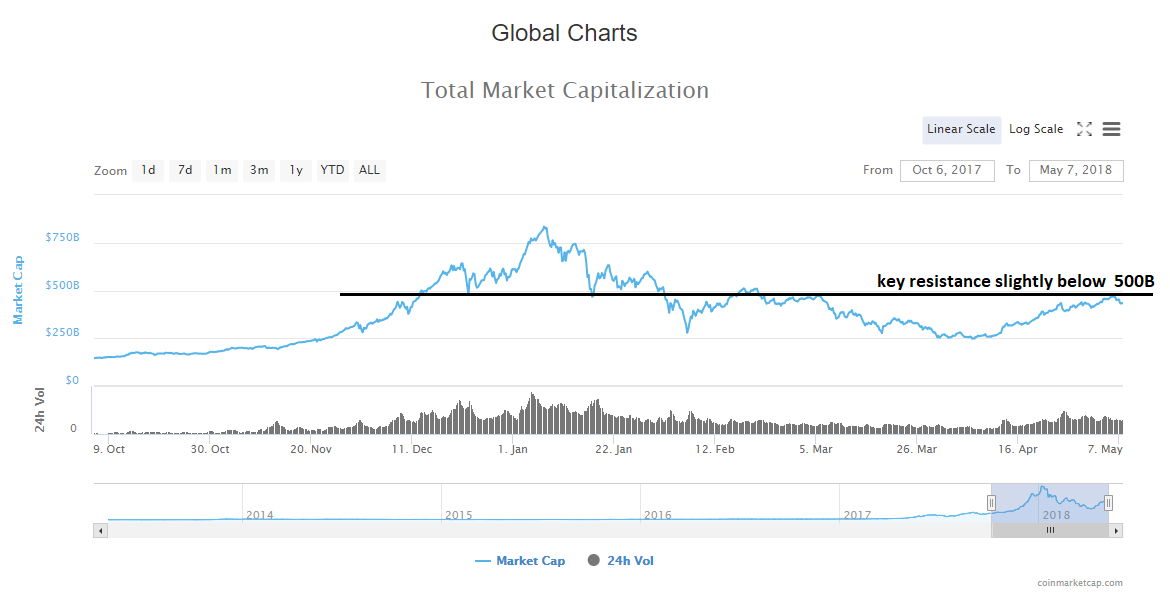
Conclusion
The corrective move is definitely over, but it may be only the first one, and we are seeing a retracement to the upside before more downfall. I am still bearish until I get a confirmation. And the confirmation would be if we see the evaluation of the cryptocurrency market cap above $470B levels, which would be a higher high than on the March 5. on which this downfall to $250B levels started. There is a lot of indecisiveness in the price action and a lot of uncertainty at the moment.