
There are two kinds of price movements in the markets: Impulsive movements and corrective movements. The ideal impulsive action is characterized by a continuous rise or decline from the opening level to the closing one, this being the highest or lowest point of the period. The ideal corrective movement is described by a lateral movement in a short-range and close opening and closing levels.
Most trading candles can be separated into those two moves. When impulsive movement prevails, the candle shows a large body, and only visible traces of the corrective action are perceived as upper and lower wicks. Corrective-motion candles have a short body and relatively long wicks at one or both ends.
A white and large-bodied candle body is indicative of a bullish impulse, whereas a black and large-bodied one shows a bearish or selling impulse. Therefore, when one of these appears at a critical level showing the opposite direction to the prevailing trend, we have to take notice of it.
Long White Candle at a low price level
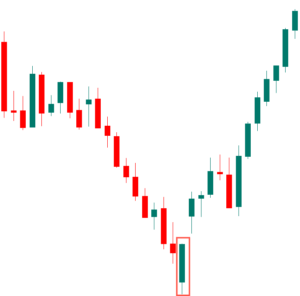
A single candlestick Is mostly not enough for a proper forecast. However, a large candlestick at the end of a severe drawdown is a warning sign that the trend might have ended. If the candlestick shows its low, touching resistance levels, that is a second clue for a reversal, and also serves as a confirmation of the support level. A white candlestick bouncing off a trendline gives credibility to that line.
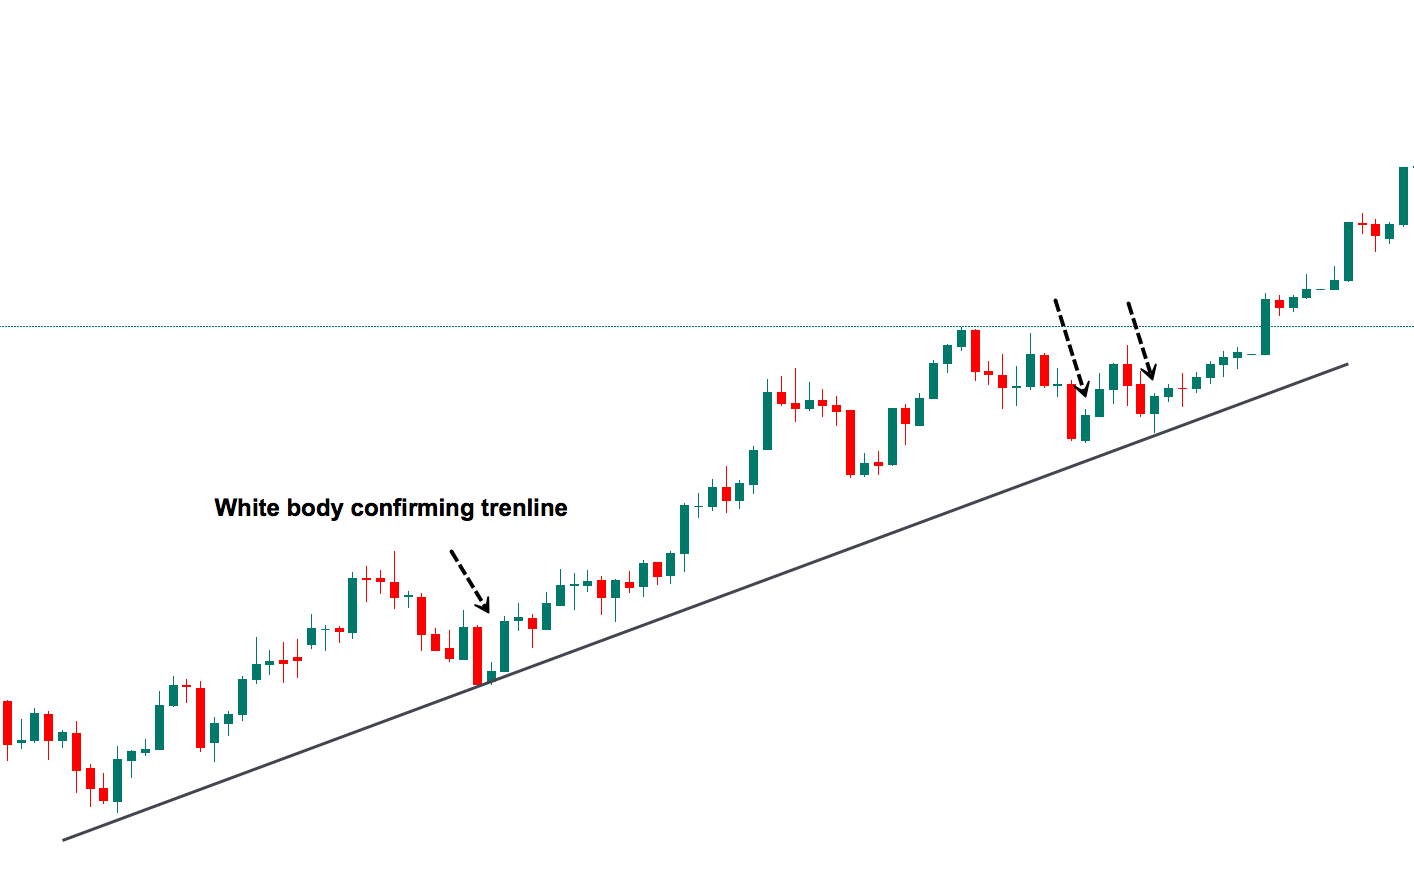
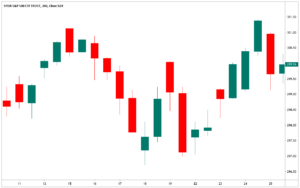
In the above chart, we see the retracement of the price touch the trendline and then bounce with a white candle, that might have served as a good entry point to trade long. Further up, we see that the price still obeys the line in the second retracement, in this case, with a candle with a large lower wick.
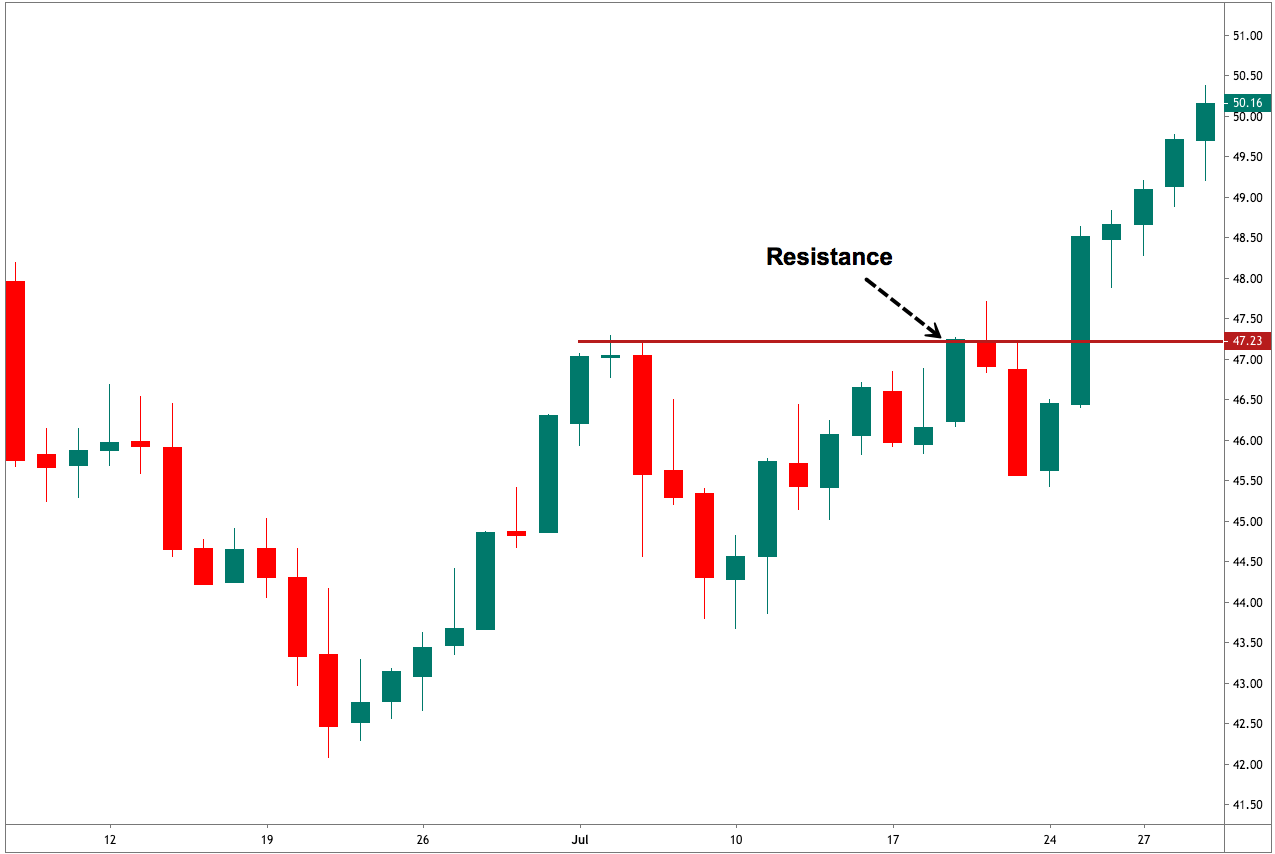
Long White body breaking resistance
A Long white-bodied candle breaking resistance levels are usually a good confirmation of that fact. As we see in the chart below, the price crossed the resistance level decisively and never looked back. This is the kind of confirmation for a bullish continuation traders need.
Long White Body as Support
A long white body sometimes is retraced to test the bulls. But, on the occasions, the price retraces all the previous candle’s advance, its body bottom acts as a support level to hold the price and maintain the trend alive. It is more common that a Fibonacci level of the candle’s retracement would stop the pullback. According to Mr. Nison, the middle of the candle body is a usual support zone.
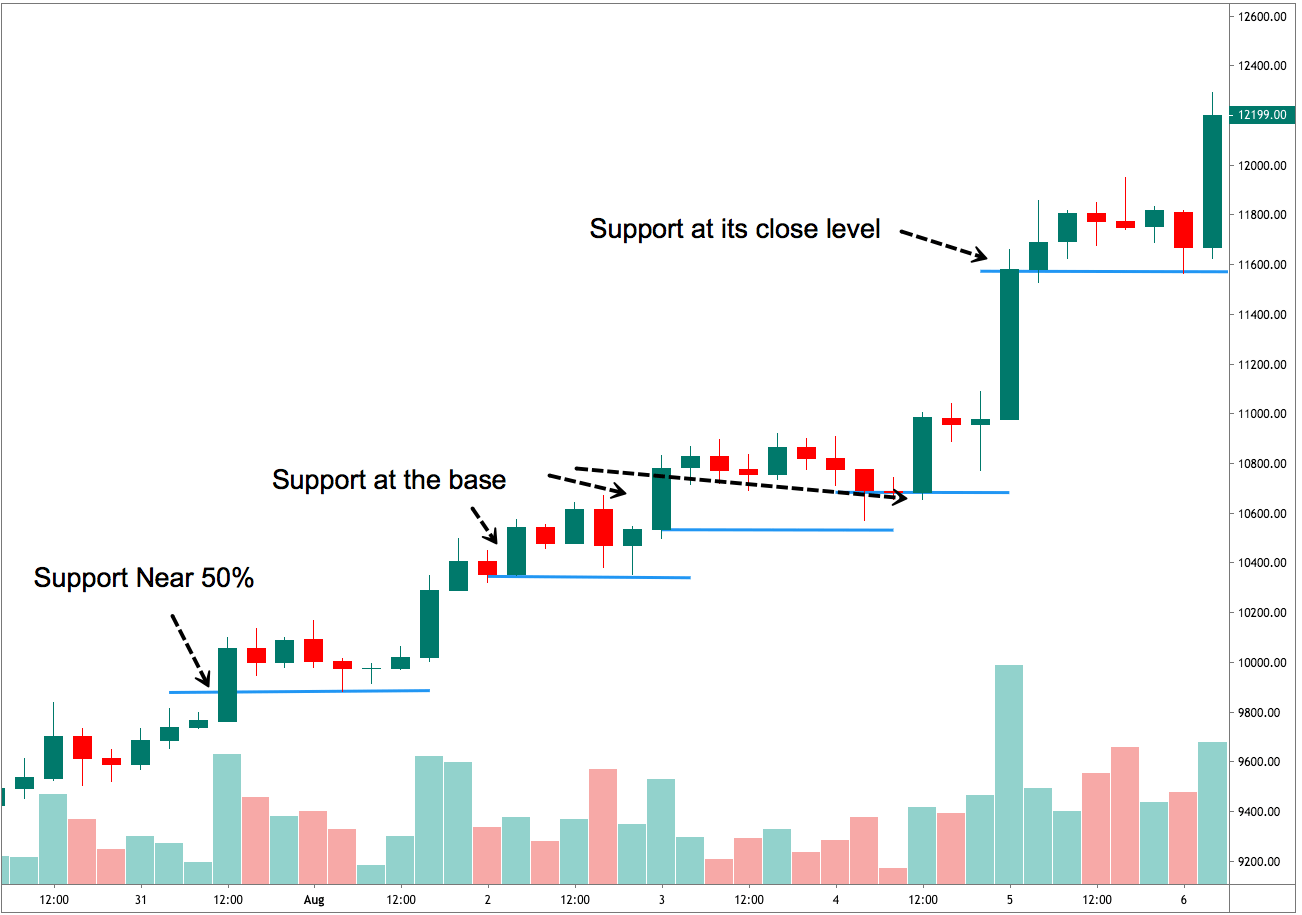
Once the underlying trend is established, a suitable method to enter the trend is to buy at 50% retracement, with a stop-loss below the white body. That way, the risk of entry is halved while profiting from mild retracements.
Takeaway
A single white-bodied candlestick can depict great information value to a savvy trader. This impulsive candle warns about potential trend changes, confirms breakouts when breaking resistance levels, and acts as support during retracement periods, thus, also showing potential levels to jump in and profit from the newly discovered trend.


2 replies on “Candlestick Trading Patterns IV – Long White Bodies”
I love this, keep it up
Thanks. I’ll continue with the series during Christmas.