
In this weekly BTC /USD analysis, we will be looking at the most recent events, the current technical formations, as well as discussing possible outcomes.
Overview
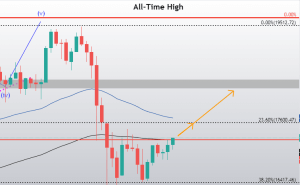
Bitcoin has spent another week pushing towards the upside. This time, it has passed the resistance zone at ~13,200 and pushed further towards the 2019 yearly high of $13,900. Breaking this level signifies a crucial move towards reaching all-time highs as the zone between $13,900 and the $20,000 level has close to no volume, meaning that it is “air-filled.” The moves in this zone will include a lot of volatility due to people taking profits as well as FOMO-ing in.
Technical factors
Bitcoin has conquered the ~13,200 zone after a week of trading above it and a couple of retests. However, a new high is in sight, the 2019 yearly high of $13,900.
Bitcoin is booming with bullish indicators, with its downside being guarded by the 21-period moving average, as well as hash ribbons making a crossover into miner capitulation (a huge bullish signal).
Hash Ribbons are great for detecting market bottoms or preparations for another spike, and it is one of the indicators that has provided traders with the most stable and predictable returns (and with low drawdowns).
However, the technicals factors will have no effect on the strength of the move once it happens, and Bitcoin’s short-term direction will remain unclear until it confidently breaks or pulls back from the $13,900 level.
Likely Outcomes
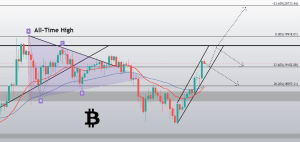
Bitcoin has two main scenarios it can play out, which will depend on how the “fight” for $13,900 ends.
1: If it confirms its position above the level, we can expect the unexpected, as there is close to no sell pressure above. However, many will start taking profits so unexpected downswings might happen. With that being said, the most likely target after breaking $13,900 is $13,640, which is one of the small consolidation points which happened during the 2017/2018 spike.
2: The other scenario is just as likely, and involves Bitcoin rejecting $13,900, thus creating a double top and a short-term pullback. This pullback might end at the $13,200 zone, which historically has a lot of buy and sell pressure, or even further down towards $12,470.
We also have to note that, whichever of these scenarios play out, Bitcoin’s overall sentiment is extremely bullish and that investors that do not like trading should just stick with what they are comfortable with.
One reply on “BTC/USD Chart Overview + Possible Outcomes”
all seems to point to some sort of retracement