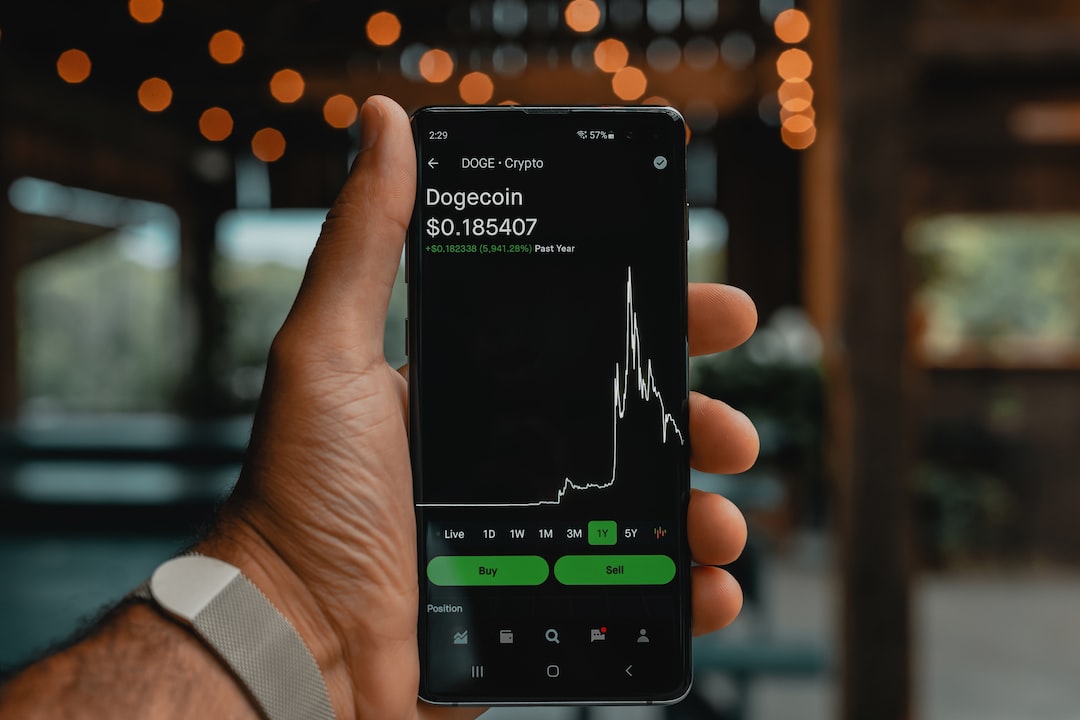
The forex market is the largest and most liquid financial market in the world, with a daily turnover of over $5 trillion. However, trading in the forex market can be challenging and risky, especially for beginners. One of the most important aspects of forex trading is knowing when to buy and sell currencies. In this article, we will discuss the best indicators for when to buy and sell forex.
1. Moving averages
Moving averages are one of the most popular indicators used by forex traders. They are calculated by averaging the prices of a currency pair over a specified period. Moving averages are used to identify the trend of a currency pair. Traders use two types of moving averages: simple moving averages (SMA) and exponential moving averages (EMA).
When the price of a currency pair is above the moving average, it is considered a bullish trend, and traders should consider buying the currency pair. Conversely, when the price is below the moving average, it is a bearish trend, and traders should consider selling the currency pair.
2. Relative Strength Index (RSI)
The Relative Strength Index (RSI) is a momentum oscillator that measures the strength of a currency pair’s price action. It is one of the most popular indicators among forex traders. The RSI ranges from 0 to 100, with overbought levels at 70 and oversold levels at 30.
When the RSI is above 70, it indicates that the currency pair is overbought, and traders should consider selling the currency pair. When the RSI is below 30, it indicates that the currency pair is oversold, and traders should consider buying the currency pair.
3. Bollinger Bands
Bollinger Bands are a volatility indicator that shows a currency pair’s price range over a specified period. They consist of three lines: the moving average, the upper band, and the lower band. The upper and lower bands are calculated by adding and subtracting the standard deviation from the moving average.
When the price of a currency pair is near the upper band, it indicates that the currency pair is overbought, and traders should consider selling the currency pair. Conversely, when the price is near the lower band, it indicates that the currency pair is oversold, and traders should consider buying the currency pair.
4. Fibonacci retracements
Fibonacci retracements are a technical analysis tool used to identify potential support and resistance levels. They are based on the Fibonacci sequence, a mathematical sequence that occurs frequently in nature.
Fibonacci retracements are drawn by connecting two points on a currency pair’s price chart, usually the high and low points. The retracement levels are calculated by applying Fibonacci ratios to the distance between the two points.
Traders use Fibonacci retracements to identify potential entry and exit points. When a currency pair retraces to a Fibonacci level, traders should consider buying or selling the currency pair, depending on the direction of the trend.
5. MACD
The Moving Average Convergence Divergence (MACD) is a momentum indicator that shows the relationship between two moving averages. It consists of two lines: the MACD line and the signal line. The MACD line is calculated by subtracting the 26-period exponential moving average from the 12-period exponential moving average.
When the MACD line crosses above the signal line, it indicates a bullish trend, and traders should consider buying the currency pair. Conversely, when the MACD line crosses below the signal line, it indicates a bearish trend, and traders should consider selling the currency pair.
Conclusion
In conclusion, forex trading can be challenging and risky, but using the right indicators can improve your chances of success. The indicators discussed in this article are just a few of the many tools available to forex traders. It is essential to understand the strengths and weaknesses of each indicator and to use them in conjunction with other analysis tools. By doing so, you can increase your chances of making profitable trades in the forex market.


