Categories
Forex Signals

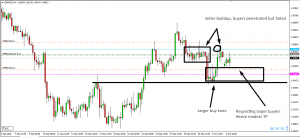
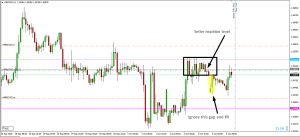
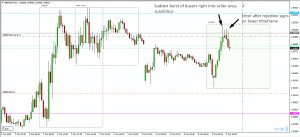
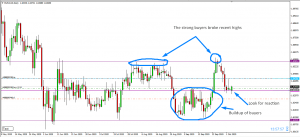
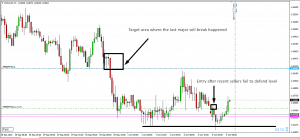
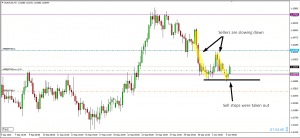
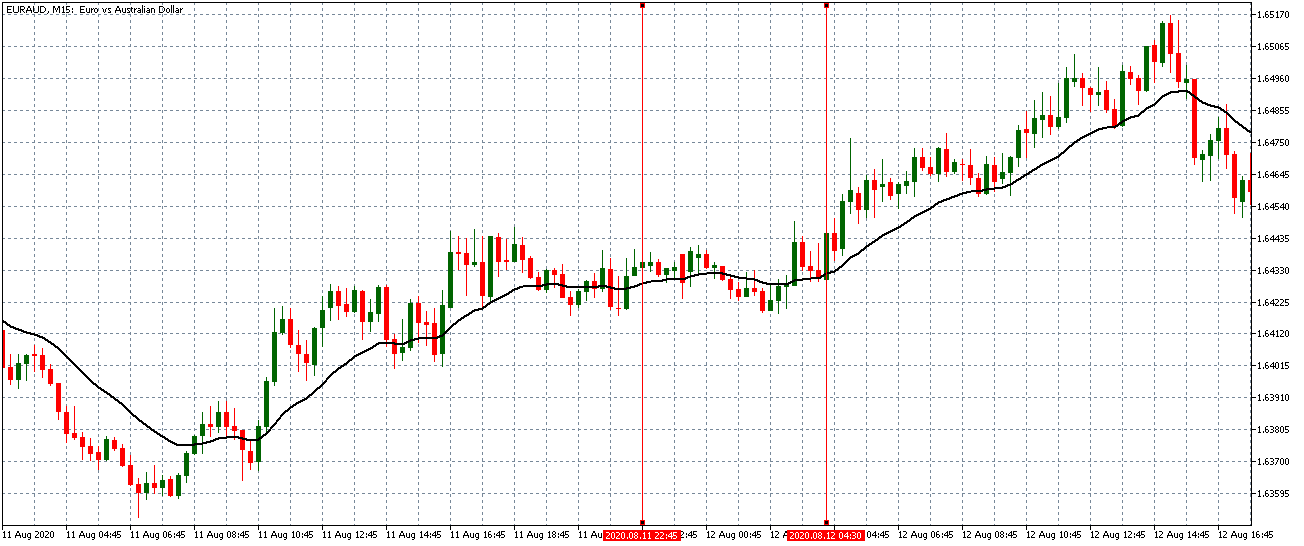
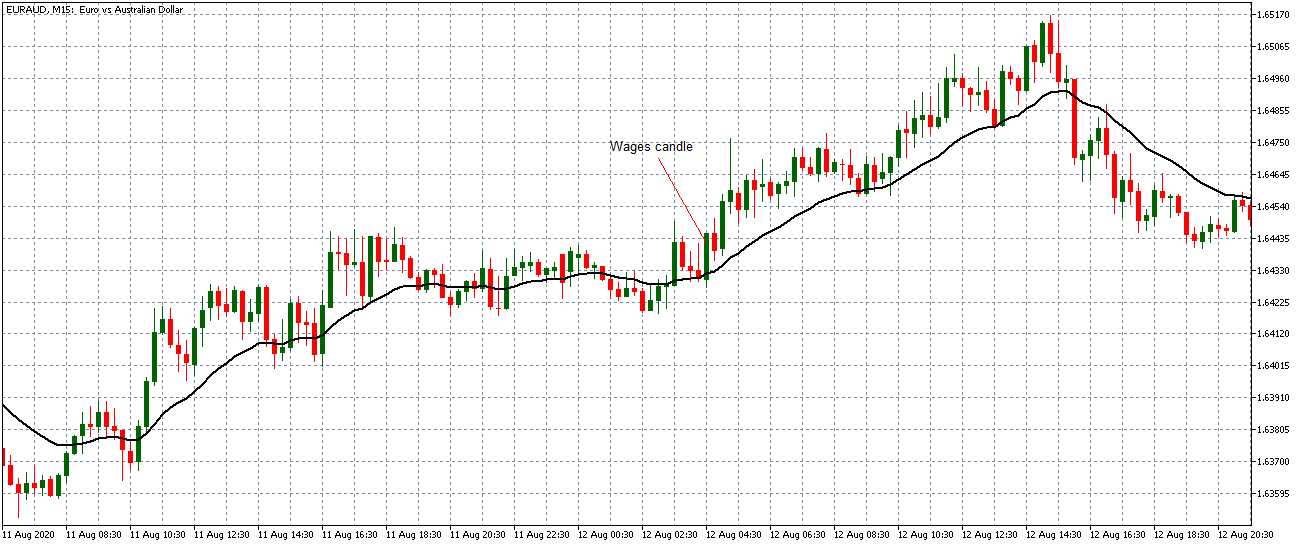
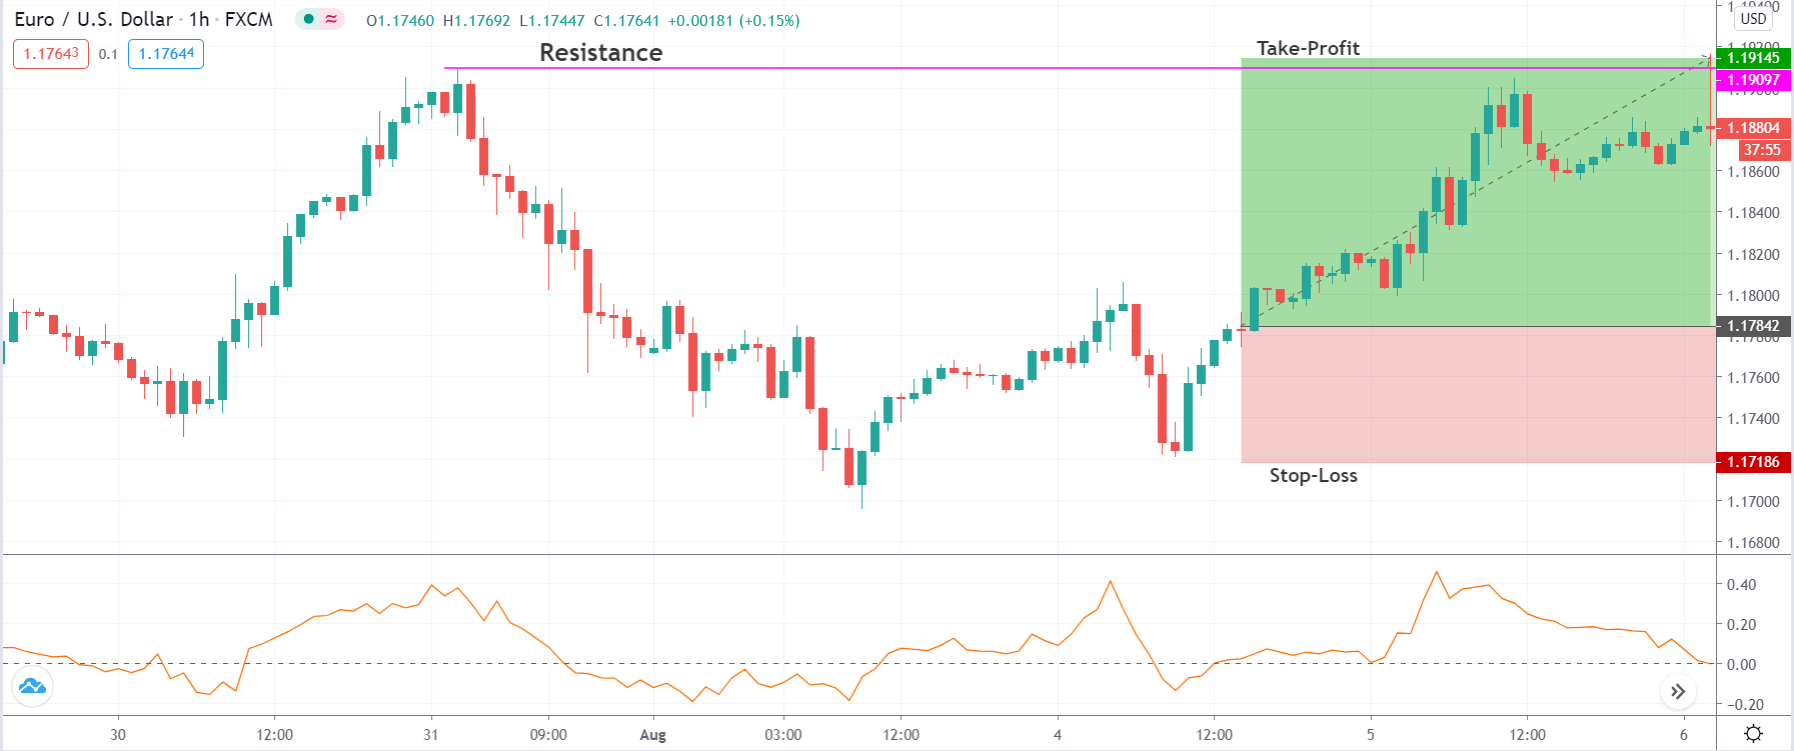
EURAUD Breakout Retest Buy

Flow Assessment

Overall buy flow, sellers are reacting off this area, but buys are holding.

Location Assessment

Price is at a buyers area and is being defended.

Momentum Assessment

This is the 1st test of the buyers area

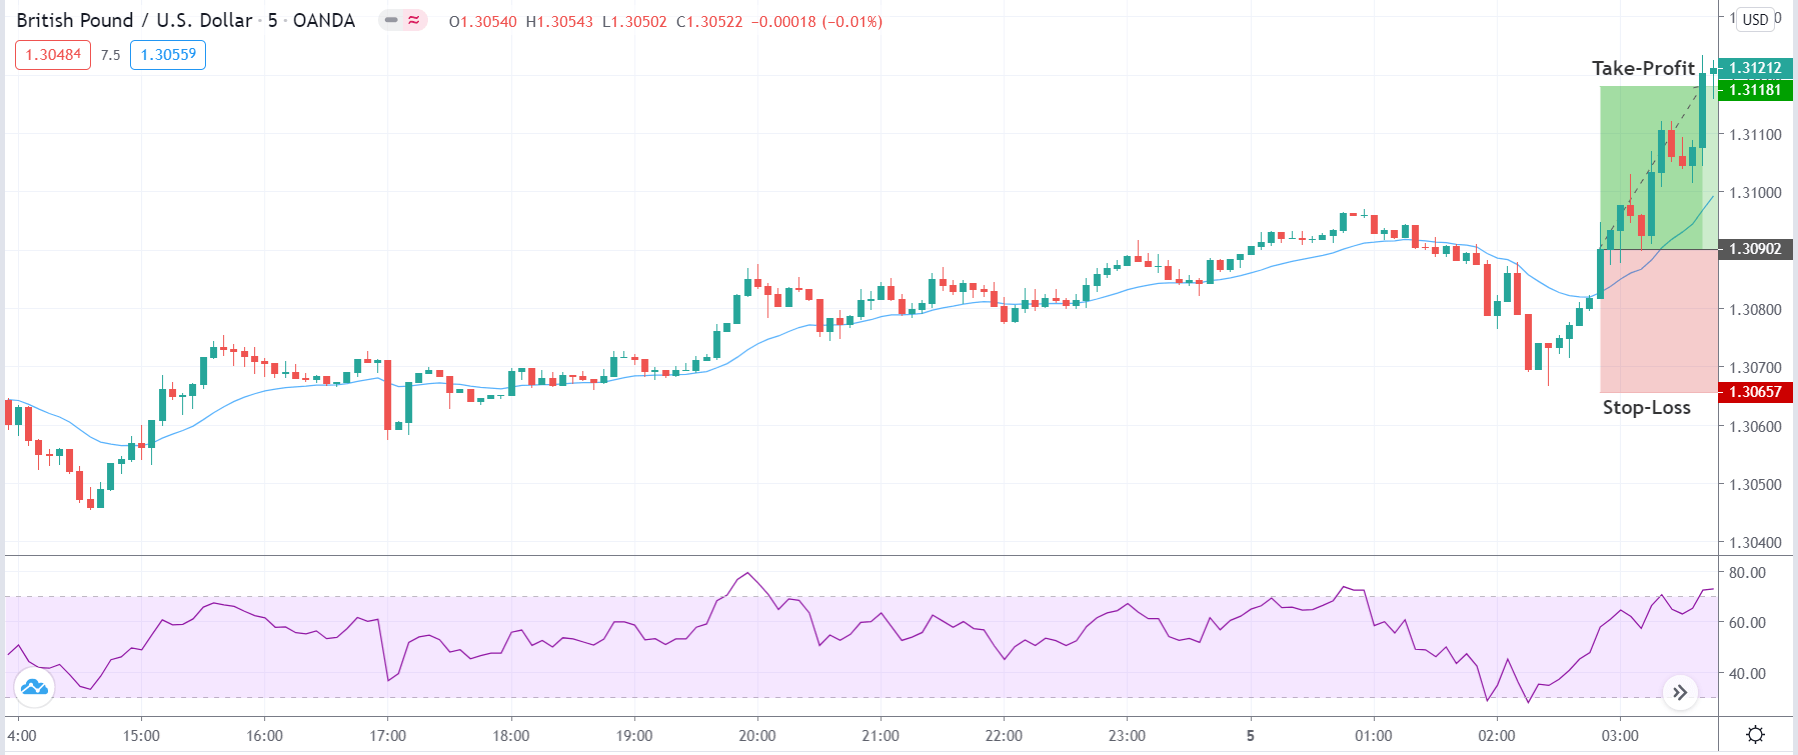
Entry Price – Buy 1.64844

Stop Loss – 1.64286

Take Profit – 1.65860

Risk to Reward – 1:1.82

Profit & Loss Per Standard Lot = -$406/ +$738

Profit & Loss Per Micro Lot = -$40.6/ +$73.8

Fellas, now you can check out forex trading signals via Forex Academy mobile app. Follow the links below.

iPhone Users: https://apps.apple.com/es/app/fasignals/id1521281368

Andriod Users: https://play.google.com/store/apps/details?id=academy.forex.thesignal&hl=en_US


Categories
Forex Basic Strategies

Pairing Significant S&R Levels With RSI Indicator To Generate Accurate Trading Signals

Introduction

In the previous set of articles, we discussed strategies based on trend continuation or trend reversal. Let us change the subject a little bit and discuss a strategy based on ‘Support and Resistance.’ Although we all know how to trade support and resistance, there is always a problem of consistency when it comes to trading using the conventional support and resistance strategy. We have a look into some of these issues by designing a strategy that provides not only decent risk-to-reward (RR) but also a high probability of success.

Markets are continually changing due to changes in market participants, global politics, and economic events. This means if we continue to trade the usual way, we could be in trouble. It is necessary that, along with markets, we, too, change our trading strategy in order to adapt to the changing market environment.

Time Frame

The strategy works well on the 1-hour, 4-hour, and ‘Daily’ time frame. Therefore, the strategy is suitable for the swing to long-term traders.

Indicators

We make use of only one technical indicator in the strategy, and that is the Relative Strength Index (RSI) with its default settings.

Currency Pairs

The strategy is suitable for trading almost all currency pairs listed on the broker’s platform. One thing we need to ensure before choosing a currency pair is that it should be volatile.

Strategy Concept

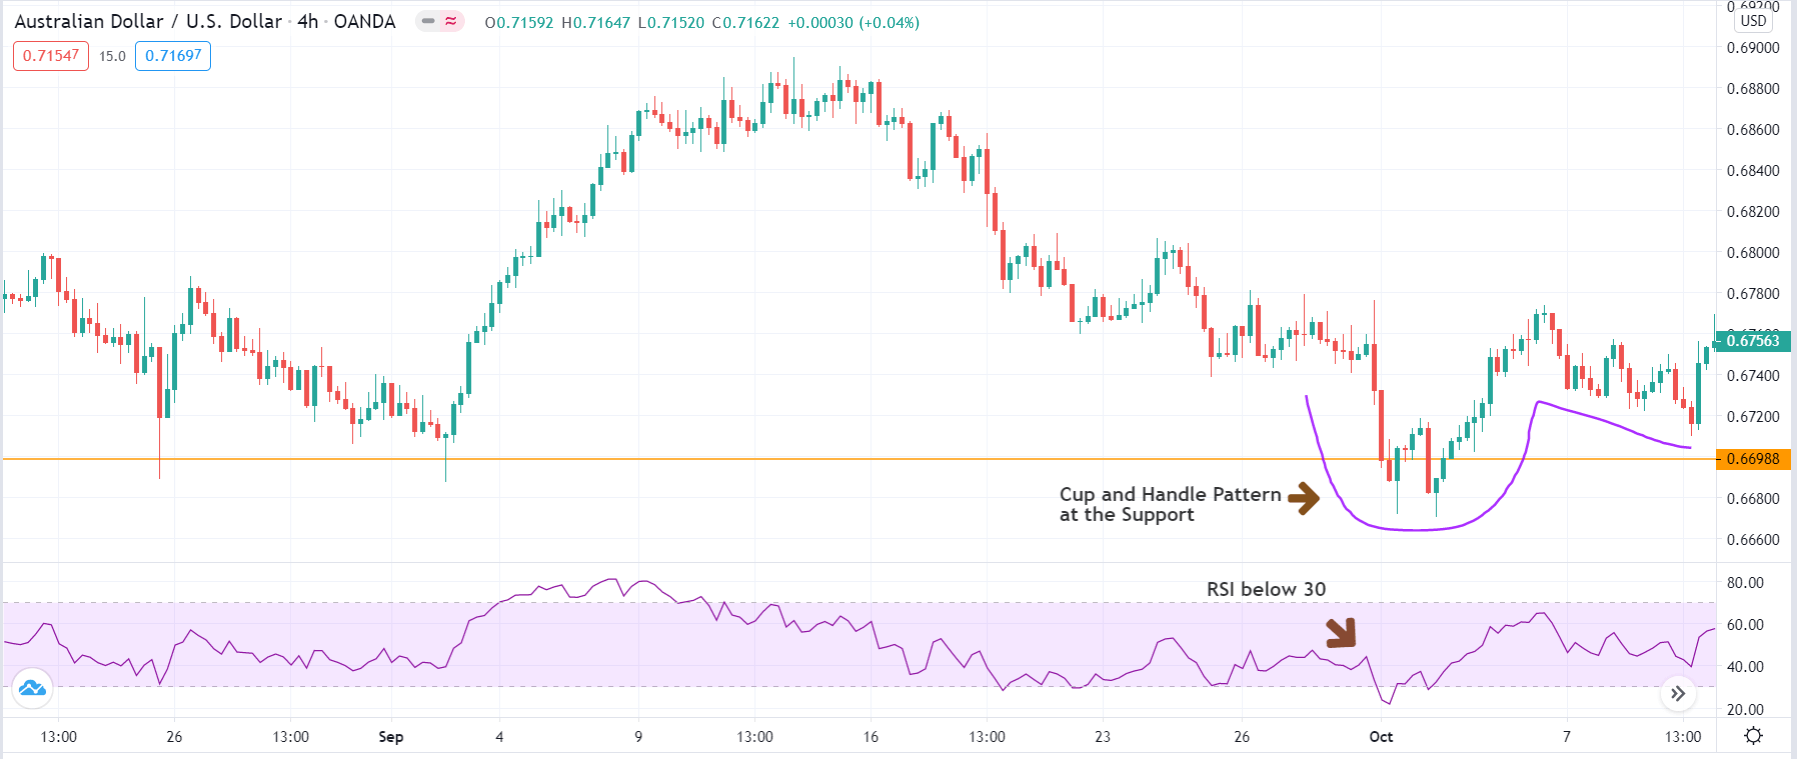
‘Cup and Handle’ is a powerful candlestick pattern that shows the prevalence of bullish strength in the market. It is a very reliable pattern that offers excellent trading opportunities. ‘Cup’ formation indicates that the price was unable to make a proper ‘lower low’ on the higher time frame due to a strong buyer who took the price up. The ‘handle’ indicates that the market was unable to reach the previous ‘low’ due to weak sellers where eventually buyers bought at a higher price and are in the process of making a new ‘higher high.’

The logic behind the formation of the ‘Cup and Handle’ pattern makes it one of the most powerful patterns. But the pattern alone is not the basis for the strategy; we also use the RSI to take the highest probability trades. We apply the concept of ‘Cup and Handle’ pattern and RSI indicator at a long-term ‘Support’ level to execute low-risk ‘long’ trades.

The same concept applies when taking ‘short’ trades at long-term ‘Resistance’ level. Here we should look for the formation of the ‘Inverse Cup and Handle’ pattern at ‘Resistance.’ ‘Cup’ here indicates that the price was unable to make a proper ‘higher high’ on the higher time frame due to strong seller who crashed the price. The ‘handle’ indicates that the market was unable to reach the previous ‘high’ due to weak buyers where eventually sellers sold at a lower price and are in the process of making a new ‘lower low.’ We use the RSI indicator to take the highest probability trades by looking for ‘overbought’ and ‘oversold’ situations in the market.

Trade Setup

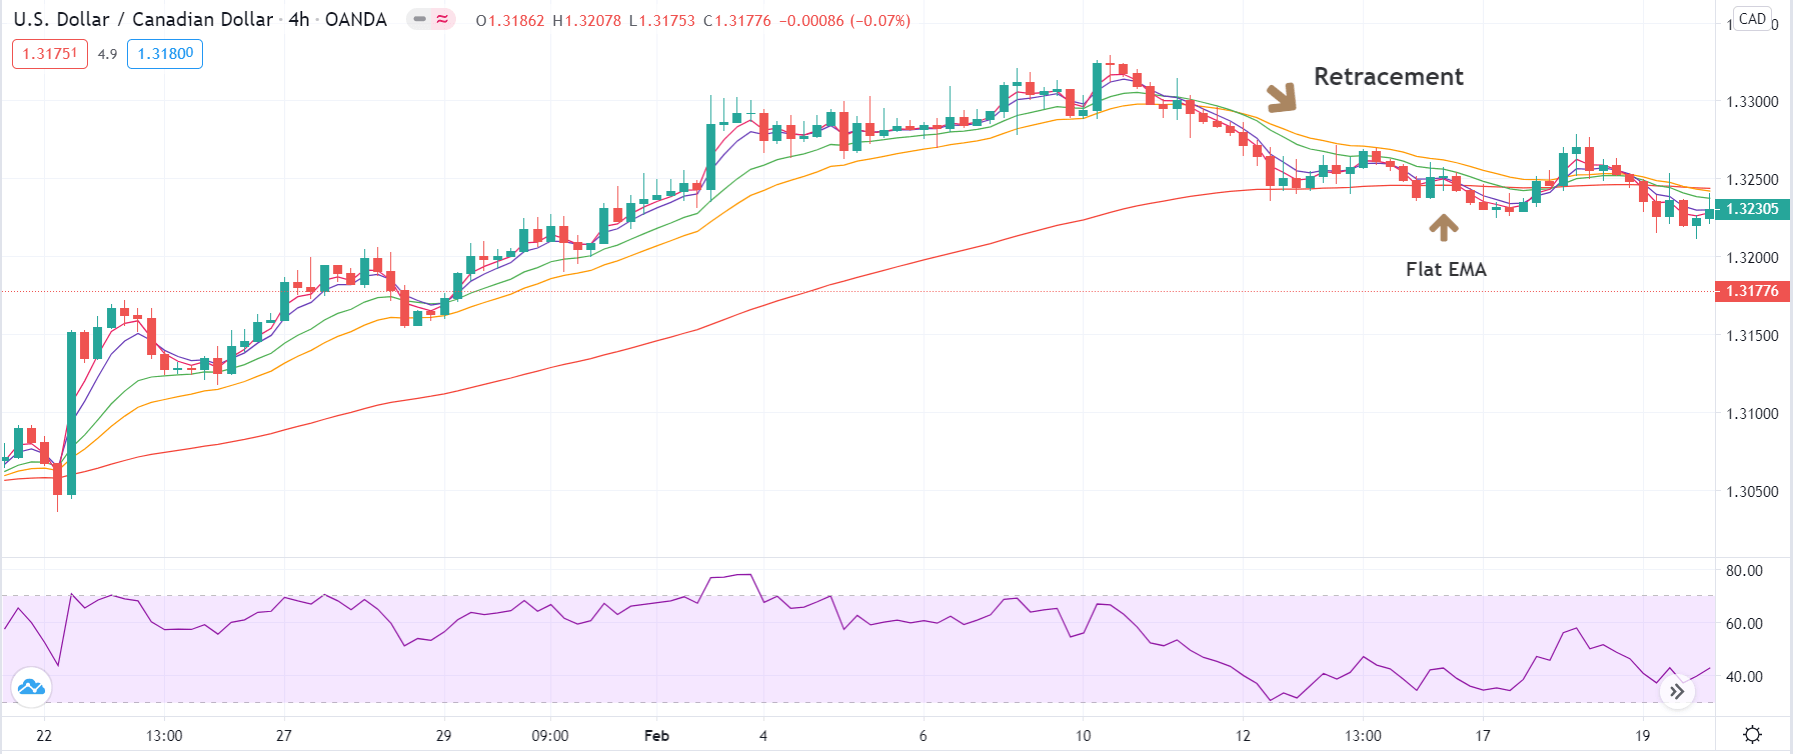
In order to use the strategy, we have considered the 4-hour chart of AUD/USD, where we will be illustrating a ‘long’ trade using the rules of the strategy.

Step 1:
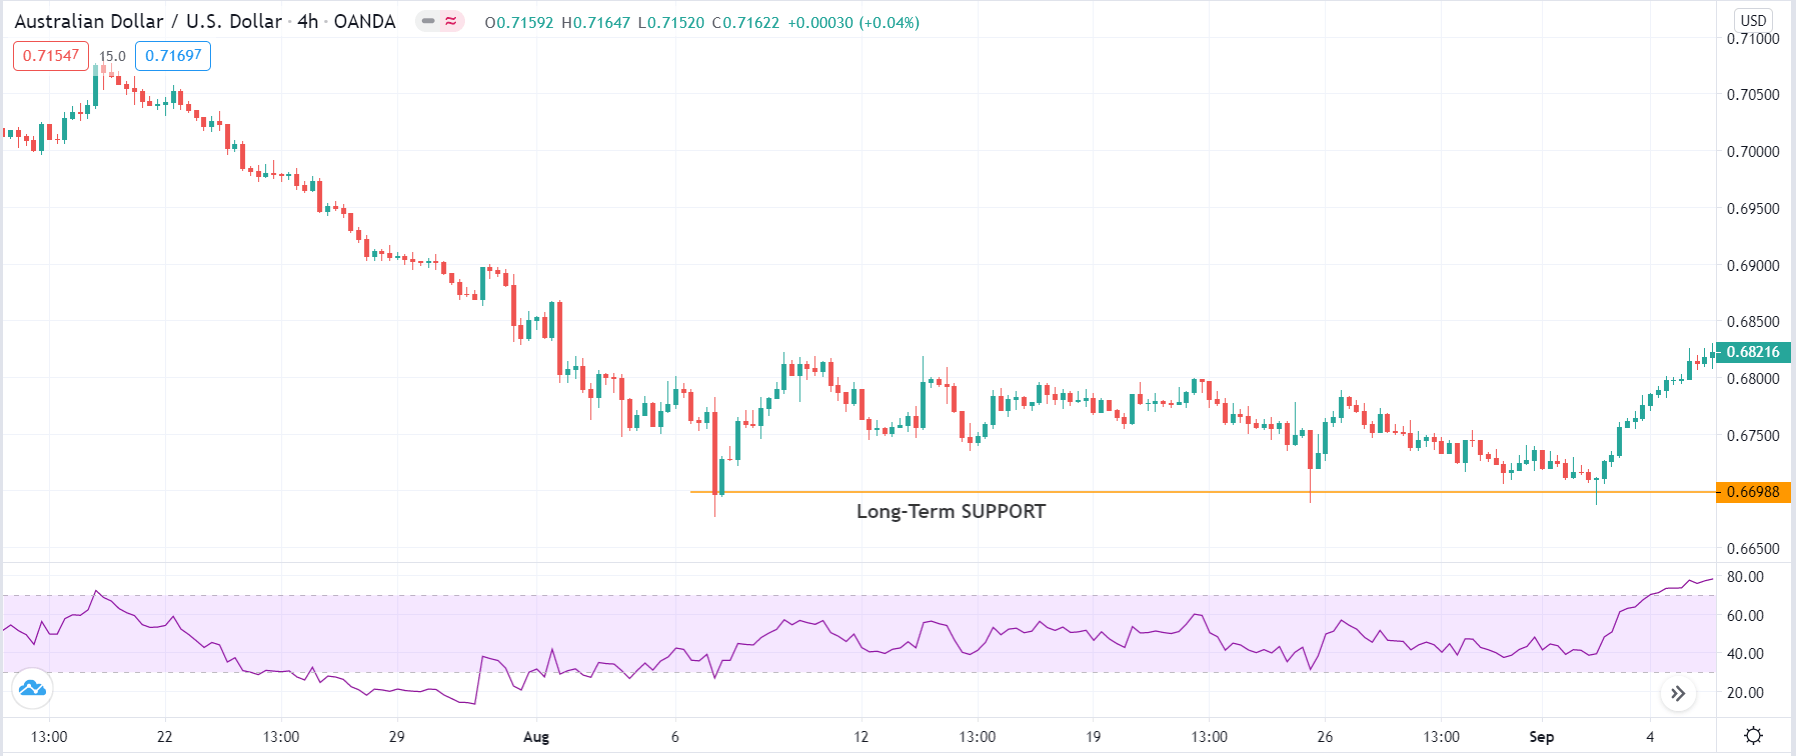
The first step is to identify long-term support and resistance levels. By long-term we mean, support and resistance levels on the 1-hour time frame and above. Note that the greater number of touches, the stronger is the support or resistance. We would recommend at least three touches at the support or resistance to calling it a strong one. To raise the odds in our favour, we can look for trading at support level in an uptrend and resistance in a downtrend.
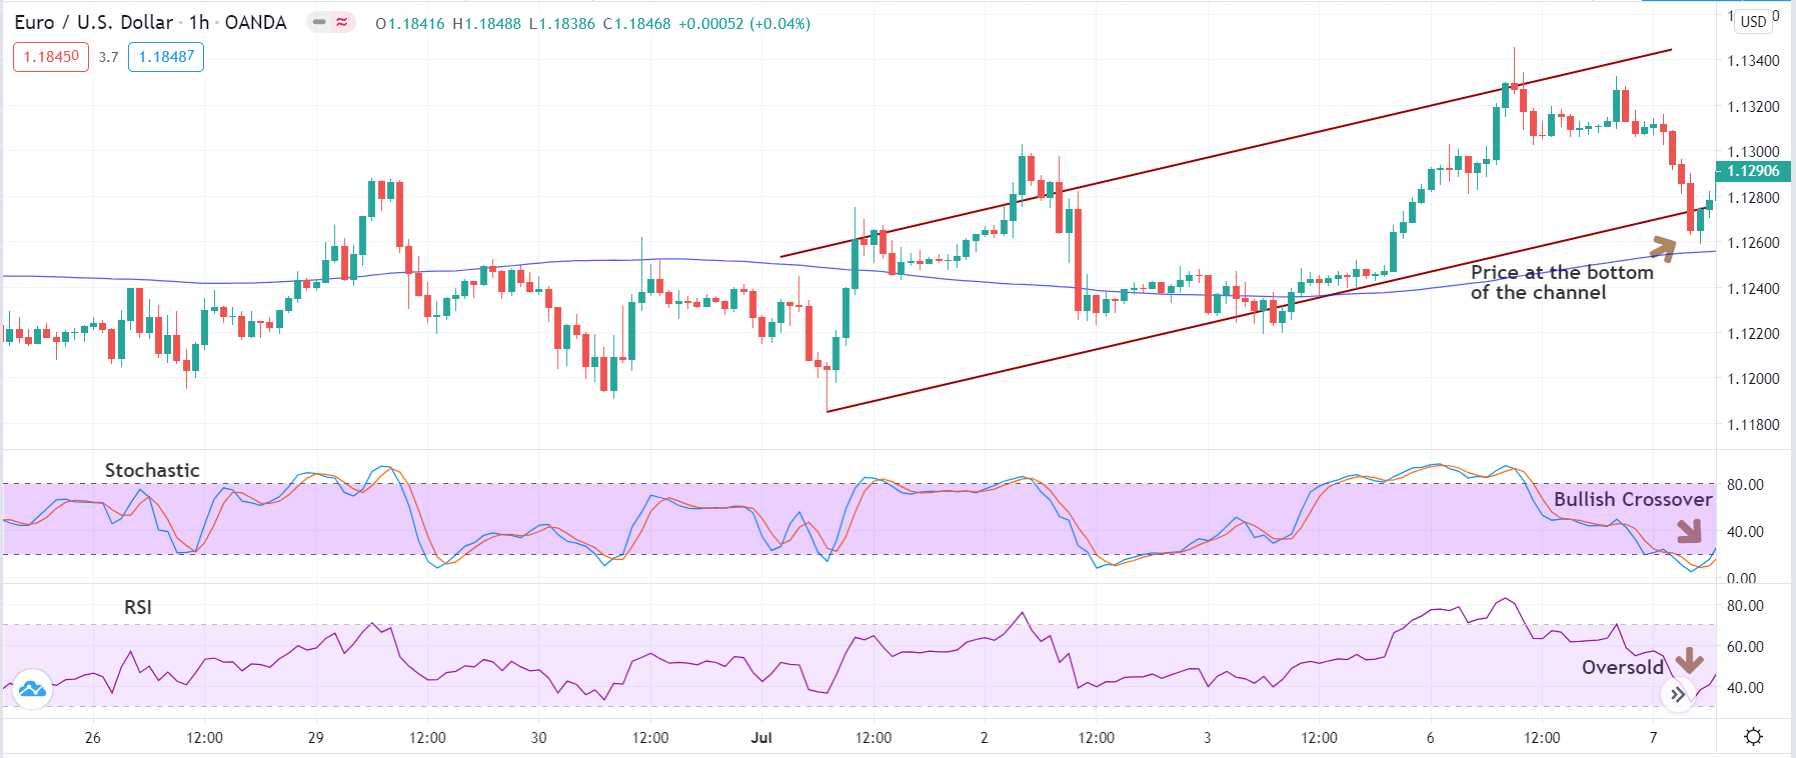
The below image shows long-term support being formed in the AUD/USD pair on the 4-hour chart.

Step 2:
Once we have identified the critical technical level, we will wait for the price to present the ‘cup and Handle’ pattern at support and ‘Inverse Cup and Handle’ pattern at resistance. Here we should make sure that when the price at support, the RSI indicates an oversold (below 30) situation in the market at least once and then shows up the pattern. On the other hand, when the price is at resistance, the RSI should cross above the level of 70, indicating an overbought situation and then show up the ‘Inverse cup and handle’ pattern.

Step 3:
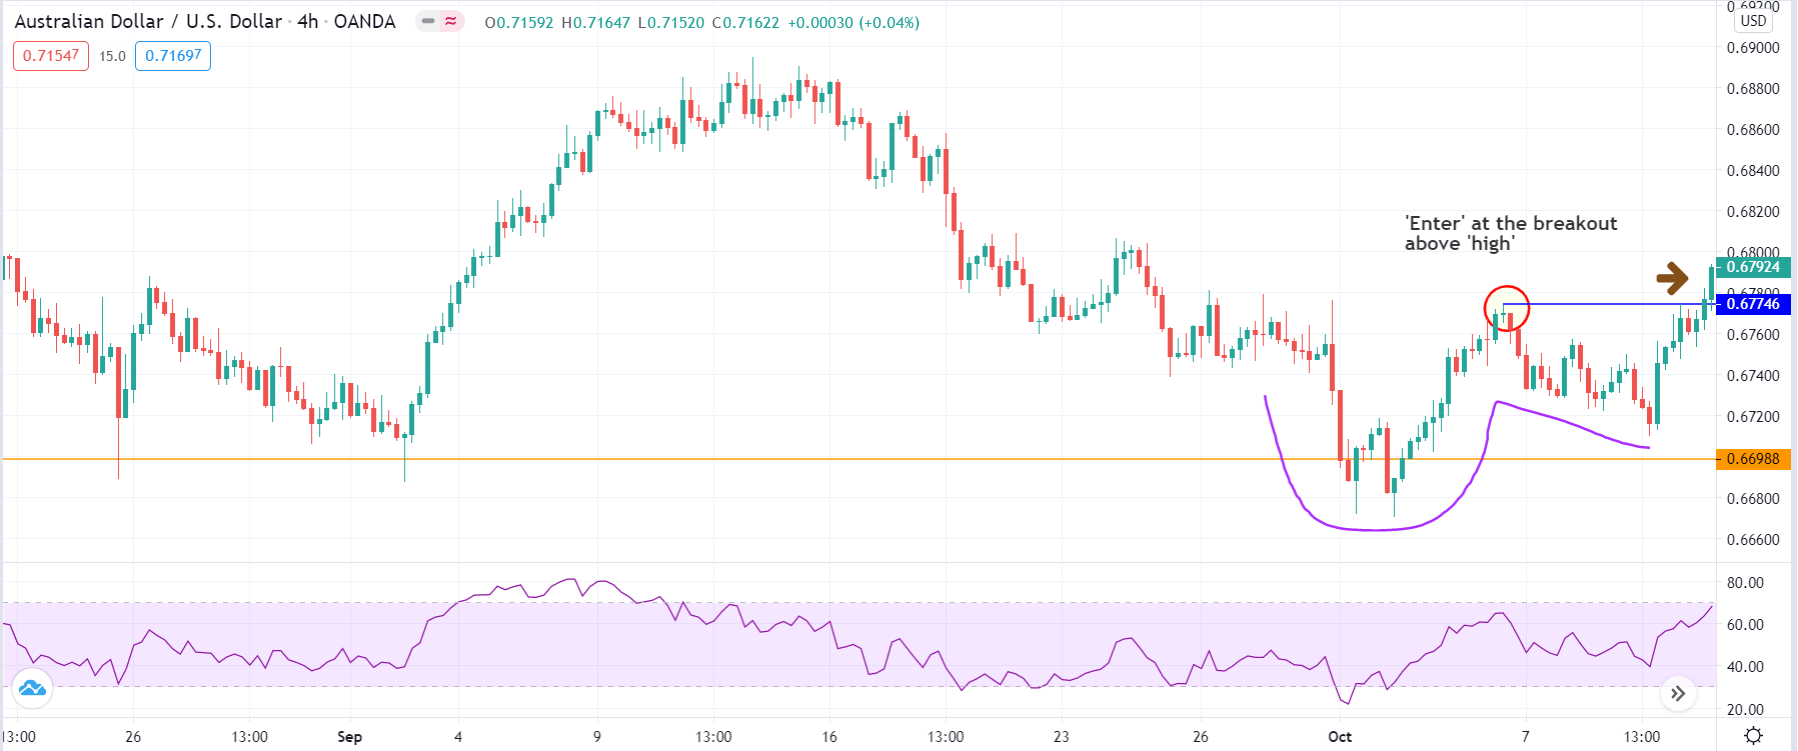
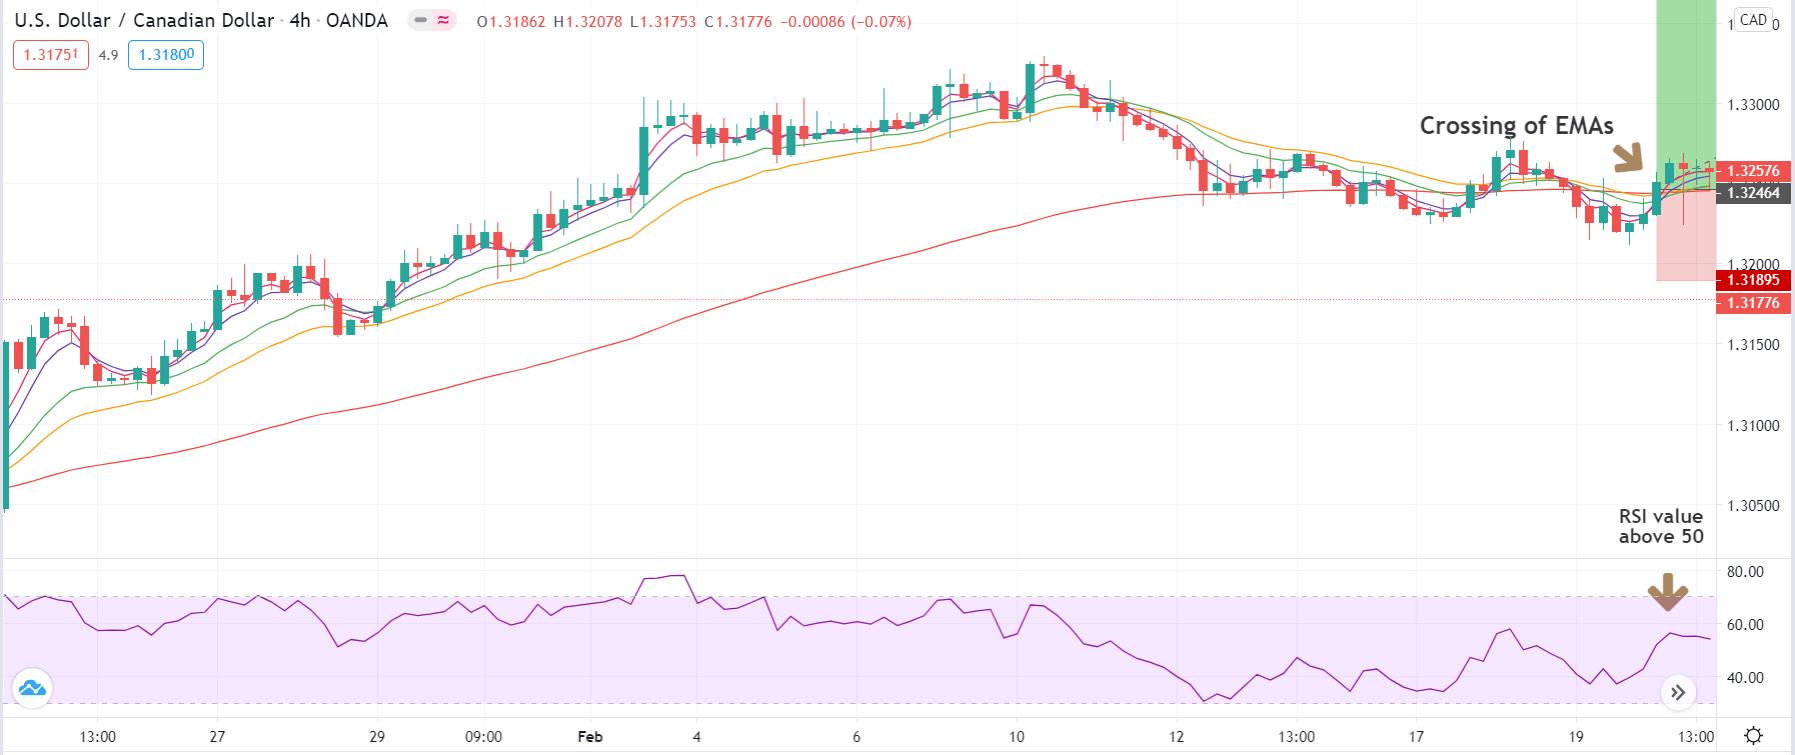
After ensuring that the pattern is formed at the right place along with suitable indications from the RSI, we now discuss how to enter the trade. In a ‘cup and handle’ pattern, we enter ‘long’ right at the price break out above the ‘high’ of ‘cup’ pattern. In an ‘inverse cup and handle’ pattern, we enter ‘short’ when ‘price’ breaks below the ‘low’ of the ‘cup’ pattern.
The below image shows an example of we enter for a ‘buy’ at ‘support.’

Step 4:
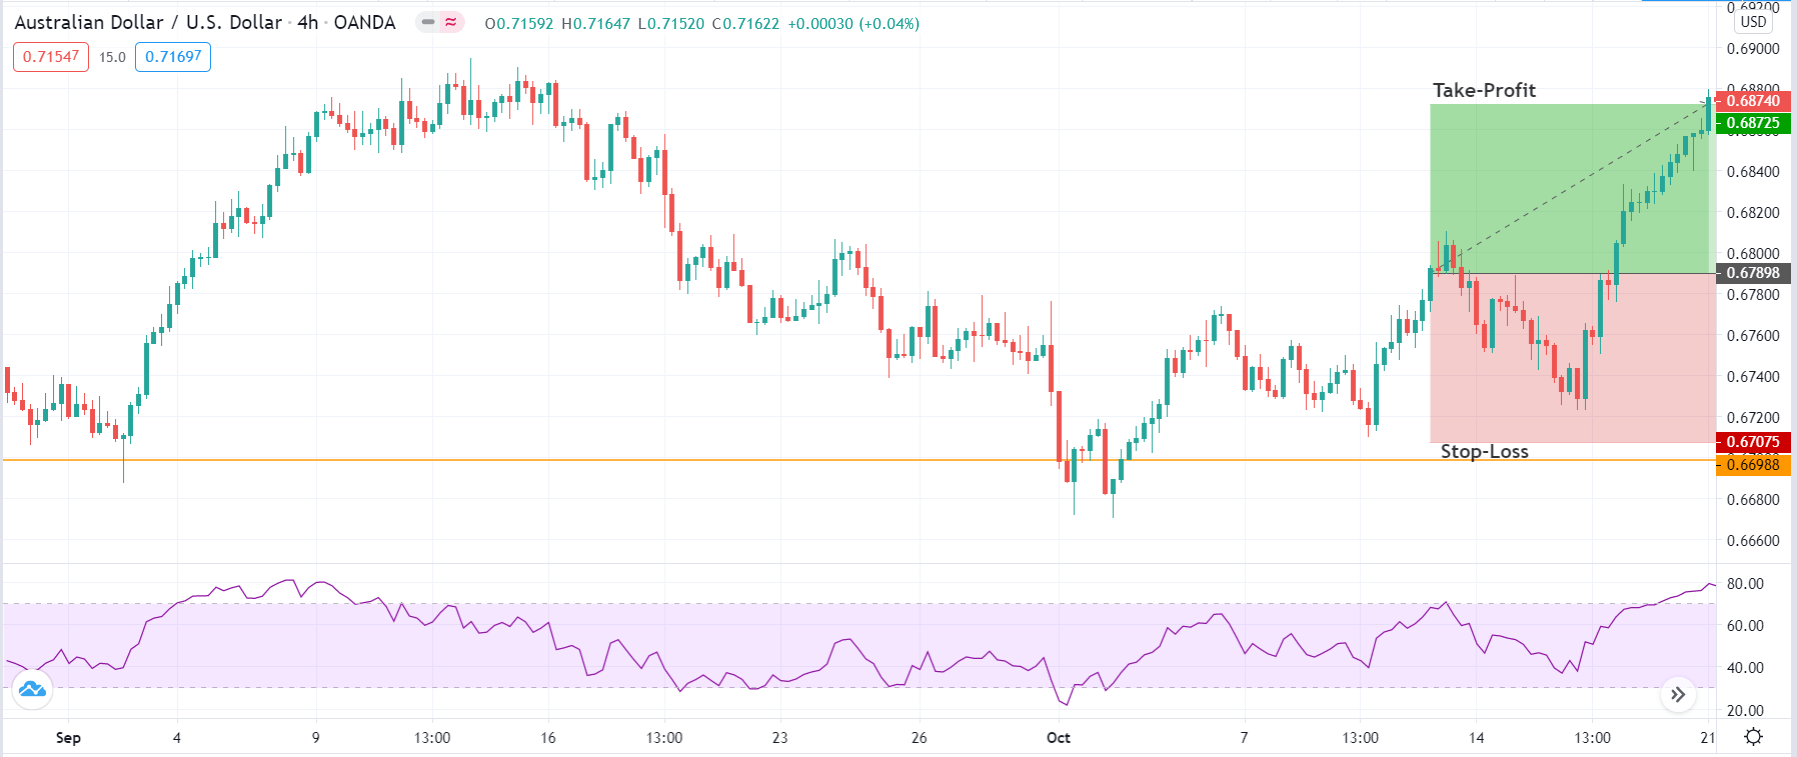
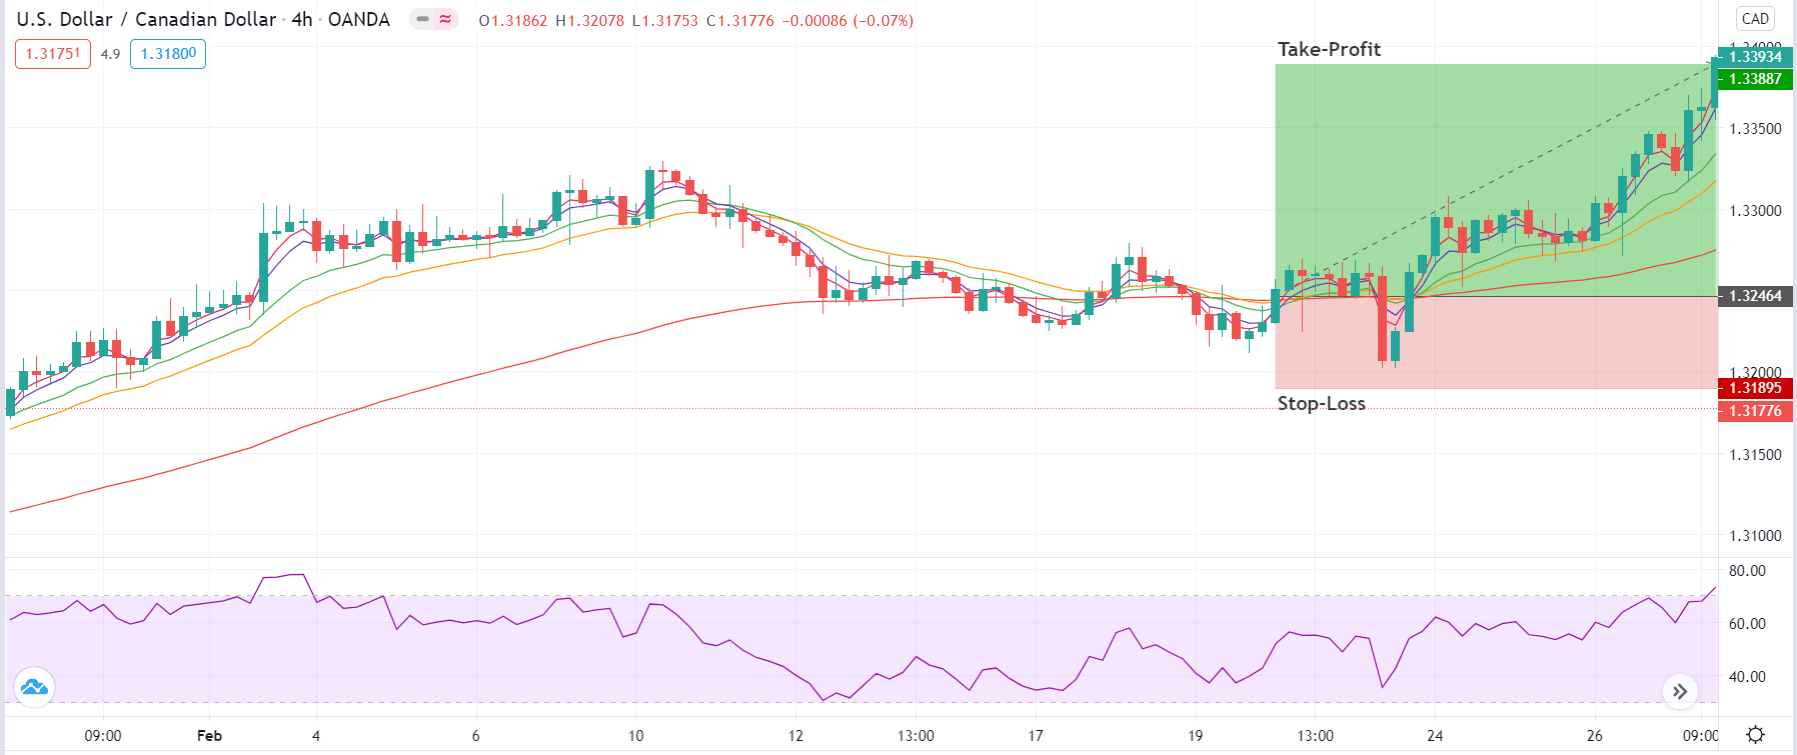
After entering, it is essential to determine the stop-loss and take-profit levels for the trade. One of the primary reasons behind low risk-to-reward (RR) ratio is late ‘entry.’ Stop-loss is placed below the ‘low’ of the ‘handle’ pattern in a ‘long’ position and above the ‘high’ of the ‘handle’ pattern in a ‘short’ position. The strategy essentially says to enter when prices have travelled a decent amount of distance from support or resistance, which considerably reduces the risk-to-reward (RR) ratio.
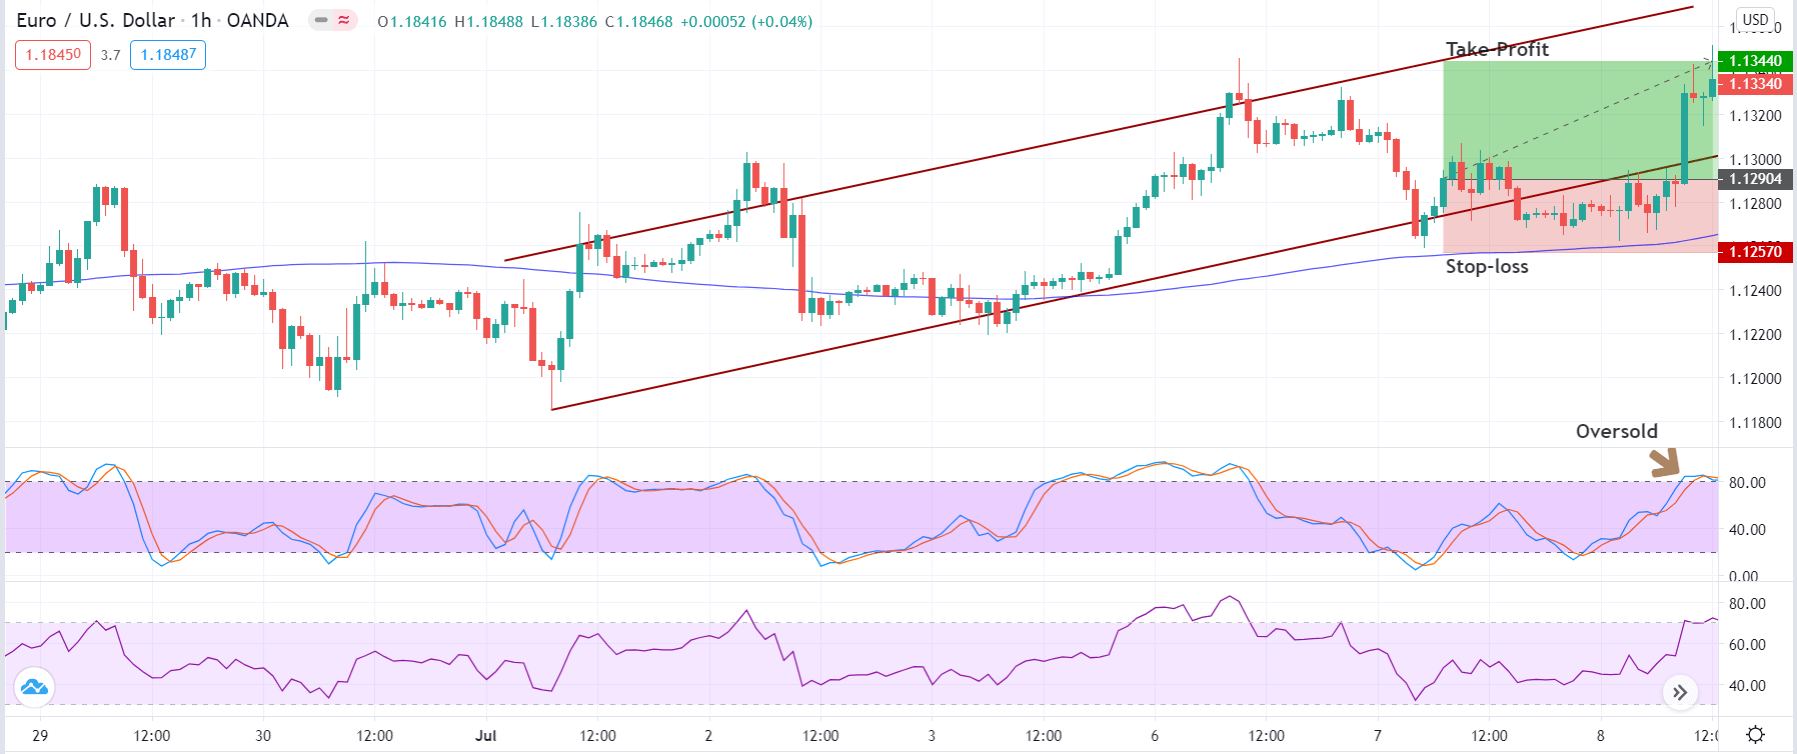
The below image shows the result of the trade executed using the above strategy where the resultant risk-to-reward (RR) of the trade is 1:1.

Strategy Roundup

Although the ‘Cup and Handle’ pattern is a bullish continuation pattern, if we understand the logic of the pattern and apply at key technical levels, it can provide excellent opportunities for short as well as long-term traders. Using the RSI indicator along with the pattern gives an extra edge to the strategy, which makes it highly suitable in changing market environment.

Categories
Forex Signals

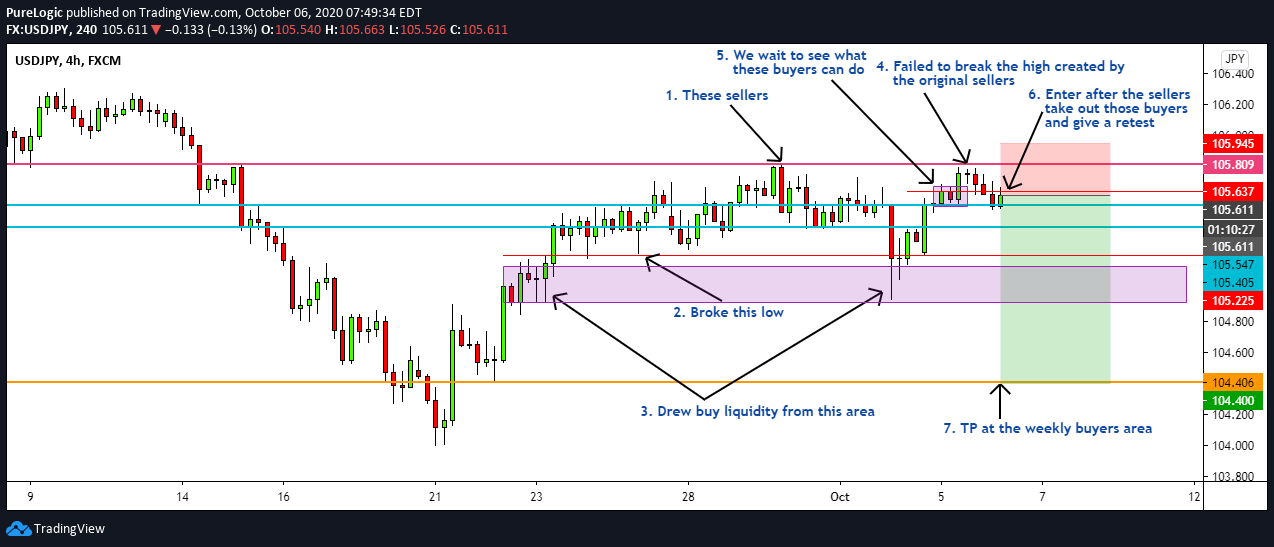
USDJPY Swing Failure Sell

Flow Assessment

Buyers slowing down at a key sell area on H4.

Location Assessment

Price is close to H4 sellers area and buyers are not breaking through.

Momentum Assessment

Buyers are showing signs of failure on the 2nd try to make a higher high.

Entry Price – Sell 105.611

Stop Loss – 105.945

Take Profit – 104.400

Risk to Reward – 1:3.63

Profit & Loss Per Standard Lot = -$315.7/ +$1145

Profit & Loss Per Micro Lot = -$31.57/ +$114.50

Fellas, now you can check out forex trading signals via Forex Academy mobile app. Follow the links below.

iPhone Users: https://apps.apple.com/es/app/fasignals/id1521281368

Andriod Users: https://play.google.com/store/apps/details?id=academy.forex.thesignal&hl=en_US

Categories
Forex Market Analysis

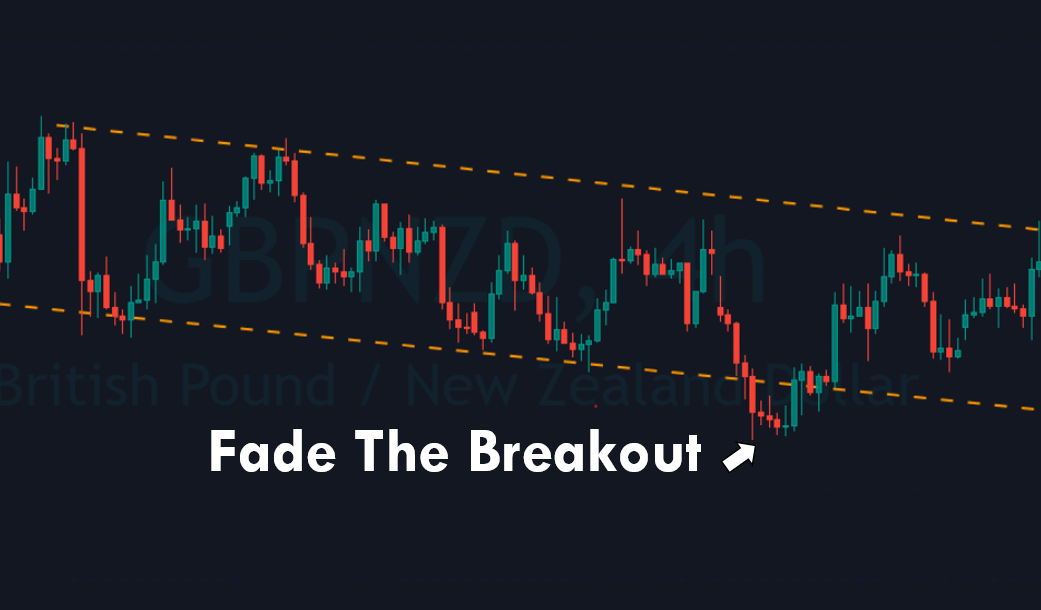
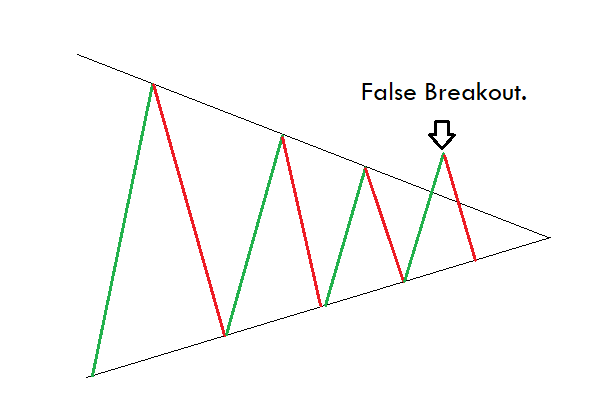
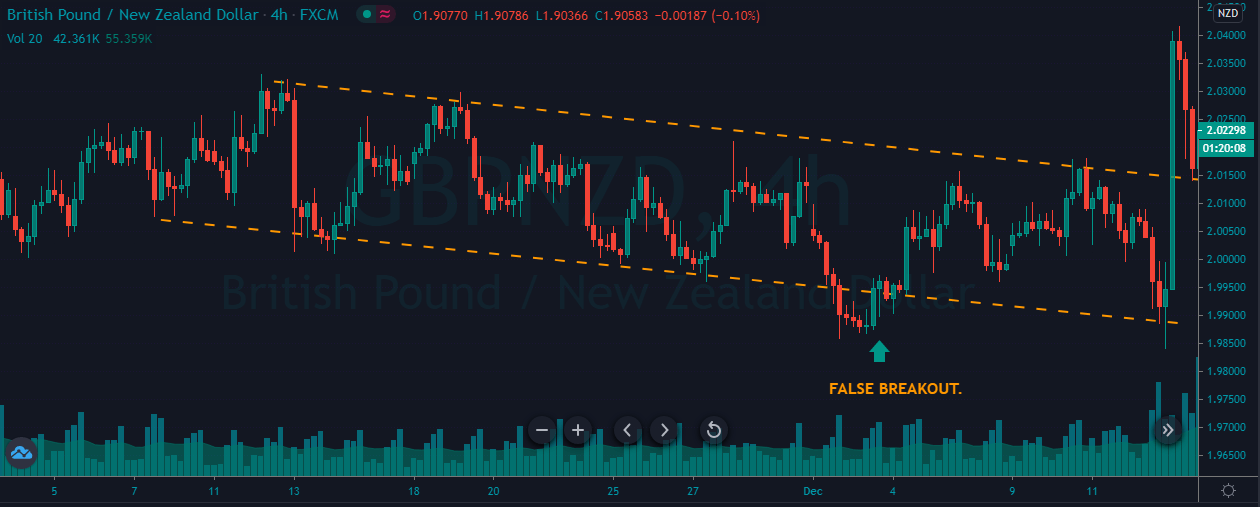
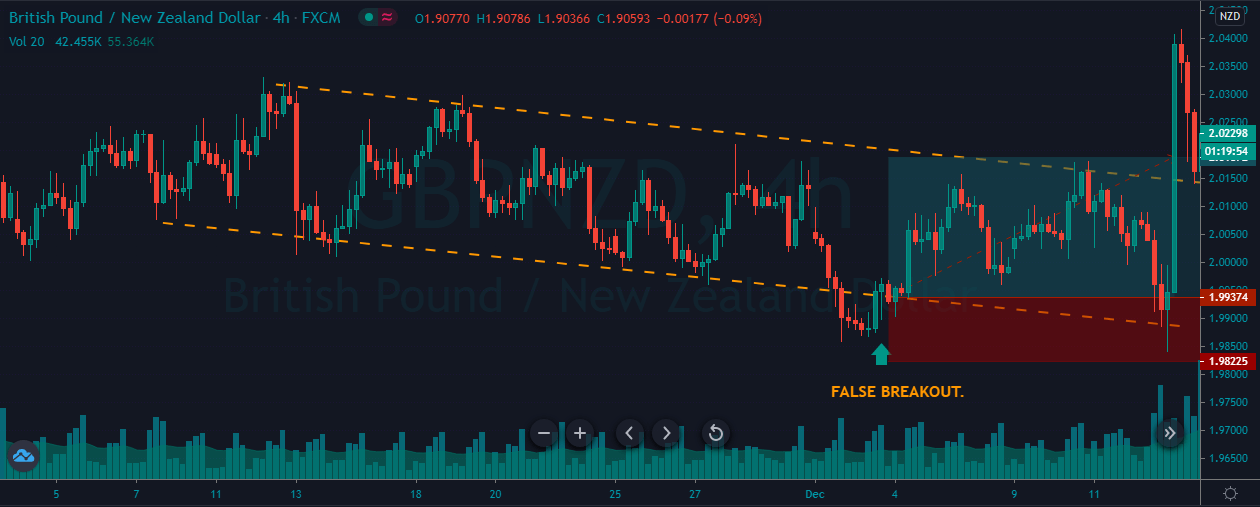
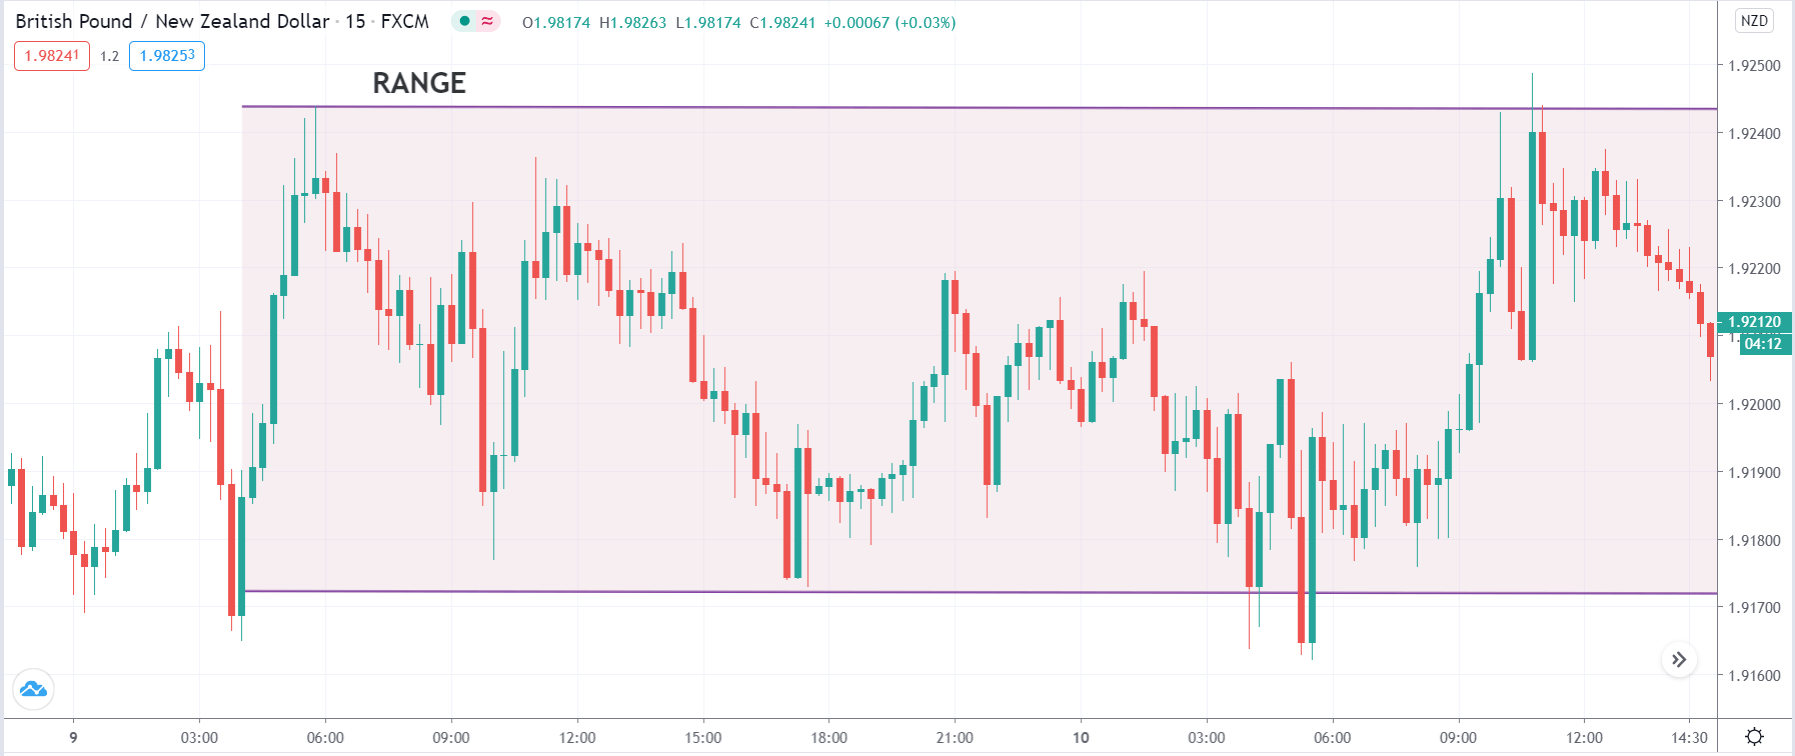
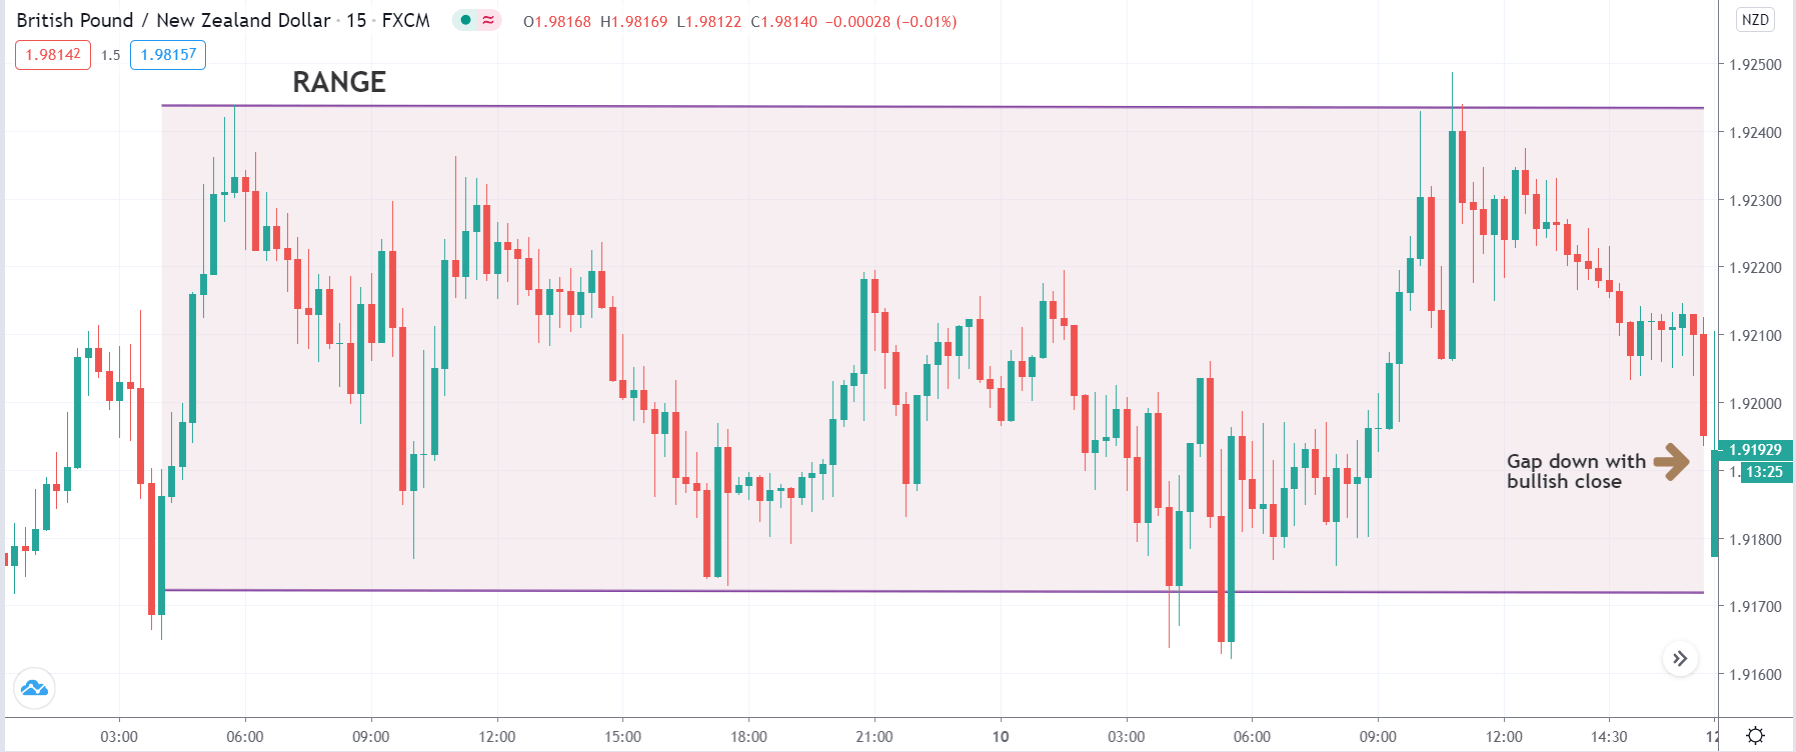
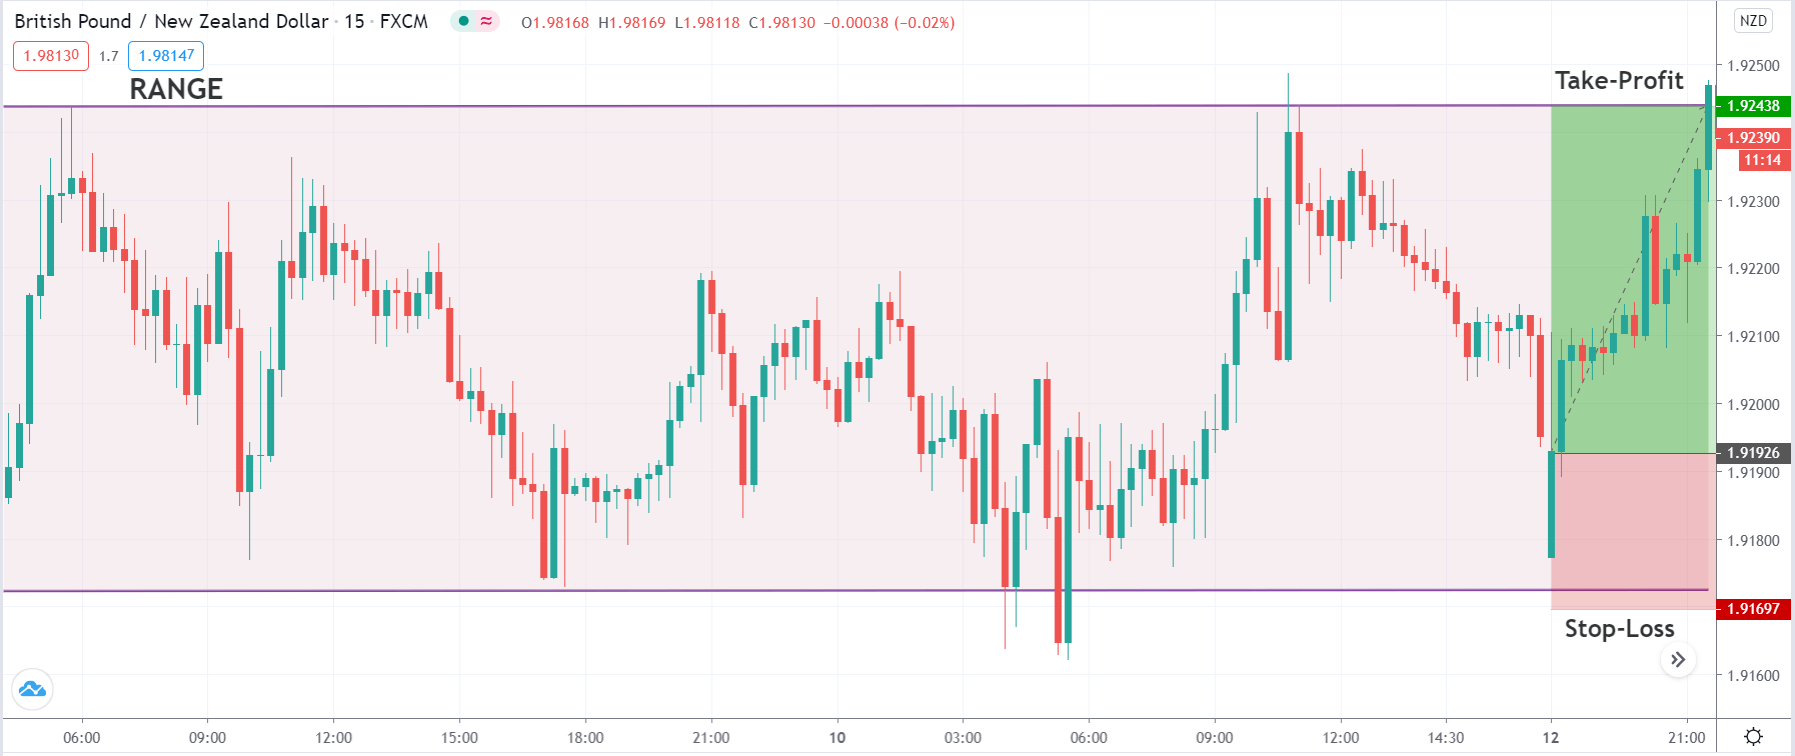
GBPNZD Breakout Retest Sell

Categories
Forex Signals

GBPUSD Swing Reversal Sell

Flow Assessment

  • Buyers have been coming up slowly towards the H4 sellers area.
  • Higher highs are being made incrementally, not in a breakout fashion, suggesting a profit-taking move instead of a large order flow

Location Assessment

  • Price is at a key H4 sellers area
  • The recent buyers have been tested and are not able to make higher highs

Momentum Assessment

  • Price has penetrated above the H4 sellers area and taken out some breakout buyer’s buy stops, and the sellers have reacted strongly, suggesting clear defense of that area. This gives us the entry trigger.

Entry Price – Sell 1.2985

Stop Loss – 1.3015

Take Profit – 1.2953

Risk to Reward – 1:07

Profit & Loss Per Standard Lot = -$200/ +$212

Profit & Loss Per Micro Lot = -$20.0/ +$21.2

Fellas, now you can check out forex trading signals via Forex Academy mobile app. Follow the links below.

iPhone Users: https://apps.apple.com/es/app/fasignals/id1521281368

Andriod Users: https://play.google.com/store/apps/details?id=academy.forex.thesignal&hl=en_US

Categories
Forex Signals

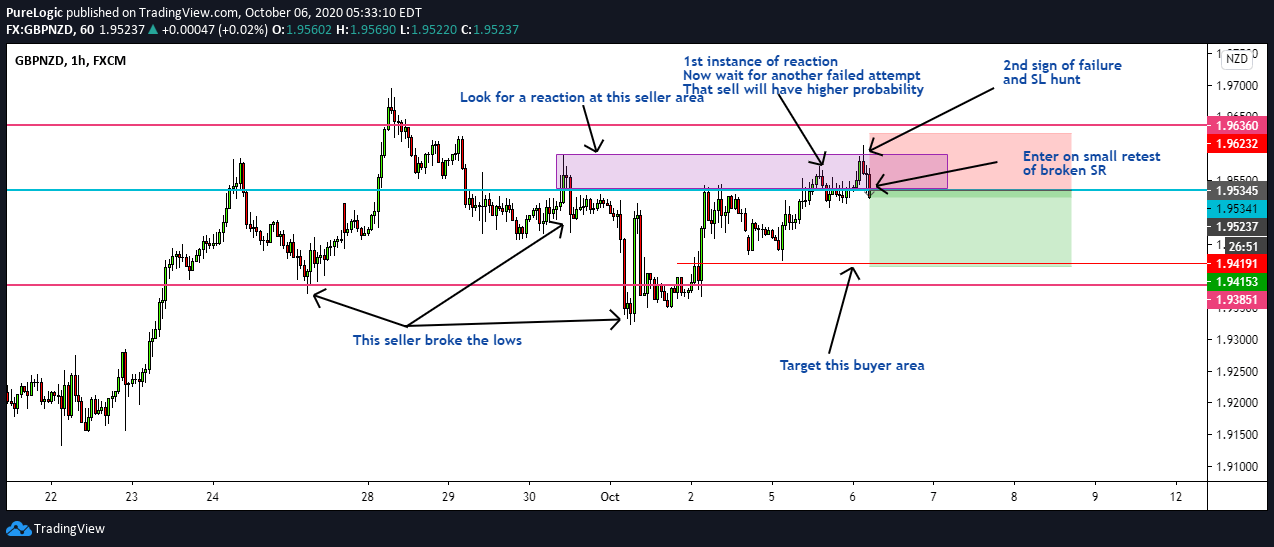
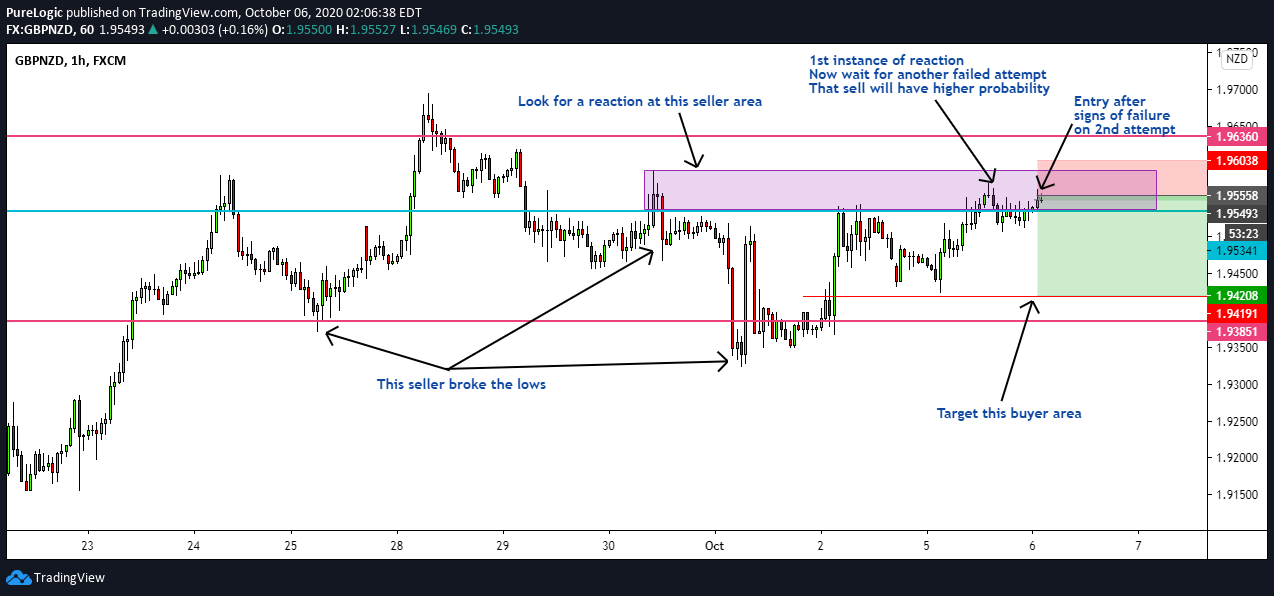
GBPNZD Swing Failure Sell

Flow Assessment

  • In the range shown in the picture, the overall flow is leaning down because sellers have broken a recent low and the buyers are coming back up in a slower fashion

Location Assessment

  • Price is right at the key seller area where the origin of the push that created a new low happened, thus giving us the right to look for sells when the buys fail

Momentum Assessment

  • We do not trade on the 1st seller reaction as the buyers may defend the nearest support strongly and continue making higher highs in their journey
  • When there were lower timeframe signs of rejection for the sellers, we got an indication that sellers may be acting around that area, thus creating an entry trigger.

Note: This is an aggressive entry, 25% of your usual position’s risk can be used. Later, we can add remaining size to the trade once we get more signs that the sells are going to work.

Entry Price – Sell 1.95521

Stop Loss – 1.96001

Take Profit – 1.94171

Risk to Reward – 1:2.81

Profit & Loss Per Standard Lot = -$319/ +$899

Profit & Loss Per Micro Lot = -$31.9/ +$89.9

Fellas, now you can check out forex trading signals via Forex Academy mobile app. Follow the links below.

iPhone Users: https://apps.apple.com/es/app/fasignals/id1521281368

Andriod Users: https://play.google.com/store/apps/details?id=academy.forex.thesignal&hl=en_US

Categories
Forex Signals

USDCAD Breakout Anticipation Sell

Flow Assessment

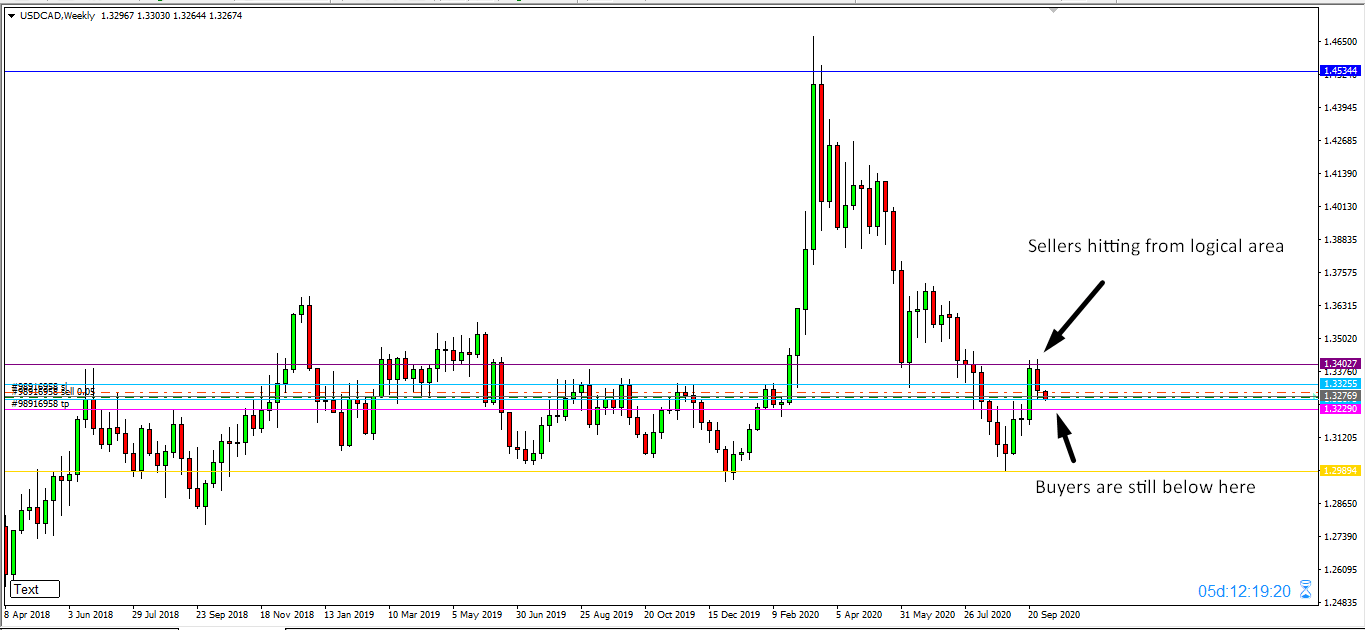
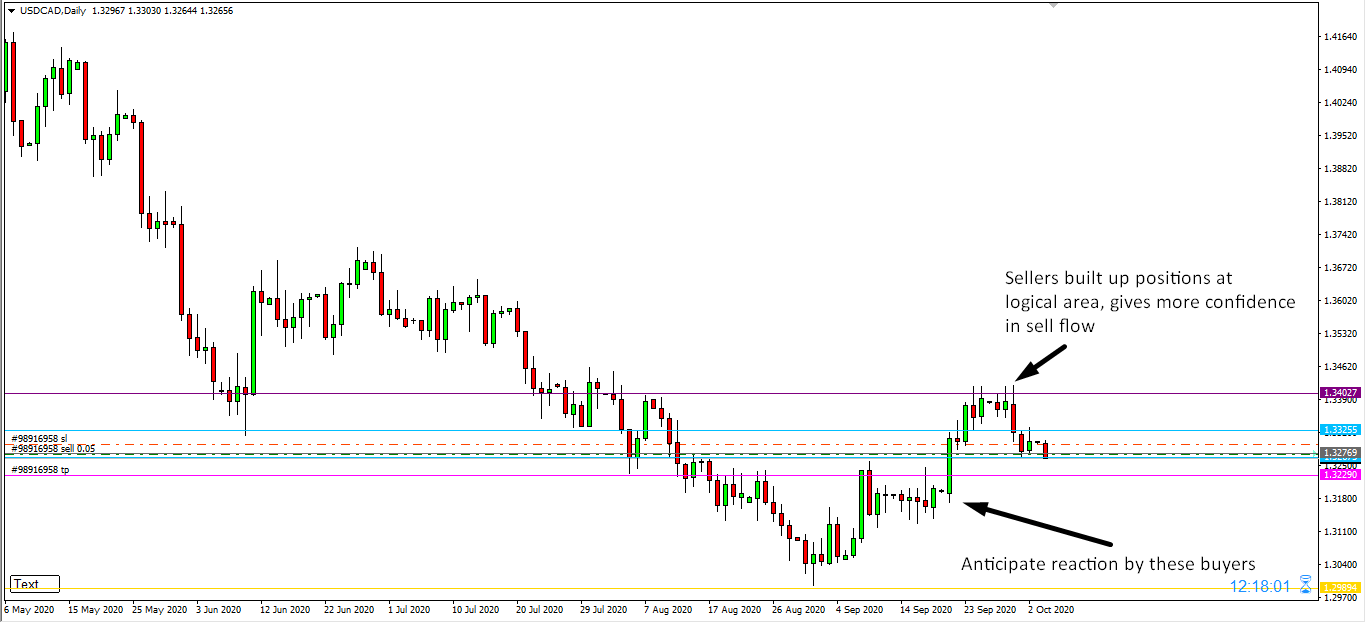
  • Daily sell flow is down
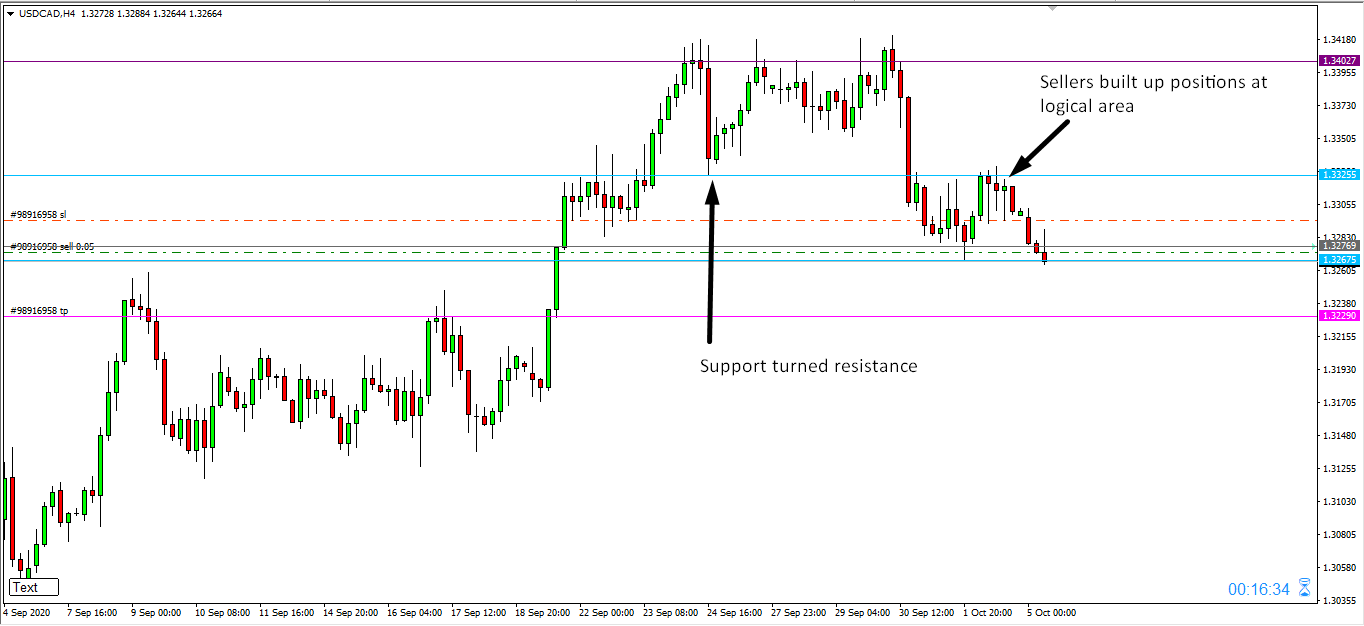
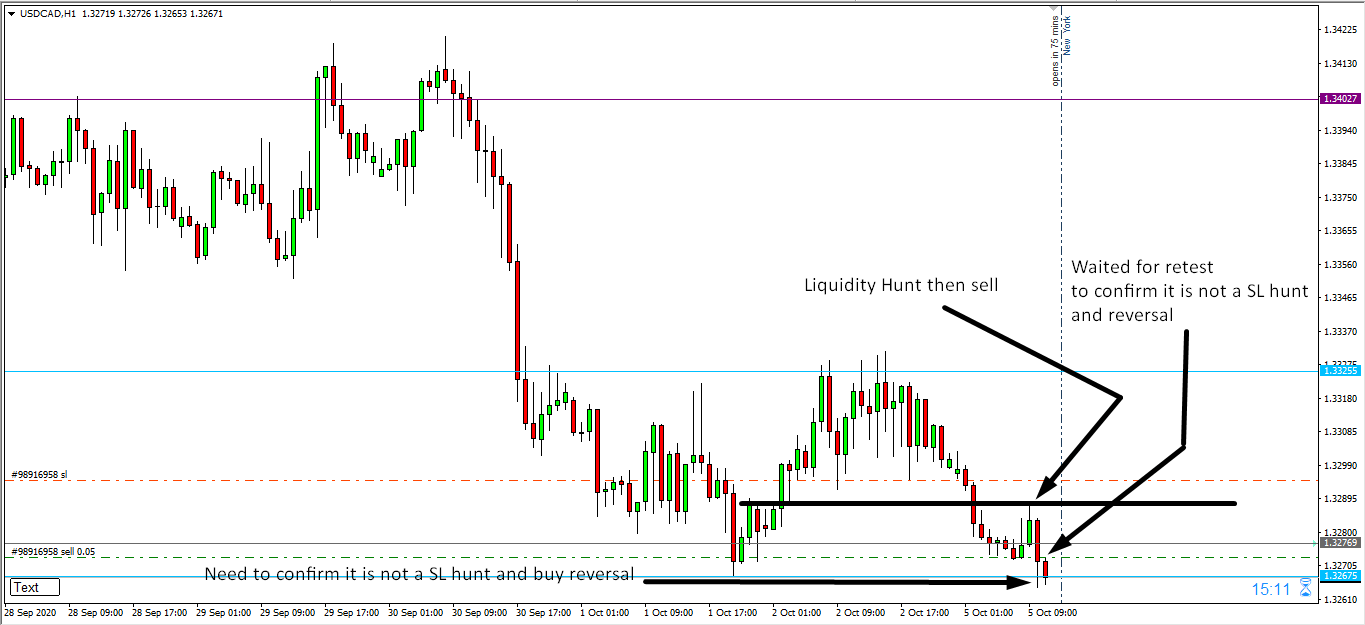
  • Sellers have built up positions on the H4 and penetrated lows in H1

Location Assessment

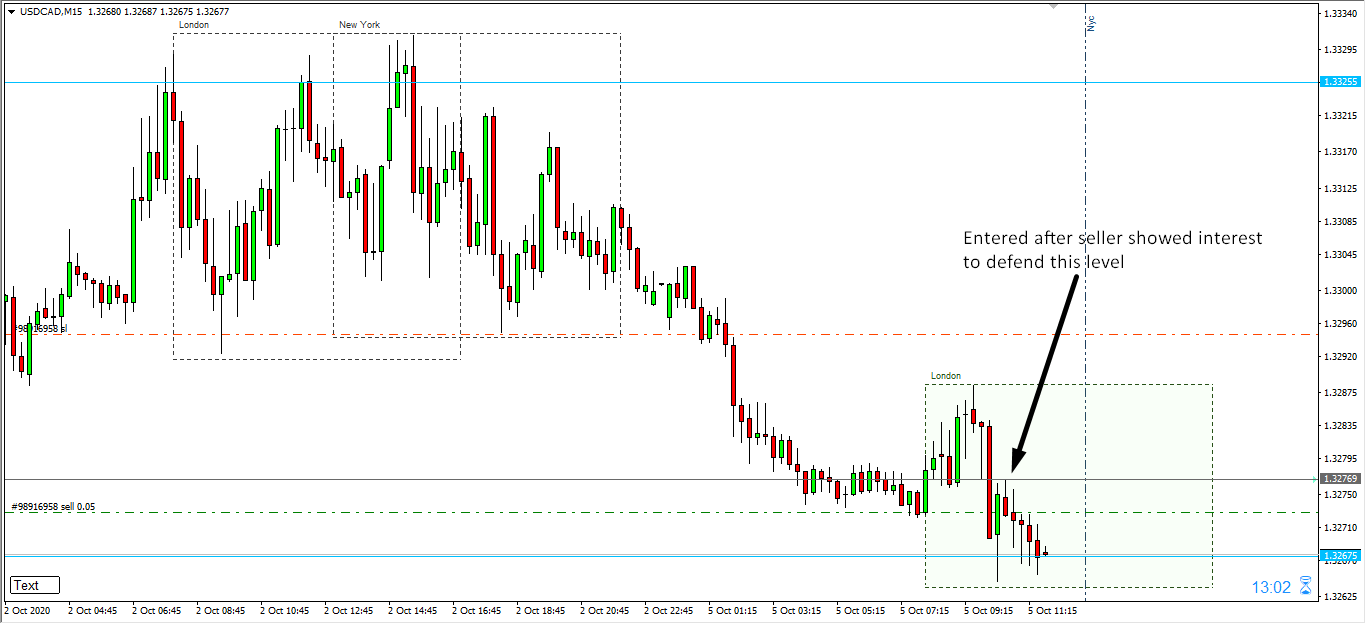
  • Price is at a M15 retest level after H1 sellers cleared the recent low
  • From the H4 perspective, there is space for the sell to perform until it reaches the next set of buyers (pink line in H4 picture above)

Momentum Assessment

  • We checked to see that the break of the H1 low was not a stop-loss hunt by waiting for the M15 retest and failure to make an equal high
  • Entry trigger activated after sellers showed interest to defend the M15 level

Entry Price – Sell 1.3271

Stop Loss – 1.3292

Take Profit – 1.3228

Risk to Reward – 1:2:05

Profit & Loss Per Standard Lot = -$157/ +$325

Profit & Loss Per Micro Lot = -$15.7/ +$32.5

Fellas, now you can check out forex trading signals via Forex Academy mobile app. Follow the links below.

iPhone Users: https://apps.apple.com/es/app/fasignals/id1521281368

Andriod Users: https://play.google.com/store/apps/details?id=academy.forex.thesignal&hl=en_US

Categories
Forex Signals

GBPNZD Breakout Retest Sell

Flow Assessment

  • The bigger flow is towards buyers in the daily, but price is reacting of a historical seller’s area on H4

Location Assessment

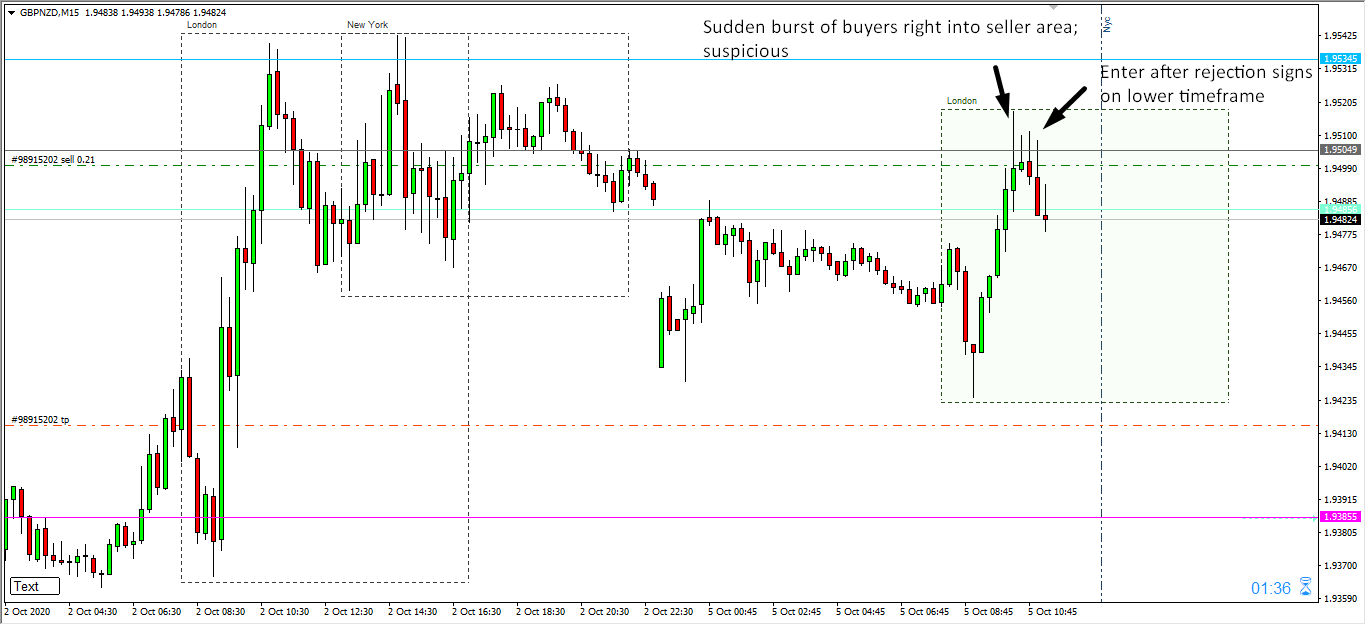
  • The buyers on M15 have reached the historical H4 seller’s area and are showing reactions
  • This suggests that a fresher buy price may be needed to resume the daily flow, which explains the TP placement

Momentum Assessment

  • The M15 buyers look strong, but they are unable to clear the H4 seller area. Price showed some signs of rejections, giving the entry trigger

Entry Price – Sell 1.94995

Stop Loss – 1.95755

Take Profit – 1.94145

Risk to Reward – 1:1.12

Profit & Loss Per Standard Lot = -$504/ +$564

Profit & Loss Per Micro Lot = -$50.4/ +$56.4

Fellas, now you can check out forex trading signals via Forex Academy mobile app. Follow the links below.

iPhone Users: https://apps.apple.com/es/app/fasignals/id1521281368

Andriod Users: https://play.google.com/store/apps/details?id=academy.forex.thesignal&hl=en_US

Categories
Forex Signals

EURAUD Breakout Retest Buy

Flow Assessment

  • The daily is in a range, but recently there has been a strong move up by buyers that have built up positions. These buyers achieved something by penetrating old highs.
  • On the H4, seller moves are slowing down near the key reaction area.
  • On the H1, recent sellers failed to show defence of the key level


Location Assessment

  • Price is at a key reaction area on the daily, thus giving us reason to look at a lower timeframe for proof of genuine reaction structure
  • Price made a swing failure on the H4, taking out possible sell stops. This gives us more confidence in the trade as some people have gotten caught trading the wrong way
  • On the H1, we wait for the price to reach the last recent seller area and look for failure in defending that zone

Momentum Assessment

  • On the H4, the sell moves were slowing down and buyers were holding the level
  • The H1 shows a stop hunt below recent lows. Sellers failed to make a lower low here.
  • At the recent seller area on the H1, there were signs of sellers not defending that level, thus indicating to us that the buys are in.
Categories
Forex Assets

Everything About Trading The CAD/SGD Forex Currency Pair

Introduction

CAD/SGD is a Forex exotic currency pair where CAD represents the Canadian Dollar and the SGD, – the Singapore Dollar. For this pair, the CAD is the base currency, and the SGD is the quote currency. Therefore, the price attached to the pair is the quantity of the SGD that can be bought by 1 CAD. If the price of the CAD/SGD pair is 1.0289, it means that 1 CAD dollar buys for 1.0289 SGD.

CAD/SGD Specification

Spread

In forex trading, the difference in pips between the buying price (bid) and selling price (ask) is the spread. Forex brokers primarily generate their revenues through the spread. The spread varies depending on the type of trading account. The spread for the CAD/SGD pair is:

ECN: 7 pips | STP: 12 pips

Fees

For every individual trade made on an ECN account, one has to pay a commission. This fee varies with the broker and depends on the type of trade executed and the currency being traded. STP accounts do not have fees.

Slippage

In forex trading, slippage is the difference in the price in which a trader initiates a trade and the price at which it is executed. Slippage is a direct result of the brokers’ speed of execution and market volatility.

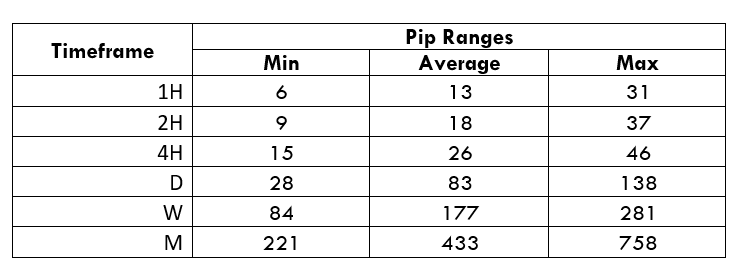
Trading Range in the CAD/SGD Pair

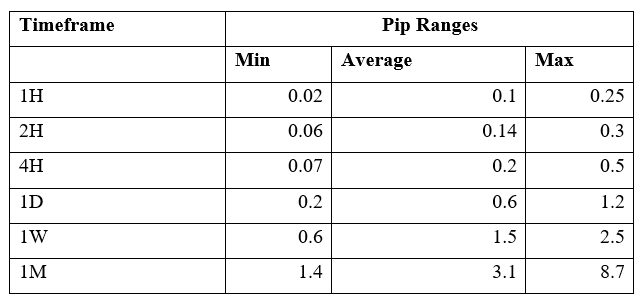
In forex, the trading range shows the fluctuation of a currency pair within s specific timeframe. The trading range is useful to estimate potential profit or loss from trading different timeframes. For example, if the CAD/SGD pair fluctuates ten pips in the 2-hour timeframe, it means that a trader can expect to either gain or lose $97 by trading one standard lot.

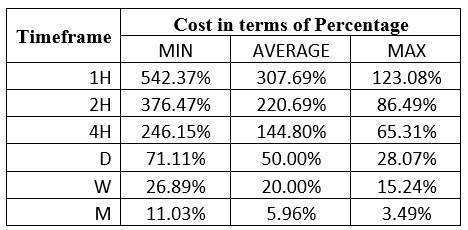
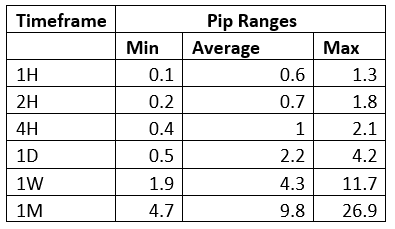
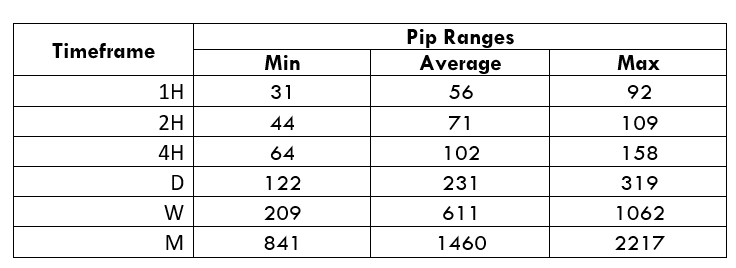
Below is a table showing the minimum, average, and maximum volatility of CAD/SGD across different timeframes.

The Procedure to assess Pip Ranges

  1. Add the ATR indicator to your chart
  2. Set the period to 1
  3. Add a 200-period SMA to this indicator
  4. Shrink the chart so you can determine a larger period
  5. Select your desired timeframe
  6. Measure the floor level and set this value as the min
  7. Measure the level of the 200-period SMA and set this as the average
  8. Measure the peak levels and set this as Max.

CAD/SGD Cost as a Percentage of the Trading Range

Cost expressed as the Percentage of the trading range helps a forex trader establish the anticipated trading costs under different market volatility across different timeframes.

Total cost = Slippage + Spread + Trading Fee

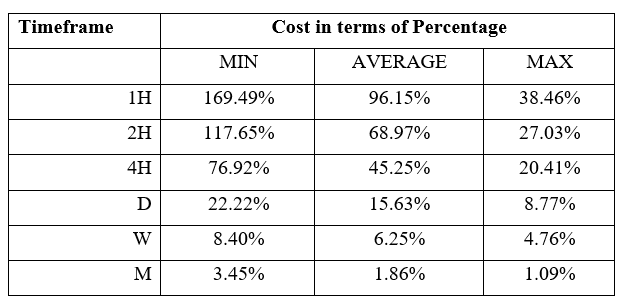
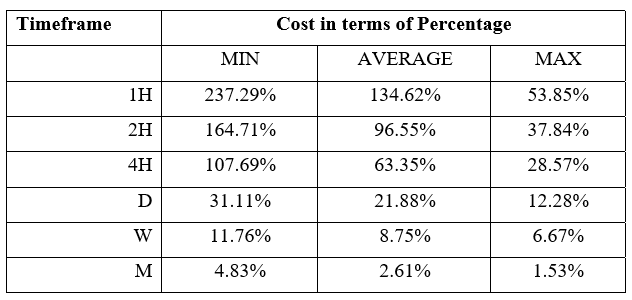
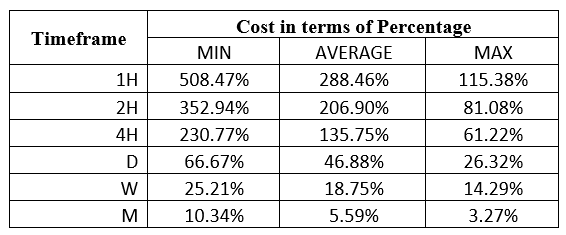
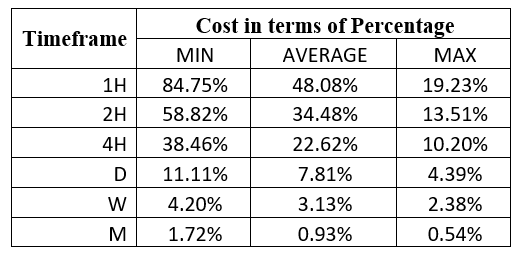
The tables below show the percentage costs to be expected when trading the CAD/SGD pair. The costs are expressed as a percentage of pips.

ECN Model Account

Spread = 7 | Slippage = 2 | Trading fee = 1

Total cost = 10

STP Model Account

Spread = 12 | Slippage = 2 | Trading fee = 0

Total cost = 14

The Ideal Timeframe to Trade CAD/SGD

We can see that in both the ECN and the STP accounts, costs are higher when volatility is at a minimum across all timeframes. Furthermore, we can observe that these costs tend to reduce when the volatility increases to the maximum.

For the CAD/SGD pair, costs are highest when volatility is at the lowest at 0.02 pips during the 1-hour timeframe. Conversely, the trading costs are lowest at the 1-month timeframe when volatility is at a maximum of 8.7 pips. Since high volatility can be risky and low volatility less profitable, forex traders should consider trading during times of average volatility.

More so, traders can increase their profitability by eliminating the costs associated with slippage. By using limit instead of market orders, forex traders can avoid experiencing slippage when entering and exiting positions.

Let’s have a look at how zero slippage cost affects the total costs.

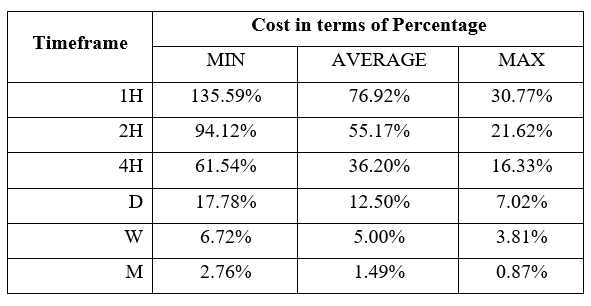
ECN Account Using Limit Model Account

Total cost = Slippage + Spread + Trading fee

= 0 + 7 + 1 = 8

Notice that using the limit order type reduces the overall costs. The highest cost, for example, has reduced from 169.49% to 135.59%.

Categories
Forex Basic Strategies

Filtering The Most Profitable Trading Signals Using The ‘Zig-Zag’ Forex Trading Strategy

Introduction

In today’s article, we discuss a strategy that is based on the unfamous zig-zag indicator. The zig-zag indicator serves to shows changes and continuation in trends that occur in price movements. Usually, this indicator is used by traders to look for reversal points in the market. But in today’s strategy, we will use the zig-zag indicator to trade the continuation of a trend. However, if we think a little deep, this type of trading is also a form of ‘reversal trading’ where we will be finding the reversal points in a smaller trend within the larger trend.

At first glance, the indicator appears very simple but is not easy to understand by novice traders. The trading strategy that uses this indicator is not special because it uses this indicator, but since we are imparting various other concepts of technical analysis such as chart patterns, trend lines, and price action. But using this indicator alone too can generate good trading signals provided the trader is having good skill of this indicator properly.

Time Frame

The ‘zig-zag’ strategy can only be applied to the ‘Daily’ time frame. Hence, this strategy is not for intraday and short-term traders. We need to have a longer time horizon to trade using this strategy.

Indicators

We use two technical indicators in this strategy

  • Simple Moving Average (20-period)
  • Zig-Zag (default setting)

Currency Pairs

We can apply the following strategy on both minor and major currency pairs. Liquidity and volatility will not be a major issue here as we are trading on higher time frames.

Strategy Concept

We are basically using the zig-zag indicator to identify classic chart patterns of technical analysis and trade them. The indicator is very effective in reducing the noise by helping the technical trader in viewing the larger picture and general market direction. Here, we look for appropriate chart patterns and associated price action indications within the context of a trend.

When these patterns are formed just anywhere on the chart, they do not hold much value as there is no logic to that. Once we identify a trend using the simple moving average (SMA), we wait for trend continuation signs provided to us by the zig-zag indicator and the chart pattern. The formation of the chart pattern is the first sign of trend continuation. Once price action develops and the market moves in the direction of the major trend, we look for ‘entry’ signals and then only enter into a trade.

One of the astounding features of this strategy is it’s risk-to-reward (RR) ratio. Trades executed this strategy have high risk-to-reward (RR) because we are trading with the major trend and the need for a smaller stop-loss. Not only is ‘RR’ of trades high, but also the probability of winning is much higher in this strategy due to stricter rules and time given for a trade setup to be formed. Now that we got a gist of the strategy, let us find out the actions required to execute the strategy.

Trade Setup

In order to execute the strategy, we have considered the ‘Daily’ chart of the USD/JPY currency pair, where we will be illustrating a ‘short’ trade. Here are the steps to execute the strategy.

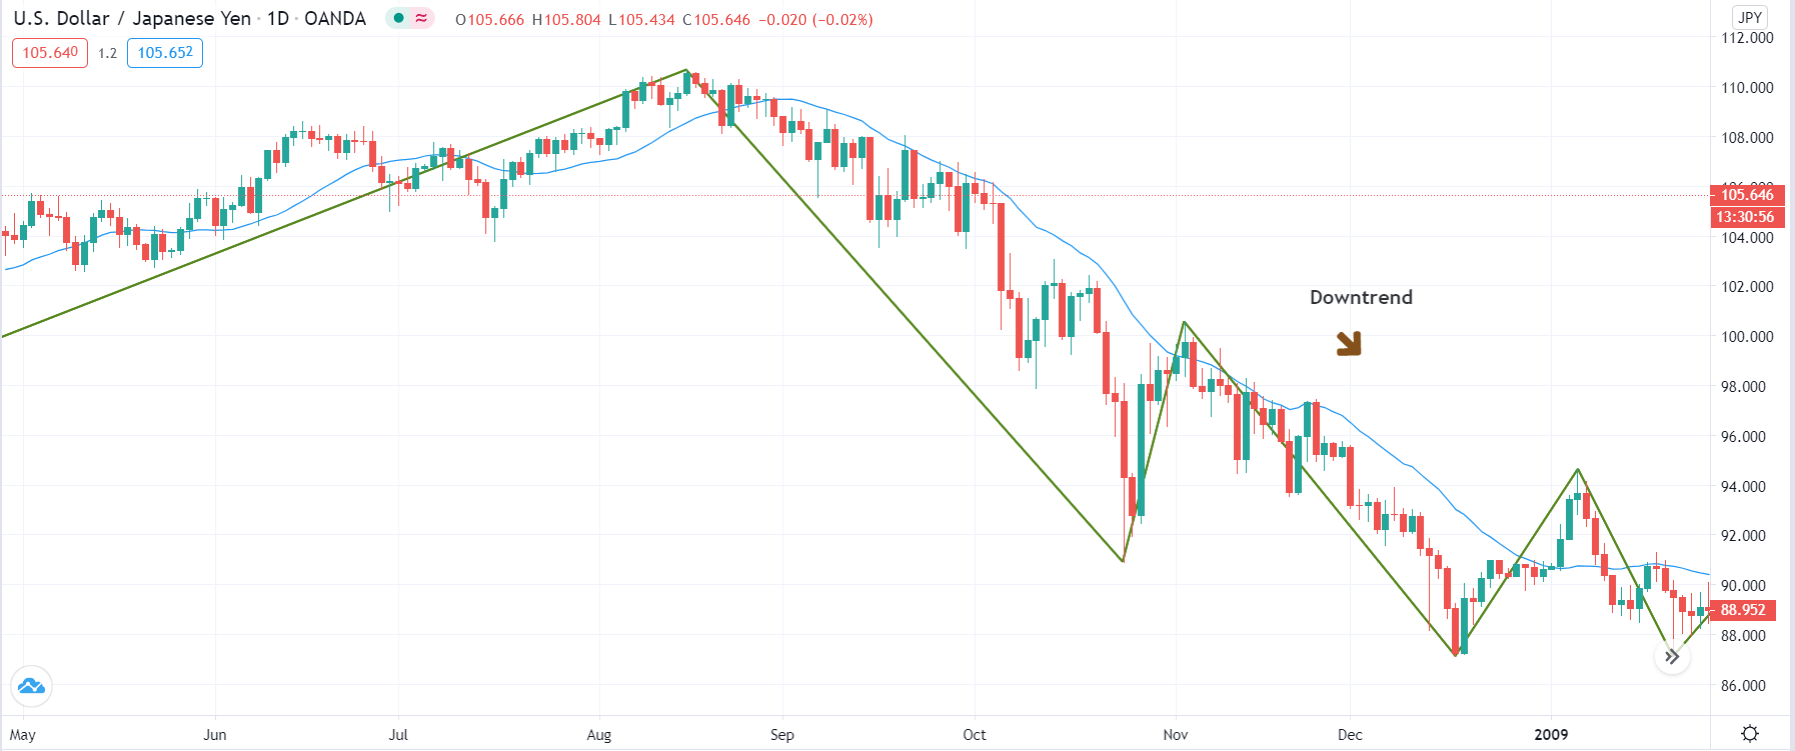
Step 1: Firstly, we have to identify the trend of the market on the ‘Daily’ chart. This can easily be done with the help of the simple moving average (SMA) indicator. If the price stays below the SMA for a long period of time, we say that the market is in a downtrend. And if it remains above the SMA for a sufficient period of time, we say that the market is in an uptrend. It is worthwhile to note that zig-zag is not being used for establishing the trend.

The below image shows that the market is in a strong downtrend in the case of USD/JPY.

Step 2: After identifying the trend of the market, we wait for the market to form a ‘head and shoulders’ pattern in a down-trending market and an ‘inverse head and shoulders’ pattern in an up-trending market. Here’s where the application of the zig-zag indicator comes into the picture. The chart pattern should essentially be indicated by the zig-zag pattern—the lines of indicator show the ‘real’ formation of the pattern in the market. In addition to this, we plot a trendline that connects the ‘lows’ (head and shoulders) or ‘highs’ (inverse head and shoulders) of the pattern as indicated by the indicator. This completes the execution of 80% of the strategy’s rules.

Step 3: We enter the market for a ‘buy’ or ‘sell’ after the price breaks the trendline and ‘tests’ it on the other side. In simple words, in a ‘head and shoulders’ pattern, we enter for a ‘sell’ when price breaks the ‘support’ trendline and re-tests after making a ‘lower low.’ While in an ‘inverse head and shoulders pattern,’ we enter for a ‘buy’ when price breaks the ‘resistance’ trendline and re-tests after making a ‘higher high.’

The below image shows how a ‘short’ entry is taken.

Step 4: Now, let us determine the stop-loss and take-profit levels for the strategy. When ‘short,’ we place a stop-loss above the right shoulder of the ‘head-and-shoulder’ pattern. Similarly, when ‘long, stop-loss is placed below the right shoulder of the ‘inverse head-and-shoulder’ pattern. Take-profit will be set at the ‘lower low ‘of the major downtrend and at the ‘higher high’ of the major uptrend. The risk-to-reward (RR) of trades executed using this strategy will be at least 1:1.5.

The below image shows the result of sample trade executed using the zig-zag strategy.

Strategy Roundup

Even though the above strategy takes a lot of time to present a potential trade, the risk-to-reward and probability of winning of these trades are worth waiting for. There are many applications of the zig-zag indicators. Traders make use of other technical indicators like the Stochastic Oscillator and Relative Strength Index (RSI) together with the zig-zag indicator to locate the overbought and oversold conditions of the market.

Categories
Crypto Guides

Understanding Crypto Trading Bots & The Pros/Cons of Using Them

Introduction

Crypto trading bots are gaining popularity with rapid digitalization happening all across the globe. The automated trading programs built and designed for trading different cryptocurrencies are called trading bots. They have gained popularity because cryptocurrency trading has been expanding like never before.

Trading bots are very useful and can serve ample benefits because they are programmed to study and analyze complex data, including prices, market volume, trends, and trades. Also, a trading bot is employed 24*7, and the user will not have to worry about the holdings all the time. Crypto trading bots are generally used by users who do not have the physical time to analyze the market all the time. 

One should also remember that not all the cryptocurrency trading bots available in the markets are the same. There are only a few features that are found common in all of them. The crypto trading bots implement four aspects when they work i.e.

  • Backtesting
  • Strategy implementation
  • Execution
  • Job scheduler

Backtesting collects different market data, like slippage and fees, for analysis purposes. During strategy implementation, different strategies are implemented for generating returns. Execution allows users to test their ideas and strategies in real-time. Once the execution is done, then its time for the automation of the entire process and set-up a job scheduler.

Why can Crypto Trading Bots be the best decision? 

A Crypto trading bot brings a plethora of benefits to help a user. Apart from 24*7 monitoring of market data, these bots can analyze pre-defined criteria as well as complex metrics in a short period of time. A bot is responsible for conducting a lot of multi-tasking, but the best thing is that this multi-tasking is super-efficient. Another reason why crypto trading bots can be the best decision is the fact that they are immune to the emotional side of trading and human errors. Hence, a bot will never trade out of greed or disappointment. 

Why can Crypto Trading Bots be the worst decision? 

There are a lot of advantages that have been discussed until now, but sometimes, a crypto trading bot can become the worst decision of a user. To start with, they are extremely expensive. Hence, before choosing a crypto trading bot, it is necessary to conduct proper research and ensure that the bot they intend to use is reliable and profitable. There are a lot of developers who provide dodgy bots that cannot be trusted.

If a user is not experienced with trading in cryptocurrency, then it is not advisable to use a bot because it requires ace level skills to do configuration and monitoring. Also, if there is a failure to set stop-loss limits, then it can cause a lot of troubles for the inexperienced users. There are also some security concerns in the past associated with cryptocurrency trading bot. For example, Bitconnect has been labeled as one of the biggest cryptocurrency scams, and it was claimed that a trading bot was in use. 

Conclusion

Trading bots have different advantages as well as disadvantages. Going with a bot can either be your best decision or the worst decision. However, if a user has professional experience and expertise in configuration and monitoring, then he or she can use a trading bot to gain maximum benefits. Doing the proper research before selecting a bot is also important. 

Categories
Forex Signals

NZDCHF Bearish channel in Action

Introduction

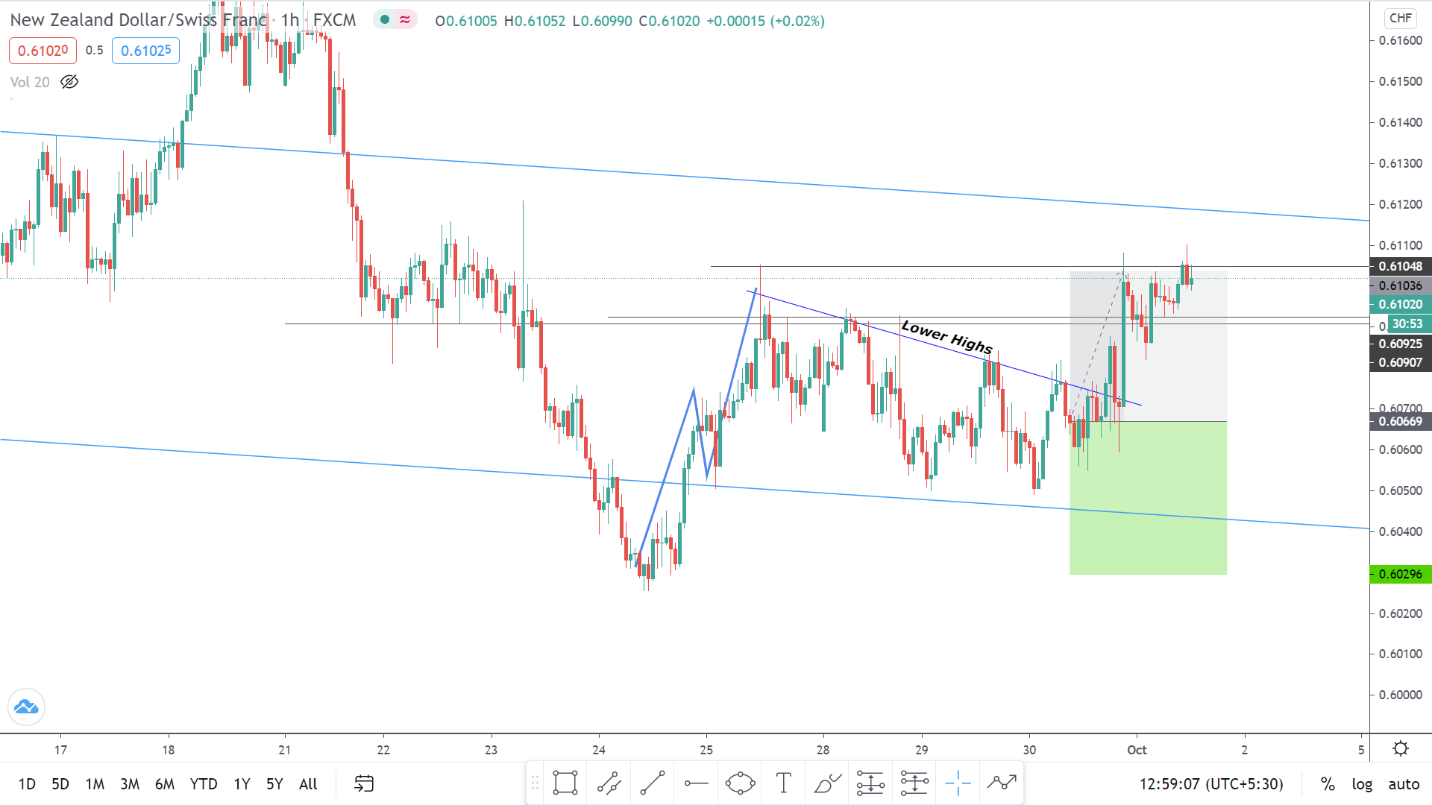
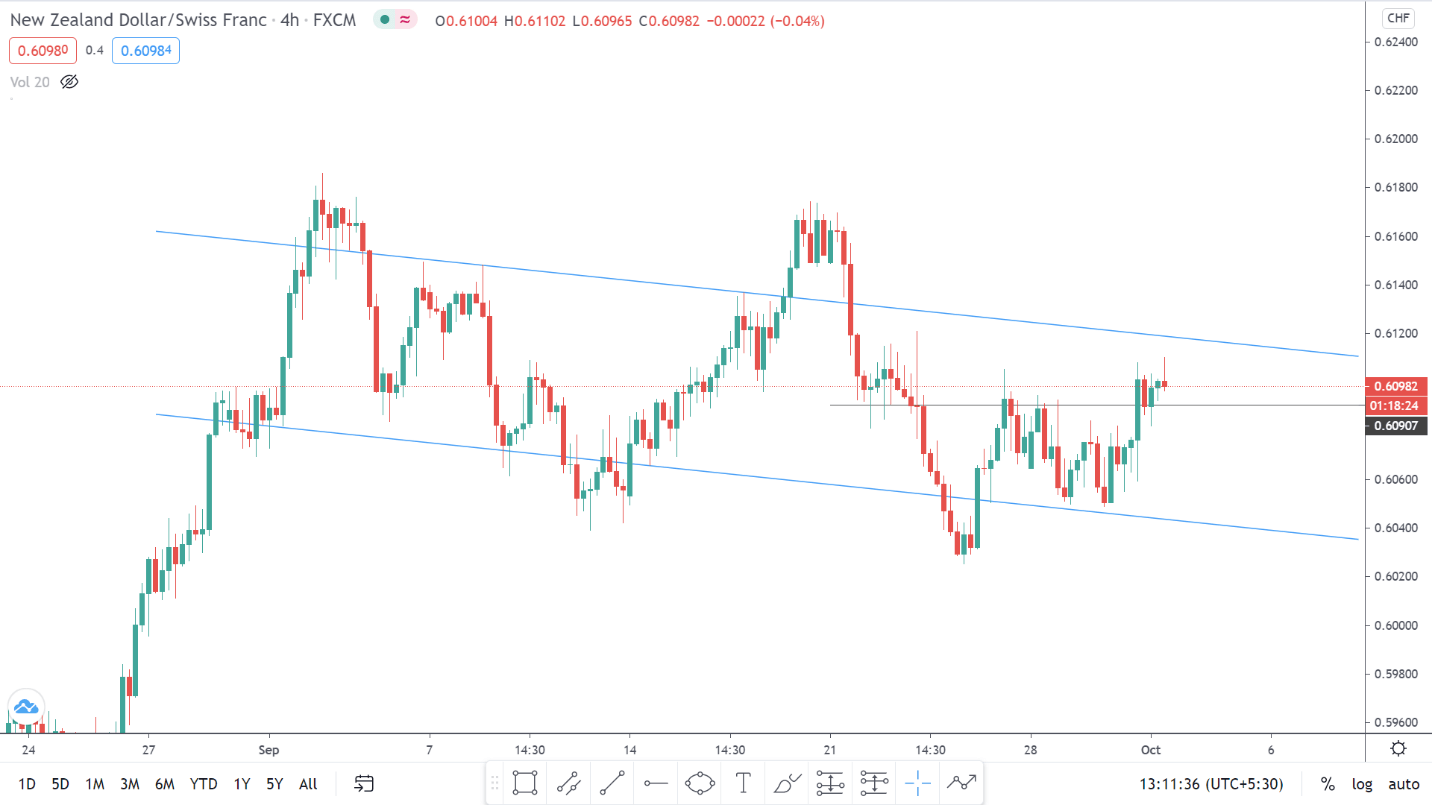
NZDCHF has been moving in a downward channel since the beginning of September.

After the most recent push by the sellers attempted to breach past the bottom of the channel, but failed and came right back in. The reaction from the buyers came in quite strong but ended up holding below the Resistance at 0.60907. This puts the channel currently in a halt state.

On the 1H timeframe, the buyers began to make higher highs and higher lows. However, after reaching the Resistance, there were no further higher highs. In other words, the market went into a consolidation state.

Soon later, the sideways movement tuned into lower high sequences, indicating that the sellers are making an attempt to take the market at least to the recent low (0.60296), ahead of the market going back to the top of the channel.

In hindsight, the higher demand at the bottom of the channel eventually led to the price head to higher levels. And the reason for the demand kicking in could be due to the strengthening of the New Zealand Dollar.

Categories
Forex Basic Strategies

Generating Profitable Forex Signals Using The ‘Indicator-Price Action’ Combo Strategy

Introduction

Few strategies discussed previously focussed on chart patterns and indicators. Now let us a strategy that is based on two of the most powerful indicators in technical analysis. We already know how to trade using these indicators separately. But using any technical indicator in isolation will not generate a great amount of profit.

Therefore, it becomes necessary to combine at least two indicators and use them in conjunction to produce signals. In today’s article, we not only combine two indicators but also provide a price action edge to it that will make this one of the best strategies of all time. This particular strategy gives traders an insight into both volatility and momentum in the forex market.

The two indicators we will using are Bollinger Band (BB) and MACD. Using the two indicators together can assist traders in taking high probability trades as they gauge the direction and strength of the existing trend, along with volatility. Let us find out the specifications of the strategy and how we imbibe concepts of price action here.

Time Frame

The strategy is designed for trading on longer-term price charts such as the 4 hours and ‘Daily.’ This means the strategy is suitable for the swing to long-term traders.

Indicators

As mentioned earlier, we use Bollinger Band and MACD indicators in the strategy with their default settings.

Currency Pairs

We can apply this strategy to both major and minor currency pairs. However, pairs that are not volatile should be avoided.

Strategy Concept

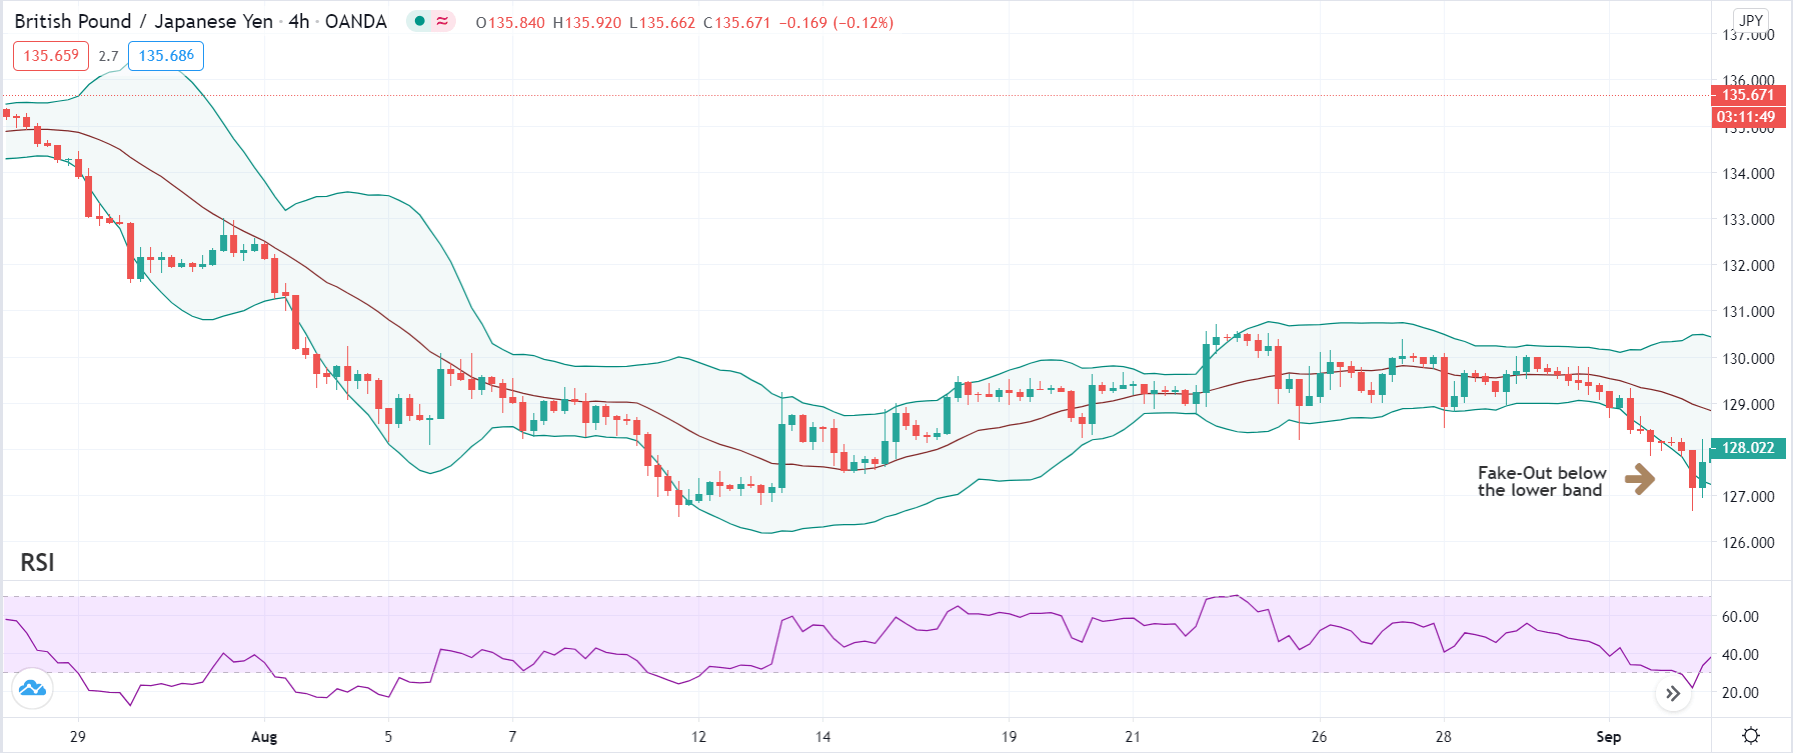
In this strategy, we first identify the trend of the market and see if the price is moving in a channel or not. When looking for a ‘long’ setup, the price must move in a channel below the median line of the Bollinger band. The lesser time price spends above the median line of the Bollinger band better for the strategy.

The reason behind why we chose to have the price below the Bollinger band is to verify that the price is moving into an ‘oversold’ zone. When price moves into the zone of ‘overbought’ or ‘oversold,’ it means a reversal is nearing in the market. Similarly, in a ‘short’ setup, the price should initially move in an upward channel above the median line of the Bollinger band. This indicates that the price is approaching an ‘overbought’ area.

The MACD indicator shows when a true reversal is taking place in the market. The histogram tells about the momentum and strength of the reversal. Depending on the level of the bars, we ascertain the strength of the reversal. Not only is the strength of the reversal important, but also the ’highs’ and ‘lows’ it makes. Once price crosses previous highs and lows, we enter the market at an appropriate ‘test.’ Let us understand in detail about the execution of the strategy.

Trade Setup

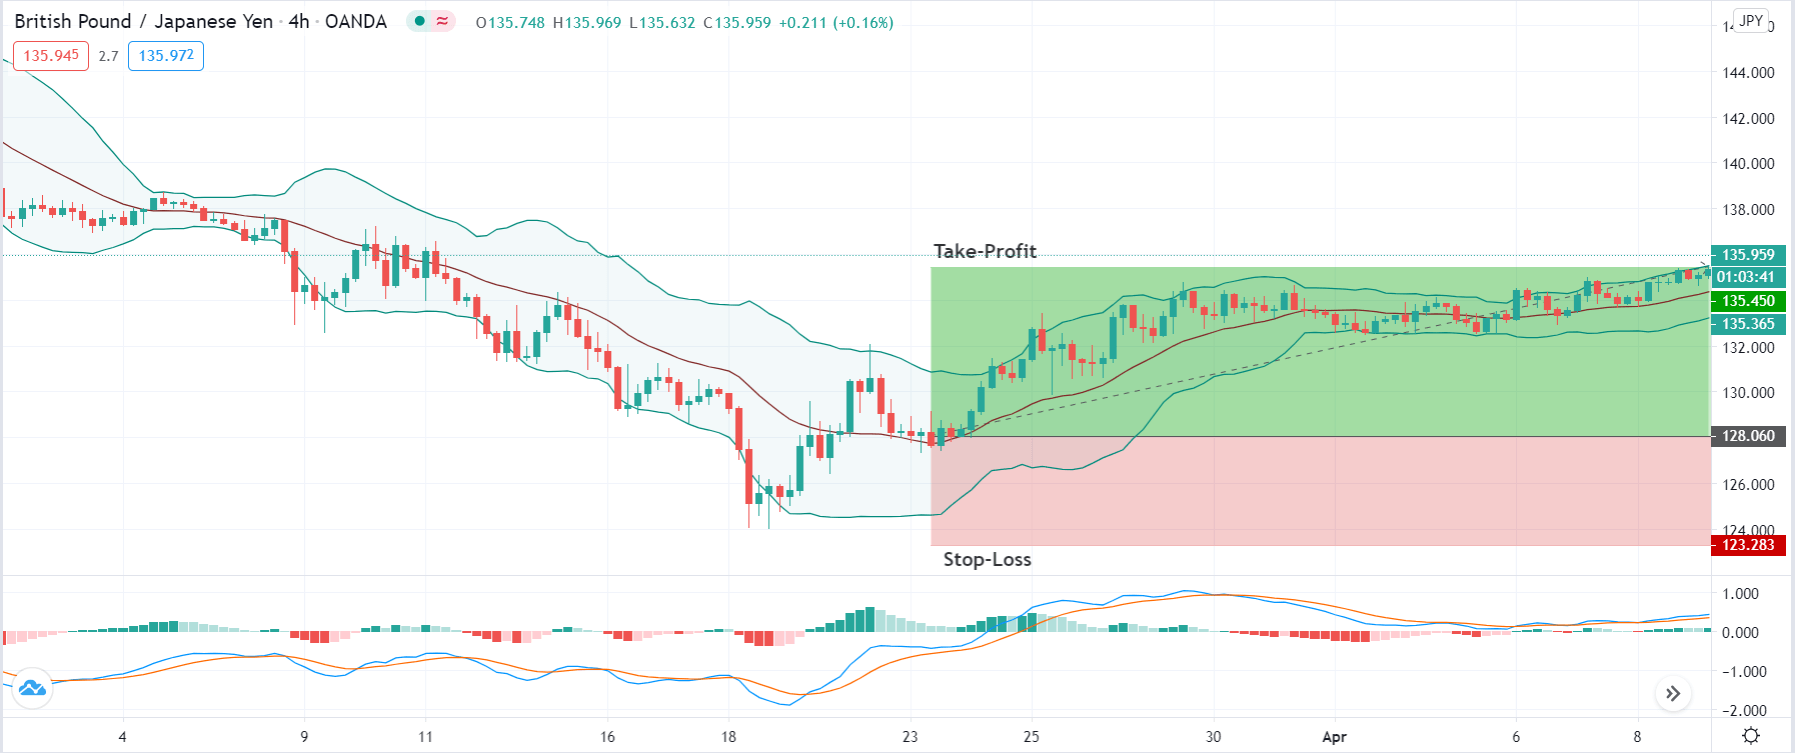
In order to execute the strategy, we have considered the 4-hour chart of the GBP/JPY pair, where we will be illustrating a ‘long’ trade. Here are steps to execute the strategy.

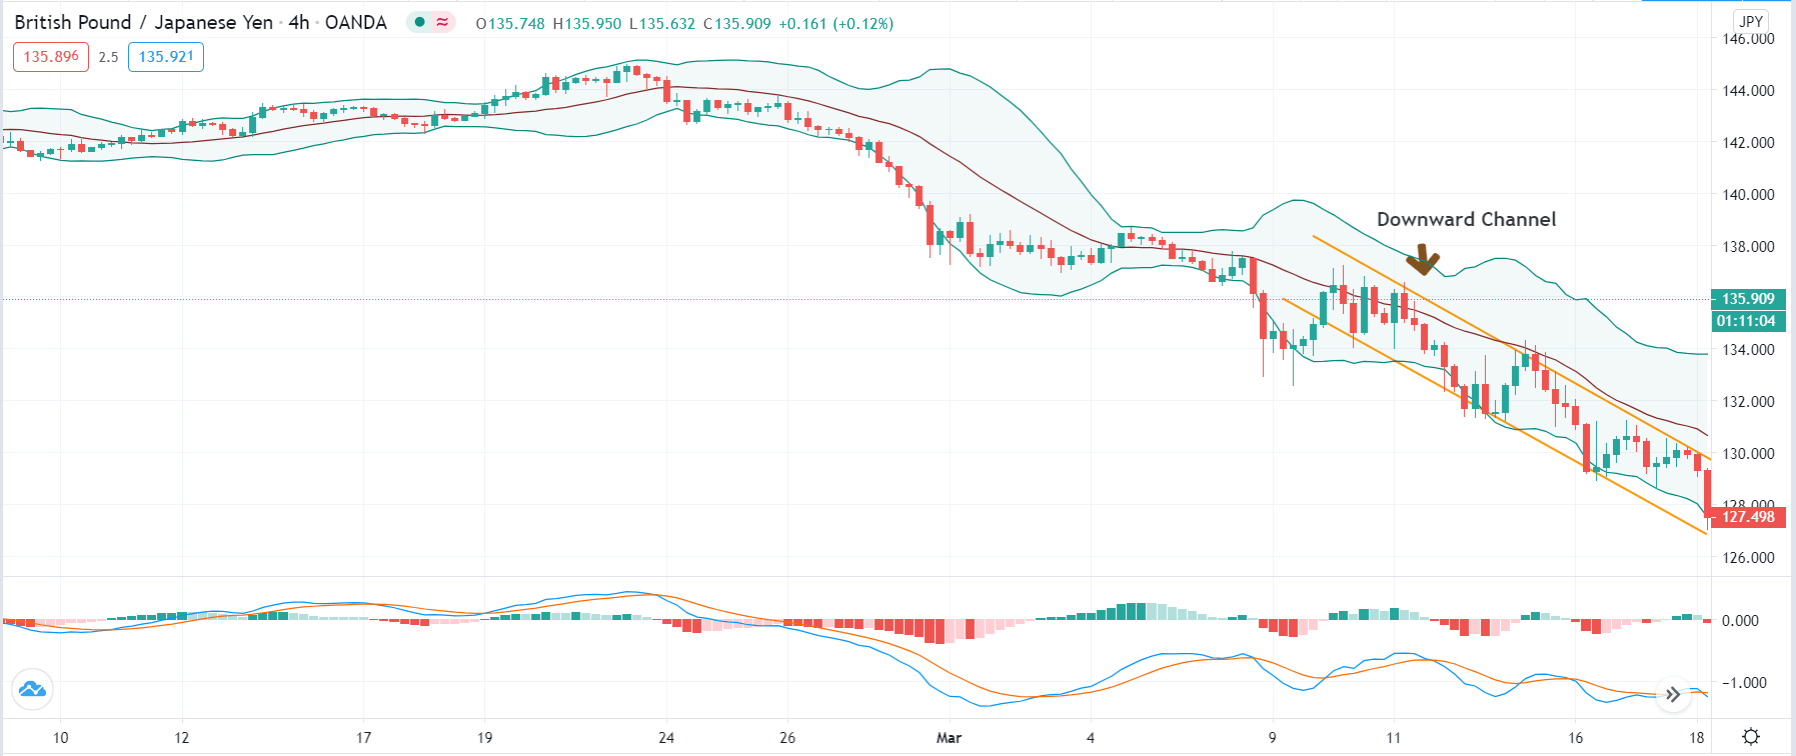
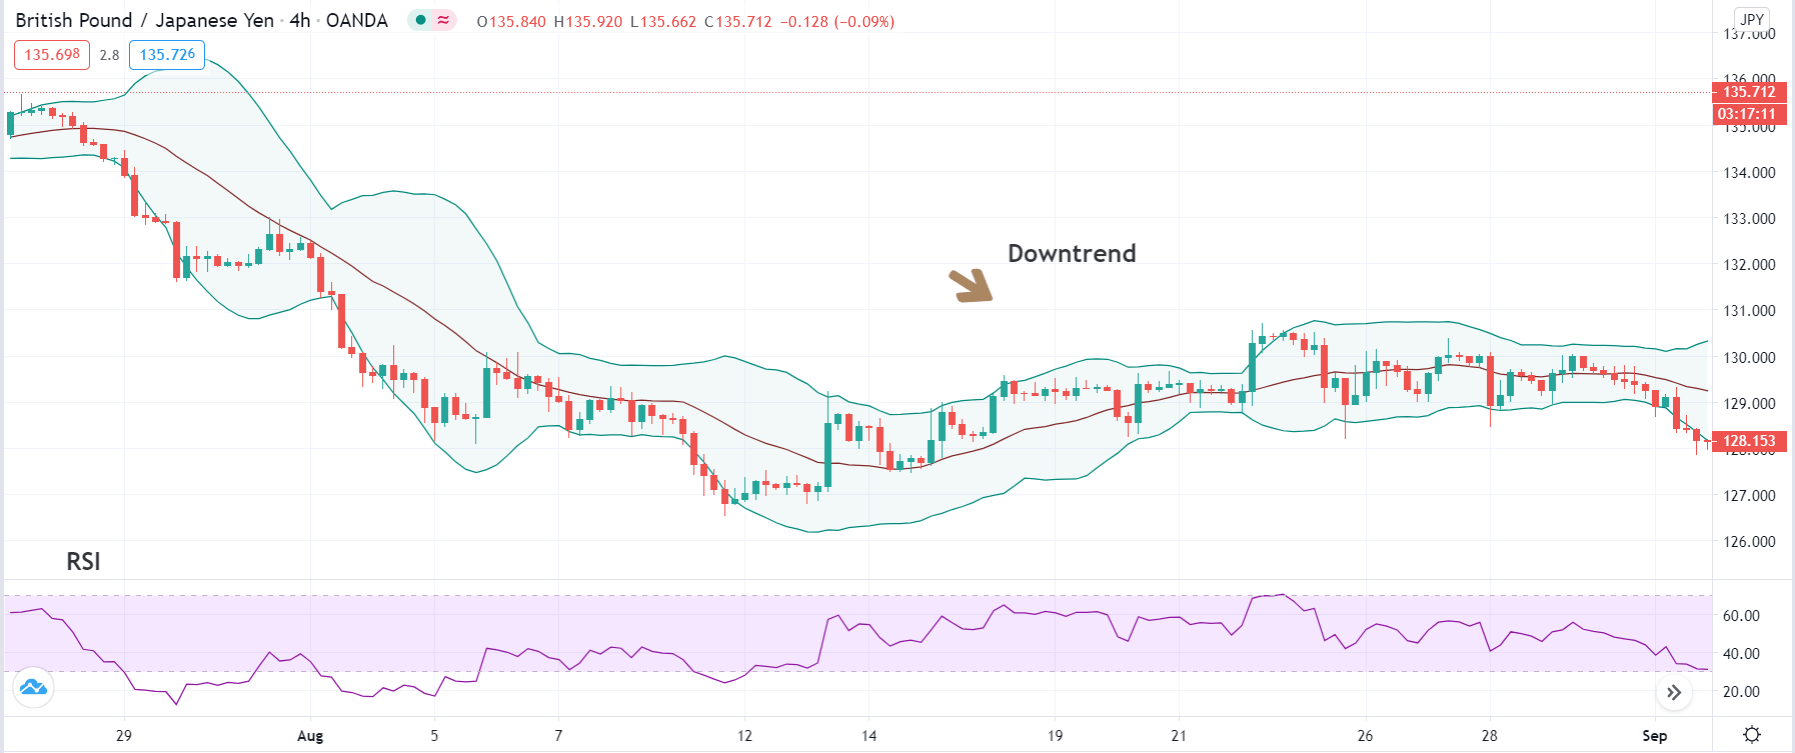
Step 1: Firstly, we have to identify the trend of the market. In a ‘long’ trade setup, we need to look for series of ‘lower lows’ and ‘lower highs’ below the median line of the Bollinger band, and in a ‘short’ trade setup, we need to look for series of ‘higher highs’ and ‘higher lows’ above the median line of Bollinger band. When this is confined in the channel, the trend becomes very clear, and reversal can easily be identified.

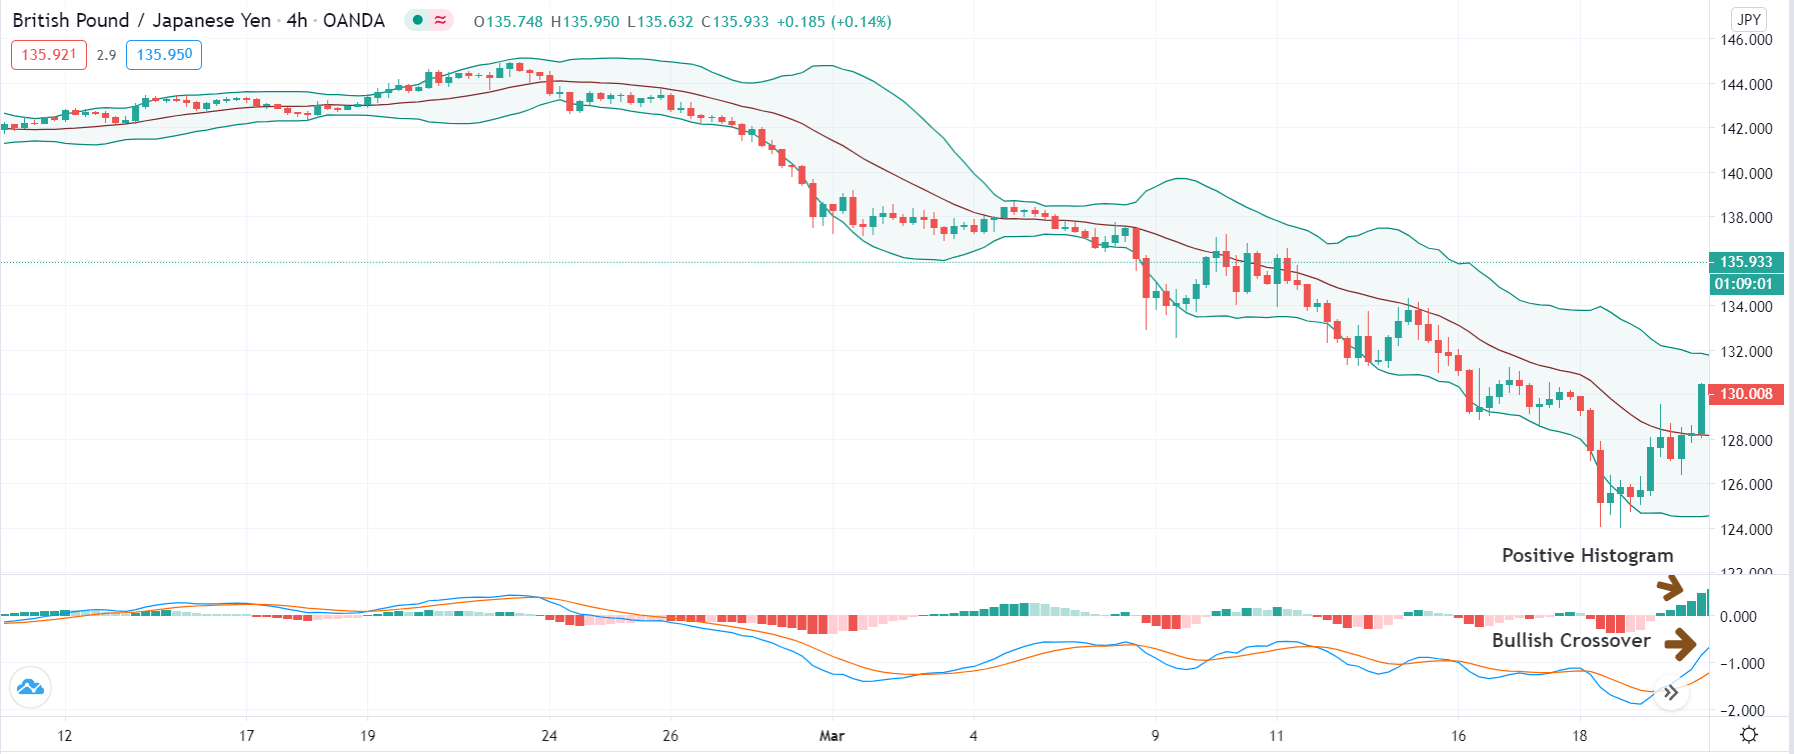
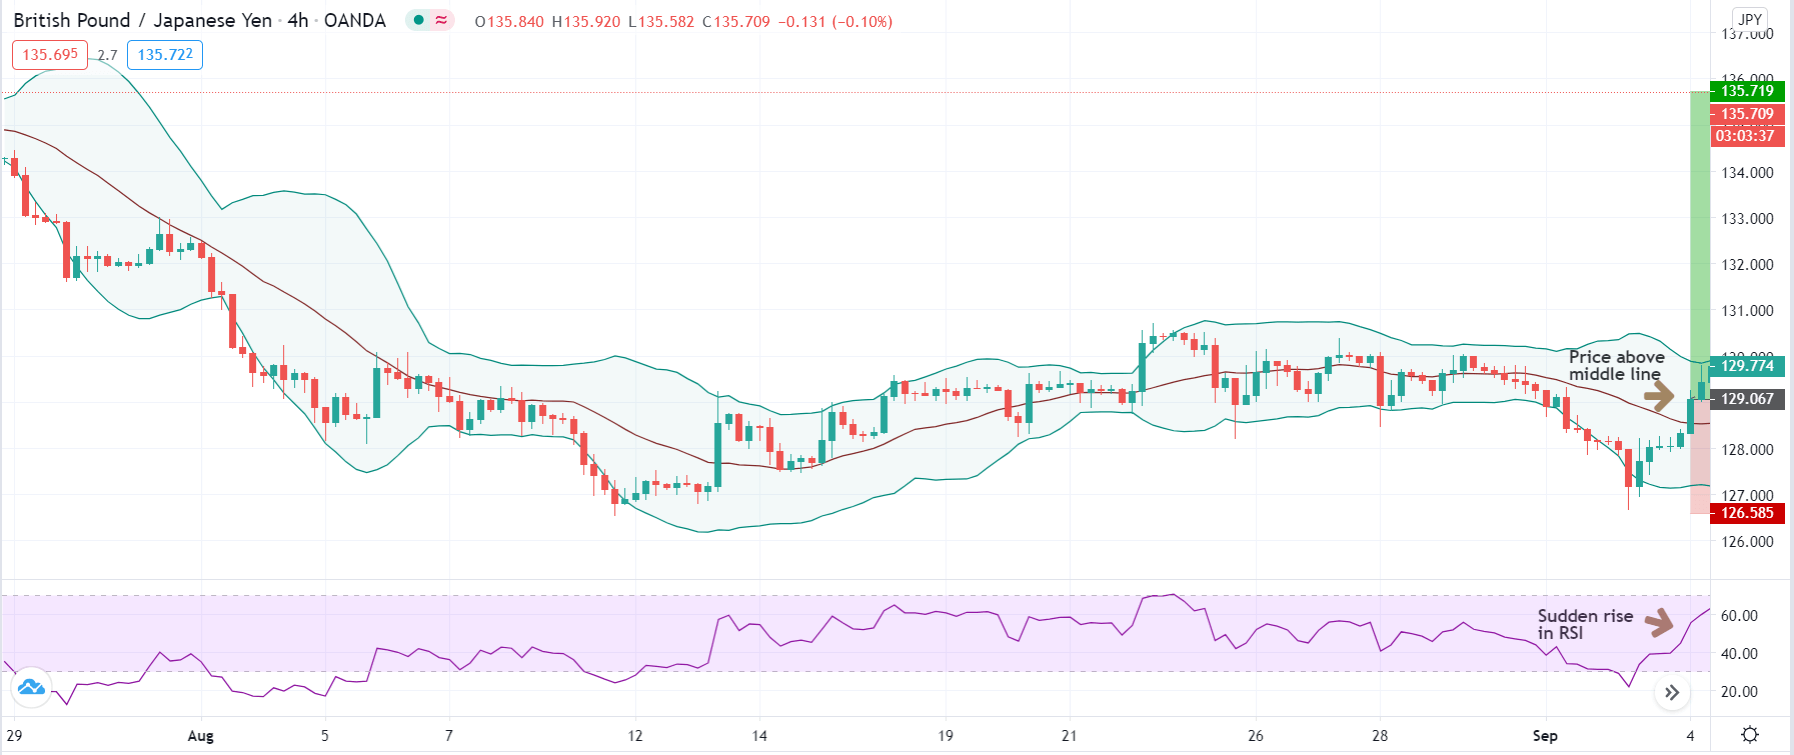
Step 2: We say that an upward reversal has taken place when we notice a bullish crossover in MACD along with a positive histogram. While in an uptrend, we say that a reversal has occurred when we notice a bearish crossover in MACD along with a negative histogram. Once reversal becomes eminent in the market, it is necessary to confirm that the reversal is ‘true,’ and thus, we could take a trade in the direction of the reversal.

The below image shows a downtrend reversal, as indicated by MACD.

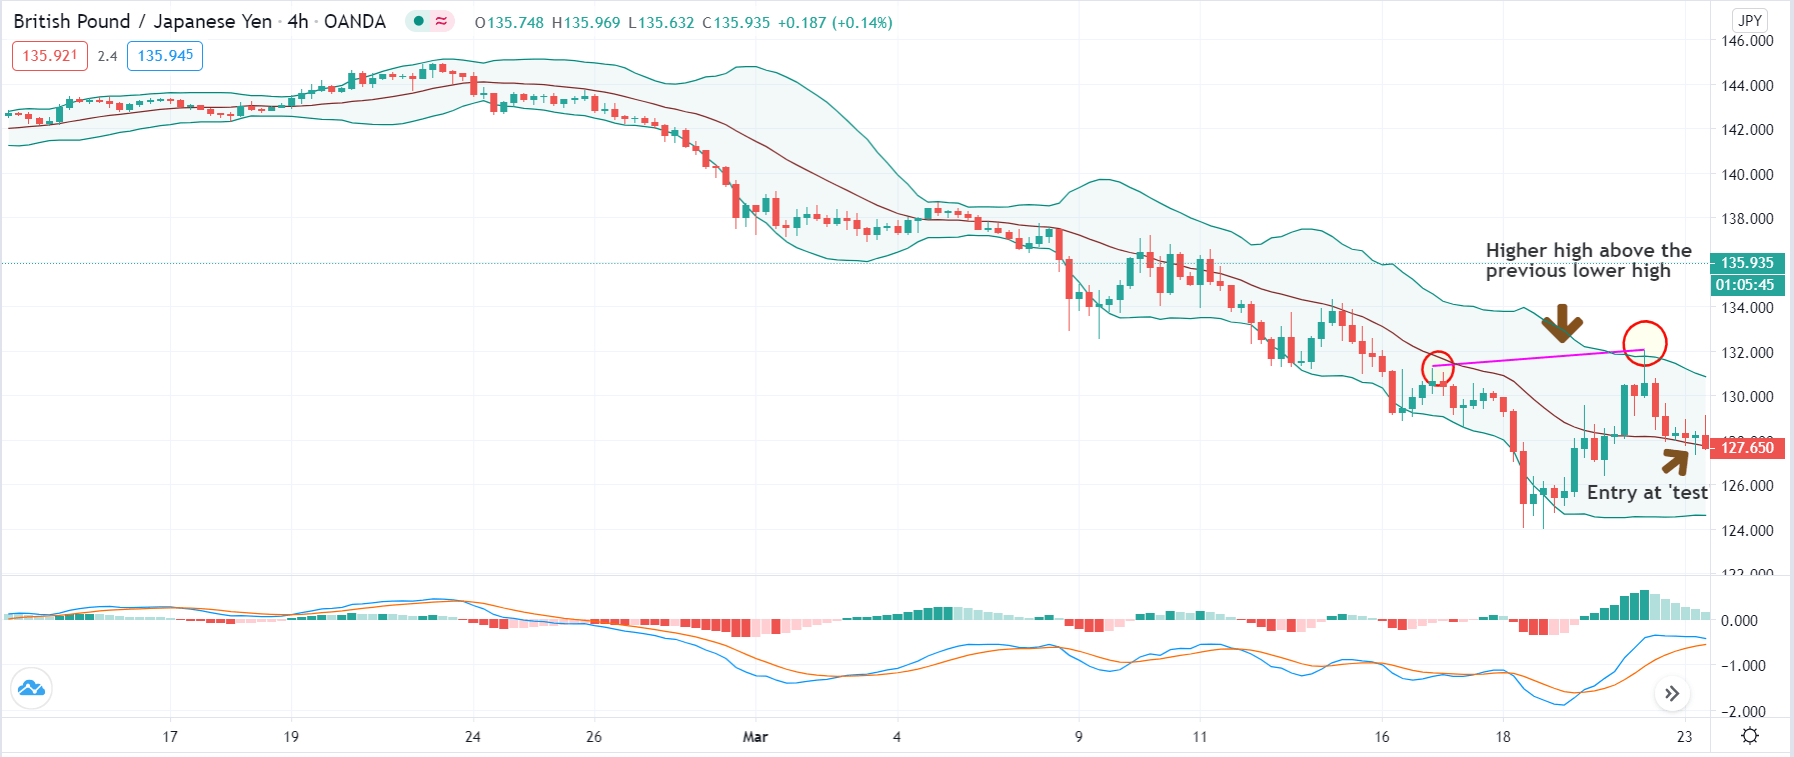
Step 3: In this step, we should make sure that the price makes a ‘high’ that is above the previous ‘lower high,’ in an upward reversal. While in a downward reversal (reversal of an uptrend), the price should make a ‘low’ that is lower than the previous ‘higher low.’ When all these conditions are fulfilled, we can say that the reversal is real, and now we will look to trade the reversal.

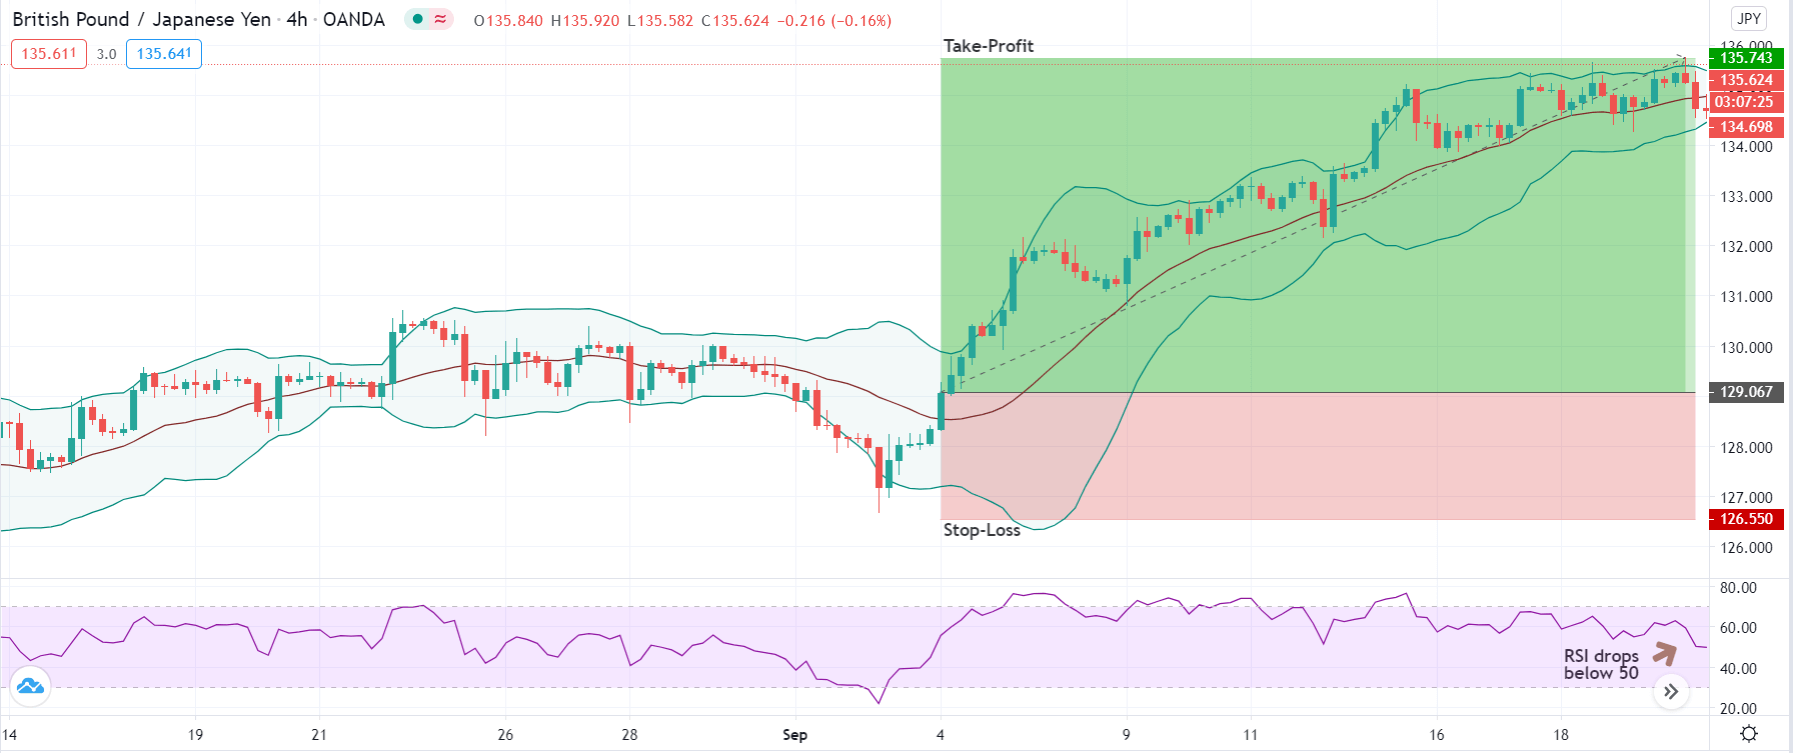
We enter the market for a ‘buy’ or ‘sell’ when price ‘tests’ the median line of the Bollinger band after the reversal and stays above (‘buy’) or below (‘sell’).

Step 4: Finally, after entering the trade, we need to define appropriate levels of stop-loss and ‘take-profit’ for the trade. The rules of stop-loss are pretty simple, where it will be placed below the lowest point of the downtrend in a ‘long’ position and above the highest point of the uptrend in a ‘short’ position. ‘Take-profit’ will be set such that the risk-to-reward (RR) of the trade is at least 1:1.5. Once the price starts moving in our favor, we will put our stop-loss to break-even and extend our take-profit level.

Strategy Roundup

The combination of the Bollinger band and MACD is not suitable for novice traders. Since it involves complex rules and indicators, we need prior experience of using the indicators and charts before we can apply the strategy successfully. Traders should pay attention to every rule of the strategy to gain the maximum out of it. As there many rules and conditions, there is a tendency among traders to skip some rules, but it is not advisable.

Categories
Crypto Guides

A Brief Guide to PancakeSwap – A Food Themed DeFi Protocol

Introduction

PancakeSwap is a food-themed new DeFi protocol. It is a cryptocurrency platform for direct exchange under the Binance Smart Chain (BSC). It has introduced many food-based farming associates in the crypto industry. Pancake allows community governance and investors to earn tokens by serving as a liquidity provider under the staking mechanism.

The whole protocol is executed on the Ethereum blockchain because it supports blockchain smart contracts, and it has huge community support who are continuously putting efforts to build decentralized applications. Pancake DeFi exchange allows swapping of BEP20 tokens. If you are familiar with SushiSwap, then you can easily grasp the PancakeSwap concept because both of them have the same incredible design. 

The PancakeSwap Exchange

The exchange platform works on an Automated Market Maker Model(AMM). In this model, the investor can trade with his digital assets and can invest in the liquidity pool. In these pools, users deposit funds and, in return, get Liquidity Provider tokens. With these earned tokens, they can reclaim their share from the trading commission. In PancakeSwap, the LP tokens are known as FLIP tokens. 

Staking Chain

In PancakeSwap, you are allowed to trade with a secondary token known as CAKE. On the farm, if you stake your LP tokens and lock them for the further process, then you will get CAKE in reward. You can deposit these different LP tokens listed below:

  1. CAKE-BNB FLIP
  2. BUSD-BNB FLIP
  3. ADA-BNB FLIP
  4. BAND_BNB FLIP
  5. DOT-BNB FLIP
  6. EOS-BNB FLIP
  7. LINK-BNB FLIP
  8. BAKE-BNB Bakery LP
  9. BURGER-BNB FLIP

There is one more token in this protocol known as SYRUP. If you have deposited funds to get LP tokens and have used these tokens to receive CAKE. Further, you can stake this CAKE token to earn a SYRUP token, which would provide you with governance functionality. 

Adding Liquidity

To access all the features of PancakeSwap, you need to unlock your crypto wallet. With this wallet, you can interact Binance smart chain based on Ethereum web applications. 

The BEP20 tokens movement will require your approval. You simply have to fix the amount you want to keep on stake, and you need to confirm the transaction. Then you can check the CAKE you have earned, and you can withdraw the amount anytime you want with the harvest option. To earn SYRUP, you have to keep your CAKE on the stake with the ‘Approve Cake’ option. Once you have staked your CAKE, you will get back an equal amount of SYRUP and can earn CAKE passively. 

Conclusion 

The Google of crypto – Binance jumped in Defi by introducing a new food protocol – PancakeSwap. PancakeSwap is launched by BSC, which is supported by a centralized exchange. It includes AMM, DEX, farms, and native token-CAKE. There are nine liquidity pools where you can deposit your funds. 25% of CAKE commission share is distributed to the SYRUP token holders. The anonymous developer team behind the PancakeSwap has warned that the smart contract is still unaudited and has high inherent risk. The fund invested in smart contracts always has a risk of bugs so, never deposit the amount if you can’t afford its loss. 

Categories
Forex Assets

Costs Involved While Trading The ‘CAD/TWD’ Forex Exotic Currency Pair

Introduction

The CAD/TWD is an exotic currency pair where CAD is the Canadian Dollar, and the TWD is referred to as the Taiwan New Dollar. In this pair, CAD is the base currency, and the TWD is the quote currency, which means that the exchange rate for the pair shows the quantity of TWD that can be bought by 1 CAD. In this case, if the exchange rate for the pair is 21.864, then 1 CAD buys 21.864 TWD.

CAD/TWD Specification

Spread

In the forex market, the spread is considered a cost to the trader. It is the difference between the ‘bid’ and the ‘ask’ price. Here are the spread charges for ECN and STP brokers for CAD/TWD pair.

ECN: 29 pips | STP: 34 pips

Slippage

When trading forex, slippage occurs when the execution price is below or above the price at opening the trade. The primary causes of slippage are the brokers’ speed of execution and market volatility.

Trading Range in the CAD/TWD Pair

The trading range in forex is used to analyze the volatility of a currency pair across different timeframes. This analysis gives the trader a rough estimate of how much they stand to gain or lose by trading that pair over a given timeframe. For example, say the volatility of the CAD/TWD pair at the 1-hour timeframe is 20 pips. Then, a trader can anticipate to either profit or lose $91.4

The trading range for the CAD/TWD pair is shown below.

The Procedure to assess Pip Ranges

  1. Add the ATR indicator to your chart
  2. Set the period to 1
  3. Add a 200-period SMA to this indicator
  4. Shrink the chart so you can determine a larger period
  5. Select your desired timeframe
  6. Measure the floor level and set this value as the min
  7. Measure the level of the 200-period SMA and set this as the average
  8. Measure the peak levels and set this as Max.

CAD/TWD Cost as a Percentage of the Trading Range

For us to understand the trading costs associated with the volatility, we will determine the total cost for both ECN and STP accounts as a ratio of the above volatility.

ECN Model Account

Spread = 29 | Slippage = 2 | Trading fee = 1

Total cost = 32

STP Model Account

Spread = 34 | Slippage = 2 | Trading fee = 0

Total cost = 36

The Ideal Timeframe to Trade CAD/TWD

From the above analyses, we can conclude that it is costlier trading the CAD/TWD pair on shorter timeframes when volatility is low. Longer timeframes, i.e., the weekly and the monthly timeframes, have lesser trading costs. Therefore, it would be more profitable trading the CAD/TWD pair over longer timeframes.

However, for intraday traders, opening positions when the volatility is above the average will reduce the trading costs. More so, using forex limit orders instead of market orders will reduce the trading costs by eliminating the costs associated with slippage. Here’s an example.

ECN Account Using Limit Model Account

Total cost = Slippage + Spread + Trading fee

= 0 + 29 + 1 = 30

You can notice that using the limit orders significantly reduces the cost as a percentage of the trading range.

Categories
Forex Indicators

Everything About ‘Treasury Bill Auction’ Macro Economic Indicator

Introduction

One of the primary ways any government funds its budget is through debt – borrowing. When borrowing, a government can do this from the international markets or locally, from its citizens and businesses. When taking debt locally, a government uses treasury bills and bonds. As is with any form of debt, borrowing using treasury bills, the government is obligated to pay interest upon the maturity date.

The interest rate that the government offers for its treasury bills gives an invaluable insight into the confidence investors have in the economy. Therefore, to understand the borrowing patterns of the government, the interest rates it is obligated to pay, we need to understand treasury bill auctions.

Understanding Treasury Bill Auction

To better understand how the treasury bid auction works, we first need to understand a few terms.

Treasury bill is a short-term debt instrument used by governments to borrow money over a short period – usually less than one year. Because the central banks back the treasury bill, they are considered to be of lower risk and secure form of investment.

Treasury bill auction is a weekly public offering of treasury bills by the central government with maturities ranging from one month to one year. The auction is the official avenue through which central banks issue their treasury bills.

Maturity is the maximum time that a treasury bill holder can hold it before they are eligible for redemption. Treasury bills have maturities ranging from days up to one year. Note that the longer the maturity period of a treasury bill, the higher the interest rate will be.

Discount is the difference between the price at which the treasury bills are issued and the face value of the treasury bills. It is customary for the treasury bills to be issued at a discount and be redeemed at face value upon maturity.

During the auctions, participants are generally divided into two categories – competitive and non-competitive bidders. Before the auctioning process begins, the central banks make public the following information about the treasury bills: the date of the auction; the day of the treasury bill issue; eligibility of auction participants; the amount of the bills being auctioned; and the time when the bidding ends.

When the auction begins, the competitive bids are accepted first to determine the discount rate for the treasury bills. These competitive bills are submitted on a pro-rata share of every Treasury bill auction. It is worth noting that the winning bid determines the interest rate that will be paid out on each issue of a treasury bill. Furthermore, the demand for treasury bills is determined by the prevailing market and economic conditions and sentiment. It is this demand and the interest rate that will be of importance in our subsequent analyses.

Since the pricing of the treasury bills is done through a bidding process, the winning bid is usually one that has the lowest discount rate. Such bids are preferred to ensure that the interest rate the government pays investors is kept as low as possible.

After investors have purchased the treasury bills, they are then free to sell, trade them, or hold until maturity.

How can treasury bills auction be used for analysis?

Using the auction of the treasury bills in the analysis is relatively straightforward. The biggest draw of the treasury bills is because of the presumed zero risks of default since the government backs them. As we mentioned earlier, the primary determinant of the discount rate at the treasury bill auction is the demand. This demand is driven by factors such as macroeconomics, market risks, and monetary policies.

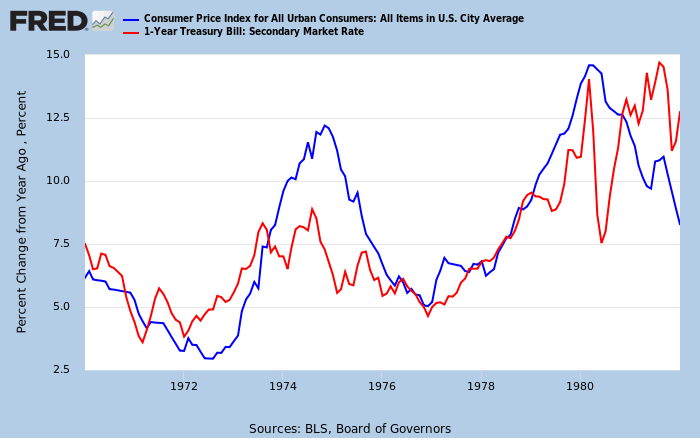
When other markets such as equity markets appear to be less risky or offer better returns, investors in the treasury bills will demand higher discounts. The higher discount translates to a higher interest rate attached to the treasury bills. Furthermore, when the rate of inflation is rising, investors will demand a higher discount rate for the treasury bills to offset the effects of inflation.

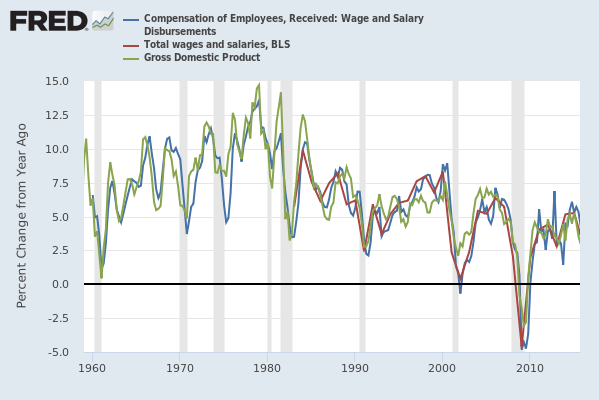
Source: St. Louis FRED

When there is rapid economic growth, investors have several options that could earn them higher returns. Therefore, they will demand a higher discount from the government, which results in a higher rate. Similarly, when the economy is heading towards a recession, investors deem treasury bills as safe-haven investments. The resulting excess demand for the treasury bills leads to lower discounts received by the investors.

Thus, the change in the yield attached to the treasury bills gives us significant insight into the state of the economy.

Impact on currency

We have seen that the rate of the treasury bills being auctioned is a reflection of the prevailing market conditions or anticipated economic performance.

When the rate received at auction is higher, it signals that the economy is performing well. Furthermore, higher rates for the treasury bills imply that there will be increased interest in investment opportunities in the country, which results in increased demand for the local currency. Higher rates could also translate to the increasing rate of inflation, which forestalls contractionary monetary and fiscal policies. For the forex market, this translates to a well-performing economy hence the appreciation of the currency relative to other currencies.

Conversely, when the rate of treasury bills at auction are falling, it implies that the economic fundamentals are performing poorly. There will be a net outflow of capital and investment. Furthermore, the forex market would anticipate expansionary monetary policies, which result in the depreciation of the currency relative to others.

Sources of Data

In the U.S., the treasury bills are auctioned by the U.S. Department of Treasury. You can access the latest data on the auction of treasury bills here. The data on the upcoming auction of the U.S. treasury bills can be accessed from TreasuryDirect, which allows you to buy and redeem securities directly from the U.S. Department of the Treasury in paperless electronic form. You can access the in-depth review of the current and historical data on the U.S. treasury bills from St. Louis FRED. You can access the global data on Treasury bills from Trading Economics.

That’s about Treasury Bill Auction and the respective details related to this fundamental indicator. We did not see any reaction at all on the Forex price charts related to this indicator, but as explained above, we know the relative impact. We hope you have found this article informative. Cheers!

Categories
Crypto Guides

Is EOS A Better Investment Than Ethereum Right Now?

Introduction

EOS and Ethereum both are popular blockchain smart contract platforms. To know whether EOS is a better investment or Ethereum, we will need to compare the two technologies by exploring basic concepts and comparing their mechanisms to draw out the necessary conclusions. After Ethereum was introduced in the crypto industry, two years later, EOS was launched and claimed to fix the flaws in Ethereum. EOS is a strong, scalable contender and might outperform Ethereum. The battle of EOS vs. Ethereum is the most interesting and happening space in the crypto industry. 

What is Ethereum?

Ethereum is a blockchain platform launched in 2015 by Vitalik Buterin. It allows users to send and receive funds independently without the assistance of any third party. It was the first blockchain project to install the smart technology contract. In this technology, some predefined conditions are applied, and users are needed to justify the conditions to proceed with transactions without the need for an intermediate body. This decentralized blockchain has its own cryptocurrency called Ether (ETH), which is tradable in most of the crypto exchanges. 

What is EOS?

EOS is a new blockchain platform that can also manage smart contracts. The Block.one company launched this project in 2017. It has created history by raising the highest Initial Coin Offering(ICO), worth more than $2.5 billion. It has its own EOS coin, which can be transferred from wallet to wallet. EOS aims to become the most scalable, cheapest, and fastest blockchain platform. 

Scalability

Presently Ethereum can support 15 transactions per second, whereas EOS can serve up to at least 10,000 transactions/second. EOS using IoT provides for inter-blockchain communication, which creates blockchains to allow more transactions. Ethereum is working on two protocols called “Plasma” and “Sharding” to increase transaction numbers per second. 

Transaction Cost

On Ethereum, users need to pay gas for each transaction, but EOS works completely in a different way. EOS blockchain users deposit their token to cover the bandwidth required for the transaction. 

Consensus Mechanism

Ethereum is based upon the proof-of-work model, and EOS follows the proof-of-stake model. The transactions are verified without the support of any intermediate system. Ethereum generates random puzzles at every node before confirming the transactions. These puzzles are so difficult to solve that you need to take the help of experts called “Miners.” While EOS offers to stake your coins to verify transactions, the stakers have a chance to earn the rewards. 

EOS Vs. Ethereum: Who holds the future?

Ethereum, just after Bitcoin, is the most popular cryptocurrency across the world. EOS, right from its initial days, is performing exceptionally well. EOS is yet to achieve growth that Ethereum has already achieved, but EOS is significantly better than Ethereum. EOS is a more user-friendly cryptocurrency than ETH. It’s still too early to think about how far EOS will go because the blockchain ecosystem is highly unpredictable. 

Conclusion 

EOS is younger than Ethereum and has improved scalability and transaction fees as compared to Ethereum, but still, it’s under so much controversy because of its more centralized layout. If Ethereum successfully implements the proof-of-stake mechanism, then EOS might not be able to outperform it. On the other hand, if Ethereum doesn’t reduce it’s transaction costs, then EOS will easily overtake Ethereum soon is what crypto experts believe. Cheers! 

Categories
Forex Course

147. How To Detect A Fakeout like a professional Forex trader?

Introduction

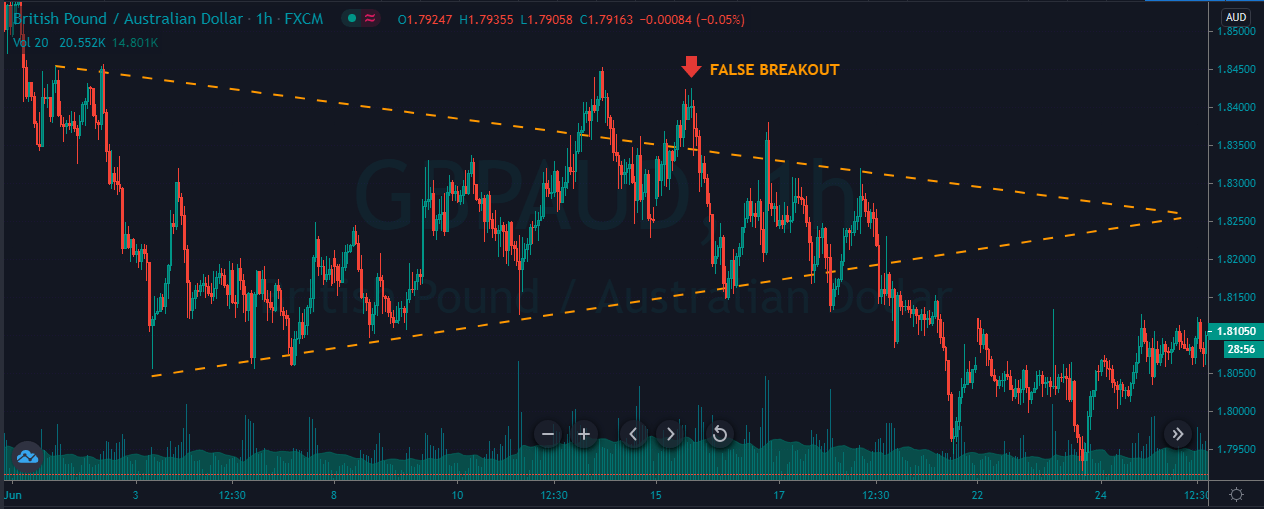
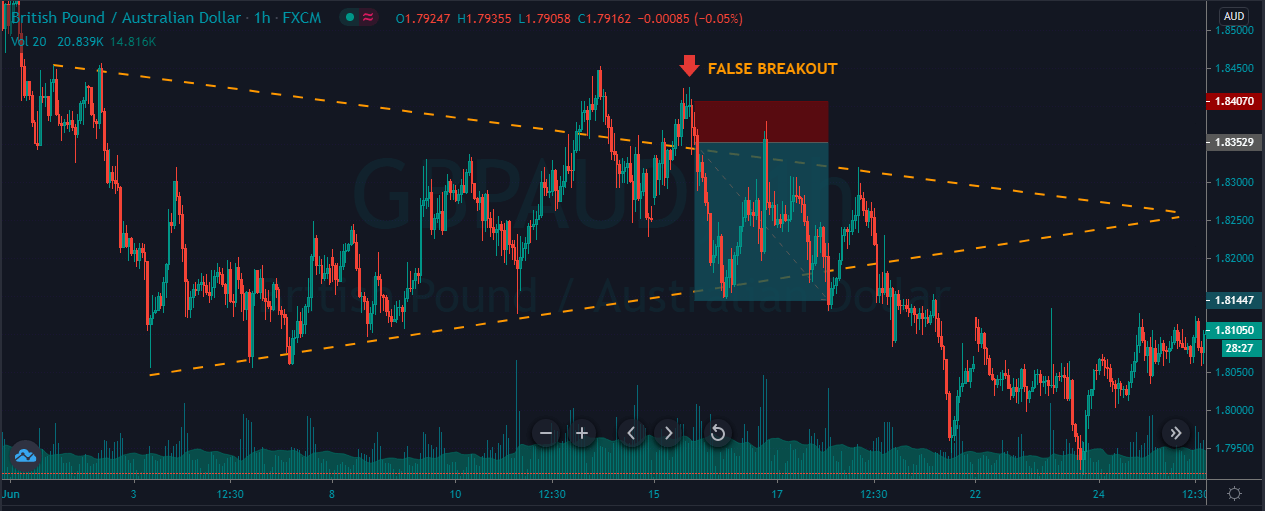
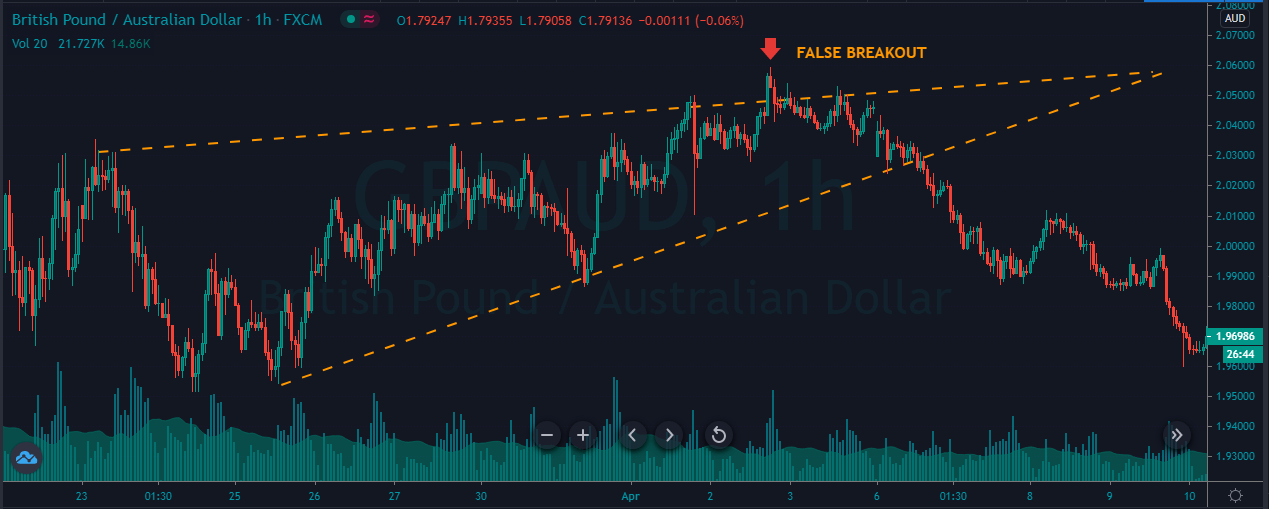
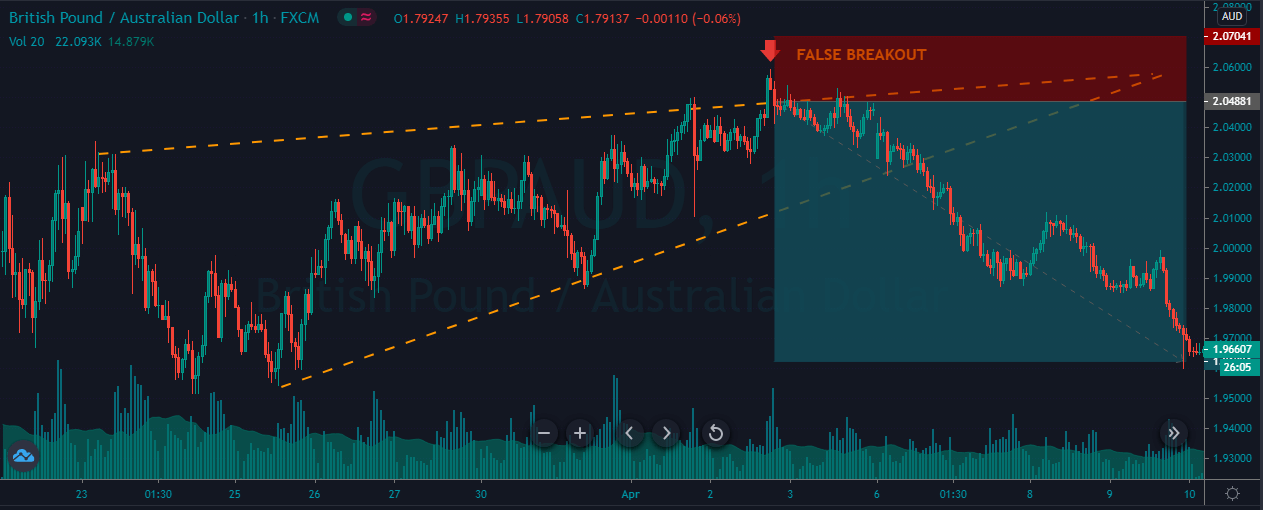
It is a general perception among Forex traders that the fakeouts are caused by the banks and large institutional players to stop retail traders players from moving the market in their desired directions. Although there is no evidence to prove this theory, we believe it is true. The manipulation is done by the big players. A fakeout is simply a failed breakout, and most of the time, they occur at significant areas like support, resistance, trend lines, Fibonacci retracement levels, and chart patterns, etc.

Typically, fakeouts are the result of a battle between both the parties on the price chart. So if you are witnessing a range and if we see both the parties printing aggressive candles, we can expect more fakeouts. The same applies to the trending markets as well. The aggressive battle between the buyers and sellers for domination leads to frequent fakeouts.

Trading Fakeouts

It is a common perception that it is impossible to trade these fakeouts, but that is not true. We can trade fakeouts, but a lot of market understanding is required to do so.

#1 Strategy 

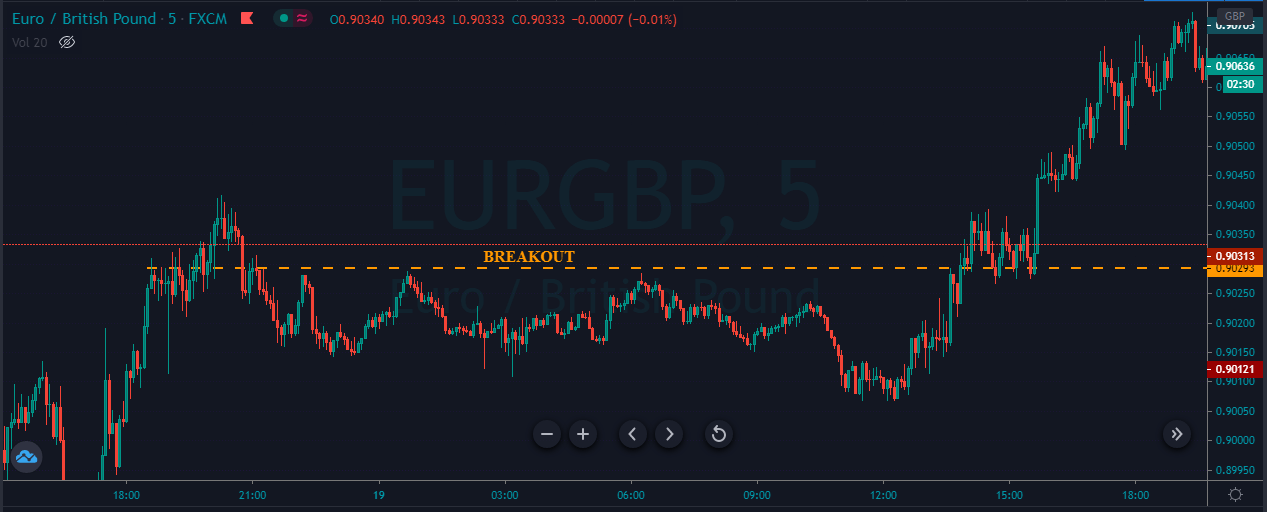
The image below indicates a fakeout followed by an actual breakout in the EUR/GBP Forex pair.

As we can see below, when the price breaks above the breakout line, it started to hold there. If it didn’t hold, it means that the price goes above and came back into the range. So in our case, hold above the breakout line confirms that the price is not going to fake out, and riding the buy trade from here will be a good idea.

#2 Strategy 
Buy Example

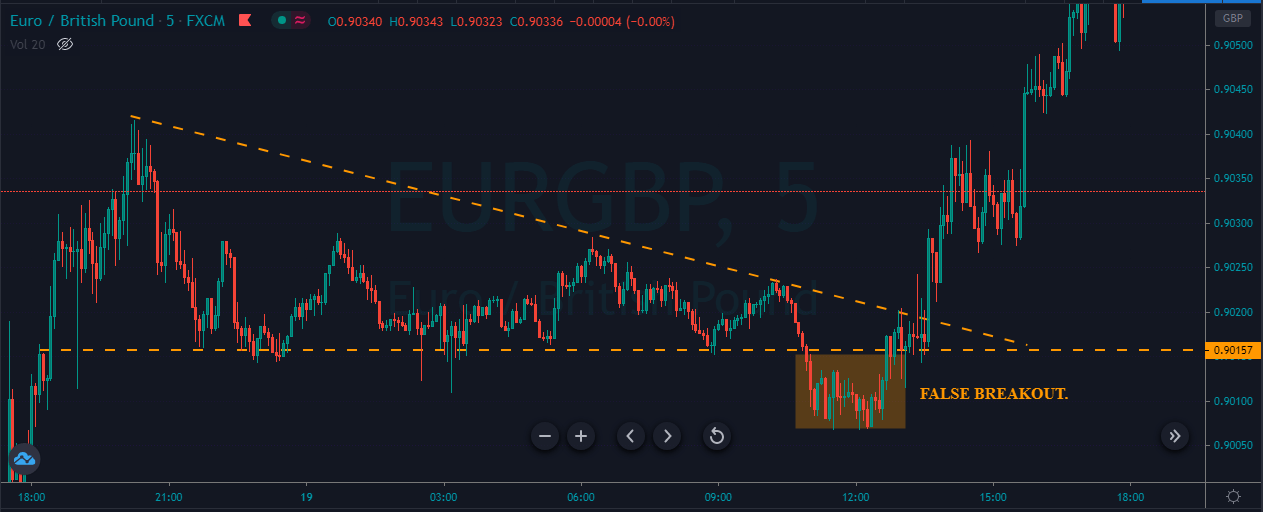
The image below indicates a false breakout in this Forex pair.

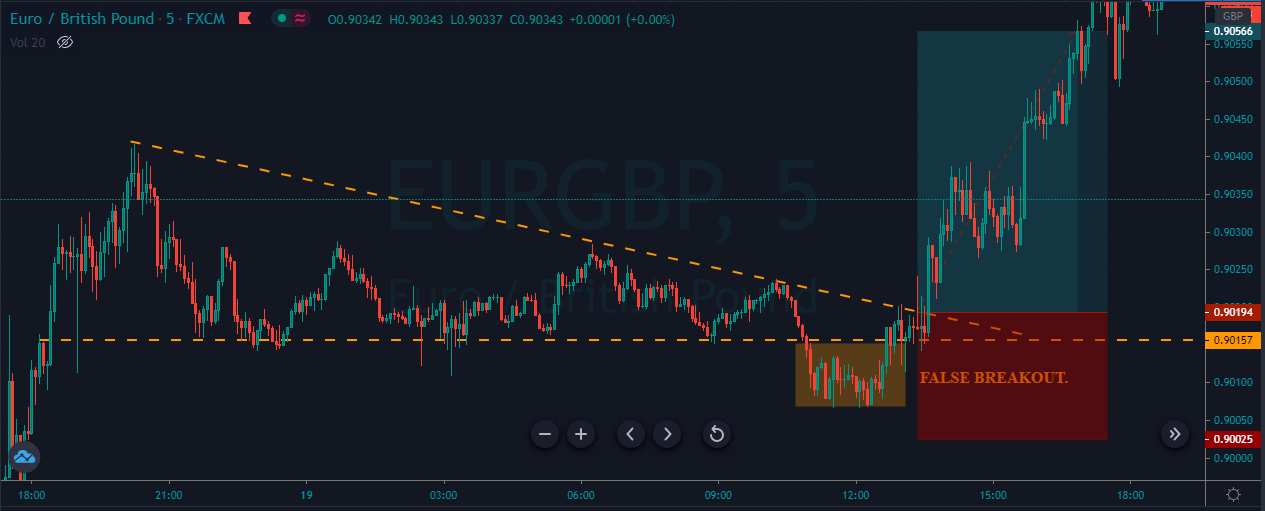
As you can see below, we choose to enter a buy trade after the price action fakes below the major support area. We can see that it is eventually coming back and holding at the support area. This holding support clarifies that the sellers failed to move the market.

Now buyers are coming back and holding the market to go for a brand new higher high. We can see that price action respecting the trendline for a while, but then it breaks above the line, printing a brand new higher high.

Sell Example

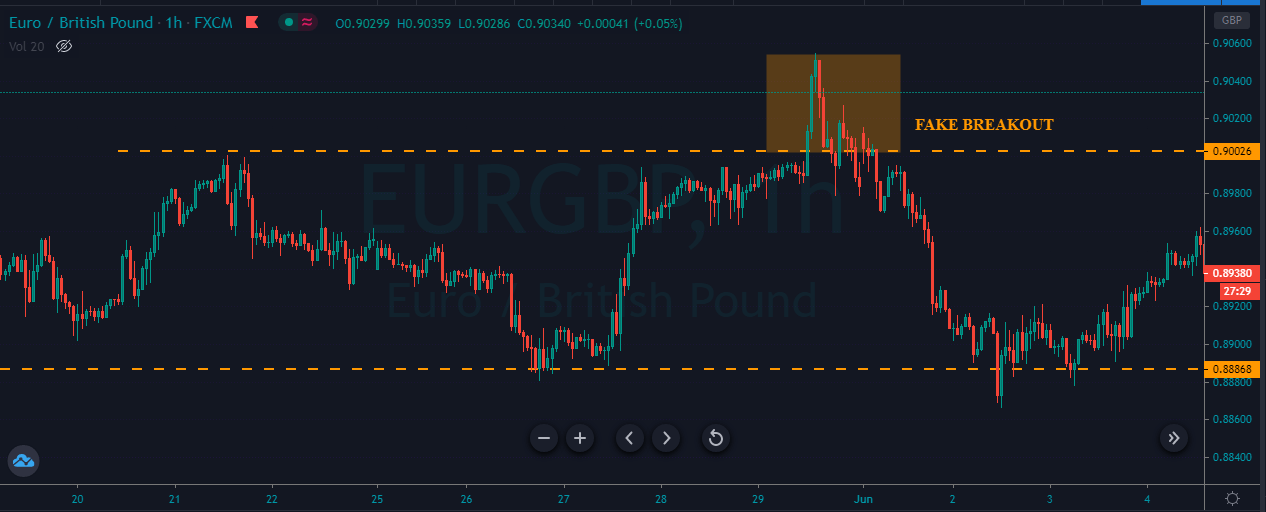
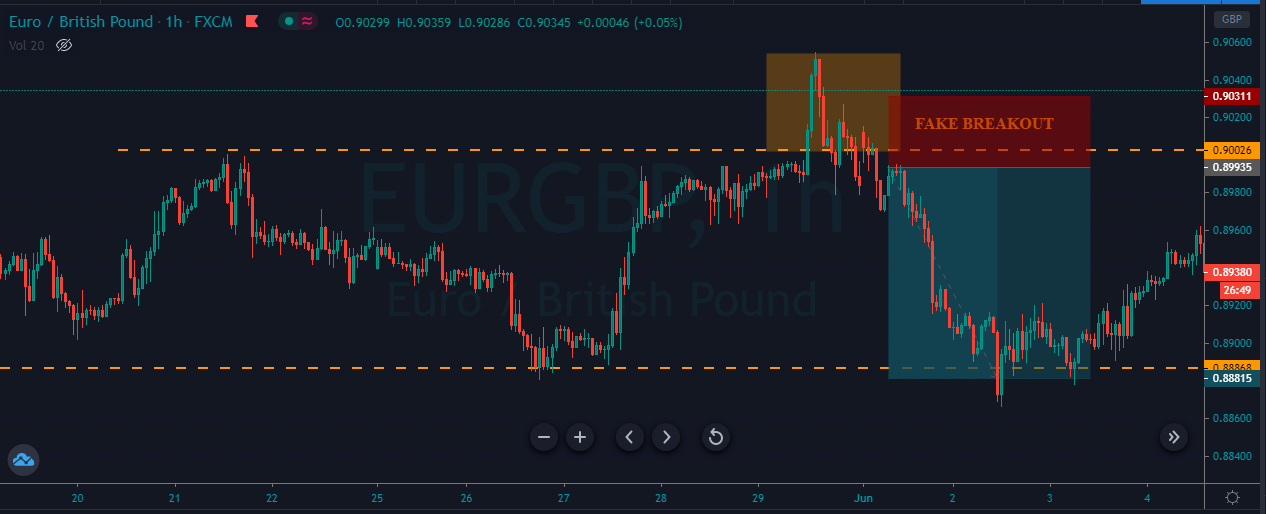
The image below indicates the appearance of a faker on the EURGBP sixty-minute chart.

The image below represents our entry, exit, and stop-loss in this Forex pair. The pair was in an uptrend, and as it tries to go above the resistance line, it immediately came back and stated holding below the resistance line. This confirms the faker, and after our entry, prices go back to the most recent lower low.

That’s about identifying Fakeouts and how to trade them. Please be sure to trade these fakeouts only when you are absolutely sure about them. All the best.

Categories
Forex Basic Strategies

Trading Forex Majors and Crosses Using The ‘Awesome’ Strategy

Introduction

The Bollinger Bands is a technical analysis tool that uses a statistical measure of the standard deviation to establish levels of highs and lows in a trend. The upper band shows a level that is statistically high, and the lower band shows a statistically low level. The width correlates to the volatility of the market. This means, in volatile markets, Bollinger bands widen while in less volatile markets, the bands narrow.

In today’s strategy, we utilize this feature of the Bollinger band to anticipate a reversal in the market. But Bollinger bands alone are not sufficient in generating reliable signals. Along with the Bollinger bands, we use the Awesome Oscillator to confirm the reversal of a trend. Let us understand how both indicators can be combined to generate reversal signals.

Time Frame

Time frames suitable for trading this strategy are 1 minute, 5 minutes, and 15 minutes. Therefore, this a perfect strategy for ‘Scalpers.’

Indicators

Three indicators are applied to the chart listed below.

  • Bollinger bands (20,2)
  • Bill Williams’ Awesome Indicator
  • Exponential Moving Average (EMA)

Currency Pairs

The ‘Awesome’ strategy should ideally be traded with major forex currency pairs only. Liquidity and volatility are especially necessary for the strategy to work at its best, which is provided only by major pairs. Some preferred ones are EUR/USD, USD/JPY, AUD/USD, GBP/USD, GBP/JPY, EUR/JPY, CAD/JPY, and NZD/USD.

Strategy Concept

Apart from the Bollinger band, we use the awesome oscillator indicator that attempts to gauge whether bearish or bullish forces are driving the market. It market momentum indicator, which compares recent market movements to historical movements. It uses a line in the center, either side of which price movements are plotted according to a comparison between two different moving averages. We use this awesome oscillator to forecast a shift in market momentum and whether the prevailing trend will continue or reverse.

We look for ‘buy’ opportunities when EMA crosses up through the middle Bollinger band. At the same time, the Awesome Oscillator should be crossing above the zero levels. This is the first part of the reversal. We execute a ‘long’ trade at the ‘test’ of the previous ‘lower high’ that is a part of the earlier trend.

For ‘sell’ trades, we are looking for the opposite conditions of buy trades. The first condition being that the EMA crosses below the middle Bollinger band. At the same time, Awesome Oscillator also crosses below the zero-line. Finally, we enter at the ‘test’ of the ‘higher low’ of the previous trend.

A stop-loss a placed below the lowest point of the downtrend in an upward reversal while it will be above the highest point of the uptrend in a downward reversal.

Trade Setup

In order to execute the strategy, we have considered the 5-minute chart of AUD/USD, where we will be illustrating a ‘long’ trade. Here are the steps to execute the strategy.

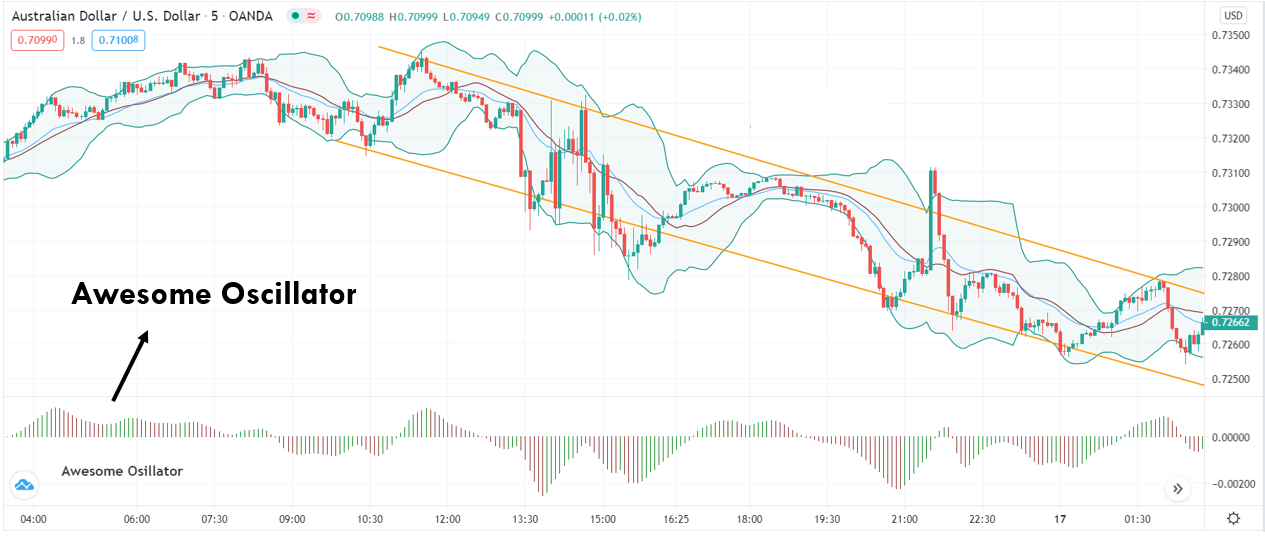
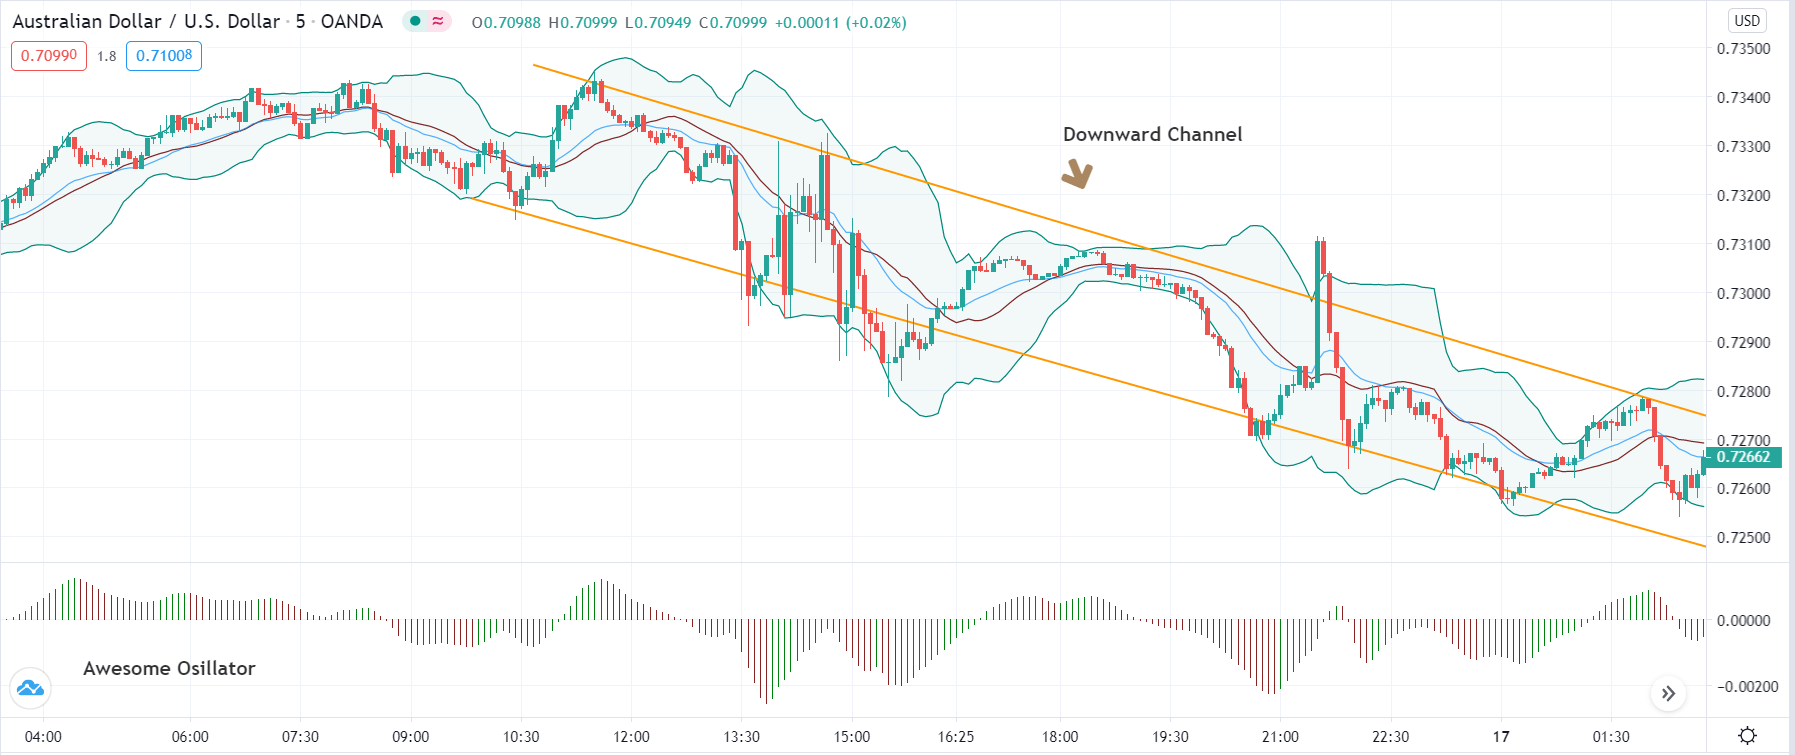
Step 1: The first step is to identify the direction of the market. We can do this in two ways. If the price is making higher highs and higher lows, the market is said to be in an uptrend. While if the price is making lower lows and lower highs, the market is in a downtrend. The trend becomes clearer when price moves in a channel and plot the same on the chart.

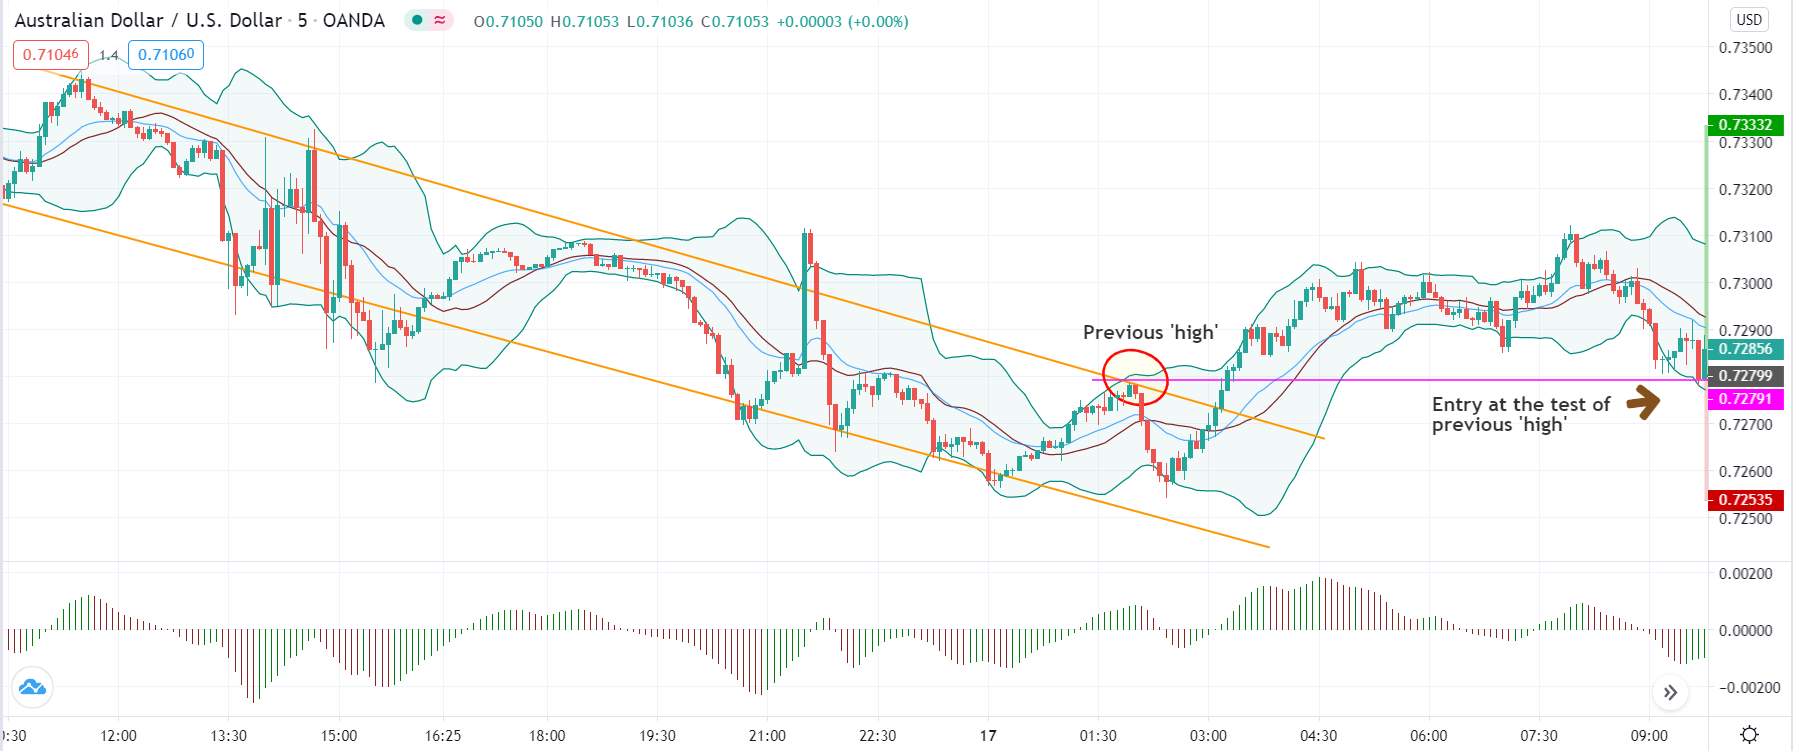
In the case of AUD/USD, we have identified a downward channel, as shown in the below image.

Step 2: After identifying the direction, we need to wait for a reversal in the market. We can say that a reversal is taking place in the market when price breaks the trendline and starts moving in the same direction. Trendline break is not enough. Here’s where the indicators Bollinger band, EMA, and Awesome Oscillator come handy.

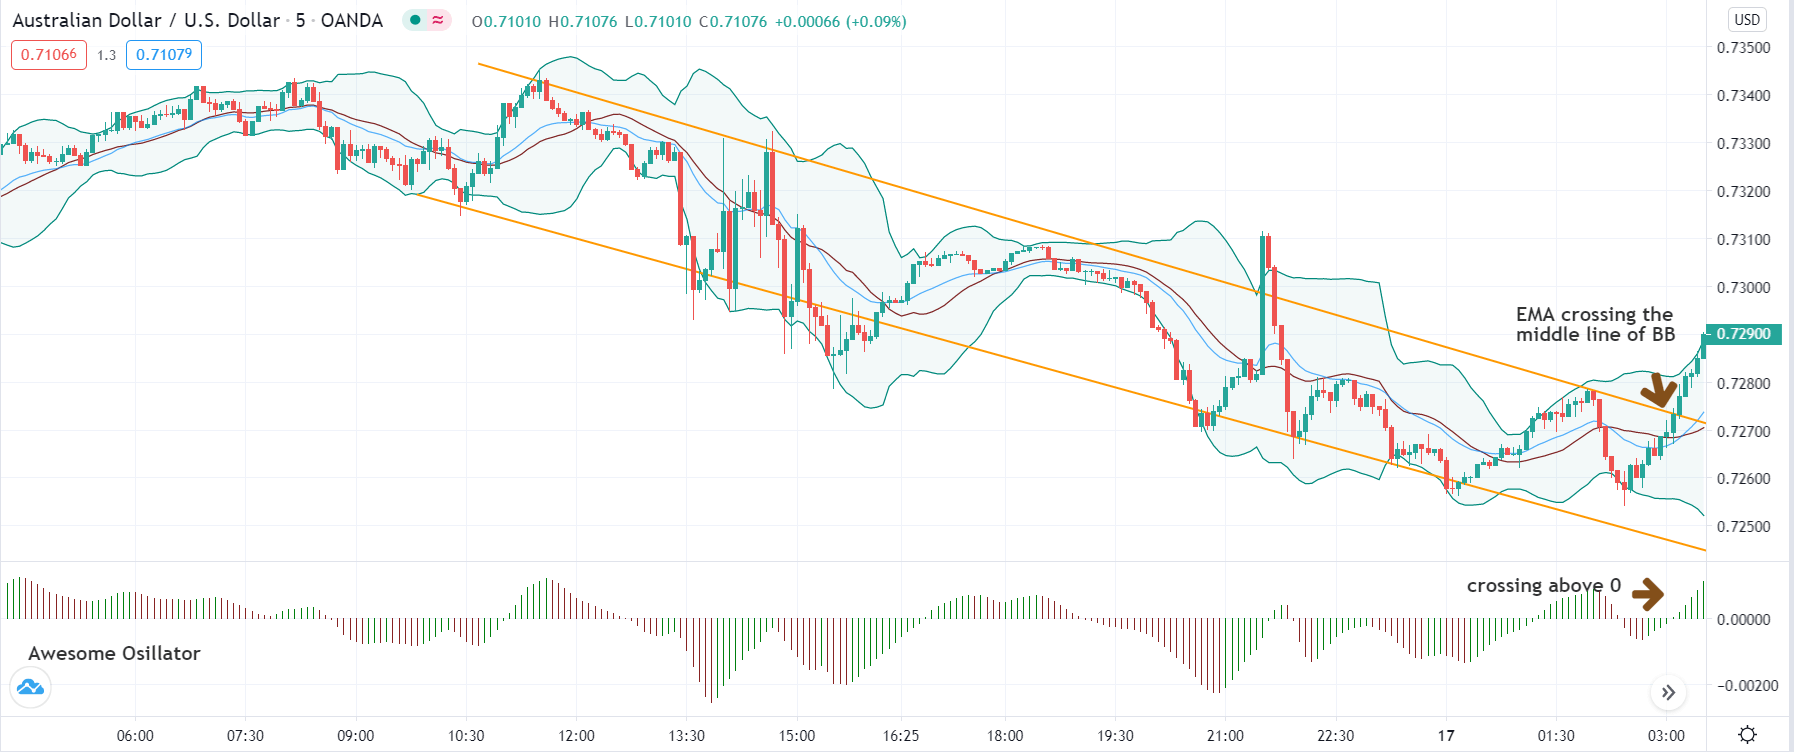
In case of a downtrend, the reversal is confirmed when EMA crosses above the middle line of the Bollinger band, and the Awesome Oscillator moves from negative to positive zone. While in an uptrend, the reversal is confirmed when EMA crosses below the middle line of the Bollinger band and Awesome Oscillator goes below the ‘zero’ level. However, we do not enter the market soon after this, where we need one last thing before that.

The below image shows that when the price is not able to make another ‘lower low,’ it reverses to the upside and breaks out of the channel. At the same, price EMA crosses above the middle line of BB, and Awesome Oscillator becomes ‘positive.’

Step 3: Now, let us discuss how to enter a trade. In a downtrend reversal, we enter the market for a ‘buy’ when the price tests the ‘lower high’ of the earlier trend and puts up a bullish candle. This is when we enter with an appropriate stop-loss and take-profit. Similarly, in an uptrend reversal, we enter for a ‘sell’ when price tests the ‘higher low’ of the previous trend and puts up a bearish candle.

As shown in the below image, we enter ‘long’ only when the price reacts from the ‘lower high’ of the previous downtrend and moves higher.

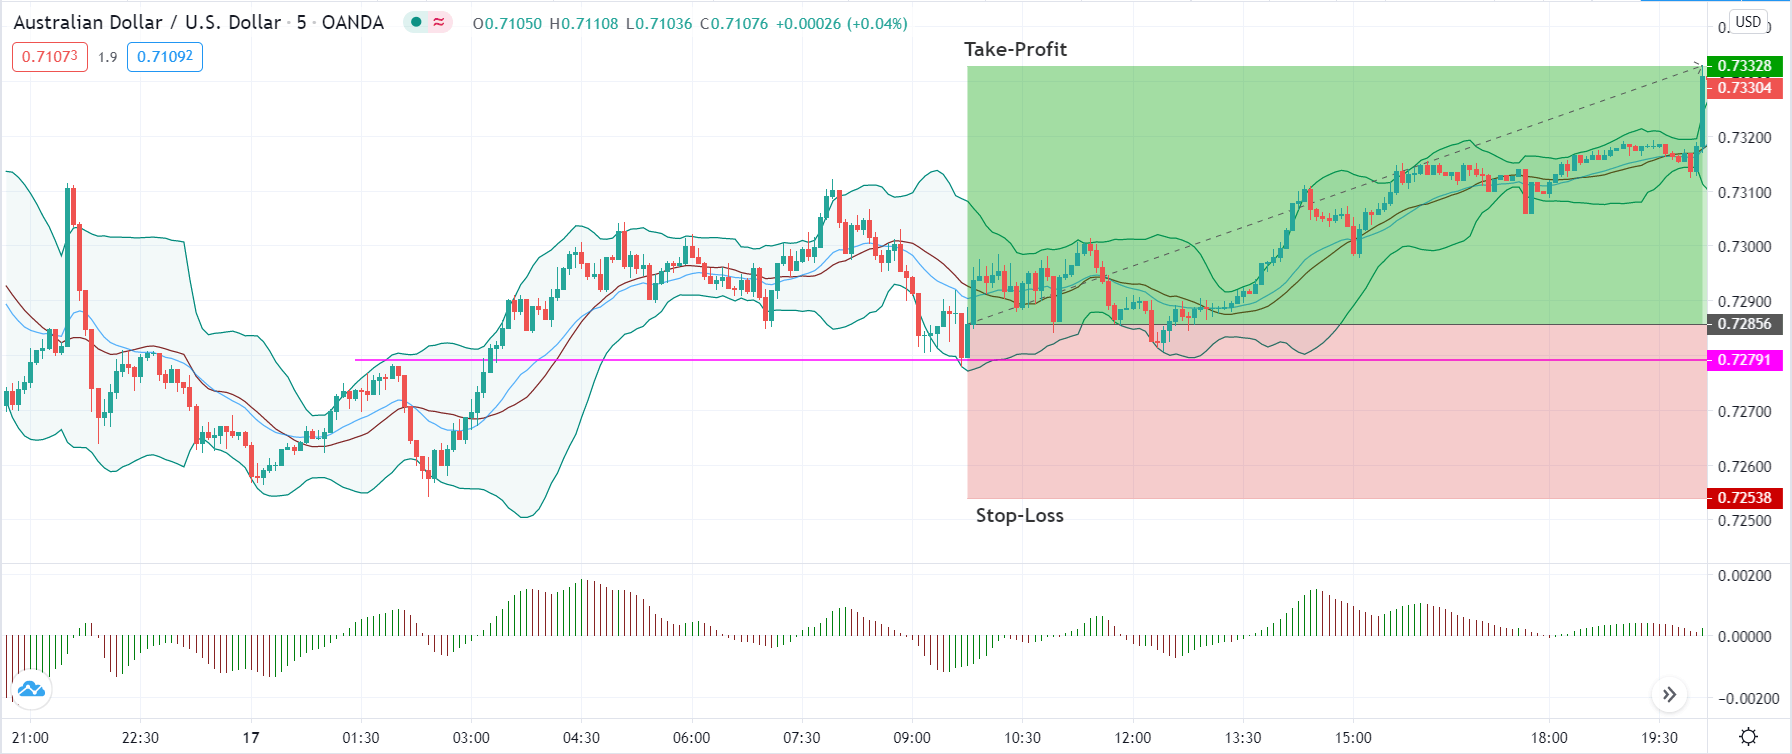
Step 4: Lastly, we determine the stop-loss and take-profit levels for the strategy. In a ‘buy’ trade, the stop-loss is placed below the lowest point of the previous trend, nothing but the lower low. While in a ‘short’ trade, it is placed at the highest point of the previous trend, nothing but the higher high. The take-profit is set in a manner where the risk-to-reward of the trade is at least 1:1. But since we are trying to grab a major reversal of the market, we move our stop-loss to break even once the market gets closer to the take-profit area.

Strategy Roundup

While it can get take a lot of effort to apply all the rules of strategy, it gets easier after little practice. Pay attention to the Awesome Oscillator, where it clearly indicates the shift in momentum in the market. Aggressive traders can also enter the market without waiting for additional confirmation from the ‘lower high’ or ‘higher low.’ All the best.

Categories
Forex Assets

Trading The ‘CAD/MYR’ Forex Exotic Currency Pair

Introduction

The CAD/MYR is an exotic Forex currency pair where CAD is the Canadian Dollar, and the MYR is the Malaysian Ringgit. In this pair, CAD is the base currency, while the MYR is the quote currency. The price associated with this pair represents the amount of MYR that can be traded for 1 CAD. For example, if the price of the CAD/MYR is 3.1163, it means that 1 CAD can purchase 3.1163 MYR.

CAD/MYR Specification

Spread

When trading a currency pair, the ‘bid’ price and the ‘ask’ price are different. This difference constitutes the revenues that brokers earn, and is called the spread. Below is the spread charges for ECN and STP brokers for CAD/MYR pair.

ECN: 4 pips | STP: 9 pips

Fees

Fees represent the charges that brokers impose on forex traders when opening a position. These charges vary on the ECN account, depending on your forex broker. STP accounts usually do not charge fees for trading.

Slippage

Sometimes we intend to complete a trade with a prevailing price, but instead, the trade is executed at a different price. The difference between the two prices is slippage, and it is a result of market volatility and your broker’s speed of execution.

Trading Range in the CAD/MYR Pair

The trading range shows the volatility of a currency pair across different timeframes from minimum to the maximum expected volatility. The knowledge of market volatility can help a trader estimate possible gains or losses for different timeframes. Let’s say that the maximum volatility for the CAD/MYR pair at the 1-hour timeframe is 20 pips. A forex trader trading one standard lot of this pair can expect to gain or lose $64.2

Below is the trading range for the CAD/MYR pair.

The Procedure to assess Pip Ranges

  1. Add the ATR indicator to your chart
  2. Set the period to 1
  3. Add a 200-period SMA to this indicator
  4. Shrink the chart so you can determine a larger period
  5. Select your desired timeframe
  6. Measure the floor level and set this value as the min
  7. Measure the level of the 200-period SMA and set this as the average
  8. Measure the peak levels and set this as Max.

CAD/MYR Cost as a Percentage of the Trading Range

When the cost of trading is expressed as a percentage of the trading range, it can help a forex trader implement proper risk management measures. Below are cost analyses of the CAD/MYR pair for both the ECN and the STP accounts.

ECN Model Account

Spread = 4 | Slippage = 2 | Trading fee = 1

Total cost = 7

STP Model Account

Spread = 9 | Slippage = 2 | Trading fee = 0

Total cost = 11

The Ideal Timeframe to Trade CAD/MYR

In both the ECN and STP accounts, the 1-hour timeframe during minimum volatility of 0.1 pips has the highest trading cost. Generally, the 1H, 2H, 4H, and daily timeframes have higher trading costs compared to the weekly and the monthly timeframes. Therefore, longer-term traders of the CAD/MYR pair enjoy lesser trading costs.

However, the intraday traders can reduce their trading costs by initiating trades when the volatility for the 1H, 2H, 4H, and daily timeframes is above average. They can further lower these costs by using the forex limit orders, which eliminates the slippage costs. Here’s an example with the ECN account.

ECN Account Using Limit Model Account

Total cost = Slippage + Spread + Trading fee

= 0 + 4 + 1 = 5

You can notice that the overall trading costs have reduced when the limit orders are used. For example, the highest trading cost has been lowered from 118.64% to 84.75% of the trading range. Cheers.

Categories
Forex Fundamental Analysis

What Should You Know About ‘Social Security Rate For Companies’ Forex Fundamental Indicator?

Introduction

Social Security Program is one of the most extensive Government programs in the world that pays out billions of dollars to its citizens each year. Social Security is a macroeconomic program intended to act as a safe-net for active workers of the United States. Changes related to this program tends to affect the majority of the population. Hence, understanding its role and impact on the living conditions of people can give us a better insight into how such programs work.

What is Social Security Rate For Companies?

Social Security Program: The Social Security Program is designed to facilitate retirement benefits, survivor benefits, and disability income for the citizens of the United States. It is run by the federal agency known as Social Security Administration. Social Security is the word used for the Old-Age, Survivors, and Disability Insurance (OASDI) program.

The program was born on August 14, 1935, where President Franklin D. Roosevelt signed the Social Security Act into law of the United States. Since then, the program has continuously evolved and changed significantly over the years. It is a government insurance program designed to act as a safety net for the working population in the United States.

To be eligible for the Social Security retirement benefits, the worker must have an age of 62 at a minimum and should have enrolled and paid into the program for ten years or more. Workers who wait till later ages like 66 or 70 receive higher and higher benefits accordingly.

Apart from the worker himself, a divorced spouse can also be eligible for benefits provided she has not remarried, and their marriage lasted over ten years. Similarly, children of retirees can also be eligible until the age of 18, which can be longer in the case of disability or child being a student.

Social Security Tax: It is the tax levied upon both the employer and employee to fund the Social Security Program (SSP). It is collected as a payroll tax as mandated by the Federal Insurance Contributions Act (FICA) and the Self-Employed Contributions Act (SECA).

Social Security Rate: For the year 2020, the Social Security Rate is 12.4% that is evenly divided between the employee and the employer. It implies the Social Security Rate for Companies is 6.2%.  Social Security Tax is levied on the earned income of employees and self-employed taxpayers. Employers generally withhold this tax from the employee’s paycheck and forward it to the Government.

It is also worth mentioning that there is a tax cap to the Social Security Fund. For 2020, the Social Security tax cap is $137,700, meaning any income earned above 137,700 is not subject to the Social Security tax.

How can the Social Security Rate For Companies numbers be used for analysis?

Social Security is regressive, meaning it takes a more significant percentage of income from low-income earners than their higher-income counterparts. It occurs because of the tax cap, as mentioned earlier, due to which higher-income earner’s portion of income is not subject to this tax deduction.

The collected funds are not stored for the currently paying employee; instead, they are used for the retirees currently eligible for collection. Some have raised concerns on this way of approach when the baby boomer generation starts to collect its benefits, then the ratio of paying to the collecting people would be tipped off. It would mean that more people are collecting benefits than the people paying into it.

Hence, a common worry in the 21st century is the insolvency of the Social Security Funds due to the increased life expectancy of people and decreasing worker-retiree ratio. Proposed solutions to this from analysts were to increase the current rate to keep the program funded. Still, politicians are hesitant to endorse it due to fear of backlash or negative sentiment outburst from the public.

The 2020 report from the OASDI trustees projects that the retirement funds would be depleted by 2035 and disability funds in 2065. When that occurs, the taxes would not be enough to fund the entire Social Security program, and the Government needs to fill this gap. It may result in higher taxes on workers, fewer benefits, higher age requirements, or a combination of these.

For companies, an increase in Social Security Taxes directly cut down their profit margin, and hiring is more expensive. As a result, companies would be forced to keep employees only when required to avoid losses. Hence, Tax rates have a cascading effect on business profitability for companies as well as employment rates for the United States. When Social Security Taxes increase, the income offered to the employees is also affected, which can discourage personal consumption and spending for the working citizens.

Impact on Currency

The Social Security Rate for the Companies and the employees are revised every year. For consecutive years it tends to remain constant and tends to change in small incremental steps over a few years at a time. Hence, the volatility induced in the currency markets is almost zero to negligible most of the time unless significant changes occur. The changes also would be priced in through news updates into the market long before we receive official statistics.

Hence, Social Security Rate is a low-impact indicator and can be overlooked for more frequent statistics for the FOREX markets.

Economic Reports

The U.S. Social Security Administration provides the complete historical data of the Social Security tax rates for both the employee and employer on its official website. The Organization for Economic Co-operation and Development (OECD) also maintains the same for its member countries on its official website.

Sources of Social Security Rate For Companies

Social Security Rates for companies can be found on the Social Security Administration website.

Social Security Rates for employees can be found on the OECD’s official website.

Social Security Rates for companies (similar policies with different names) across the world can be found on Trading Economics.

How Social Security Rate for Companies News Release Affects Forex Price Charts

By law, companies are required to contribute half of the social security rate that their employees contribute. In the U.S., this rate for companies in 7.65% for each employee on the payroll for up to $ 137,700 per employee. This rate is reviewed annually and has remained unchanged in the U.S. for the past 25 years. For forex traders, this release of this rate in the U.S. is considered a non-news event since it is not expected to impact the forex market.

The screen capture below shows the current social security rate for companies in the U.S. taken from Trading Economics.

The latest review of the U.S. social security rate was on October 10, 2020, at 4.00 PM ET, and the press release can be accessed here.

Now, let’s see how this news release made an impact on the Forex price charts.

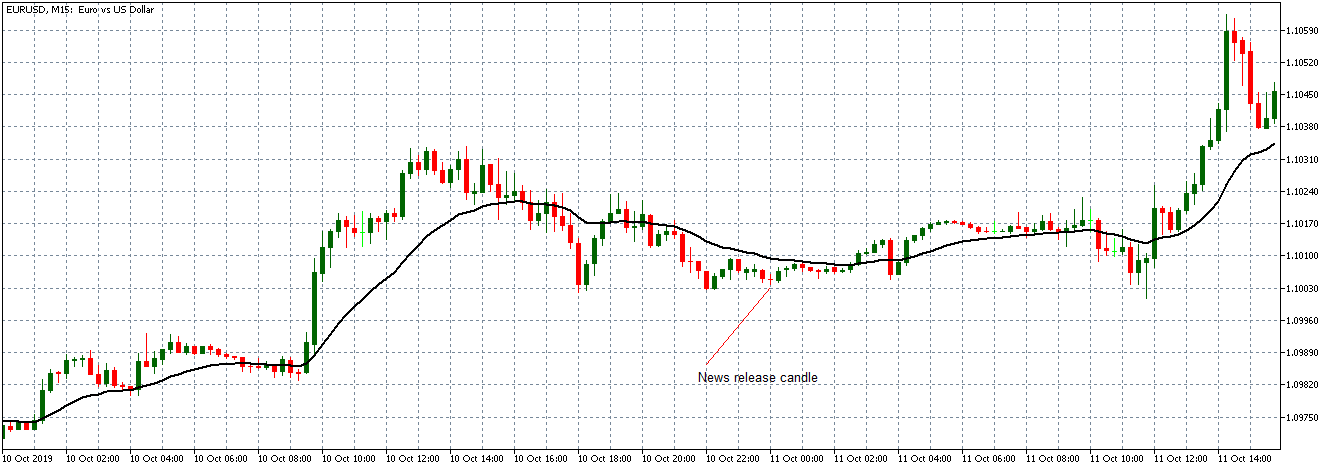
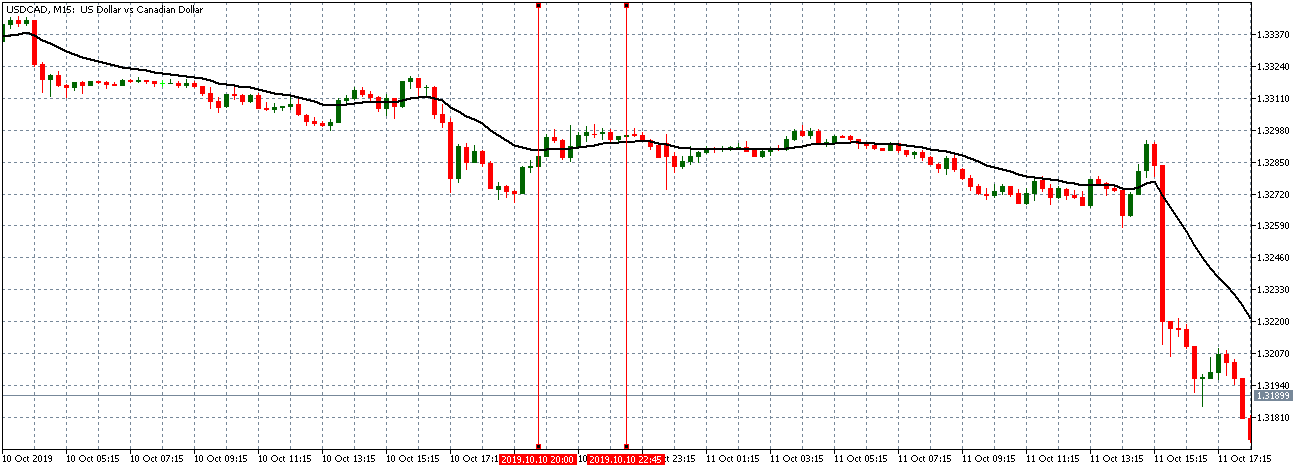
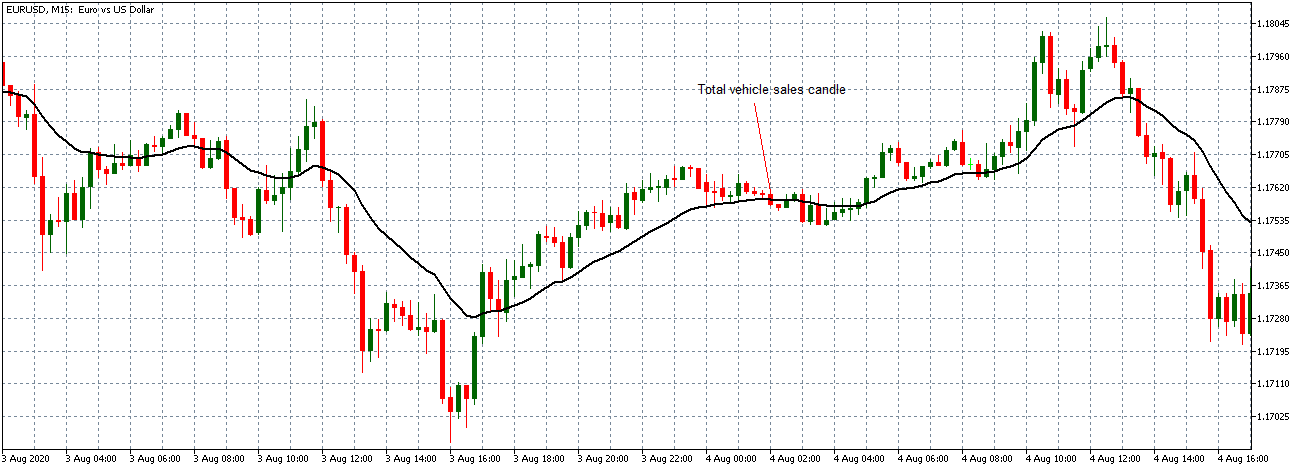
EUR/USD: Before social security rate release October 10, 2020, 
just before 4.00 PM ET

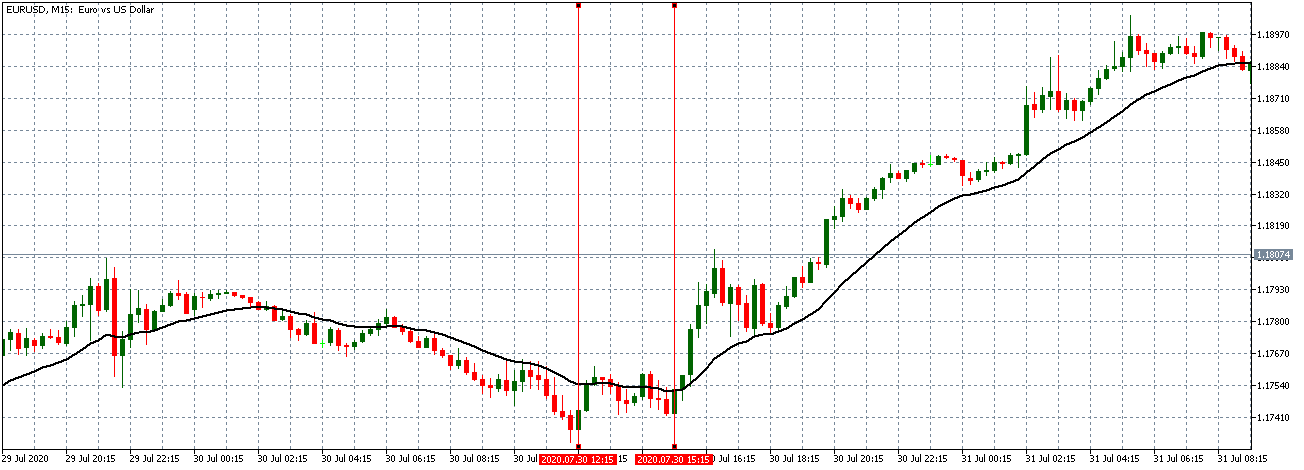
As can be seen on the above 15-minute EUR/USD chart, the pair is on a weak downtrend before the news release. This downtrend is evidenced by the candles forming slightly below the 20-period Moving Average between 12.00 PM and 3.45 PM ET. Furthermore, the Moving Average appears to be flattening.

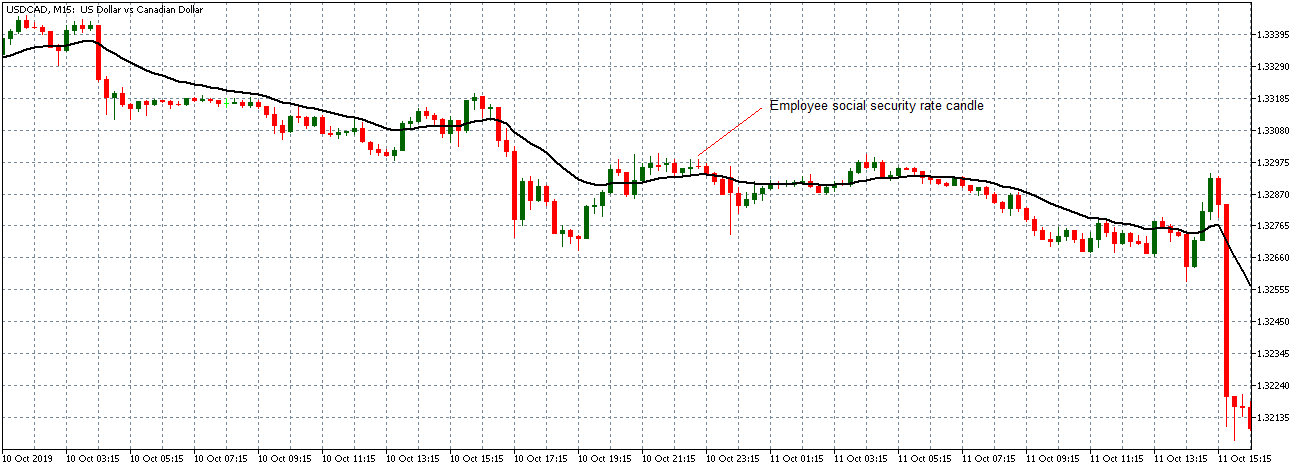
EUR/USD: After social security rate release October 10, 2020,
at 4.00 PM ET

As expected, there was no market volatility after the news release about the social security rate for 2020. The chart above shows a 15-minute “Doji” candle forming after the news is released. The pair later traded on a neutral pattern as the 20-period Moving Average flattened. The news release about the social security rate for companies did not have any impact on the price action of the EUR/USD pair.

Let’s quickly see how this new release has impacted some of the other major Forex currency pairs.

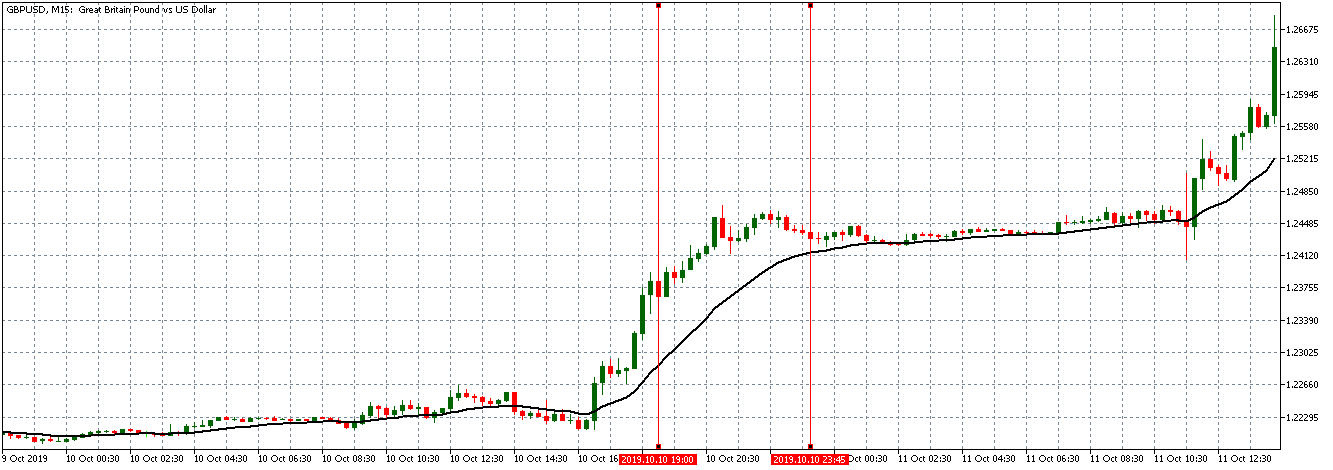
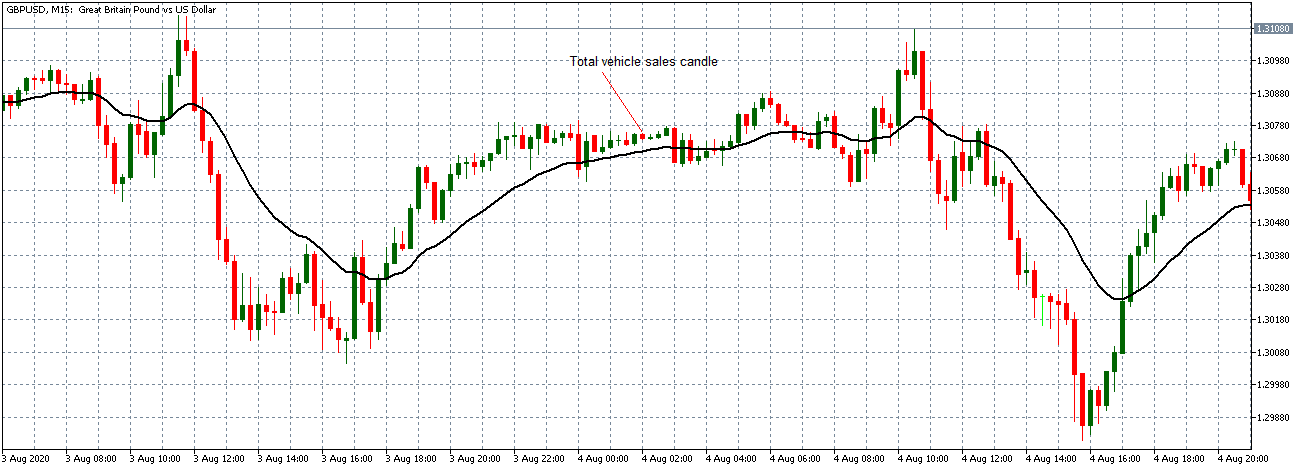
GBP/USD: Before social security rate release October 10, 2020, 
just before 4.00 PM ET

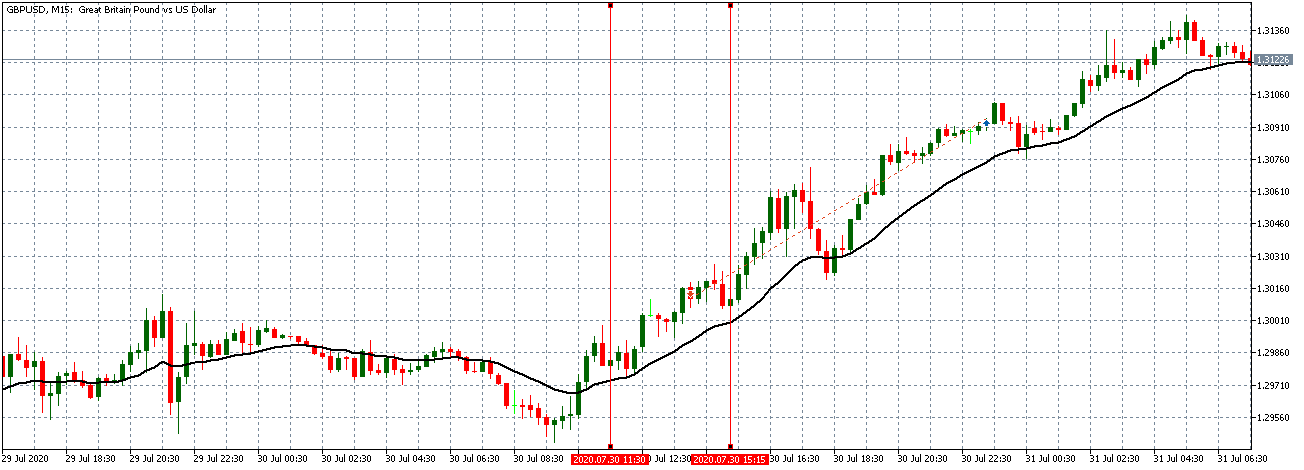
Before the news release, the GBP/USD pair is on a steady uptrend, as shown by the chart above. An hour to the release, the uptrend became subdued, and the pair adopted a neutral pattern.

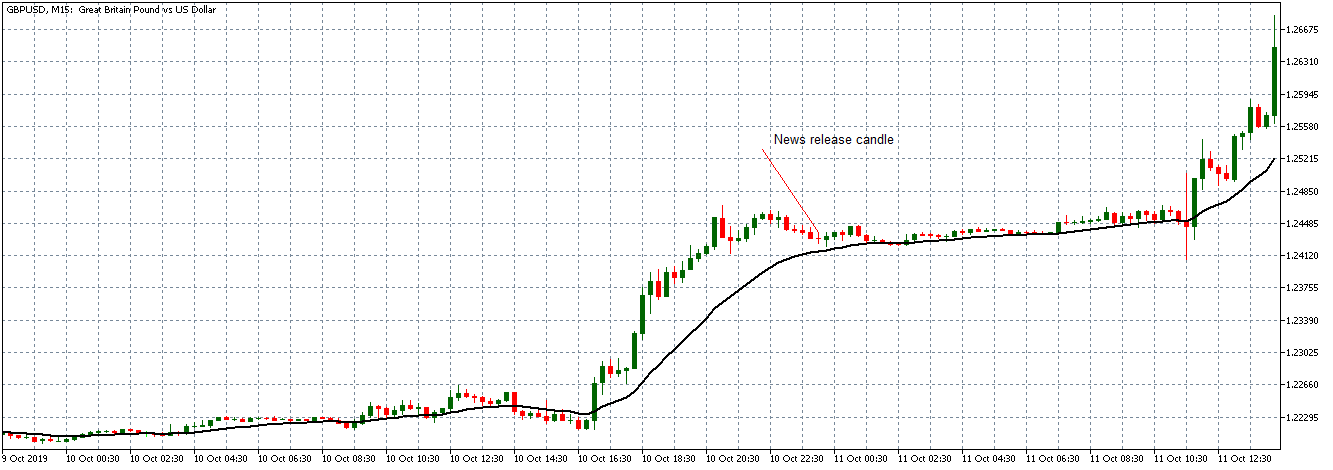
GBP/USD: After social security rate release October 10, 2020, 
at 4.00 PM ET

After the news release, the pair forms a 15-minute “Doji” candle. It continues to trade in the neutral pattern observed earlier.

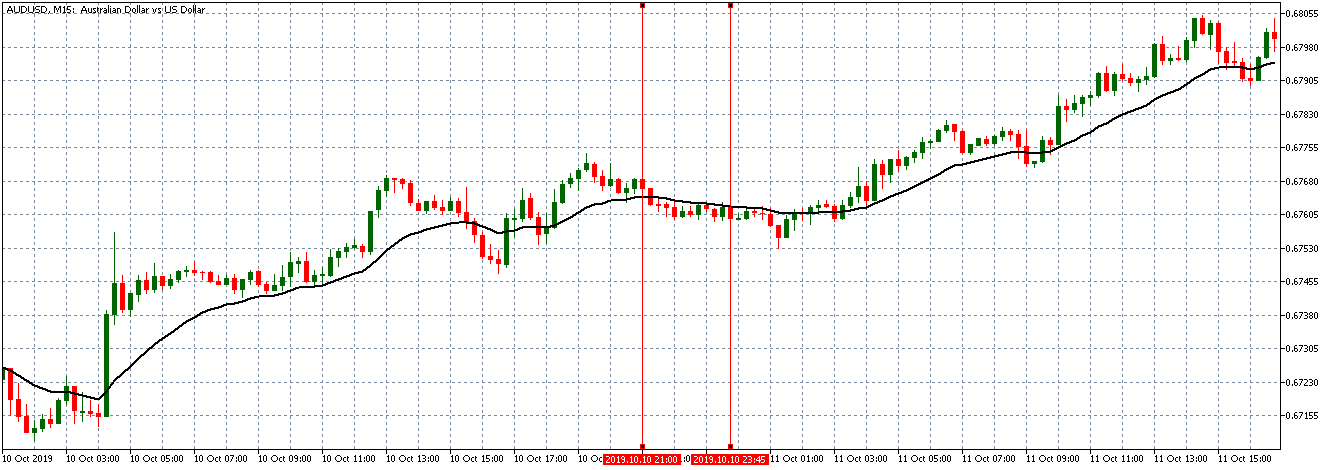
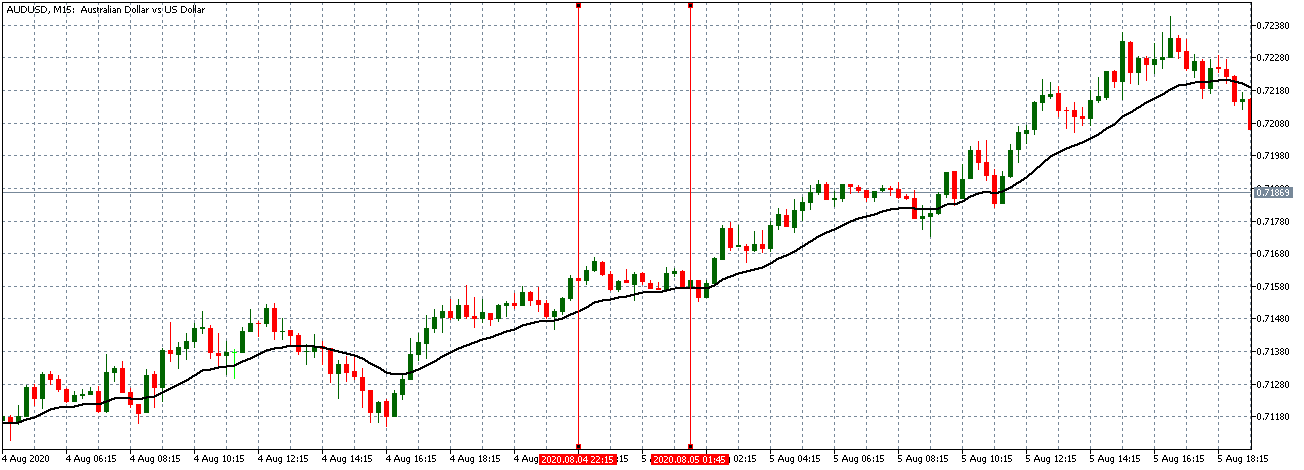
AUD/USD: Before social security rate release October 10, 2020, 
just before 4.00 PM ET

 AUD/USD: After social security rate release October 10, 2020, 
 at 4.00 PM ET

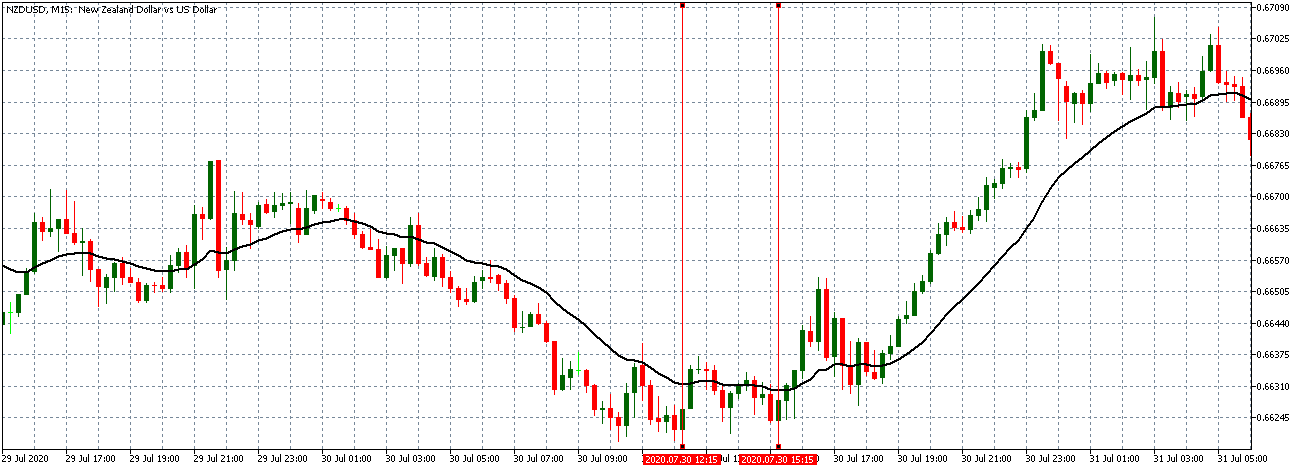
The AUD/USD pair shows a similar neutral trading patter as the EUR/USD and GBP/USD pairs before the news release. This trend is evidenced by the 15-minute candlesticks forming around a flattening 20-period Moving Average between 1.00 PM and 3.45 PM ET. After the news release, the pair forms a 15-minute “Shooting star” candle and continues to trade in the same neutral pattern as before.

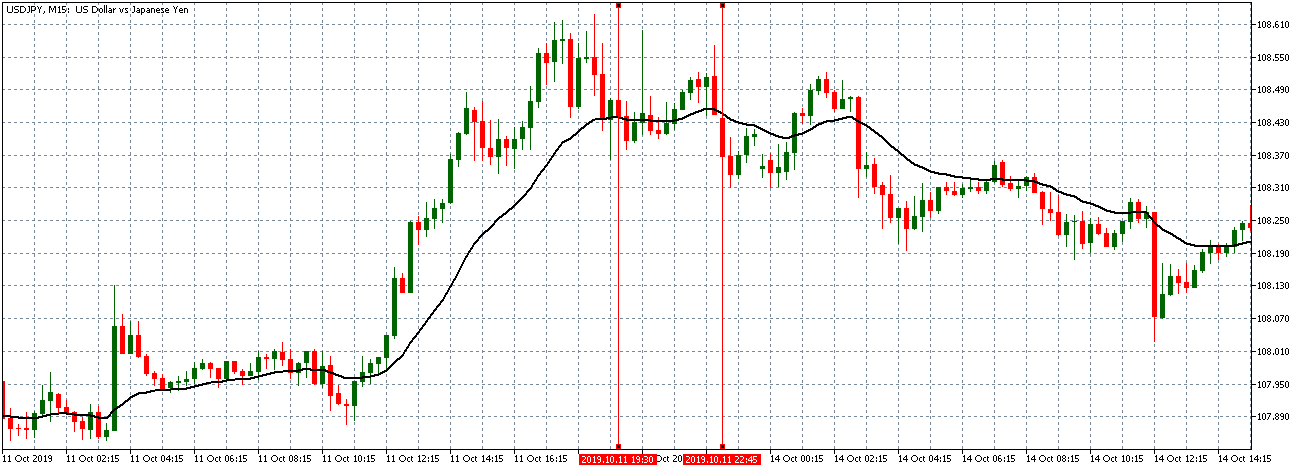
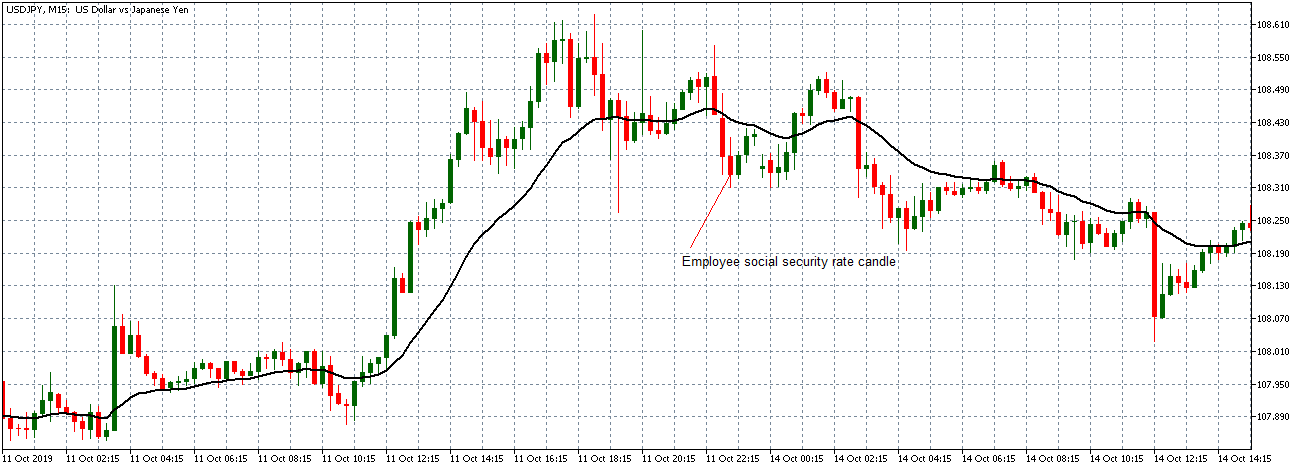
From the above analyses, it can be seen that the news release of the social security rate for companies does not have any impact on the price action.

Categories
Crypto Guides

Is Investing In Binance Coin a Good Decision In 2020?

Introduction

Binance coin is a widely known cryptocurrency made by the Binance exchange. It is by far the world’s largest cryptocurrency exchange and offers a wide range of crypto-to-crypto pairs. This cryptocurrency runs on the Ethereum blockchain with ERC 20 standard. Binance coin is also responsible for expanding the scope of the operation of the Binance exchange because the currency supports various utilities on the platform like paying for exchange fees, trading fees, listing fees, and other fees that are payable on the Binance exchange. 

It was made available to the users for the first time during an Initial Coin Offering (ICO) on July 25, 2017. Angel investors were offered 10% of the BNB tokens, the founding team was offered 40% of the tokens, and the various other participants were offered the remaining 50% of the tokens through the ICO process. The funds raised through the ICO process were planned to be allocated for various purposes like: 

  • Branding and marketing of Binance
  • Development of the Binance platform.
  • Upgradation of the Binance ecosystem. 

During April 2018, the market cap of the Binance coin was $1.4 billion.

The Binance coin has also collected support with the help of partnerships that have helped the usage period of the coins. One such partnership was done with Uplive, a premier live-video streaming platform of Asia that sells virtual gifts to the users in exchange for BNB tokens to an extensive user base of 20 million on Uplive. 

Is Binance Coin a Good investment or not?

There are a lot of factors that help to determine whether an asset will be a good investment or not. Market structure, daily trade volume, and USPs (Unique Selling Points) are some of the most relevant factors to make this judgment. Market structure can be defined as the macro price activity of an underlying asset. In the case of BNB, the market structure seems promising.

The currency took off in the year 2019 at an approximate price of $6 and climbed its all-time high price of $38.54 as of June 21, 2019. After that, the price has been significantly retraced along with the rest of the cryptocurrency market and has maintained a good price. Also, at any point in time, the price action of BNB coin remains above the key price levels as well as market structure. 

The daily trading volume of BNB is also impressive. At the time of writing this article, the last 24-hour trading volume $2,193,941,846. Apart from the market structure and daily volume, there is an important factor, i.e. tokenomics, that can help to determine whether an asset will be a good investment or not.

Tokenomics means the design of the cryptocurrency and its characteristics that impact its value. These characteristics include game theory, economic incentives, computer science, and cryptography. The tokenomics of Binance coin are very strong. It has been designed in a way that allows easy adoption and utilization, which increases the price of the coin even more. 

Conclusion

Binance Coin (BNB) is a popular cryptocurrency and can always be found ranked on the top 10 spots of the CoinMarketCap platform. It is a leading token in the crypto exchange ecosystem and is utilized on a large scale on the Binance platform. If Binance will continue to invest efforts in expanding the products, it has to offer and onboards new users. Then there won’t be any reason to classify Binance coin under the ‘not a good investment’ category.

Categories
Crypto Guides

Introduction To ‘Cryptohopper’ – A Reliable Crypto Trading Expert Advisor

Introduction

Cryptocurrencies are intensively volatile. The volatility of the currency is a matter of concern, but in the case of trading with cryptocurrency, it’s quite advantageous. In the crypto trade, you can invest when the market value is declining, and you can retrieve your amount when prices are on hike.

However, it requires experience to become an expert in reading and analyzing this market’s up-down trends, so that you can invest at the perfect time to expect maximum returns. To predict this market flow for investors, trading bots are introduced with automated algorithms in the industry. Today in this article, we will be discussing one such trading bot- Cryptohopper.

Understanding Crypto Trading Bot

Crypto bots are cloud-based computer programs to host cryptocurrency trading. It provides idle tools to beginner and advanced traders. At the right time, it can automatically buy and sell cryptocurrencies. Users can simply connect the bot with their cryptocurrency exchange, and then it can smoothly trade on their behalf. For successful trading, it is necessary to rely upon complicated probability estimation for predicting the market trends, and a bot can calculate this much faster than a human brain. 

What is Cryptohopper?

The cryptocurrency industry is offering various services and tools to traders to elevate their success rate. Cryptohopper is one such tool that can simplify the crypto-trading ecosystem. It’s a trading bot that has been customized as per the requirements of users and can also provide market technical detail.

Earlier, a user would have to spend a lot of time in front of the computer screen to trace market flow all day, but now the fully automated bot can monitor the trade 24/7 on behalf of the users. To ensure high output, it can perform backtest for each iteration and can optimize decisions based on the current situation. 

Why do you need a bot like Cryptohopper?

In the cryptocurrency trading world, every second matters a lot. So, to make life easy and to earn more, traders can make use of a crypto trading bot like Cryptohopper to make every second count. Let’s have a look at how Cryptohopper can help in various domains of crypto-trading.

Objective trading 

The trade will be executed entirely based upon the data analysis. You don’t need to panic about the buying or selling process because the trade activities shall be evidenced without any involvement of stress or emotion.

Social trading 

Cryptohopper directly subscribes to market signalers who analyze the trade and suggest how to raise the value of your coin. As a result, you can get appropriate information for trade optimization.

Simultaneous trading 

It operates and manages all your coins simultaneously. It can keep track of all price details and sell your coin exactly at the target profit scale that you have set.

Intuitive tools 

This bot has the potential to keep the users at the top market position. It notifies with alert in advance about the trade opportunity to sell the declining coins and to repurchase the coins at a lower price.

Cloud-based platform 

It remains 24/7 online in the cloud. It means you don’t need to keep your device ‘on’ always to track your coins. You can log in to your bot account anytime, and you will get a notification about the latest market updates. 

Conclusion

The ability of Cryptohopper to provide users with high returns in cryptocurrency trading is something to look at. The traders won’t feel the need to rely on a computer screen as this bot can automatically trace the trends and take the necessary steps that have been fed. It can be easily used without any coding background and can also be connected to any global crypto exchange without incurring any trading fees.

Categories
Forex Basic Strategies

Learning To Trade The ‘Make Your Wish’ Forex Trading Strategy

Introduction

The ‘make your wish’ strategy is based on one of the most popular candlestick patterns, i.e., the Shooting Star. As we all are aware that it looks similar to an inverted hammer, we try to develop a strategy that gives us the ability to capture small bearish reversal in the market. This pattern can prove to be a very “dangerous” pattern if developed at the right location.

Once we comprehend the importance of shooting stars, we discover that one candle pattern has such a power that it can signal the reversal of a strong bullish trend. Very few people take the risk of trading reversal, as this type of trading has badly hurt the trading accounts of many.

Today’s strategy will address this issue and will show how we can catch a falling knife without cutting off our fingers. The ‘make your wish’ can help us spot the top of the market and how to trade it properly. As Shooting stars are believed to make our wishes come true, we have named this strategy as ‘Make Your Wish,’ hoping that the strategy makes our wish of winning come true.

Time Frame

This strategy can only be traded on very short-term price charts such as 5 minutes or 1 minute. Hence, this is a perfect, intraday trading strategy.

Indicators

We make use of just one technical indicator in this strategy, and that is the Chaikin Oscillator.

Currency Pairs

The most suitable currency pairs are EURUSD, USD/JPY, GBP/USD, AUD/USD, GBP/AUD, USD/CAD, GBP/JPY, and CAD/JPY. Minor and exotic pairs should completely be avoided.

Strategy Concept

The ‘make your wish’ strategy is a very simple and effective technique to use in the forex market. Since most traders are interested in day trading and scalping, there isn’t a better strategy to use for that. The strategy is based on the simple concept that when the market moves sharply in one direction, it needs to ‘pullback’ at some of the time that will lead to a decent retracement in the price to the next technical level. The ‘shooting star’ helps us identifying the time when retracement will start.

Here, we take advantage of this retracement and try to particulate in the short-term reversal of the market. As this can involve high risk, we cannot solely rely on a candlestick pattern and use a technical indicator to give us the extra confirmation. We use the ‘Chaikin Oscillator, ’ which is designed to anticipate directional changes in the market by measuring the momentum behind the movements. Anticipating change in direction is the first step to identifying a change in the trend. But this also isn’t enough for forecasting a reversal, which we shall in detail in the future course of the detail.

The risk-to-reward (RR) of the trades will not be high as we are trading against the trend of the market, which may not be suitable for high ‘RR’ seekers. But at the same time, the probability of success is high for trades executed using this strategy.

Trade Setup

In order to execute the strategy, we have considered the 5-minute chart of where we will be illustrating a ‘long’ trade. Here are the steps to execute the strategy.

Step 1: Firstly, we identify the trend of the market by plotting a trendline. If the price bounces off from the trendline, each time it comes close to it, we can say that the market is trending. Here we should make sure that the price is not violating the trendline multiple times. This also means that there are no deeper retracements in the trend, which is desired for the strategy. The trendline is plotted by connecting the ‘highs’ and ‘lows’ of the market.

The below image shows that GBP/AUD is in a strong uptrend.

Step 2: Next, we wait for the ‘Shooting star’ candlestick pattern to appear in the trend. Once the pattern shows up on the chart, we look at the Chaikin oscillator and make a note of its reading. When this ‘rejection’ pattern appears in an uptrend, it indicates a reversal of the trend if the Chaikin oscillator starts moving lower and slips below the ‘0’ level.

When this ‘rejection’ pattern appears in a downtrend, it indicates a reversal of the trend if the Chaikin oscillator starts moving upwards and moves from negative to positive territory. When both these criteria are fulfilled, reversal is imminent in the market. But we cannot enter the market as yet.

The below image shows how the pattern emerges on the chart along with a falling Chaikin oscillator.

Step 3: It is important to note that we enter the market soon after the appearance of the pattern. After the formation of the pattern, it is necessary to wait for a ‘lower high’ in case of an uptrend reversal and a ‘higher low’ in a downtrend reversal.

The below image shows the formation of  ‘lower high’ after the appearance of the ‘shooting star’ pattern, which is the final confirmation for entering the trade.

Step 4: Now, let us determine the stop-loss and take-profit levels for the strategy. Setting the stop-loss is pretty simple, where it is placed above the ‘lower high’ in a ‘long’ trade and below the ‘higher low’ in a ‘short’ trade. The take-profit is set at a price where the distance of take-profit from the point of ‘entry’ is equal to the distance of ‘stop-loss.’ That means the risk-to-reward (RR) of trades executed using this strategy is not more than 1:1. The reason for low RR is because we are trading against the trend of the market. Hence there is a possibility that the market might start moving in its major direction.

Strategy Roundup

A lot of traders warn against reversal trading, but finding top and bottom in the market and trading reversal can be done successfully if we have a proven methodology like the ‘make your wish’ strategy. We need to take into consideration all the rules outlined in this strategy guide other than just looking for the ‘shooting star’ pattern.

Categories
Forex Fundamental Analysis

Understanding ‘Social Security Rate For Employees’ Forex Fundamental Driver

Introduction

The Social Security Program of the United States is the government insurance program for retirees, disabled, and survivors. It is one of the most extensive Government Spending programs and affects the majority of its population. Hence, it is a macroeconomic statistic, and changes in the same results a significant impact on its citizens. An insight into the Social Security Rates and how it affects the individual and the economy as a whole can help us understand the monetary structure of the United States.

What is Social Security Rate For Employees?

The Social Security Program (SSP) is managed by the Social Security Administration (SSA) of the United States. The SSA is a federal agency and defines the SSP as a protection program against income loss due to retirement, disability, or death. The Social Security Program is officially called the Old-Age, Survivors, and Disability Insurance (OASDI) program.

The funds collected by the SSP are divided between two funds, namely the Old-Age and Survivors Insurance (OASI) and Disability Insurance (DI) Trust Funds. Retired workers and their families, or survivors (ex: wife of an expired husband) receive benefits from the OASI funds. The DI trust funds provide benefits to the disabled and their families. The benefits are paid out monthly to the eligible people.

The Social Security Programs receives its funds primarily from the currently active employees enrolled in the program, employers, and as well as self-employed citizens. The funds received at present are not stored for the future, instead, they are utilized to pay out for the currently eligible retirees. The cycle goes on, and it means the current employee pays out for the already retired people, and when the employee himself retires would be paid out through funds collected from the paying employees at that time.

Apart from the employee, employer, and self-employed, funds receive income from investments and interests on investments, and taxations of benefits. For the year 2020, the Social Security Rate is 12.4%, which is evenly divided amongst the employer and the employee. Hence, the employee pays 6.2% of their income. Generally, It is deducted monthly from their income. On the other hand, the self-employed people like small shop owners or freelancers are subject to pay the full 12.4% themselves.

The benefits apply to people who have enrolled and have paid for a minimum of ten years. The retirement age at which they are eligible for collecting their pension is 62, while people who wait longer, like the age of 66 or 70, receive higher and better benefits accordingly. The Social Security Tax has a cap limit of $137,700, above which the earned income is not subject to the tax deduction.

How can the Social Security Rate For Employees numbers be used for analysis?

Since the Social Security deductions are directly taken out from the gross salary, it directly affects the Personal Consumption Expenditure (PCE) and thereby Consumer Spending. Both of these are macroeconomic indicators bearing high significance in terms of currency market volatility. Suppose the taxes increase, Consumer Spending decreases, which can drive the economy into a recession. Consumer spending makes up two-thirds of the United State’s GDP.

The program collects from millions of people and pays out to millions of people. The transactions are in billions of dollars every year. Any change in the percentage is bound to affect a large chunk of the country’s population directly. Hence, the changes in the rates are less frequent over the years and change only during significant policy reforms.

The regressive nature is often criticized, meaning the more affluent section of the society ends up paying lesser than the lower-income bracket people due to the tax cap limit. Also, the model of the Social Security Program is a cause of worry for many as the increased life expectancy and the diminishing worker-to-retiree ratio will ultimately result in depletion of funds soon.

As the population stops to grow, and more people retire than the number of people actively working will ultimately force the Government to either raise taxes or retirement age-limit or decrease benefits. None of those above options is favorable, and the Government needs to plug this gap in funds sooner than later.

 Impact on Currency

The Social Security Rate for the employees is revised every year. Most of the time, it tends to remain constant and changes only in small incremental steps over a few years at a time. Therefore, the volatility induced in the currency markets is negligible unless significant changes occur. Above all, the changes would be priced into the market through news updates long before official statistics are published. Hence, Social Security Rate for employees is a low-impact indicator and can be overlooked for more frequent statistics in the currency markets.

Economic Reports

The Social Security tax rates for both the employee and employer are provided by the Social Security Administration of the United States on its official website. The historical figures of the same are also available. The OECD (Organization for Economic Co-operation and Development) also maintains the tax rates for employees of its member countries on its official website.

Sources of Social Security Rate For Employees

Social Security Rates for employees is available on the Social Security Administration website.

Social Security Rates for employees is also available on the OECD’s official website.

Social Security Rates for employees (similar policies with different names) across the world can be found in Trading Economics.

How Social Security Rate For Employees Announcement Affects The Price Charts

For employees, the social security tax is deducted through payroll withholding by the employer. This rate is split in half between the employee and the employer. Since the social security rate in the US is 15.3 %, an employee contributes 7.65% of their earnings up to $137,700.

The screengrab below shows the current social security rate for companies in the US from Trading Economics.

The latest review of the US social security rate was on October 10, 2019, at 4.00 PM ET, and the press release can be accessed here.

USD/CAD: Before Employee Social Security Rate Release October 
10, 2019, just before 4.00 PM ET

As can be seen on the above 15-minute chart, the USD/CAD pair was trading on a neutral trend before the news release. This trend is shown by the candles forming around an already flat 20-period Moving Average. This trend signifies relative market inactivity at this time.

USD/CAD: After Employee Social Security Rate Release October 
10, 2019, at 4.00 PM ET

After the news release, no market volatility is observed. The US/CAD pair forms a 15-minute “Shooting Star” candle. Afterward, the pair struggled to alter the trading pattern with the candles attempting to cross below the 20-period Moving Average but subsequently continued trading in the previously observed neutral pattern.

USD/JPY: Before Employee Social Security Rate Release October 
10, 2020, just before 4.00 PM ET

Before the news release, the USD/JPY market is on a weak uptrend. The pair can be seen struggling to maintain this trend as observed by multiple bearish spikes. The pair adopts a downtrend 30 minutes before the news release.

USD/JPY: After Employee Social Security Rate Release October 
10, 2019, at 4.00 PM ET

After the news release, the pair forms a 15-minute bearish candle. However, the news is not significant enough to maintain the earlier observed downtrend.

USD/CHF: Before Employee Social Security Rate Release October 
10, 2020, just before 4.00 PM ET

USD/CHF: After Employee Social Security Rate Release October 
10, 2019, at 4.00 PM ET

Before the news release, the USD/CHF pair shows a similar trading pattern as the USD/CAD pair. The pair was trading on a neutral trend with 15-minute candles forming around a flattening 20-period Moving Average. As the USD/JPY, the pair showed signs of reversing into a downtrend 30 minutes before the news release. After the release, USD/CHF formed a 15-minute “Shooting Star” candle. It later continued trading in a downtrend with subsequent candles forming below the 20-period Moving Average.

Bottom Line

On October 10, 2019, the US effectively increased the social security rate. Theoretically, this is supposed to be positive for the USD. However, as shown by our analyses, this news release had no significant price action impact on any currency paired with the US dollar.

Categories
Crypto Guides

What Should You Know About BitDegree & Its Usage?

Introduction

Cryptocurrency projects mostly start with Initial Coin Offering (ICO). Through ICOs, companies in the cryptocurrency industry raise funds to launch new coins or services in the industry. The trio of Arnas Stuopelis, Andrius Putna, and Roberto Santana was previously serving web hosting company “Hostinger” presented BitDegree ICO to the world. This ICO managed to convince over 12 thousand contributors and raised 32 thousand ETH. In this system, students are offered with the study course and paid with a BitDegree token in return for studying. 

What is BitDegree?

BitDegree is the world’s first e-learning platform powered by Ethereum blockchain. The goal of BitDegree is to gamify the learning process with fun and rewards. Here, gamification in academics means students will be awarded cryptocurrency for completing any study course. Every academic activity performed by the student will be saved in their BDG account and can be accessed anytime and anywhere.

The BitDegree platform not only gives incentives but also provides study material for easy understanding. The official portal is available in English, Russian, and Portuguese language. Is there any other better platform for study, where you are paid with cryptocurrency tokens for studying? No, It’s only possible with the BitDegree platform.  

You can also earn tokens by referring BitDegree to your friends. At every level, you need to qualify an online test to enter the next stage, and qualifying students are rewarded with “BitDegree” tradable tokens. To offer merit students with employment opportunities, BitDegree recently collaborated with companies like Huffpost, Marketwatch, Mogul, etc. After you complete your studies, you can trade with the currency earned, or you can also ask for a cash-out.  

How to Use BitDegree?

BitDegree is a utility token, which means the holder can use it for payments but doesn’t have any voting rights in the company. All community members like teachers, learners, and employers work together and pay each other with BDG token for their efforts. BitDegree accounts can be operated on mobile and desktop as well. Almost all courses are free except for a few professional courses which are available at a subsidized fee. 

Some of the important highlights of the BitDegree portal are: 

  • Learners will be rewarded with tokens for course completion.
  • Learners will pay teachers and for courses via BDG tokens.
  • Donors and employers will issue a token to learners for specific courses.

The payment system is handled through a smart contract system. Once a specific task is completed automatically without any error or delay, the reward is delivered through a smart contract. In computer, conditions are entered in the code like:

IF John completes 6 lessons THEN send John 300 BDG Tokens

BitDegree is classified as an ERC-20 token, and you don’t need an ETH wallet to store your earned token as it will be stored in your BitDegree account itself. To earn from BDG, you can convert it to blockchain for cryptocurrency trading and get them stored in an Ethereum wallet. 

Conclusion

Bitdegree brought huge transparency to the education system and is the first e-learning platform integrated with blockchain technology. It has introduced innovations and developments in the landscape of education. BitDegree’s global education revolution is offering everyone a common platform to learn and share skills to grow together.

Categories
Forex Basic Strategies

The Amazing Combination of ‘EMA & RSI’ While Trading The Forex Market

Introduction

Previously, we discussed several trading strategies that involved a combination of different indicators, but the number did not exceed two or three. In today’s article, we present a trading system that is based on five different Exponential Moving Averages, combined with the Relative Strength Index (RSI). This strategy will make a lot of sense to traders who are at an intermediate level of trading. It is totally mechanical in nature and requires a thorough understanding of technical indicators of MT4 or MT5.

Time Frame

The strategy can almost be used on any time frame, but a larger one is preferred, 1 hour or higher. This means the strategy is not suitable for trading during the day.

Indicators

As said, we will use five different Exponential Moving Averages and one Relative Strength Index (RSI). This is the reason we need to be well versed in the technical indicators.

Currency Pairs

This strategy can be used with any currency pair. Also, with few commodities as well. Liquidity will not be an issue here since we are trading on the higher time frames.

Strategy Concept

Firstly, we use 80-period EMA to identify the major trend of the market. If the price is above 80 EMA, we say that the market is in a bull market, while if it is below the 80 EMA, the market is in a bear market. Secondly, we use the 21-period and 13-period EMA to point out the current trend direction, meaning, the current minor trend within the major trend. If the EMA with a shorter period is above the one with the longer period, we have a minor bull trend, and vice versa.

Third, we use the other two EMAs with even shorter ‘periods’ in conjunction with the Relative Strength Index (RSI) to generate entry signals. These are the 3-period EMA and 5-period EMA. The crossing of these two EMAs supported by the appropriate value of RSI, tells us whether to go long or short in the currency pair.

However, a more conservative approach would be by ignoring the entry signals, which are in the opposite direction of the major trend. Therefore a ‘long’ entry signal would be generated when the 3-period EMA penetrates the 5-period EMA from below and starts moving higher. Also, the 80-period EMA must be below the price action discussed above, and RSI must have a value exceeding 50. We execute the trade once the signal bar closes beyond the 5-period EMA.

Conversely, a ‘short’ entry will be taken when the 3-period EMA penetrates the 5-period EMA from above and continues lower. This must be coupled with an RSI value below 50, and 80-period EMA be above the price action.

Trade Setup

In order to explain the strategy, we have considered the 4-hour chart of USD/CAD, where we will be applying the rules of the strategy to execute a ‘long’ trade.

Step 1

Since this a trend-based strategy, the first step is to identify the major direction of the market using the 80-period EMA. It is important that the price remains above the EMA for at least four consecutive higher highs and higher lows before we can call it an uptrend. Likewise, the price should be below the 80-period EMA for a minimum of 4 lower lows and lower highs.

The below image shows a clear uptrend visible on USD/CAD on the 4-hour chart.

Step 2

Once we have identified the trend, we need to wait for a price retracement that could give us an opportunity to enter the market and ride the trend. We need to evaluate if this a true retracement or the start of a reversal. In this step, we should wait until the price develops a ‘range’ or the 80-period EMA becomes flat. This partially confirms that the retracement is real, and the price could be making a new ‘high’ or ‘low.’

In the example we have taken, we can see how the price starts to move in a ‘range’ along with the flattening of the EMA. Next, let us discuss the ‘entry’ part of the strategy.

Step 3

We shall enter the market for a ‘buy’ when all the smaller EMAs cross the 80-period from below. The 3-period EMA should penetrate the 5-period EMA and start moving forward to generate a reliable ‘buy’ signal. Along with this, at the entry bar, the RSI should be above the 50 levels, and both the 3 and 5 periods EMA should cross the 13-21 EMA channel. Once all of these conditions are fulfilled, we can take a risk-free entry into the market. The same rules apply while taking a ‘short’ trade but in reverse.

The below image clearly shows the ‘entry’ where all the conditions mentioned above are met.

Step 4

Once we have entered the trade, we need to determine the stop-loss and take-profit levels. For this strategy, the take-profit and stop-loss are placed in such a way that the resultant risk-to-reward of the trade is 2.5. The RR is derived mathematically, where we have taken into consideration the possibility of a new ‘high’ or ‘low’ as we are trading in a strong trending environment.

Accordingly, we have set the take-profit and stop-loss in our example, as shown below.

Strategy Roundup

Combining two or more technical indicators has always proven profitable for traders. The above-discussed strategy considers the trend of the market, momentum, strength of the retracement, and shift of ‘highs’ and ‘lows,’ which makes it an amazing strategy to be used while trading part-time or full-time. Since there are many rules and requirements for the strategy, the probability of occurrence of trade-setup is less, but once formed, it can provide amazing results.

Categories
Forex Fundamental Analysis

Everything You Should Know About ‘Government Budget Value’ Fundamental Indicator

Introduction

Regardless of the country, the respective governments have a pivotal role to play in economic growth for a given year. The vast resources at the disposal of the nation and state’s government, when combined with effective planning and action, has yielded phenomenal results for many countries’ growth. Understanding the government budget and its role in economic growth helps us to predict how conducive the market place will be for economic growth for the fiscal year.

What is Government Budget Value?

Budget: A budget is a periodic estimation of revenue and expenses for a specified period. The time-frame can be monthly, quarterly, or even yearly. A budget can be drafted for an individual, a group, a business, the government, or anything else that has cash in-flow and out-flow.

Government Budget: When we refer to the term budget, it is generally associated with the local or central government. The Government Budget refers to the estimated or forecast of its expenditures and revenue for a particular period. The time-frame generally for which it is estimated is for a financial year, which may or may not coincide with the calendar year. The combined income and outlays of a government for a fiscal year make up the government budget.

Government Budget Value: Here, the government budget value refers to the actual dollar value of the entire budget. We are referring here to the raw or direct numerical dollar value of the total budget. The budget is drafted as per the plans and obligations of the government for the fiscal year. The government has obligations like paying out social security funds, interests, and principal on its debts, purchasing military equipment for national security, and other mandatory spending programs. The government receives incomes from interests on its investments, revenue from taxes, fees collected from government services offered, etc.

All these income sources, outlays are all detailed in the government budget report. It is analogous to a bank statement of an individual except that it is for the entire government as a single entity, and the transaction values would be in millions and billions of dollars.

How can the Government Budget Value numbers be used for analysis?

In the budget report, if the revenues exceed the expenditures, then it is called a budget surplus. When the expenditures exceed the revenue, it is called a budget deficit. When both the revenue and expenditure level off and are equal, it is called a budget balance. All three scenarios have different meanings and implications.

When there is a budget surplus, the government has additional funds to create new infrastructure, improve the living conditions, raise salaries of government officials, and even provide support for new businesses to improve business growth. In developed economies, when the government experiences prolonged periods of excessive budget surplus, there may be outbursts from the public to reduce taxes levied on them to make sure money stays with the people who earned and not the government. Ideally, a budget surplus is preferred.

The budget balance is an ideal situation for any government where all their outlays are met through the revenues received, although any change of plans or additional programs, if needed to be taken up, would push them to a deficit. In general, all the expected expenditures would be factored in. A balanced budget would indicate every penny is accounted for and is very hard to achieve in real-world scenarios. There would always be some differences in income and outlays.

When the income does not suffice the expenditures, we have a budget deficit. It is the less preferred and more commonly occurring scenario, especially for developed economies like the United States. However, some arguments can be made where a deficit is not always bad, as the government can borrow extra funds from investors to set up the infrastructure for future returns. Temporary deficits for future surplus are acceptable. Deficits arising out of sustainable expenses, meaning expenses that will pay off in the future more than what they cost now, are seen as good signs for the economy.

On the other hand, when the deficit arises out of unsustainable expenses, which are likely to continue due to increasing debt, interest payments, inflation, etc. all are warning signs for the economy. The government plugs in the deficit by issuing securities and treasury bonds. Corporations and investors buy these bonds. A budget deficit can arise out of a multitude of reasons. When the economic growth of the native country is slower than its trading partners, it would spend more and earn less, leading to a deficit. High unemployment rates, recessions, tight lending environments, increased government spending, etc. all add to the deficit.

The United States has been facing a deficit crisis for many years in succession now. Things are only getting worse as the baby boomer generation is retiring, further increasing the weight on the social security program adding to wider deficits in the budget. An ideal government should maintain a surplus or at least a balance to be safe. Still, like any real-world scenario, a surplus or balanced budget does not ensure or indicate high economic growth. It just makes economic growth more conducive and likely for the nation or state.

The nation’s growth depends on many factors, and one amongst them is through government budget planning and allocation of funds. When it is played right, many things fall in order, and a significant boost for the economy can be induced.

Impact on Currency

The Government Budget values are useful for analysts to ascertain what proportion of funds will be allocated to each of the listed programs. The raw value of the budget in itself is not useful for traders as it is just a number and does not bear significance until there is something to compare. In general, budget or government spending as a percentage of GDP offers a more relative picture to forecast whether stimulus from the government side is relatively more or less. Through it, we can forecast the growth rate and market environment.

The government budget value alone is not enough to bring forth any significant economic conclusions or make an investment decision. Hence, it is a low-impact lagging indicator that does not bring much volatility in the currency markets.

Economic Reports

The Treasury Department and Office of Management and Budget of the United States maintain the government budget reports on their official websites. Internationally, the World Bank and International Monetary Fund maintain the budget data for most countries.

Sources of Government Budget Value

Treasury department of the United States – Budget Reports and Office of Management and Budget – USA detail the budget reports

Government budget values for most countries are available on Trading Economics.

How Government Budget Value Release Affects The Price Charts

In the US, the Department of the Treasury is responsible for the release of the Monthly Treasury Statement. This statement contains the Federal Budget Balance, which is synonymous to the Government Budget Value. It measures the difference in value between the federal government’s income and spending during the previous month. The most recent release was on August 12, 2020, at 2.00 PM ET and can be accessed from Investing.com here. A more in-depth review of the Monthly Treasury Statement can be accessed at the US the Department of the Treasury here.

The screengrab below is of the monthly government budget value from Investing.com. On the right is a legend that indicates the level of impact the fundamental indicator has on the USD.

As can be seen, the government budget value data is expected to have a medium impact on the USD upon its release.

The image below shows the recent changes in the monthly government budget value in the US. In July 2020, the government budget value changed from a deficit of $864 billion to $63 billion, beating analysts’ expectations of a $193 billion deficit. This change is positive and, in theory, should make the USD stronger compared to other currencies.

Now, let’s see how this release made an impact on the Forex price charts.

EUR/USD: Before the Monthly Government Budget Value Release 
on August 12, 2020, Just Before 2.00 PM ET
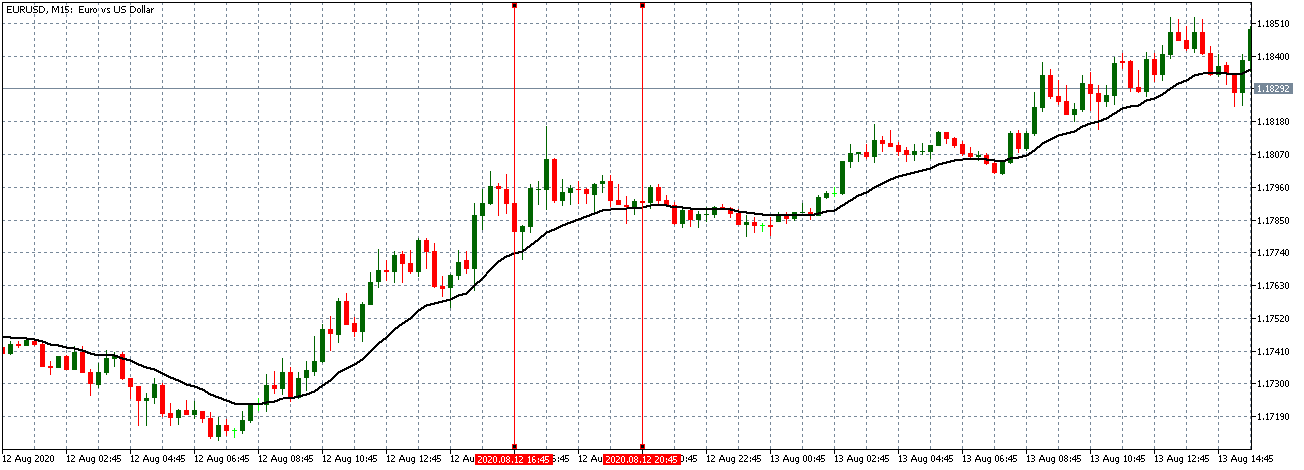
Before the budget data release, the EUR/USD pair was trading in a subdued uptrend. As seen in the above chart, the 15-minute candles are forming closer to the 20-period Moving Average, whose steepness is decreasing.

EUR/USD: After the Monthly Government Budget Value Release 
on August 12, 2020, at 2.00 PM ET
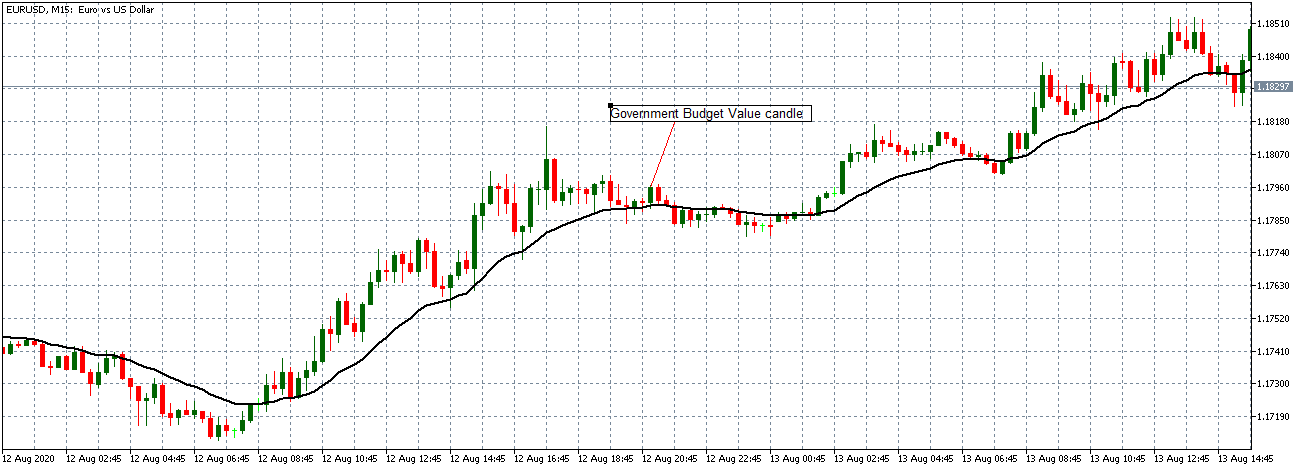
After the data release, the pair formed a 15-minute bullish candle, indicating that the USD weakened against the EUR contrary to the expectation. However, the data release was not significant enough to cause a shift in the trading pattern. The pair traded in a neutral trend with candles forming around a flat 20-period Moving Average.

AUD/USD: Before the Monthly Government Budget Value Release 
on August 12, 2020, Just Before 2.00 PM ET
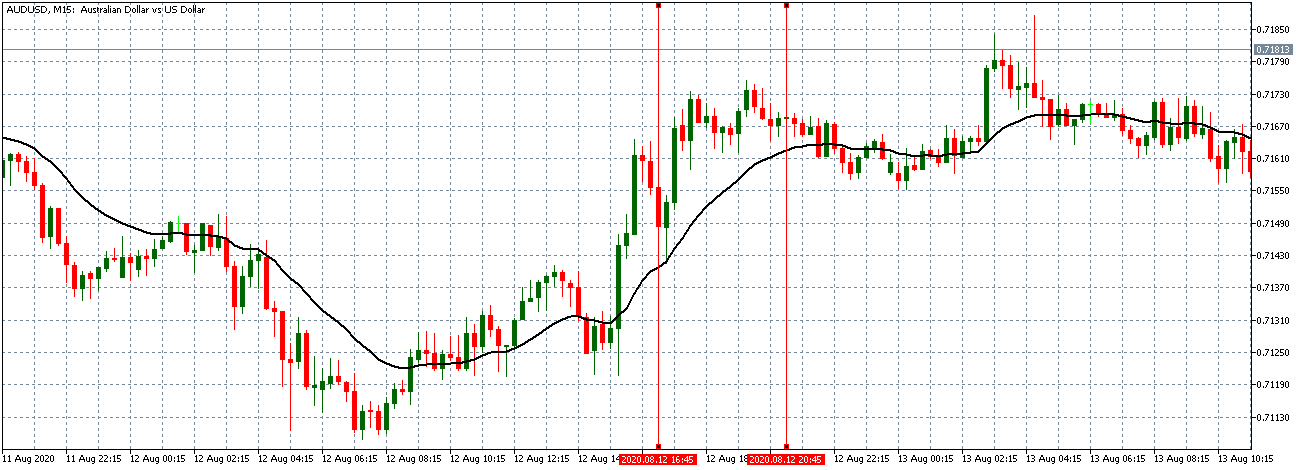
Before the data release, the AUD/USD pair traded in a steady uptrend with candles forming above a rising 20-period MA.

AUD/USD: After the Monthly Government Budget Value Release 
on August 12, 2020, at 2.00 PM ET
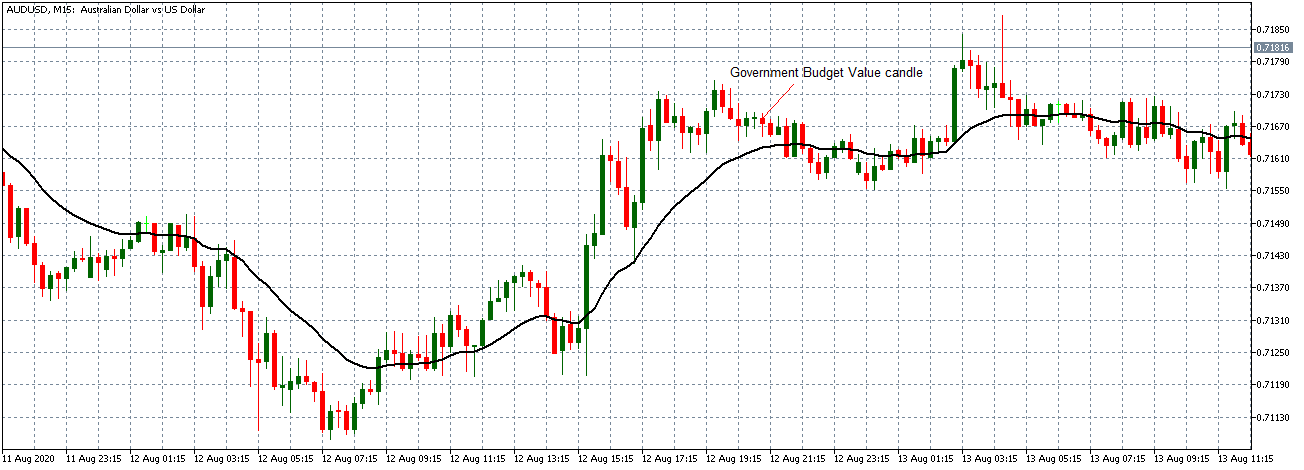
The pair formed a 15-minute bearish “hammer” candle after the data release. Similar to the EUR/USD, AUD/USD subsequently traded in a neutral trend with the 20-period MA flattening.

NZD/USD: Before the Monthly Government Budget Value Release 
on August 12, 2020, Just Before 2.00 PM ET
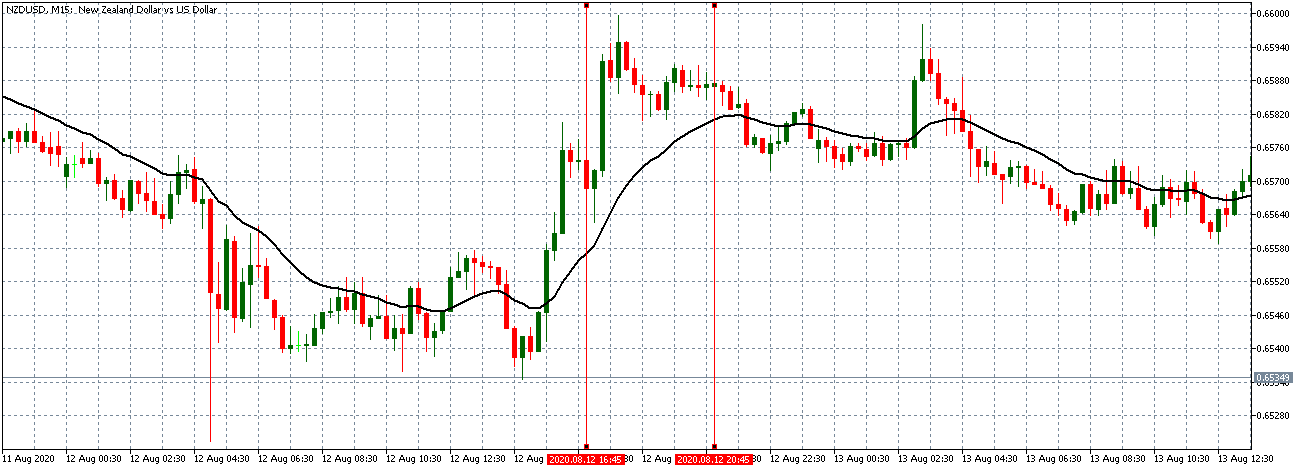
NZD/USD: After the Monthly Government Budget Value Release 
on August 12, 2020, at 2.00 PM ET
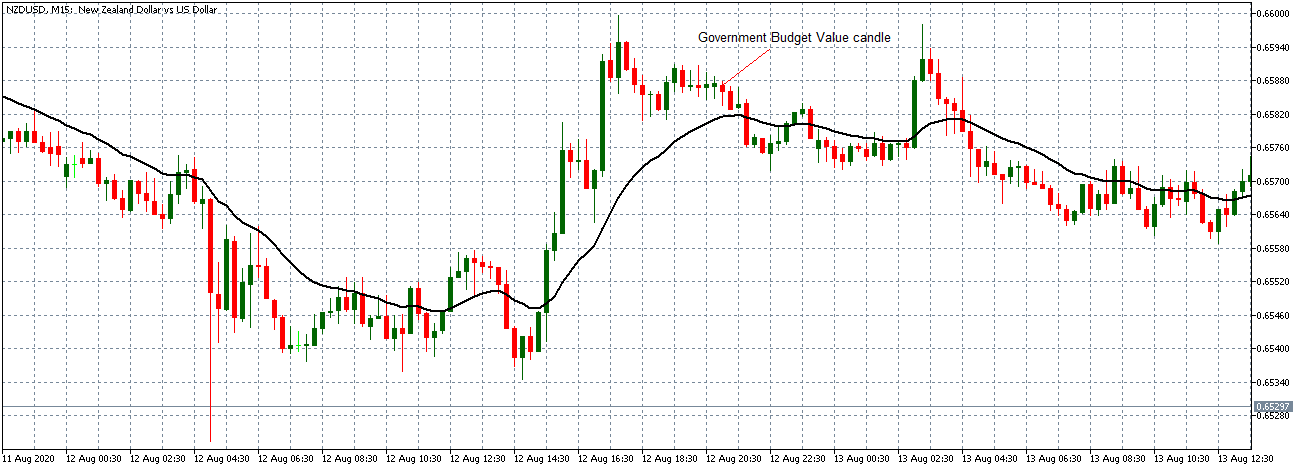
NZD/USD pair showed a similar steady uptrend as observed with the AUD/USD before the data release. The pair formed a 15-minute bearish candle. It subsequently traded in the neutral pattern observed with the other pairs.

Bottom Line

For economists, the monthly government budget value is an invaluable indicator showing the trends in government budget deficit, revenue, and expenditures. However, in the forex market, this fundamental indicator does not produce significant price action changes, as observed in the above analyses.

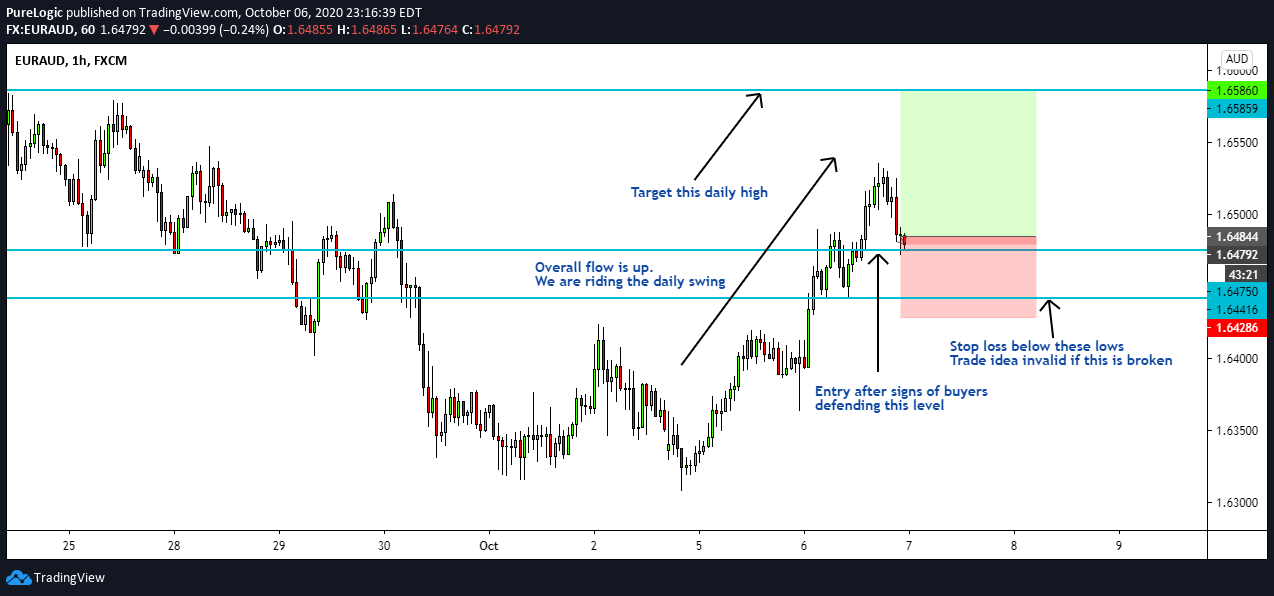
Categories
Forex Course

148. How To Fade The Breakout By Successfully Trading It?

Introduction

Most retail traders have a greedy mentality, so they always prefer to trade the breakouts to catch the home run. They believe in considerable gains in huge moves. Trading smaller moves are something they are not interested in because it takes a lot of work and time to scan the market. The problem with breakout trading is that the majority of the breakouts fail. To make consistent money from the market, professionals always prefers to fade the breakout. The fading breakout essentially means trading a false breakout.

Fading Breakouts = Successfully trading the False Breakout

The image above represents the formation of a false breakout, which gives us a potential sell opportunity. Experienced industrial traders are always interested in fading the breakout because they know the crux of it. Most of the time, when the price action attempts to fade the breakout, it fails and closes back inside any of the major levels. Therefore, fading the breakout is always a smarter move than avoiding it.

Trading Strategies

Always remember that fading the breakout is a short term strategy. Therefore, please do not expect a home run while taking these trades. What we are doing here is that we are trading the false breakout moves. During the fight between the buyers and sellers, we will witness the initial moves, often failing to give the breakouts.

We are just taking advantage of these exact moves. In the end, one party always wins, and we will eventually get the breakout on the price chart. Instead of waiting for the home run, it is always advisable to trade some smaller moves, and if the market allows the home run, we must definitely go for it.

Buy Trade

The price chart below represents a false breakout in the GBP/NZD Forex pair.

As we can see in the below chart, where the price action breaks below the channel, it came back right into the channel, indicating a false breakout. After the breakout, we can see the price action holding at the support zone. We decided to go long after we saw the red candles struggling to go down and when a clear big Green Candle is formed. Instead of being disappointed that the breakout didn’t happen to take the trade, these small trades inside the major areas come handy to make money.

Sell Trade

The image below represents the formation of a false breakout in the GBP/AUD Forex pair.

As you can see, the image below represents our entry, exit, and stop-loss in this pair. When the price failed to go above the major level, it is an indication for us to take a trade inside the triangle. Therefore, when the price came back, we took the sell entry to the most recent support area. The stops above the entry should be good enough.

Another Sell Trade

The image below represents a false breakout in the GBP/AUD Forex pair.

As you can see, when the prices failed to break the trend line and started to hold below the trend line, it was a sign that it is a failed breakout. It also indicates that the sellers are going to take over the market when we look-in the price action perspective. In this trade, we choose not to close our position at the most recent higher low. Instead, we went for the actual breakout. The holds below the support area is an additional confirmation for us to go to the most recent lower low area.

That’s about Fading the breakout, and we hope you find this lesson informative. Let us know if you have any questions in the comments below. Cheers!

Categories
Forex Basic Strategies

A Brand New Forex Trading Strategy By Combining The ‘Flag & Pennant’ Patterns

Introduction

Until now, we discussed a bunch of trading strategies that were based on numerous technical indicators. In today’s article, we discuss a strategy that is based on a candlestick pattern. Flags and Pennants are short-term continuation patterns where the market tends to continue moving in the same direction after the formation of the pattern on the chart. These patterns are found on both short-term and long-term charts.

In the case of Flag, the initial move is a sudden, sharp directional move. It is doesn’t matter where the move is formed on the chart; what matters here is the velocity of the move. If the movement is not sharp and large, the reliability of the pattern will be under question. However, it will also use the volume indicator to confirm the strength of the Flag and pattern. Let us understand all the specifications of the strategy in detail.

Time Frame

As mentioned earlier, the Pennant-Flag strategy can be traded on time frames varying from 15 min to ‘Daily.’

Indicators

The only indicator we will be is the ‘Volume’ indicator. The rest of all is based on candlestick and price action patterns.

Currency Pairs

The strategy can only be used on major currency pairs listed on the broker’s platform. Few preferred pairs are EUR/USD, USD/JPY, GBP/USD, GBP/JPY, EUR/JPY, etc.

Strategy Concept

The strategy is based on the concept of the Pennant Candlestick Pattern. A sharp thrust creates a flagpole, and then when the market begins to consolidate into an asymmetric triangle, we wait for a breakout or breakdown. The consolidation is a brief pause before a potential break on either side. If the price clears the top of the ‘Pennant,’ we look for ‘long’ trades, and if breaks below the bottom of the ‘Pennant,’ we look for ‘short’ trades.

After a large vertical flagpole and a triangular consolidation, the market might be getting ready for a further continuation. The odds of a breakout increase when this pattern is accompanied by high volume. In a bullish flagpole, we place our ‘entry’ order above the ‘high’ of the flagpole, and in a bearish flagpole, we place our order below the ‘low’ of the Flag. Of course, when we enter, we’ll need to place a stop.

The stop is calculated by measuring the number of pips that is equivalent to 35-40 percent of the flagpole. For example, if the height of the flagpole is 100 pips, the stop will be placed 25 beneath the entry point.

Finally, we will need to define exits for our trade. Our first target will be equal to the number of pips that we are risking on the trade. Another strategy is to trail the stop-loss trade and exit when the market shows signs of reversal. Let us look at the specifics of the pattern and technique to make winning trades.

Trade Setup

In order to explain the strategy, we have considered the 4-hour chart of EUR/USD, where we will be illustrating a ‘long’ trade. Here are the steps to execute the strategy.

Step 1: The first step of the strategy is to wait for a sharp, sudden, and strong candle to show up on the chart. This usually happens after a major news announcement or after the release of economic data. This candle should compulsorily be with high volume as it indicates that big players of the market created this move. If the candle is not with high volume, the move cannot be trusted upon. We could use the economic calendar to find out the exact time of news release and the event.

In the below image, we can see a large candle that popped up after a news announcement that took the prices sharply higher.

Step 2: After the sudden move, prices should necessarily move in a triangular pattern, which is shrinking in nature. Few traders also refer to this as ‘squeeze.’ This pattern should be formed on the lower time frame. Market moving in this ‘squeeze’ pattern is very important for the strategy to work at its best. This leads to the formation of a Pennant candlestick pattern. Pennants involve two parts – a vertical flagpole and a triangular consolidation. The consolidation is usually for a shorter duration of time. Once the pattern has been formed along with the necessary conditions, let us see how to enter a trade.

The below image shows the formation of a Pennant candlestick pattern on the 1-hour chart.

Step 3: The rules of ‘entry’ are pretty simple. In a bullish setup, we place a ‘long’ entry order just above the ‘high’ of the ‘flagpole’ candle formed on the higher time frame. In a bearish setup, we place a ‘short’ entry order just below the ‘low’ of the ‘flagpole’ candle. As and when the market continues to move in the direction of the ‘flagpole,’ the order will automatically be executed.

In the case of our EUR/USD example, our ‘buy’ order gets executed as soon as prices start moving higher.

Step 4: Now, let us define the exit rules for the strategy. The stop-loss is calculated by the number of pips equal to 35-40 percent of the ‘flagpole.’ Stop-loss is placed below the entry price equivalent to the pips obtained by calculation. The ‘take-profit’ is set a price where the resultant risk to reward of the trade is 1:1. Therefore, the take-profit is determined by the stop-loss. Another exit strategy is to trail the stop loss and exit after we witness a reversal pattern in the market.

Strategy Concept

The idea behind this technique is not to place most trades but to place the best trades. The most crucial aspect of the trade is the ‘Flagpole’ candle. We need to ensure that this candle is a consequence of a major news announcement and not just a normal candle. Many traders become impatient and enter even though all criteria have not been met. Patience and discipline will help us to avoid falling into this trap and keep us on the course.

Categories
Crypto Guides

A Brief Introduction To SushiSwap – An Evolution DeFi Project of UniSwap

Introduction

SushiSwap copied the mechanics of the most popular DeFi protocol known as “Uniswap” and challenged it, openly with new cryptocurrency trading features. We can consider SushiSwap as a Uniswap rivalry. The SUSHI token holders are provided with a share of the SushiSwap trading commission, and incentives are given to the liquidity providers.

It’s a community governed crypto trading platform as the SUSHI holders have the power to make governance decisions. SushiSwap made a strong strategy to give tough competition to Uniswap by paying temporarily extra-large SUSHI rewards to the first two-week liquidity providers. 

What is SushiSwap, and how does it work?

Before you start understanding SushiSwap, you must know about Uniswap. Uniswap is an exchange protocol of DeFi which executes operations without any order book. It follows a model known as automated market-making (AMM), where funds are released by liquidity providers in the pools. 

SushiSwap is a similar copy of Uniswap with few differences mainly – the SUSHI token. These tokens majorly have two functions at the time of launch: authorize the holder with administration rights, and a share of fees is paid to them from the protocol commission. In simple words, SUSHI token holders have “ownership” of the protocol. The community accepted SushiSwap at a large scale because tokens distributed by this provide liquidity incentives that grant the holders with governance rights. In addition, the SUSHI holders are also rewarded with a share of fees paid by traders in the protocol. 

With these governance rights, the token holders can vote for any suggested SushiSwap Improvement Proposal (PIP). Therefore, they play a great role in bringing any minor or major changes in the protocol. So, the whole development and execution process of SushiSwap depends on SUSHI holders, and for any successful token projects, a strong community is always a true asset. 

How are SUSHI rewards distributed?

‘Liquidity mining’ is the mode through which Sushi is distributed. SUSHI is given to those liquidity providers who specifically invest in 13 Uniswap pools. Later on, the Uniswap LP tokens can be deposited by such liquidity providers to SushiSwap staking contracts for earning SUSHI. 

Initially, the 13 Uniswap pools were as follows:

USDT-ETH, USDC-ETH, DAI-ETH, USD-ETH, COMP-ETH, LEND-ETH, SNX-ETH, UMA-ETH, 
LINK-ETH, BAND-ETH, AMPL-ETH, YFI-ETH, SUSHI-ETH
The SUSHI-ETH pool provides the investors with double rewards in return. According to the protocol, a new token will be punched each time a block is extracted on Ethereum’s network, and the distribution is initialized with Ethereum block 10,750,000. The target is to stamp out 100 new SUSHI tokens for each block, but for the starting 100000 blocks, 1000 SUSHI tokens will be created per block, and after that, the rewards will be reduced. This procedure is adopted to provide incentives to early investors in the protocol in order to encourage them for Liquidity Migration. 

Once 100000 Ethereum blocks are extracted and the tokens generated will be migrated for liquidity into the SushiSwap contract. In the process, all the Uniswap tokens staked on will be reclaimed to initialize a new pool of tokens. Once the liquidity migration is over to fuel the first SushiSwap pools, then immediate operations will be activated in the protocol. The investors, without any extra effort, will receive SUSHI token share for providing liquidity for further processing. 

Conclusion

SushiSwap challenged the current most successful DeFi protocol called Uniswap. This company is providing high returns to token holders and governance rights to its community. Irrespective of the SushiSwap’s success, it has proved that no protocol in DeFi is accurate.

Categories
Forex Fundamental Analysis

What Should You Know About ‘Asylum Applications’ Fundamental Indicator

Introduction

People from war-ravaged countries seek refuge in neighboring countries for their protection and survival. There are countries where military conflicts, wars, and political tensions were so adverse that people had to leave their homeland to go to an entirely different country to protect their life and survive barely. An understanding of the refugee movements, the price neighboring countries pay, and the corresponding economic impacts for the host countries is worth knowing.

What are Asylum Applications?

It is essential that we first clarify the fundamental differences between the terms refugee, migrant, asylum seeker before we understand asylum applications.

Refugee: They are the people fleeing from their home country to neighboring countries due to armed conflict, political wars, and persecution. Their conditions are so adverse that the only way to save their life is to seek shelter in neighboring countries. The prospect of a career, financial independence are out of the question, and it is just a matter of survival for these people.

Migrants: These are the people who move out of their country of origin in pursuit of a better standard of living and to improve life quality. The reasons can include better education, finding work, or reuniting with families. Unlike refugees, migrants can return to their native safely. Migrants are subject to the immigration laws of the recipient countries.

Asylum seekers: Asylum seekers are people who have claimed to be a refugee, but their status has not been yet evaluated. This individual would have applied for asylum (place to stay) because he/she will be persecuted if returned to their homeland. Not all applicants will qualify as a refugee but will have to go through the due process to become one. Asylum applications refer to the number of people who have come from other countries to seek asylum in the host country.

How can the Asylum Applications numbers be used for analysis?

War-ravaged countries primarily produce refugees in such large numbers that the neighboring countries would need to provide aid by providing protection, shelter, food, clothing, and water. The provisions for these asylum applicants would have to be provided by the local and central Government. Based on the available resources that can be dispensed to provide aid, countries may choose to close their gates and refuse entry too.

It is difficult to give accurate estimates of the effect of asylum applications on the economy due to lack of before and after data estimates. Some researches have shown poorer host countries have had a negative impact while developed nations have had zero or some positive impact. It has also been found that the applicants have actively sought work to improve their living conditions in the host country.

It is worth noting that the countries from which people flee are often surrounded by countries of similar economic strength, meaning the host countries are also underdeveloped nations. For such countries hosting a large influx of asylum seekers would also be burdensome and negatively impact their economic conditions. Only in a few cases, there are scenarios that people have sought asylum in a developed nation. Most of the time, people move to a developed nation as migrants to seek better work and not as a refugee.

Some researches have also shown that the funds received through the relief providing organizations and programs like the World Food Program (WFP), which provide in cash or directly food, add to the income of the host country, thus boosting the economy. Adding people into the host country also increases consumer demand, as well as revenue generated through the refugees who have found work also boosts the economy.

The influx of the refugee is generally small and lies on the border sides of the country. The overall impact on the economy is many a time negligible and is significant only when the host country is a small economy in itself and is underdeveloped. The way the host country’s Government manages refugee situations also determines whether they lose or benefit out of it.

Only when the influx of asylum seekers increases suddenly due to an overnight development of some critical situations is the effect felt on the host country. Under such circumstances, the host country may need to allocate resources to provide aid, which would impact the Government spending budget. The more the funds allocated for such rescue programs, the lesser the funds available for the Government to spend on economy-boosting activities.

Large scale influx of asylum seekers can also add to unemployment in either the refugee camps or the jobs taken away from host country citizens by the refugees. Refugees are desperate for work and would offer their labor at a very minimum rate compared to the citizens of the host country. All these effects come into play during extreme war-like situations in neighboring countries; otherwise, the economy comes to a natural equilibrium in due time with negligible impact.

Impact on Currency

The impact of Asylum applications on economy and currency is not always clear due to lack of sufficient before and after scenario data. Asylum application data comes into use during critical times when we are trying to trade currencies of the host or the crisis countries. Any volatility in the market created would be through the general market sentiment reacting to the news and not from the statistics.

Hence, asylum applications are a low-impact indicator that is only useful in critical times for data gathering and analysis. Therefore, the currency markets overlook it as they would have priced in any economic shocks presented through media ahead of the statistics.

Economic Reports

The United Nations Refugee Agency (UNHCR) publishes monthly reports on asylum application count as and when they receive reports from the Government authorities of different countries. The consolidated data of the same reports are also available on Trading Economics.

Sources of Asylum Applications

We can find refugee briefs on UNHCR official website for reference and latest updates on refugee migration. Asylum Applications for available countries are consolidated and available on Trading Economics.

That’s about Asylum Applications and their importance. We hope you find this article informative and useful. Let us know if you have any questions in the comments below. Cheers!

Categories
Crypto Guides

Could Bitcoin Ever Beat Gold & Get The Safe-Haven Status?

Introduction

The traditional investors from the last few months are trying to understand the unprecedented financial system. The world is suffering from economic uncertainties, where 20% of the US workforce lost their jobs due to the COVID pandemic situation. At the same time, the precious metal “gold” hit an all-time high in this 2020 summer and stayed on a hike for a long time ever since.

The gold rush in the market might be due to various reasons – US dollar fall, US-China deteriorating relations, and general global economic crisis. Also, cryptocurrency investors advocated that Bitcoin perhaps can beat gold as the safe-haven, but researchers pointed out the fact that BTC is not so performing. As with the stock market fall, the market worth of Bitcoin was also down – which means that BTC can’t be classed as a safe-haven asset.

Bitcoin and Gold Market Risk

Bitcoin and gold have emerged as a leading investment unit to stabilize the economic downfall. In the finance industry, there is no guarantee for returns on investment, so there is always high risk. It’s not true that the value of gold will always rise because, in 2012-2015, it was dropped by $20,000 per ounce. Similarly, BTC value bounces up and down. Gold is not so volatile as Bitcoin currency. Gold is acting as a safe-haven from the last 100 years, and bitcoin is in the market from the last decade.

Can Bitcoin be called a Safe-Haven Asset?

Amid all economic crises, bitcoin price hardly reached $9,011, and that too, with a high risk. So, it can’t be considered as a safe-haven asset due to the following two reasons:

Reason 1

The Bitcoin volume in the market is so small to validate the concept of the safe-haven asset. A safe-haven in the traditional market is the asset whose price rises typically. When there is any risk, the investors simply shift their money from risky assets to a safe one to avoid the loss and to retain their investment value.

In the traditional market, Bitcoin’s share is less than $200 billion US dollar, which is not enough to perform as a safe-haven asset. It lacks federal regulations for transactions, and there is a high risk of scams in the Bitcoin cryptocurrency industry. That’s why the Securities and Exchange Commission also rejected the Bitcoin ETF proposal.

Reason 2

Bitcoin can’t be accessed or used in the environment, having no internet connection. In extreme places, you may be cut-off from the cryptocurrency exchange and Bitcoin traders due to limited internet connectivity. For example, due to any major strikes, most of the time, the government shut down the internet accessibility to slow down the protests and all.

In the meantime, due to no internet connection bitcoin wallet and exchange system get hampered instantly. Therefore, bitcoin can’t be used in the emergency situation, so it can’t be considered as an alternative currency or safe-haven asset.

Conclusion

Gold is a risky asset because of sharp falls, and bitcoin, too, has speculative risk factors. In the case of the safe-haven concept, gold is already declared as a safe-haven asset in the traditional market, while Bitcoin is battling for the title. A wide range of economic forces across the world doesn’t impact its value, as BTC trade executes independently. Despite the global recession and high unemployment, BTC is doing great in the market. But for now, we believe that this is not enough to qualify as a safe-haven asset.

Categories
Forex Basic Strategies

An Exclusive Strategy To Trade The Fiber (EUR/USD) Currency Pair

Introduction 

In the previous article, we discussed a trading strategy that was a combination of EMA and RSI. Presuming that all the readers easily understood it, we will now discuss a trading strategy that is a combination of three technical indicators. Today’s article will acquit us with another useful and reliable trading system that is based on the combination of Simple Moving Average, Stochastic Oscillator, and Relative Strength Index (RSI).

Time Frame

This strategy is only applicable on the 1-hour time frame. This is because all the indicators tend to sync in this time frame. Therefore, the strategy may not be suitable for day traders.

Indicators

The strategy consists of three indicators – a 150-period Simple Moving Average (SMA), Relative Strength Index (RSI) with period 3, and a Full Stochastic Oscillator with standard settings. The overbought and oversold levels for the indicators stand at 70-80 and 30-20, respectively.

Currency Pairs

As the name suggests, this strategy is exclusively meant for ‘EUR/USD.’ The liquidity and volatility of EUR/USD are extremely supportive of this strategy.

Strategy Concept

We first identify the direction of the market using the 150-period SMA and then establish a channel in the same direction. This is the first condition that has to be met before we can initiate a ‘trade.’ One could also this is a ‘channel’ based strategy as it involves going ‘long’ at the bottom of the channel and ‘short’ at the top once the indicators generate signals.

For a ‘long’ entry, we need to see if the Relative Strength Index drops in the oversold area. Once it drops, we look for a bullish crossover of the Stochastic lines, while they are also within their oversold zone. In simple words, we need a channel in a bull trend with both the indicators indicating that the market is oversold and with the Stochastic displaying a bull reversal.

Conversely, a ‘short’ trade is generated when the price starts moving in a downward channel in a bearish trend. The RSI and Stochastic should be in the overbought area that will later display a bearish reversal. As soon as the Stochastic fast and slow lines make a bearish crossover, we enter for a ‘sell’ on the next price bar. All of the above price action must happen below the 150-period SMA.

The strategy offers a high degree of capital protection as we place our stop-loss at the most recent ‘swing low’ or ‘swing high.’ As far as the ‘take-profit’ is concerned, we can use a fixed profit target, or we could scale out as the market approaches our target and protecting it with a trailing stop. An exit signal is also generated by the Stochastic indicator, which we will be discussing in the upcoming section of the article.

Trade Setup                     

In order to explain the strategy, we have considered the 1-hour chart of EUR/USD, where we will be applying the rules of the strategy to execute a ‘long’ trade.

Step 1: First of all, open the 1-hour chart of EUR/USD and establish the trend of the market. Plot Simple Moving Average (SMA) with a period of 150, Stochastic and Relative Strength Index with their default settings on the chart. If the price is above the 150-period SMA, we say that the market is in an uptrend. Whereas if the price is below the 150-period SMA, we say that it is in a downtrend. Next, draw a channel within the trend. It is better to have an upward channel in an uptrend and a downward channel in a downtrend.

Step 2: This is the crucial step of the strategy, where we align the three indicators together to generate a signal. After the identification of the trend and channel, we need to wait for the price to come at the extreme of the channel. In an upward channel, the price should be at the bottom of the channel, while in a downward channel, the price should be at the top.

Once the price reaches these extremes, we should watch the Stochastic and RSI. We enter ‘long’ when we notice a bullish crossover in Stochastic and an oversold circumstance of RSI (below 40). This means that the price might be putting up a ‘low’ that will result in a reversal. Similarly, we will go ‘short’ in the currency pair when we notice a bearish crossover in Stochastic along with an overbought condition of RSI (above 60).

The below image shows an example where the above step is being accomplished.

Step 3: In this step, we shall determine the Stop-Loss and Take-Profit for the trade where both these levels are derived mechanically. We place the stop-loss just below the ‘swing low’ from where the reversal took place. It will be above the recent ‘swing high’ in a ‘short’ trade. When speaking of the take-profit level, there is no fixed point for it. We take our profits when Stochastic reaches the opposite overbought/oversold level. At this point, we can either exit the trade, scale-out, or use a trailing stop. This can help in increasing the risk-to-reward (RR).

In our case, the risk-to-reward (RR) ratio of the trade was 1.5, which is above average.

Strategy Roundup

The RSI+Stochastic+SMA strategy is a reliable trend trading system that accurately pinpoints the bottom of a channel in a trend. More importantly, the strategy can provide the best-with-trend entry points that are necessary to increase the probability of winning. Since we are applying this strategy on a higher time frame, it will limit the effects of whipsaws that are encountered more often these days.

Categories
Forex Fundamental Analysis

Do You Know That ‘IP Addresses’ of A Nation Is Also Considered A Macro Economic Indicator?

Introduction

The advent of the Internet and the rapid growth of technology over the years has dramatically changed the way we define development and living standards. The number of literate people nowadays do own an electronic gadget with access to the Internet. It was not the case long before, but now access to the Internet is seen as a growth measure for countries. Understanding the IP addresses count as a means to assess how developed a nation is fascinating to acknowledge and look back on how the Internet changed the world.

What is an IP Address?

Each electronic gadget with internet access has a unique identifier called its IP address. An analogy would be like the “from” address in a post letter. Successful transfer of to-and-fro of data from mailer to recipient is possible when “from” and “to” addresses are clear. The unique address of your computer machine is used to relay data across a network in either direction.

The majority of the networks today use TCP/IP (Transmission Control Protocol/Internet Protocol) as a means to communicate with other machines over a network. The unique identifier for a computer is known as its IP address.

There are two standards for IP address: IPv4 and IPv6 (v stands for version). All computers have the IPv4 address, and it is the prior version consisting of (24 =32 bit binary digits). At the same time, it will soon exhaust all possible combinations as more people start accessing the Internet. A sample IP address would look like “138.23.45.23” this. The IPv6 (26 = 128-bit binary digits) is the later implementation that came into the picture when we realized the limitation of IPv4 as the Internet was not an immediate trendsetter during its initial launch. The IPv6 will have six numbers as part of the address and would look something like “12.158.23.61.3.23” this.

How can the IP Addresses numbers be used for analysis?

Ten-twenty years ago, this article would be invalid as the Internet’s popularity grew exponentially until today to become an indispensable part of most economies. The Internet is now the primary source of information and communication. In today’s world countries, where the majority of people do not have access to the Internet are seen as third-world countries. It is a meaningful inference, though. Countries that have high literacy rates are bound to be aware of the Internet, computers, and similar electronic gadgets. People are rapidly incorporating technology all across the world and, through the Internet, are more connected than ever before.

Even if we look at the statistics and see the countries with one of the highest number of IP addresses are generally the most developed nations. Likewise, countries with the least number of IP addresses are generally underdeveloped nations. As more people are educated, have enough money to own a computer or electronic gadget, and have access to the Internet are likely to have a better living standard than those who do not.

One likely drawback of this type of inference would be that the IP address count is also a function of the population. Countries like India or China that have a large population count would easily surpass those who have a relatively small area of land and population. In that case, a percentage of the total population could be used to compare how many people have access to the Internet. In this digital age, the Internet is a powerful tool to incorporate new technologies, take advantage of access to external resources, and rapidly grow.

Businesses that do not have a “.com” are typically seen as not an established brand themselves. A digital presence of a business is almost mandatory as it has become one of the primary sources through which people know about the company. People, businesses, corporations, and governments are all accessible to us via the Internet. Hence, IP addresses count can give us more insight into how developed a country is than we think.

For instance, Bangalore, a city in India, is nowadays referred to as the Indian Silicon Valley due to a massive number of IT and Software companies operating as a primary business center there. With India incorporating electronic gadgets and the Internet (3G, 4G, and now 5G soon) boosted the economy, providing rapid growth and for consecutive years had one of the highest GDP growth rates globally. In this sense, the IP address count trend can be used to forecast growth trends in other developing countries.

Internet is a gold mine, companies like Facebook, Google have a net worth in billions, and the traditional definitions of large businesses do not apply to internet giants. Making proper use of the Internet and the available resources can potentially help in earning huge revenues. Even currency or stock trading are all done online for which we need internet access. Even this very article you are reading requires an internet connection and a computer (or a mobile) to begin-with.

Impact on Currency

The IP address count of countries serves as a general measure of prosperity. The relative growth of countries by the count and percentage share can be used to understand how open and adaptive countries are to the latest technologies. The countries with increasing IP addresses are likely to undergo a transformation and achieve high economic growth. We can forecast long-term trends through these statistics due to which it is a low-impact leading economic indicator as currency markets focus on current economic trends.

Economic Reports

The global count of IP addresses across countries is available through an internet company known as Akamai. However, the quarterly consolidated and graph plots of these statistics of most countries are available on Trading Economics.

That’s everything about IP Address Forex fundamental driver. It is obvious that there won’t be any impact on the price charts after the news release of this economic indicator. Cheers!

Categories
Forex Basic Strategies

Generating Reliable Trading Signals Using ‘The Power of Two’ Forex Strategy

Introduction 

In the previous article, we discussed a strategy that was based on three indicators, namely the RSI, Stochastic, and SMA. It was not only a bit complex in nature but involved many rules that had to be fulfilled before we could make a ‘trade.’ Also, the probability of occurrence of the signal was lower as it involved many indicators.

In today’s article, we will discuss a setup that is observed more often in the market and has a higher probability of success. Again, the strategy may not be suitable for day traders as it used a longer time frame for analysis. In this strategy, we will be examining the 4-hour time frame chart of the currency pairs. This is simpler than the previous strategy.

Time Frame

As mentioned in the previous paragraph, the strategy yields the best results when applied on the 4-hour time frame. However, the ‘daily’ is also a suitable time frame for the strategy.

Indicators

We will be using the Relative Strength Index (RSI), with a 14-bar period. The overbought and oversold levels stand at 70 and 30, respectively. We also apply the Bollinger Band indicator with its default settings.

Currency Pairs

This is the best part of the strategy, where we can apply on all currency pairs listed on the broker’s platform, including few minor and exotic pairs.

Strategy Concept

The strategy is based on a simple concept that the RSI is a very powerful indicator of a trend. It can accurately identify the highs and lows that will give rise to a new trend. This is combined with the Bollinger Band indicator to generate exact entry points for the strategy.

The trend becomes especially reliable when the reading of RSI makes a swift jump from an oversold level to a median level (above 50) and vice-versa. The Bollinger Band indicates the formation of a ‘low,’ after which we can execute a ‘long’ trade. Similarly, when Bollinger Band pin-points a ‘high,’ we execute ‘short’ trades in the market. The exact rules of ‘entry’ will be discussed in the next section of the article.

The risk-to-reward (RR) of the trades done using this strategy is highly appealing. This is because it employs a small stop-loss with a much higher take-profit. If the market is in a strong trending state, traders can ride their profits as long as they see signs of reversal.

Trade Setup 

In order to explain the strategy, we have considered the 4-hour chart of GBP/JPY, where we will be illustrating a ‘long’ trade. Here are the steps to execute the strategy.

Step 1

The first step is to open the 4-hour timeframe of the desired currency pair and plot Bollinger Band and RSI indicator on it. Just from the appearance and basic knowledge of trends, identify the trend of the market. This means if the market is making higher highs and higher lows, the market is in an uptrend. And if we see lower lows and lower highs on the chart, it is a downtrend. We can also take the assistance of a simple moving average (SMA) to get a clear picture of the trend.

In the case of GBP/JPY, it is evident from the below image that the market is in a strong downtrend.


Step 2

Next, we need to wait for the price to go above the highest point visible on the chart, where we will be analyzing signs of a reversal to the downside. Similarly, we need to wait for the price to go below the lowest point visible on the chart, where we will be analyzing the signs of a reversal to the upside. For example, suppose the price is near its lowest point visible on the chart. In that case, we say that market may be reversing to the upside if a bearish candle closes below the lower band of the Bollinger Band, and the immediate next candle is a bullish candle that closes above the lower band. This has to be accompanied by the RSI moving into the oversold zone (below 30).

In case of a reversal of an uptrend, a bullish candle should close above the upper band of the Bollinger band with a bearish candle that closes below the upper band. At this price, the RSI should indicate an overbought situation of the market (above 70).

Step 3

This is the easiest step of the strategy where we have to only observe the movement of price following the ‘two-candle’ pattern discussed in the previous step. Essentially, we need to see that the price starts moving in the direction of the reversal, i.e., above or below the median line of Bollinger Band. This should again be accompanied by a rising RSI for ‘long’ entry and falling RSI for a ‘short’ entry.

In the below image, we can see how the rise in price above the median line goes with a sudden rise in RSI.

Step 4

In this step, we determine the stop-loss and take-profit for the trade done using this strategy. The stop-loss is placed just below the ‘low’ or above the ‘high’ from where the market reverses. However, there is no fixed take-profit level here. We exit a ‘long’ trade once RSI goes below 50 and start moving lower. While a ‘short’ trade is exited as soon as RSI goes past the level of 50.
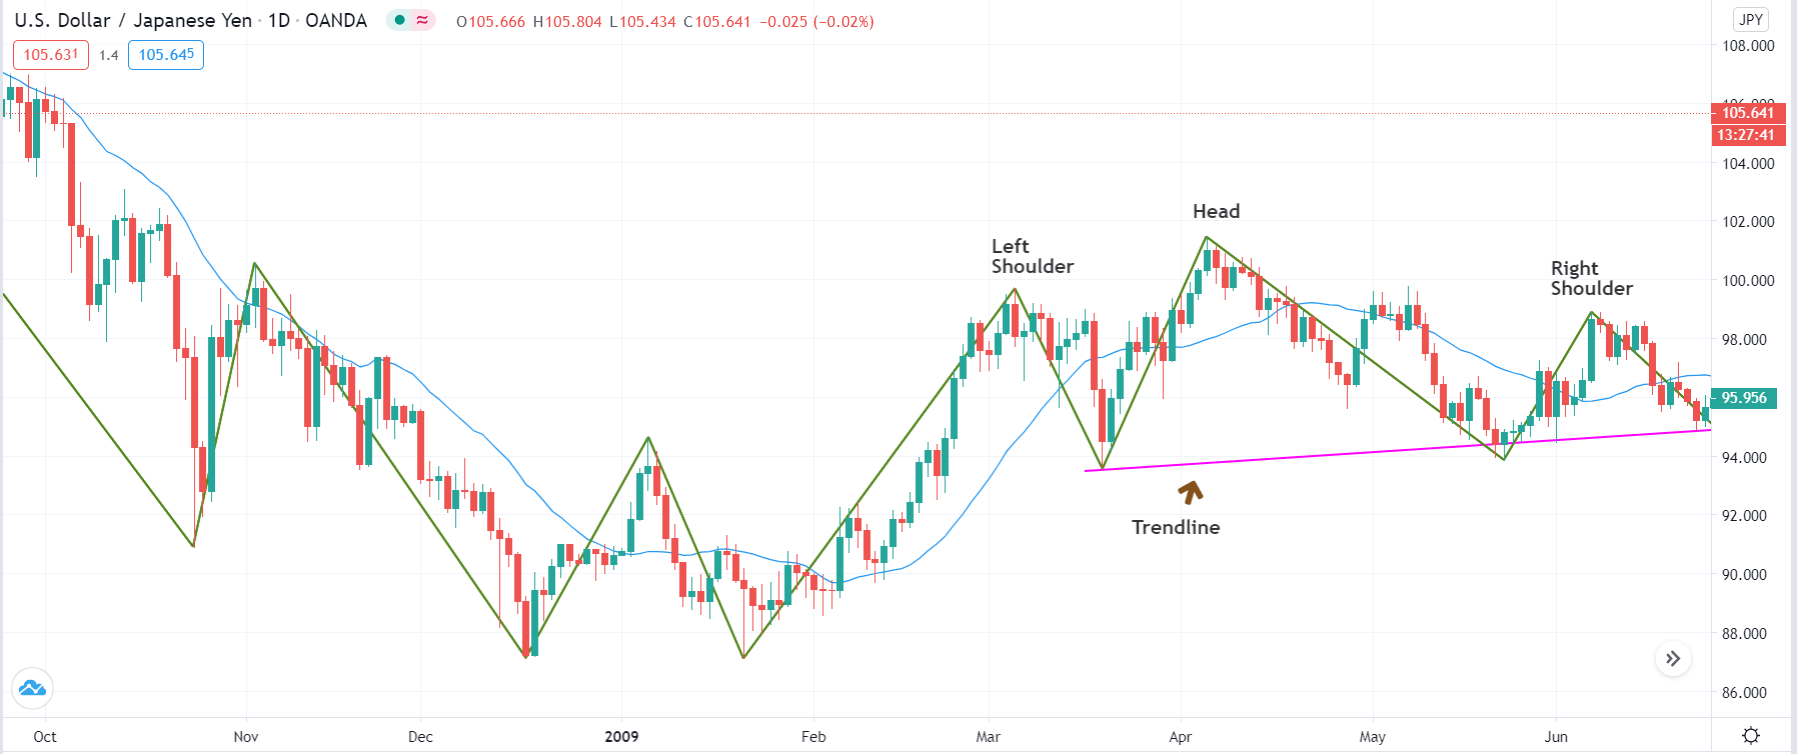
As we can see in the image below, the market reversed fully, and the trade turned to be extremely profitable.

Strategy Roundup

When Bollinger Band and RSI are combined to generate trade signals, we can accurately identify the market top and bottom where we take advantage of the reversal. But this can only be done efficiently after practicing well. The above strategy is suitable for swing and part-time traders.

Categories
Forex Fundamental Analysis

The Impact Of ‘Total Vehicle Sales’ Data On The Forex Market

Introduction

Vehicle sales figures offer us much insight into the consumer demand and overall health of the economy. Changes in vehicle sales figures could also be used for predicting the near-future direction of economic growth. Understanding how vehicle sales figures can be used to infer upcoming trends in crucial economic indicators could always give us the advantage of being ahead of the market trend.

What is Total Vehicle Sales?

Total Vehicle Sales represent the overall number of domestically produced vehicles that have been sold. The reports could be monthly, quarterly, or even yearly, depending on the reporting vehicle manufacturing companies. In other words, Total Vehicle Sales is the annualized new vehicles sold count for a given month.

The automotive industry represents a vital component of the United States economy. It makes up about 3% of the total GDP and remains the largest industry in the manufacturing sector. It is responsible for employing lakhs of people in the United States and transacts in billions each year.

How can the Total Vehicle Sales numbers be used for analysis?

At first, the importance of the vehicle sales figure may not be apparent, but vehicle sales serve useful for economic analysis. A vehicle is a significant purchase for people. People buy vehicles when they are confident about their ability to make payments. It is possible only when they have considerable disposable income or procure loans at lower interest rates.
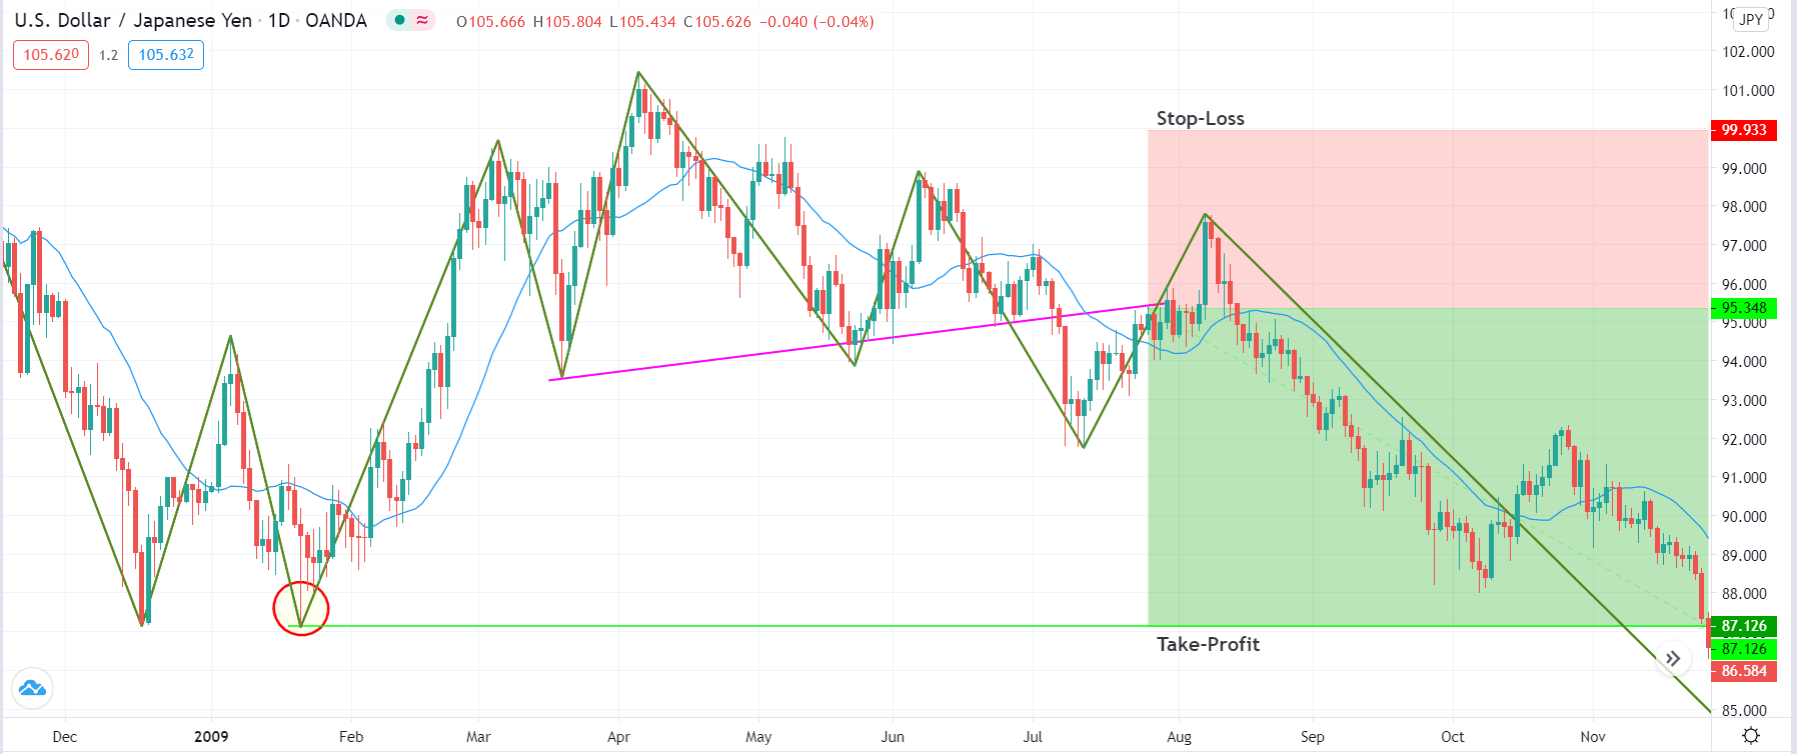
When people’s disposable income is considerable, it means the people are affluent financially and reflects the good health of the economy. On the other hand, when loans are available to more people at lower interest rates, it means there is sufficient monetary stimulus from Central Banks to promote economic growth and money is easy to come by. Such inflationary pressures stimulate economic growth and indicate that the economy is likely to grow steadily.

The increase in vehicle sales figures reinforces the positive affirmations forecasted by other economic indicators like consumer spending or interest rates. As consumer spending comprises more than two-thirds of the GDP, an increase in vehicle sales likely indicates a healthy two or three quarters that are going to continue in the economy.

Equity markets respond and perform exceptionally well around the Total Vehicle Sales figures, as the increasing figures in sales imply increasing profits for the related companies. The increase in profits due to sales is doubled down by the stock prices soaring higher, and vice-versa also holds. Hence, the vehicle sales figures are given much-deserved attention every month by the equity traders and the media. To some degree, currency markets feed off from the equity markets, but the effect is noticeable only when the changes are significant.

Vehicle purchases are considered to be discretionary spending, and when people are paying for such items, it indicates the economy is flourishing. The relation between vehicle sales and economic growth also becomes more apparent during recessions, where vehicle sales drop significantly. During the Great recession of 2007-2009, vehicle sales fell by 3 million.

With rapid development in the automobile industry, more durable vehicles that last longer, unlike older models, are coming into the market.  It means people need not buy new vehicles as frequently as before. Hence, recent trends should incorporate this factor also into the statistics.

Alongside this, there is a shift in the industry due to disruptive brands like Tesla introducing electric cars as a contrast to combustion engines. It affects the industry and the dependent oil and gasoline industries as well. Self-driving and Artificial Intelligence equipped automobiles are catching up with the people, and this could soon invalidate many traditional jobs that came as a result of the regular gasoline cars and trucks.

The current COVID-19 pandemic already cost the economies of most countries much than they could handle, and many industries suffered heavy losses. The silver lining for the automotive industry is coming from the fact that as people resume their regular life by going back to their work require a safe commute. Things are looking brighter for the automobile industry as more people are considering the safety assured through private commute over the risk involved in the public transportation system.
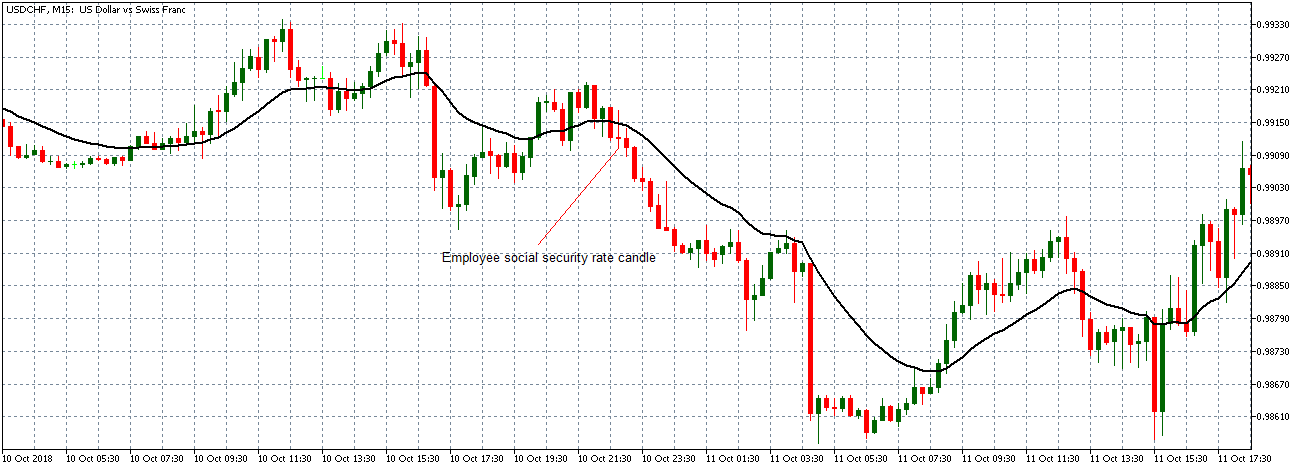
Impact on Currency

Vehicle Sales acts as a coincident indicator that reflects the health of the economy at the current state. The currency markets are focused more on the leading indicators before the trends pick up. Total vehicle sales prove to be more useful for the equity markets for trading on the automobile and other related industries, but currencies require more than just vehicle sales.

Hence, overall Total Vehicle Sales are a low-impact indicator for the FOREX market and are useful in double-checking or reaffirming our leading indicator predictions. Economists and business analysts will use total vehicle sales data to report current economic health, but currency traders can overlook this indicator for other macroeconomic leading indicators.
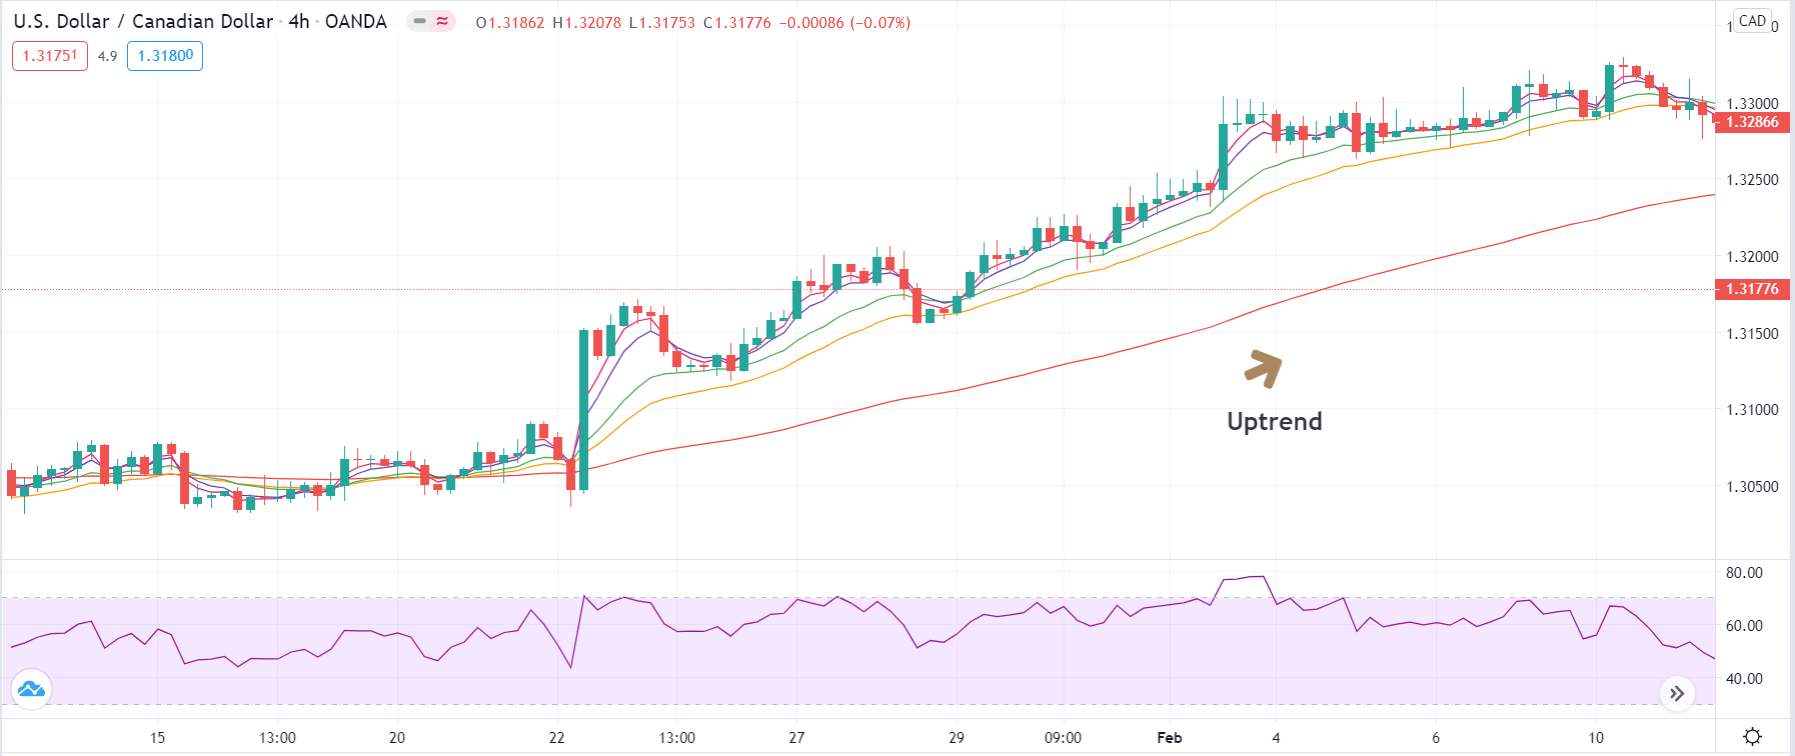
Economic Reports

The Bureau of Economic Analysis (BEA) provides monthly reports on total vehicle sales on its official website. Apart from this, the St. Louis FRED website also details the same figures historically in a more comprehensive and visually depictive way.

Sources of Total Vehicle Sales

We can obtain Total Vehicle Sales figures for the United States from BEA.

For analysis purposes, the St. Louis FRED website offers better resources and ease of access for Vehicle Sales figures.

We can obtain Global Total Vehicle Sales figures for the majority of the countries from Trading Economics.

How Total Vehicle Sales Data Release Affects The Price Charts

In the US economy, total vehicle sales data is an important leading indicator of consumer spending and consumer confidence. It measures the annualized number of new vehicles sold domestically in the reported month. The most recent data related to this was released on August 3, 2020, at 7.00 PM ET. The total vehicle sales is a combination of all car sales and all truck sales data and can be accessed from Investing.com here. The historical data of total vehicle sales can be accessed from Trading Economics here.

The screengrab below is of the monthly total vehicle sales from Investing.com.

As can be seen, the total vehicle sales data is expected to have a low impact on the USD upon its release.

The screengrab below shows the most recent changes in the monthly total vehicle sales data in the US. In July 2020, the monthly total vehicle sales were 14.5 million compared to 13.1 million in June 2020. This increase is expected to be positive for the USD.

Now, let’s see how this release made an impact on the Forex price charts.

EUR/USD: Before Monthly Total Vehicle Sales Release on August 
2020, Just Before 7.30 PM ET

From the above 15-min EUR/USD chart, the pair can be seen to be trading on a neutral trend before the release of the total vehicle sales data. This trend represents a period of relative market inactivity with candles forming near a flattening 20-period Moving Average.

EUR/USD: After the Monthly Total Vehicle Sales Release on 
August 2020, 7.30 PM ET

After the data release, this Forex pair formed a 15-minute bearish candle, indicating that the USD became stronger as expected due to the increase in total vehicle sales. The data release was, however, not significant enough to cause any market volatility as the pair continued to trade in a neutral trend with the 20-period Moving Average flattening.

GBP/USD: Before Monthly Total Vehicle Sales Release on August 
2020, Just Before 7.30 PM ET

Similar to the trend that we have observed with the EUR/USD pair, the GBP/USD was trading in a neutral pattern before the data release with candles forming around a flattening 20-period MA.

GBP/USD: After the Monthly Total Vehicle Sales Release on 
August 2020, 7.30 PM ET

After the news announcement, this pair formed a 15-min bearish candle but continued trading in the neutral trend observed before the data release.

AUD/USD: Before Monthly Total Vehicle Sales Release on August
2020, Just Before 7.30 PM ET

AUD/USD: After the Monthly Total Vehicle Sales Release on 
August 2020, 7.30 PM ET

As observed with the EUR/USD and the GBP/USD pairs, the AUD/USD traded within a subdued neutral trend before the data release. The pair formed a 15-minute bearish candle after the news release, but unlike the other pairs, it continued trading in a weak uptrend.

Although it plays a vital role as an indicator within the economy, it is evident that the total vehicle sales indicator does not cause any significant impact on the price action in the forex markets.

Categories
Forex Basic Strategies

Learning The ‘Intraday Strategy’ To Trade The Forex Market

Introduction

In today’s article, we present to you a fairly simple but reliable trading strategy that can be used by all types of traders, irrespective of their style. It is believed that when markets are strongly trending in one direction, it gets impossible to catch the stalling point. It is only difficult to catch the ‘top’ or ‘bottom’ of the market, but it also carries a huge amount of risk. We are going to discuss a trading strategy that is contrary to this common belief. We shall try to catch the highest or the lowest point in the market by using some of the most powerful technical indicators and techniques.

Time Frame

The strategy can be used on the 5 minutes, 15 minutes, and 1-hour time frame chart. An intraday trader would apply the strategy on the 5 or 15 minutes chart, whereas a positional trader would open the 1-hour chart.

Indicators

We use the following indicators in the strategy:

  • 5-period Exponential Moving Average (EMA)
  • 10-period Exponential Moving Average (EMA)
  • 14-period Relative Strength Index (RSI)
  • Slow Stochastic Oscillator
  • K and D period – 3

Currency Pairs

This strategy can only be applied on major currency pairs of the forex market. Some of the preferred pairs include EUR/USD, GBP/JPY, GBP/USD, USD/CAD, USD/JPY, EUR/GBP, etc.

Strategy Concept

The rules of the strategy are quite simple and straightforward. We enter the market for a ‘long’ when the 5-period EMA crosses above the 10-period EMA after a prolonged downtrend. But this isn’t enough. Along with this, the RSI should be above the level of 50, and Stochastic slow and fast lines should move in the same direction (upward). Here we need to make sure that the Stochastic does not enter the overbought zone. Similarly, if the 5-period EMA crosses below the 10-period EMA after a prolonged uptrend, we prepare to enter ‘short.’ In this case, the RSI should be below the level of 50, and Stochastic lines should be moving downwards.

We exit the trade when 5-period EMA crosses beyond the 10-period EMA, where this is confirmed by the close of a candle beyond the latter. Another way to exit the trade is when the RSI drops below the 50 level. The several conditions which must be fulfilled in order to execute a trade make the strategy a good filter for trade entries. However, the two EMAs have a drawback as they can get choppy and generate false signals. We can avoid this by carefully monitoring the movement of EMA lines along with the other indicators. When the strategy is executed by following every rule of the strategy, wrong ‘trades’ can be eliminated to a great extent.

Trade Setup

In order to explain the strategy, we have considered the 5 minutes chart of EUR/USD, where we will be illustrating a ‘long’ trade. Here are the steps to execute the strategy.

Step 1: The first step is to identify the trend of the market and plot all the indicators on the chart, as mentioned in the above section. An easier way to identify the trend is by looking at the price concerning 5 and 10 period EMA. If the 5-period EMA is above the 10-period EMA, we say that the market is an uptrend. Whereas, if the 5-period EMA is below the 10-period EMA, the market is said to be in a downtrend.

In the example considered, it clear from the below image that the market is in an uptrend, and at the end, the trend seems to be weakening.

Step 2: This is the most critical step where we combine all the rules of the strategy. Once the trend has been identified, we should wait for a crossover of the 5-period EMA below the 10-period EMA, during the reversal of an uptrend. We say that the market has made a ‘top’ when both RSI and Stochastic lines start moving lower after the crossover. We should make sure that RSI does not move into the oversold zone. In order to catch the reversal of a downtrend, we should see a crossover of the 5-period above the 10-period EMA. At the crossover, the RSI and Stochastic lines should head upwards but so much that they move into the overbought zone.

The below image shows the crossover of both the EMAs that is accompanied by a ‘moving down’ RSI and Stochastic.

Step 3: Let us discuss the ‘entry’ of the strategy. We enter the market after a confirmation candle in the direction of the reversal. That means we enter ‘short’ after the close a bearish candle below both the EMAs. Similarly, we go ‘long’ after the appearance of a bullish candle, where the price closes above both the EMAs.

We can see in the below image that we are entering the market for a ‘sell’ right after at the close of the price below the 10-period EMA.

Step 4: In this step, we determine the stop-loss and take-profit for the strategy. The stop-loss is pretty straight forward where we place it just above the ‘highest’ or ‘lowest’ point. We take our profit and exit the position based on the signal provided by RSI. There two ways to exit the strategy. The first signal provided by the market to exit is when the crossover of the EMAs takes place. The second way to exit is when the RSI starts moving higher and crosses above the level of 50.

In the case of EUR/USD, as shown below, we take our profits when both the indicators indicated a reversal of the trend.

Final Words

The strategy actually generates various entry signals, and each of them can at least result in a profit for scalpers, by running very tight stops and keeping risk low. Thus, the strategy makes a reliable reversal trading system which relatively accurately pinpoints reversal points at the end of a trend and, more importantly, the ability to provide high risk-to-reward (RR) trades.

Categories
Crypto Guides

What Should You Know About ‘Automated DeFi-Styled Market Pool’ Launched By Binance

Introduction

The leading global cryptocurrency exchange “Binance” launched an automated DeFi-styled market pool for cryptocurrency investors to offer them with instant token swapping functionality. Binance officially brought this new trading platform from the decentralized finance (DeFi).

The platform will allow the money maker to deal with smart contracts. The cryptocurrency exchange system announced that it is an automated market maker (AMM) pool. The users are not only allowed to trade with funds but can also host liquidity pools. For the first time, an AMM pool is attached to the centralized trading exchange system. 

Binance Liquid Swap Product

The AMM pool product called “Binance Liquid Swap” will allow the users to keep their crypto funds in the pools for providing liquidity to the market. In return, they will earn the interest and share from the pool trading commission. They implemented an AMM model for pricing to provide users with stable pricing and low fees.

The AMM exchange model uses a predefined algorithm for pool liquidity to make markets. The exchanges provide liquidity to the pools regardless of the user’s token prior order size. The reward system and trading fee are yet to be disclosed. 

To start, the AMM pool provides the following trading pairs :

  • USDT/BUSD
  • USDT/DAI
  • BUSD/DAI

The security of the product is strengthened due to the Binance platform and also because of its move into the DeFi space with the launch of Binance Smart Chain. The smart chain is a highly performing Ethereum virtual machine. It is compatible with blockchain and works in parallel with the Binance chain. It offers users with smart contracts and allows them to stake a Binance coin. 

Binance Jump in DeFi 

In Binance, the liquid swap transaction fees and prices on AMM depend upon the asset number in each liquidity pool. The prices vary when currencies are added, removed, or swapped in the pool. The trader’s share in the pool will be collected every 7-day as an annual percentage yield (APY). The profit generated will be turned into assets for the respective pools. Binance introduced AMM pools to centralized exchange systems for more safety, security, and credibility.

As the decentralized Ethereum pool is highly risky due to huge market price fluctuations; hence, Binance went for the centralized approach, which would most probably minimize the big margin loss. The Binance is working to deliver instant swap liquidity in order to attract more participants and to incentivize the pool contributors for the community benefit. 

Conclusion

Binance designed this new DeFi “Binance Liquid Swap” having different liquidity pools so that users can earn income instantly and easily without much effort. The centralized AMM pool offers users to buy, stake, and trade their crypto assets. The instant swapping functionality will be executed via a centralized platform.

The users will be able to earn through interest and trading commission from the shares. This centralized platform is able to provide stable transaction prices and lower fees. The DeFi products perform better in the market if more investors are involved in providing liquidity to trade. Hence, to attract more liquidity providers, Binance is providing rewards in return. 

Categories
Forex Fundamental Analysis

Understanding What ‘GDP Deflator’ Is & Its Relative Impact On The Forex Market

Introduction

Investors and traders are continuously trying to determine which country is growing relatively faster to make currency investment decisions. Assessing growth for capitalist economies that use inflation as fuel can be tricky to understand. The differentiation between nominal and real growth, effects of inflation, and the role of a deflator are necessary to understand to arrive at correct conclusions from statistics.

What is GDP Deflator?

Most of the economies that we have today are capitalist economies and use inflation as the primary fuel for growth. Currency traders want to go “long” on currencies of countries that are experiencing relatively higher growth than other countries. Hence, a correct assessment of growth is crucial.

The broadest and most widely used measure of the growth of economies is the Gross Domestic Product (GDP). The GDP is the monetary measure of all goods and services produced within a country for a given period (quarter or year). Although, before GDP, Gross National Product (GNP) was widely used to compare growth amongst economies. GNP measures growth beyond borders and has certain limitations in its usage as a growth measure.

GDP Deflator

It is also known as GDP Price Deflator or Implicit price deflator. It measures the price changes in all goods and services produced within an economy. It measures inflation at the macroeconomic (or national) level. As prices of commodities increase over time, the GDP values are “inflated” over time.

For instance, a country that has a GDP of 10 million dollars for the year 2019 and 12 million dollars for the year 2020 would appear to have grown 20%. If the inflation rate for the duration was 10%, meaning the prices rose by 10% for all the commodities, then 1 million dollars out of 12 million dollars came purely through increased prices and not increased production. Hence, in 2020, the real GDP was only 11 million dollars. Therefore, real growth was only 10% instead of 20%.

The Nominal and Real GDP figures are vital to understand and measure the level of inflation by calculating the GDP deflator. The following formula gives the GDP deflator:

Here, the nominal GDP is the total dollar value of all commodities produced in an economy without accounting for inflation. It is a direct monetary measure of goods and services. Real GDP is the inflation-adjusted value of GDP. It strips away the effect of inflation from Nominal GDP to show real growth.

Deflators like the Real GDP also have a base year against which all other years’ figures are compared. For the United States, 2012 is the base year, meaning GDP deflator value for the year 2012 would be 100 (as nominal and real GDP would be equal due to zero inflation). Subsequent years will have higher or lower values accordingly to indicate inflation and deflation, respectively. The base year varies from country to country.

How can the GDP Deflator numbers be used for analysis?

It is essential to understand how inflation masks the real growth and leads us to make the wrong conclusions. As seen in the above example, countries may show higher and higher GDP figures, but in reality, they may have only achieved little or no growth at all. When comparing growth over several years, the GDP deflator is key to the analysis to strip away the effects of inflation. By employing the equation above, if we get a deflator score of say 110, it would indicate there is a 10 percent inflation during the observed period.

The Consumer Price Index (CPI) is the most popular and widely used indicator to measure inflation. The GDP deflator has some advantages over the CPI. As the CPI measures inflation for a fixed basket of goods and services, which does not change frequently, the GDP is a macroeconomic aggregate measure of inflation. The GDP deflator factors in any change in economic output and investment patterns. Any new change in the goods produced or change in the consumption patterns of people is accounted in by the GDP deflator, unlike CPI. The CPI basket is static and cannot account for commodities price changes that are not in the basket, whereas the deflator is all-inclusive in this regard.

It is also necessary to know that CPI includes the most commonly used goods and services that have an impact on the economy. It updates its basket as patterns change over the years. Hence, over time the GDP deflator and the CPI have similar trends and can be used interchangeably.

Impact on Currency

The GDP deflator is a basic measure of inflation that erodes currency value. It is an inversely proportional lagging indicator. High values of the deflator are bad for the currency value and vice-versa. Since it is one of the measures of inflation, it is a low-impact lagging indicator as it is not as popular and as frequent as the CPI. It is a quarterly statistic, whose effects are already priced in through more frequent inflation measuring statistics.

Economic Reports

The Bureau of EA releases quarterly reports of the GDP price deflator alongside the quarterly GDP figures on its official website for the United States. GDP and deflators are essential macroeconomic indicators, and therefore are available on the World Bank and many other international organizations like the OECD, IMF, etc.

Sources of GDP Deflator

The BEA releases its quarterly GDP deflator statistics on its official website for the public.

The World Bank also maintains GDP and GDP deflator statistics for most countries on its official website.

Deflator figures for most countries can be easily found on the Trading Economics website.

How GDP Deflator Data Release Affects The Price Charts

In the US, the GDP deflator is released by the Bureau of Economic Analysis quarterly, about 30 days after the quarter ends. It measures the annualized change in the price of all goods and services included in gross domestic product; and is the broadest inflationary indicator. The most recent data was released on July 30, 2020, at 8.30 AM ET can be accessed at Investing.com here. An in-depth review of the GDP deflator data release can be accessed at the Bureau of Economic Analysis website.

The screengrab below is of the GDP deflator from Investing.com. On the right, a legend indicates the level of impact the fundamental indicator has on the USD.

As can be seen, GDP deflator data is expected to have a medium impact on the USD after its release.

The screenshot below shows the most recent changes in the GDP deflator in the US. The GDP deflator changed by -2.1%, worse than analysts’ expectations of a 1.1% change. This change is expected to the negative for the USD.

Now, let’s see how this release made an impact on the Forex price charts.

EUR/USD: Before the GDP Deflator Data Release on July 30, 
2020, Just Before 8.30 AM ET

Before the news release, the EUR/USD pair traded in a neutral pattern. This trend is evidenced by the 15-minute candles forming on an already flattened 20-period Moving Average, as shown in the above chart.

EUR/USD: After the GDP Deflator Data Release on July 30, 
2020, at 8.30 AM ET

After the data release, the pair formed a 15-minute “hammer” candle. This trend is as expected since the USD weakened against the EUR. The data release was significant enough to cause a change in the market trend. The market adopted a steady bullish stance as the pair traded in an uptrend with the 20-period Moving Average steeply rising.

GBP/USD: Before the GDP Deflator Data Release on July 30, 
2020, Just Before 8.30 AM ET

Unlike the EUR/USD pair, the GBP/USD pair was trading in a steady uptrend before the data release.

GBP/USD: After the GDP Deflator Data Release on July 30, 
2020, at 8.30 AM ET

After the data release, the pair formed a bullish 15-minute candle. It subsequently traded in a renewed uptrend with the 20-period Moving Average steeply rising similar to the EUR/USD pair.

NZD/USD: Before the GDP Deflator Data Release on July 30, 
2020, Just Before 8.30 AM ET

NZD/USD: After the GDP Deflator Data Release on July 30, 
2020, at 8.30 AM ET

The NZD/USD pair was trading in a similar neutral pattern as the EUR/USD pair before the data release. Similar to the EUR/USD and the GBP/USD pairs, the NZD/USD pair formed a 15-minute bullish candle after the data release. Subsequently, the pair adopted an uptrend with the 20-period Moving Average steadily rising.

Bottom Line

As observed in this analysis, the GDP deflator has a strong impact on the price action, enough to alter the prevailing market trend upon its release. Forex traders should avoid having any significant open positions before the GDP deflator data release to avoid being caught on the wrong side of the news release.

Categories
Forex Basic Strategies

Learning To Trade The Forex Market Using ‘2-Period RSI’ Trading Strategy

Introduction

When we look for a trade setup, most of the times we do not have an idea of the strategy, we will be using for taking a particular trade. From there, we start to pick random indicators and start trading using those indicators without a proper strategy associated with that indicator. With our 2-Period RSI strategy, we will solve this confusion by looking at the market with a systematic approach that involves using the RSI indicator. In addition to the RSI indicator, we will also use a 20-period EMA. Most importantly, we will look to take trades in the direction of the main trend.

Now that we know what our goals are, we will look into the various parameters of the strategy and understand how to apply the same.

Time Frame

This strategy works well on the 5-minutes and 15-minutes time frame. This is a perfect intraday trading strategy.

Indicators

The strategy uses RSI as its major indicator. We also use the EMA for identification of the trend. Both the indicators are applied with their default settings.

Currency Pairs

This strategy is applicable to most of the currency pairs listed on the broker’s platform. However, illiquid pair should be completely avoided.

Strategy Concept 

The concept of the strategy is very simple if we have a clear understanding of the previously discussed strategy. The basic idea of here is to trade the retracement of an established trend. Therefore, the strategy can only be used when the market is trending. Once the trend has been identified, we wait for a ‘pullback’ in the price and then take an ‘entry’ in the direction of the market after a suitable confirmation. The Relative Strength Index (RSI) is an important indicator in this strategy which helps us in measuring the over-extended phase of the retracement.

A reading above 70 indicates an over-extended ‘up’ move while a reading below 30 indicates an over-extended ‘down’ move. In an uptrend, we will look for a retracement that is overextended, implying that the RSI should be below 30. While in a downtrend, we will look for a retracement that is overextended, implying that the RSI should be above 70. The crucial part of the strategy is that we don’t enter for a ‘buy’ or ‘sell’ soon after the RSI gives an indication, but instead wait for a sign of reversal that confirms the continuation of the trend.

Trade Setup

In order to explain the strategy, we will be taking a ‘long’ trade in the GBP/USD currency pair on the 5-minutes chart using the 2-period RSI strategy.

Step 1

The first step is to identify the major direction of the market. Many technical indicators help in identification of the trend, but the one that is suitable for this strategy is the EMA. We will identify the trend of the market using the 20-period EMA, which is best suited as per the conditions of the strategy.

In our example, we have identified an uptrend whose retracement shall be evaluated.

Step 2

Next, we need to wait for the market to turn from its highest or lowest point, depending on the trend, and then check if that is a retracement or a reversal. After the price starts to pull back, we wait until the RSI shows a reading below 30, in an uptrend and above 70, in a downtrend. Once that happens, we become alert and watch the price cautiously.

Step 3

Now we wait for the price to reverse and close above the 20-period EMA, in an uptrend and close below the EMA, in a downtrend. Ensuring this step is critical as it confirms the continuation of the trend. We enter the market with an appropriate position at the close of the candle. There are two ways of entering the market. One, wait for the candle to close and then enter. Second, enter at the crossing of the price above or below the EMA. The second approach is an aggressive form of ‘entry’ and is not recommended for everyone. There is also a conservative form of entry, that is entering at the re-test of the EMA.

In the below image, we can see that we are entering at the close of the bullish candle above the EMA. But since the candle is long and has a large body, the ‘entry’ price is much higher than what we were looking for.

Step 4

Finally, we determine the stop-loss and take-profit for the strategy. The stop-loss is placed below the ‘low’ from where the market reverses and starts moving higher in case of a ‘long’ trade. In a ‘short’ trade, it will be placed above the ‘high’ from where the market reverses and starts moving lower. Since we are trading with the trend, the ‘take-profit’ can be set at the new ’high’ or ‘low’ that will result in a higher risk-to-reward ratio.

In our case, the risk-to-reward ratio of the trade is just 1:1 since we took a late ‘entry.’

Strategy Roundup

We are making use of the RSI indicator in a most constructive way which helps us in identifying when the market is overbought or oversold. Using the concept of trends, we are applying the strategy to reduce risk and maximise gains. The rule for entering the market in this strategy is what stands out. We are entering only after getting clear signs of confirmation from the market. We can also trail our stop-loss and exit when we get signs of another reversal. This is an aggressive way of taking profit and is mostly done to increase the gains.

Categories
Forex Fundamental Analysis

The Importance of ‘Wages’ In Determining The Economic Condition of a Nation

Introduction

It is completely fair to say that it would be difficult to sustain a country’s economy in the absence of households’ consumption. The amount of money that employees are typically paid determines their purchasing power and their level of demand. Wages can, therefore, be said to be the best leading indicators of consumer inflation. More so, we can establish a direct correlation between the wages paid and the growth of the economy. For this reason, forex traders need to understand how wages drive the economy and the currency.

Understanding Wages

Wages are compensation that an employer pays their employees over a predefined period. It is the price of labour for the contribution to the production of goods and services. Thus, wages can be regarded as anything of value an employer gives an employee in exchange for their services. Wages include salaries, hourly wages, commissions, benefits and bonuses.

There are two categories of wages: nominal and real wages.

Nominal wages: are the amount of money that an employee is paid for the work done. Nominal wages are expressed in terms of pure monetary value.

Real wages: are the wages received by the employees adjusted for the rate of inflation. Real wages show the purchasing power of money. They are meant to guide on how the overall living standards have changed over time.

Therefore, Real wages = nominal wages – inflation

How Wages can be used for analysis

Their levels of disposable income determine the purchasing power of the households. The disposable income is directly proportional to the wages received. Therefore, the amount of wages paid for labour affects not only the quality of life of the households but also economic growth.

Growth in the wages received can be considered as a source of demand. Wages contribute a significant proportion of income for the middle- and low-class households who do not have other sources of income from investments. Assuming no corresponding increase in taxation, an increase in the wages corresponds to an increase in the amount of disposable income. Higher wages also give households the capacity to borrow more from financial institutions at competitive rates. The cheaper loans significantly contribute to increased aggregate demand. In this case, more goods and services will be demanded. The increase in aggregate demand compels producers to increase their scale of production to match the supply and demand. Consequently, the employment levels increase while the economy expands.

Source: St. Louis FRED

Conversely, decreasing wage growth implies that a decrease in disposable income. A reduction in the aggregate demand and supply will follow. Producers will be forced to scale back their operations, increasing the unemployment rate and consequently a slow-down in the economic growth.

Investments and savings rate rise with the growth in wages. These investments create employment opportunities and spur innovation within the economy. Contrary to this, the decrease in wages forces households to prioritise consumption over investments and saving. The resultant effect is fewer new job opportunities and stifled innovation. As can be seen, changes in the level of wages have a multiplier effect on the economy.

A rise in the rate of inflation is primarily driven by a disproportionate increase in demand driven by a rise in wages. Rising wages lead to a wage push inflation. This particular type of inflation is a result of an increase in prices of goods and services by producers to maintain corporate profits after an increase in the wages. Furthermore, since the responsiveness of supply to an increase in demand is not instant, increasing wages results in inflation since more money will be chasing the same amount of goods.

Impact of Wages on Currency

Forex traders monitor the fundamental indicators to gauge economic growth and speculate on the central banks’ policies. Central banks set their average inflation targets which guide their monetary policies. In the US, the inflation rate target is 2%.

When the wages increase, it forestalls a growth in the economy due to increased investments, aggregate demand and supply. An increase in employment levels also accompanies it. Since the value of a country’s currency is directly proportionate to its economic performance and outlook, wages growth leads to the appreciation of the currency. More so, consistent growth in wages is accompanied by wage push inflation. To keep this inflation under control, the central banks may implement contractionary policies to increase the cost of borrowing money and encourage savings and investments. These policies appreciate the currency.

A decrease in wages implies that the economy could be contracting due to declining aggregate demand and supply within the economy. If the central banks fear that this might result in a recession, they will implement expansionary monetary policies such as lowering interest rates. These policies tend to depreciate the currency.

Sources of Data

This analysis will focus on Australian wages. The comprehensive indicator of wages is Australian Wage Price Index which measures Wages, salaries, and other earnings, corrected for inflation overtime to produce a measure of actual changes in purchasing power. Thus, it measures the change in the price businesses, and the government pay for labour, excluding bonuses.

The real earnings data is released quarterly by the Australian Bureau of Statistics. The statistics can be accessed here.

Statistics on the global wages by country can be accessed at Trading Economics.

How Real Earnings Data Release Affects The Forex Price Charts

The most recent real earnings data in Australia was released on August 12, 2020, at 1.30 AM GMT. A summary review of the data release can be accessed at the Australian Bureau of Statistics website. The screengrab below is of the monthly real earnings from Investing.com.

As can be seen, the release of the real earnings data is expected to have a moderate volatility impact on the AUD

The screengrab below shows the most recent change in the Australian wage price index. In the second quarter of 2020, the wage price index grew by 0.2%. This growth is slower than the 0.5% increase in the first quarter of 2020. More so, the change in the second quarter was lower than analysts’ expectations of a 0.3% increase.

In theory, this improvement should lead to depreciation of the AUD relative to other currencies.

Now, let’s see how this release made an impact on the Forex price charts of a few selected pairs

AUD/USD: Before the Wage Price Index QoQ Data Release on 
August 12, 2020, Just Before 1.30 AM GMT

From the above 15-minute chart of AUD/USD, the pair can be seen trading in a subdued downtrend before the data release. This trend is evidenced by candles forming just below an almost flattening 20-period Moving Average.

AUD/USD: After the Wage Price Index QoQ Data Release 

After the data release, the pair formed a long 15-minute bearish candle indicating the weakening of the AUD as expected. The weak wages price index data resulted in the selloff of the AUD, which led to the pair adopting a steady trend. This downtrend is shown by the steeply falling the 20-period MA with subsequent candles forming further below it.

Now let’s see how this news release impacted other major currency pairs.

GBP/AUD: Before the Wage Price Index QoQ Data Release on 
August 12, 2020, Just Before 1.30 AM GMT

The GBP/AUD pair traded in a neutral trend before the wages data release. As shown above, the 15-minute candles are forming just around an already flat 20-period MA. This trend indicates that traders were inactive waiting for the data release.

GBP/AUD: After the Wage Price Index QoQ Data Release 

As expected, the GBP/AUD pair formed a long 15-minute bullish candle indicating the selloff of the AUD due to the weaker than expected data. Subsequently, the pair adopted a bullish trend as the 20-period MA steadily rising with candles forming further above it.

EUR/AUD: Before the Wage Price Index QoQ Data Release on 
August 12, 2020, Just Before 1.30 AM GMT

EUR/AUD: After the Wage Price Index QoQ Data Release

The EUR/AUD pair traded in a similar neutral pattern as the GBP/AUD pair before the wages data release. 15-minute candles can be seen forming just around a flattened 20-period MA. Similar to the GBP/AUD pair, the EUR/AUD formed a long 15-minute bullish candle immediately after the wages data release. Subsequently, the pair adopted a strong bullish trend as the 20-period MA rose steeply with candles forming further above it.

Bottom Line

From the above analyses, it is evident that the wages data has a significant effect on price action. Although the wage price index is categorised as a medium-impact indicator, its impact was amplified by the ongoing effects of the coronavirus pandemic. The worse than expected wages data indicated that the Australian labour industry is yet to recover from the economic shocks of Covid-19.

Therefore, traders should avoid having significant positions open with pairs involving the AUD before the release of the quarterly wage price index.

Categories
Forex Assets

Trading The NZD/HKD Forex Exotic Currency Pair

Introduction

NZD represents the official currency of New Zealand, while HKD is the official currency of Hong Kong. It is an exotic-cross currency pair where NZD is the base currency, and HKD the quote currency. The price of NZDHKD determines the value of HKD, which is equivalent to one NZD. In other words, this pair represents 1 NZD per X HKD. For example, if the pair is trading at 5.14452, we would need about 5.1 HKD to purchase one NZD.

NZD/HKD Specification

Spread

To get the Spread value, we just have to subtract the Bid price from the Ask price. The value of the spread is set by a broker. However, the amount in pips depends on the type of execution model used for executing the trades.

Spread on ECN: 31 pips | Spread on STP: 35 pips

Fees

Like other financial markets, Forex has some fees that a trader needs to pay while they take a trade. Note that the broker does not take any fee on STP accounts, but a few fees are charged on ECN model accounts.

Slippage

The slippage is a set of pips formed by the difference between the demanded price by the trader and the execution price by the broker. The main reason for the occurrence of slippage is market volatility or the broker’s execution speed.

Trading Range in NZD/HKD

Procedure to assess Pip Ranges

  1. Add the ATR indicator to your chart
  2. Set the period to 1
  3. Add a 200-period SMA to this indicator
  4. Shrink the chart so you can assess a large time period
  5. Select your desired timeframe
  6. Measure the floor level and set this value as the min
  7. Measure the level of the 200-period SMA and set this as the average
  8. Measure the peak levels and set this as Max.

NZD/HKD Cost as a Percent of the Trading Range

The volatility values from the above table show how the cost varies with the change in volatility. The ratio between total cost and the volatility values reconverted into percentages to have a better outlook.

ECN Model Account 

Spread = 31 | Slippage = 5 | Trading fee = 8

Total cost = Spread + Slippage + Trading Fee

= 31 + 5 + 8

Total cost = 44

STP Model Account

Spread = 35 | Slippage = 1 | Trading fee = 0

Total cost = Spread + Slippage + Trading Fee

= 35 + 1 + 0 = 36

The Ideal way to trade the NZD/HKD

The NZDHKD is a pair with high liquidity. Therefore, trading this exotic currency pair seems to be feasible. We can see from the above table that the highest Percentage of values are barely above 100%. It means this currency pair is relatively less expensive to trade.

The most significant costs are in the hourly timeframe only, as the costs in 2H, 4H, and daily timeframes are also low. However, every trader should avoid the volatile market condition. Therefore, the best way to trade this pair is to look out for the possibilities to be on lower timeframes also while sticking to the average volatile level.

Also, traders can reduce the trading costs further by eliminating market orders and placing orders as ‘limit’ and ‘stop.’ In this case, slippage can completely be avoided. Please go through the below table to further understand this.

STP Model Account (Using Limit Orders)

Spread = 31 | Slippage = 0 | Trading fee = 0

Total cost = Spread + Slippage + Trading Fee

= 31 + 0 + 0 = 31 

Categories
Forex Fundamental Analysis

Everything You Should Know About ‘Retail Sales YoY’ Macro Economic Indicator

Introduction

The computation of gross domestic product takes into account the consumption by households. In the households’ consumption, the retail sales data is considered to be the best leading indicator. Retail sales account for the majority of consumption by households. Retail sales are estimated to account for up to 70% of the US economy. It is, therefore, important for forex traders to understand how it affects the economy and the currency.

Understanding Retail Sales YoY

Retail Sales: the definition of retail sales is the purchase of finished goods and services by the end consumers. As an economic indicator, retail sales are used to measure the changes in the value of the goods and services bought at the retail level. This change can be monthly (retail sales MoM) or over the previous twelve months (retail sales YoY).

Retail Sales YoY: covers the retail sales made to consumers for the preceding 12 calendar months. It measures the rate of change in the value of purchases made by households.

How Retail Sales YoY is Measured

The data collected for the YoY retail sales cover all retail outlets from physical stores to e-commerce. It also includes data from the services sector, such as hotels and restaurants. According to the US Census Bureau, retail sales are divided into 13 categories, which include: e-commerce retailers, department stores, food and beverage stores, health and beauty stores; furniture stores; hospitality, apparel, building stores, auto dealers, and gas stations.

In the US, the measurement of the annual retail sales is done using the Annual Retail Trade Survey (ARTS). The ARTS is aimed at giving the estimates of the national total annual sales, sales taxes, e-commerce sales, end-of-year inventories, purchases, total operating expenses, gross margins, and end-of-year accounts receivable for retail businesses. This survey is conducted annually.

The retail sales YoY tends to be influenced by the seasonality of the economic activities since it covers more extended periods. These seasons including the holiday shopping seasons account for about 20% of the retail sales YoY. As a result, retail sales YoY cannot be expected to provide the most current and up-to-date retail data.

How Retail Sales YoY can be used in Analysis

As aforementioned, the retail sales account for about 70% of the GDP, making it a vital leading indicator.

Consumer spending drives the economy. An increase in retail sales implies that more money is circulating in the economy. This increase could be a result of increased wages, which increases the disposable income, increase in the rate of employment; and accessibility to loans and credit. All these factors increase the aggregate demand within an economy. The increase in demand leads to an increase in aggregate supply. This increase leads to the creation of more employment opportunities due to the expansion of businesses. Therefore, a steady increase in the retail sales YoY signifies that the economy has been steadily expanding over the long term.

Source: St. Louis FRED

Declining retail sales YoY is an indicator that the economy might be contracting. The decrease in retail sales implies that there is less disposable income within the economy, either as a result of low wages or job cuts. Subsequently, there will be reduced demand for the finished goods and services in the economy, which will, in turn, compel producers to cut the output to avoid price distortion. The reduction in the production will force them to scale down their operations, leading to more unemployment. Thus, a continually decreasing retail sales YoY could be an indicator of a looming economic recession.

Since the retail sales YoY are spread out over 12 calendar months, it provides a comprehensive outlook for the central banks to monitor the effectiveness of their monetary policies. In the US, the Federal Reserve Board uses the accounts receivable data in monitoring retail credit lending.

Monitoring the retail sale YoY enables the Federal Reserve to keep an eye on the rate of inflation. A continually increasing retail sales YoY, if left unchecked, could lead to an increased rate of inflation beyond the target rate. Thus, to ensure this does not happen, the central banks consider this data when making the interest rate decision.

Conversely, since a continually decreasing retail sales YoY forebode a possibility of a recession, this data encourages governments and central banks to implement expansionary fiscal and monetary policies. These policies, such as cutting the interest rates, are meant to reduce the cost of borrowing and increase access to credit hence spurring demand within the economy.

Impact on Currency

As established, an increase in the retail sales YoY is synonymous with an increase in economic activities and an expanding economy. A country’s economic growth leads to an increase in the value of its currency. Thus, increasing retail sales YoY results in currency appreciation.

Conversely, the declining retail sales YoY forebodes a looming recession and a possible interest rate cut in the future. More so, this decline signifies an increase in the unemployment levels and a contracting economy. All these factors contribute to the depreciating of a country’s currency.

In the forex market, the retail sales YoY is a low-level economic indicator. It is overshadowed by the MoM retail sales data, which represents the more recent changes observed within the economy.

Sources of Retail Sales YoY Data

In the US, the retail sales YoY data is released monthly by the United States Census Bureau, along with the monthly updates. A comprehensive breakdown of the US retail sales YoY can be accessed at St. Louis FRED website. Statistics on the global retail sales YoY can be accessed at Trading Economics.

How Retail Sales YoY Data Release Affects The Forex Price Charts

The most recent retail sales YoY data was released on August 14, 2020, at 8.30 AM ET. A more in-depth review of the data release can be accessed at the US Census Bureau website.

The screengrab below is of the retail sales YoY from Investing.com. On the right is a legend that indicates the level of impact the fundamental indicator has on the USD.

As can be seen, the retail sales YoY data release is expected to cause low volatility on the USD.

In the 12 months to July 2020, the retail sales YoY in the US increased by 2.74%. This increase is higher compared to the previous increase of 2.12%. In theory, this increase should appreciate the USD relative to other currencies.

The screengrab above shows the simultaneous release of the monthly retail sales data and the retail sales YoY data. It is to be expected that the monthly retail sales data will dampen any impact that the retail sales YoY would have had on the price action.

EUR/USD: Before the Retail Sales, YoY Data Release on 
August 14, 2020, Just Before 8.30 AM ET

As we can see from the above 15-minute EUR/USD chart, the pair was trading in a weak uptrend. This trend is proved by the 15-minute candles crossing above the slightly rising 20-period Moving Average.

EUR/USD: After the  Retail Sales, YoY Data Release on 
August 14, 2020, at 8.30 AM ET

After the news announcement, the pair formed a 15-minute bullish candle. This candle indicates that the USD weakened against the EUR. Subsequently, the pair continued trading in a renewed uptrend as the 20-period MA rose steeply.

GBP/USD: Before the Retail Sales YoY Data Release on 
August 14, 2020, Just Before 8.30 AM ET

Before the data release, the GBP/USD pair was trading in a steady uptrend. This trend is evidenced by a steeply rising 20-period MA, with bullish candles forming further above it.

GBP/USD: After the  Retail Sales, YoY Data Release on 
August 14, 2020, at 8.30 AM ET

Similar to the EUR/USD, the GBP/USD pair formed a long 15-minute bullish candle after the news release. The pair continued to trade in the previously observed uptrend before peaking and slowly flattening.

NZD/USD: Before the Retail Sales, YoY Data Release on 
August 14, 2020, Just Before 8.30 AM ET

NZD/USD: After the  Retail Sales, YoY Data Release on 
August 14, 2020, at 8.30 AM ET

Before the retail sales YoY data release, the NZD/USD pair was trading in a similar trend as the EUR/USD pair. The 15-minute candles were crossing above a flattening 20-period Moving Average. After the news announcement, the pair formed a  long 15-minute bullish candle as did the EUR/USD and GBP/USD pairs. Subsequently, the pair traded in a renewed uptrend as the 20-period MA rose steeply with candles forming further above it.

Bottom Line

The retail sales YoY provides vital long-term data about the economic outlook of the households and their consumption patterns. In the forex markets, however, the retail sales YoY data is overshadowed by the retail sales MoM data, which is release concurrently. From this analysis, the increase of the retail sales YoY data for July 2020 had no impact on the price action since the markets reacted to the negative monthly retail sales data.

Categories
Forex Basic Strategies

How to Profit Using The ‘Gap and Leave’ Forex Trading Strategy

Introduction

Gap and Leave is an interesting trading strategy that utilizes one of the most distressing phenomena of the forex market, a weekly gap between the last Friday’s close and the current Monday’s open price. The gap takes its origin in the fact that the interbank currency market continues to react on the fundamental news during the weekend, which results in a kind of opening on Monday at the highest level of liquidity. Today’s strategy is based on the assumption that the gap is a result of speculations and excess liquidity. Therefore, a position in the opposite direction should become profitable after a few hours.

In the past few articles, we discussed strategies that were pertaining to ‘trend pullback.’ Now, we will shift our focus and talk about a strategy that is best suited for trading a ‘range.’

Time Frame

This strategy works well on the 15-minutes and 1-hour time frame. Traders looking to trade intraday should use the strategy on the 15-minutes time frame. While traders looking for swing trading opportunities should look at 1-hour charts.

Indicators

No indicators are being used in this strategy. It mostly relies on price action and market speculation.

Currency Pairs

This strategy is suitable for trading in currency pairs, which are volatile and liquid. Also, since the Asian market is the first one to open for trading after the weekend, we would suggest applying this strategy in currency pairs involving the Japanese yen, Australian dollar, and the New Zealand dollar.

Strategy Concept

Gap and Leave is an easy strategy that is based on simple price action and speculation. It is observed that events and occasions that occur during the weekend give rise to unfilled orders in the market, which leads to a gap on Monday. This gap is a result of speculation and sudden infusion of liquidity in the market, as an outcome of the event. Most of these events are not of great importance, which means they do not have long-lasting on the value of a currency.

This characteristic can be used to our advantage by entering at discounted prices. Here it is important to note that the gap should coincide with a technical level of support and resistance. As mentioned earlier, this is a ‘range’ trading strategy. The price must reach the extremes of the ‘range’ as a result of the ‘gap.’ The idea is to go ‘long’ at support and ‘short’ at resistance. But this is done by following all the rules of the strategy.

The strategy offers a high risk-to-reward since we are executing our trades at the lowest prices, keeping a target at the other end of the ‘range.’

Trade Setup

In order to explain the strategy, we shall consider an example where we will execute a ‘long’ trade-in GBP/NZD pair on the 15-minutes time frame. Here are the steps to execute the strategy.

Step 1

Firstly, we should identify a ‘range’ that is newly formed. By this, we mean, the price should have reacted from the top or bottom of the range at least twice and moved to the other end. At the same time, we need to also ensure that the ‘range’ is not very old. We should not be considering ‘ranges’ where the support and resistance levels have been respected more than 5-6 times.

In our example, we have identified a ‘range’ on the 15-minutes time frame where the price has reacted twice from the resistance and four times from the support.

Step 2

The next step is to watch for Friday’s closing price. The candle must close somewhere in the middle of the range. This is because if the market has to gap on Monday, the gap will take the price at one of the extremes of the range. If the candle closes at support or resistance on Friday, the price gap will lead to a breakout or breakdown that will violate the ‘range’ trade. Then we should look for a breakout strategy.

In the case of GBP/NZD, we can see that the price almost closes in the middle of the range.

Step 3

This is the most important step in the strategy. In this step, we watch the market’s behavior on Monday and see if it opens with a gap or not. If the market gaps down to the support of the range, we will look for taking a ‘long’ trade after a suitable confirmation. On the other hand, if the market gaps up to the resistance, we will take a ‘short’ trade provided we have followed all the steps discussed earlier. A bullish candle after ‘gap down’ is the confirmation for a ‘long’ trade, and a bearish candle after ‘gap up’ is the confirmation for a ‘short’ trade.

In the below image, we can see that the price forms a bullish candle after gapping down on Monday. Hence, we enter for a ‘buy’ at this close of the first candle.

Step 4

Lastly, we need to determine the stop-loss and ‘take-profit’ for the strategy. Stop-loss placement is pretty simple, where it is placed below the support when ‘long’ in the market and above the resistance when ‘short.’ We take our profits when the price reaches the other end of the range. This means at resistance when ‘long’ and at the support when ‘short.’ The risk-to-reward of trades using this strategy is above average, which is quite attractive.

Strategy Roundup

Gaps are one of the most common tools used by institutional traders due to the high probability of winning trades. This strategy is based on market movement that is only a consequence of speculation, which does not hold any value. If we are looking for a gap trading strategy in forex, the Gap and Leave strategy is a good one to start with because it is great for beginners who want a relatively easy entry, at a slow pace and not involving complex indicators.

Categories
Forex Assets

Asset Analysis – Trading The NZD/QAR Forex Exotic Pair

Introduction

NZD is the authorized currency of New Zealand, while the QAR (Qatari Rial) is the official currency of Qatar. The combination of these two currencies forms the NZDQAR exotic pair. As a trader, we aim to identify the possible movement in this pair by an appropriate analysis method and make money from the differential.

Understanding NZD/QAR

In every currency pair, the first currency is known as the base currency, and the second currency is known as the quote currency. We can quote it as 1 NZD per X numbers of QAR. For example, if the NZDQAR pair’s value is at 2.4460; therefore, we need almost 2.4460 QAR to buy one NZD.

NZD/QAR Specification

Spread

The bid price is the price level that buyers are willing to pay when they buy an instrument. Similarly, ask price is the lowest price that a seller is willing to pay when they sell a currency pair. The difference between these prices is known as Spread. This value changes with the change of the execution model.

Spread on ECN: 12 pips | Spread on STP: 17 pips

Fees

The fee or commission in Forex is similar to the one that is pair to stockbrokers where it is automatically deducted from traders’ accounts when they take a trade. However, an STP account does not take any fees but a few pips on ECN accounts.

Slippage

There is some market condition when we enter a buy or sell trade, but the trade opens some pips higher or lower, known as Slippage. The Slippage might happen when the market is volatile.

Trading Range in NZD/QAR

Procedure to assess Pip Ranges

  1. Add the ATR indicator to your chart
  2. Set the period to 1
  3. Add a 200-period SMA to this indicator
  4. Shrink the chart so you can assess a large time period
  5. Select your desired timeframe
  6. Measure the floor level and set this value as the min
  7. Measure the level of the 200-period SMA and set this as the average
  8. Measure the peak levels and set this as Max.

NZDQAR Cost as a Percent of the Trading Range

With the volatility values obtained from the above table, we can see how the cost varies as the volatility of the market varies. All we did is, got the ratio between the total cost and the volatility values and converted into percentages.

ECN Model Account 

Spread = 12 | Slippage = 5 | Trading fee = 8

Total cost = Spread + Slippage + Trading Fee

= 12 + 5 + 8 = 25

STP Model Account

Spread = 17 | Slippage = 5 | Trading fee = 0

Total cost = Spread + Slippage + Trading Fee

= 17 + 5 + 0 = 22

The Ideal way to trade the NZD/QAR

The NZD/QAR is a currency pair that has a lot of volatility and liquidity. Therefore, it is easier for a trader to trade this exotic-cross currency. If we analyze the table mentioned above, we can say that the H1 timeframe has the highest cost as a percentage of the trading range at an average of 44.64%, where the average movement is almost 56 pips. The increase in volatility provides higher price fluctuation, but it is often risky for a trader as there is a possibility of unwanted stop loss hit and reverse back.

Moreover, in the monthly timeframe, the price of the NZD/QAR provides an excellent movement with a low cost of an average of 0.77% only. Therefore, if we trade this pair in a higher timeframe, we might reduce the risk of market volatility. We can also use limit orders in the place of market orders to further reduce the costs, as shown below.

STP Model Account (Using Limit Orders)

Spread = 12 | Slippage = 0 | Trading fee = 0

Total cost = Spread + Slippage + Trading Fee

= 12 + 0 + 0 = 12

Categories
Forex Fundamental Analysis

What Should You Know About ‘Loans to Private Sector’ Fundamental Forex Driver

Introduction

Private Sector has a significant and crucial role to play in the economic growth of capitalist economies. The development of private sectors can single-handedly drive the GDP and development of the country forward. Credits and loan availability to the private sector can significantly impact the pace of expansion of the country. Hence, an analysis of the loans disbursed to the private sector can offer us much insight into the country’s growth.

What are Loans to Private Sector?

Loan

It is a credit incurred by an individual or entity. The creditor is generally a financial institution or the Government. The lenders give borrowers money on certain conditions that can include terms relating to the repayment date, interest charges, or other transactional fees. A loan can be secured or unsecured. In secured loans, the loan is given out against collateral like property, mortgages, or securities.

Private Sector

It refers to the part of the economy, which is not under state or central government’s control. The private sector industries are mostly privately owned and for-profit businesses. Private sectors can produce productive jobs, higher income, productivity growth. When private sectors are complemented with the Government sector’s support, the growth rate is multiplied many folds.

Loans to Private Sector

It refers to credits provided to the private sector by financial corporations. Credit can be as loans, nonequity securities purchases, and trade credits, etc. Financial corporations here can be monetary authorities (ex: Central Banks), finance and leasing companies, lenders, pension funds, insurance companies, and foreign exchange companies.

How can Loans to Private Sector numbers be used for analysis?

Most modern economies are capitalist economies, i.e., most of the GDP is derived from the private sector that operates on profitability. Economic indicators like employment, wage growth, the standard of living, GDP, etc. are all heavily dependent on the private sector. In the United States, the private sector contributes more than 85% of the total GDP. Hence, private sector growth is almost equivalent to the country’s growth.

In capitalist economies, the private sectors are competitive, provide high employment, better income, and lie at the forefront of technological innovation in general. Due to competition amongst fellow business organizations, the benefits of working in the private sector far exceed that of the public sector.

Credit plays a vital role in the economic growth of capitalist economies. Credit serves as a crucial channel for money transmission from central authorities to the private sector. Loans can fund production, consumption, and capital formation for businesses that, in turn, generate revenue for the country.

Loans can help private businesses to expand beyond just the cash in hand and speed up their growth rate. The ease with which credit facilities are made available to the private sector will largely control the pace of economic growth. The Government and the Central Bank authorities’ support in providing credit to private industries have historically proven to be very beneficial for the state and country’s urbanization and rapid growth.

On the flip side, a decrease or lack of credit availability can significantly impact small and medium businesses, resulting in halting expansion plans, laying off employees, or in the worst close filing bankruptcy.

The public sectors can only take care of the essential services and set rules and regulations in different areas. The required development has to come from the private sector. But it is the private sector that can boost economic growth through investment, employment, competition, innovation, and better wages.

In the underdeveloped economies, the Government’s support in credit and business support to the private sector has mostly helped uplift people from poverty. In the developing economies, private sector investments have dramatically improved the standard of living for many countries like China, Japan, and India. Private sectors of developed countries already enjoy the support from the public and banking sector, which explains their high GDP and consistent growth rate.

Impact on Currency

An increase in loans to the private sector is a positive sign for the economy. It indicates more businesses are now creditworthy and are working on expansionary plans. A healthy increase in the number of loans to the private sector is good for the future economy. An increase in loans to the private sector also indicates the market is more liquid, and the currency will lose value for the same set of goods and services. Conversely, a decrease in loans to the private sector means the market is less liquid, and money is costly. Currency appreciates, but economic growth is difficult to achieve.

Loans to private sector statistics are useful for the Governments and international investors and companies to check the health of the private sectors in a particular economy. International companies open businesses where ease of doing business is high. For them, it is a useful indicator. Private Sector Loan is not a significant economic indicator for the FOREX markets. Hence it is a low impact indicator.

Economic Reports

The World Bank collects domestic credit data to the Private Sector as a GDP percentage on their official website. The dataset is annual and covers most countries. The datasets are updated once they receive the latest data from the respective countries.

Sources of Loans to Private Sector

The World Bank’s Domestic Credit to private sector reports is available here.

We can also find a consolidated list of Loans to the private sector on the Trading Economics website.

How Loans to Private SectorAffects The Price Charts?

Loans to the private sector is not a statistic most forex traders keep an eye when making their trades. The lack of interest is because it is considered a their-tier leading indicator. It is, however, essential to know how the release of this fundamental economic indicator affects the forex price charts.

The Eurozone private sector loans data is released monthly by the European Central Bank about 28 days after the month ends. It measures the change in the total value of new loans issued to consumers and businesses in the private sector. The most recent release was on July 27, 2020, 8.00 AM GMT can be accessed here. A more in-depth review of the economic news release can be accessed at the ECB website.

Below is a screenshot of the Forex Factory official website. On the right side, we can see a legend that indicates the level of impact the Fundamental Indicator has on the EUR.

As can be seen, low impact is expected on the EUR.

The screengrab below is of the most recent change in private loans in the EU. In June 2020, private loans grew by 3% as compared to the same period in 2019. This change represented a flat growth from the previous release. Based on our fundamental analysis, this should be positive for the EUR.

Now, let’s see how this positive news release made an impact on the Forex price charts.

EUR/USD: Before Eurozone Private Sector Loans release on July 
27, 2020, Just Before 8.00 AM GMT

From the above chart, the EUR/USD pair is trading on a neutral trend before the data release. The candles are forming around the flattening 20-period Moving Average. This trend is an indication of relative market inactivity.

EUR/USD: After Eurozone Private Sector Loans release on July 
27, 2020, 8.00 AM GMT

After the news release, the pair forms a 15-minute bullish candle as EUR becomes stronger as expected. However, the news release was not strong enough to cause a shift in the pair’s trend since the pair continued to trade in the previously observed neutral trend.

Now let’s see how this news release impacted other major currency pairs.

EUR/JPY: Before Eurozone Private Sector Loans release on July 
27, 2020, Just Before 8.00 AM GMT

Before the news release, EUR/JPY traded in a similar neutral trend as observed with the EUR/USD with the candles forming around a flattening 20-period Moving Average.

EUR/JPY: After Eurozone Private Sector Loans release on July 
27, 2020, 8.00 AM GMT

As observed with the EUR/USD pair, EUR/JPY formed a 15-minute bullish candle after the news release as expected. The subsequent trend does now significantly shift.

EUR/CAD: Before Eurozone Private Sector Loans release on July 
27, 2020, Just Before 8.00 AM GMT

EUR/CAD: After Eurozone Private Sector Loans release on July 
27, 2020, 8.00 AM GMT

The EUR/CAD pair shows a similar neutral trading pattern as the EUR/USD and EUR/JPY pair before the news release. After the news release, the pair forms a 15-minute bullish candle but later continued trading in the earlier observed neutral trend as the 20-period Moving Average flattens.

Bottom Line

Loans to the private sector play a vital role in stimulating a country’s economic growth. From the above analyses, the release of the loan growth data has an instant short-term effect on the EUR. The data is, however, not significant enough to cause any relevant shift in the prevailing market trend.

Categories
Forex Basic Strategies

Exploring The Forex Market Opportunities With The Help of ‘Volume’

Introduction

In the Forex market, we don’t really have a centralised exchange as we’re trading over the counter. This is the reason why it is so difficult to determine exact trading volumes in Forex. Even though there is no centralised exchange to provide us with the volume data, many forex broker’s and trading platforms keep track of the average volumes in a pair. Each retail broker will have their own aggregate trading volume. Platforms like TradingView also have a volume attached to their chart. We all have realised over time that volume in the forex market is an important indicator, which is the reason why we need the best volume indicator.

The volume indicator used to read the volume in the forex market is the Chaikin Money Flow indicator (CMF.) The CMF was developed by Marc Chaikin, who is a trader himself, and was coached by the most successful institutional investors around the world. The reason Chaikin Money Flow (CMF) the best volume indicator is that is measures institutional accumulation and distribution.

Normally, on a rally, the Chaikin volume indicator should be below zero. Conversely, on sell-offs, the indicator should be below the ‘zero’ line.

Time Frame

The strategy works well on the 1-hour and 4-hour time frame only. Therefore, we can say that it is a swing trading strategy and is not suitable for trading intraday.

Indicators

We will be using just one indicator in this strategy, and that is the Chaikin Money Flow indicator (CMF.) The rest all is based on price action.

Currency Pairs

The strategy is suitable for trading in almost all currency pairs that are listed on the broker’s platform. But we need to make sure that the forex pair has enough trading volume.

Strategy Concept

Volume trading requires us to pay careful attention to the forces of demand and supply. Volume traders look for instances of increased buying or selling orders. They also pay attention to the current price movement and trend of the market. Generally, increased trading volume leans towards heavy buy orders. These positive volume trends will prompt us to open new positions on the ‘long’ side of the market, depending on the price action.

On the other hand, if trading volumes and cash flow decrease—it indicates a “bearish divergence. This may be appropriate to sell. We will pay attention to the relative volume—regardless of the number of transactions occurring in a trading period. By learning how to use the Chaikin money flow and other relevant indicators, we will be able to identify whether to ‘buy’ or ‘sell.’

With practice, the volume trading strategy can yield a win rate of 75%!

Trade Setup

In order to explain the strategy, we have considered the chart of EUR/USD, where we will be illustrating a ‘long’ trade using the rules of the strategy.

Step 1

Firstly, look for a price reversal in the market or a price action that reverses an established downtrend or uptrend. This is an easy and simple step that requires us to have a basic understanding of price reversal. This reversal should be accompanied by the rising Chaikin volume indicator that shoots up in a straight line from below zero to above the ‘zero’ line, during the reversal of a downtrend. In an uptrend, the slope should be downwards, i.e., from positive to negative.

When the volume indicator goes negative to positive in a strong fashion, it shows an accumulation of smart money.

Step 2

Wait for the price to pullback near the previous lower low after an upward reversal. Likewise, wait for the price to pullback near the previous higher high. The Volume Indicator should also pullback in a similar manner. If the pullback is coming in slowly, the trade has a higher probability of performing. If the pullback is strong, we will exercise some caution.

When the volume indicator is decreasing and drops below zero, we have to make sure that the price remains above the swing low. If the market is satisfying all the conditions of the strategy until now, we can move on to the next step.

Step 3

Wait for the Chaikin volume indicator to break back above the zero lines. We enter for a ‘buy’ once a ‘higher low’ is confirmed, and the price starts moving in the direction of the reversal. In a reversal of an uptrend, the Chaikin indicator should break below the ‘zero’ line. We enter for a ‘sell’ once a ‘lower high’ is confirmed, and the price starts moving lower. Once the institutional money comes back in the market, we wait for them to step back and drive the market.

The below image shows a ‘higher low’ being formed along with the volume breakout.

Step 4

This brings us to the next important step, where we establish protective stop-loss and take-profit for the strategy. We place stop-loss below the ‘higher low’ that confirmed the reversal when ‘long’ in the pair and above the ‘lower high ‘when ‘short’ in the currency pair. This strategy indicates a strong reversal in the market that will change the trend of the market. This is why we set our ‘take-profit’ at the origin of the previous trend.

In our example, the risk-to-reward of the trade was over 1:2, which is great.

Strategy Roundup

The volume trading strategy will continue to work in the future; it is based on the activities of the smart money. Even though they hide all their operations, their footprints are still visible. We can read those marks by using proper tools. The Chaikin indicator will add value to our trading because it gives a window into the volume activity the same way we traded the stocks. Make sure to follow this step-by-step guide to trade properly using volume.

Categories
Forex Assets

Analyzing The Costs Involved While Trading The NZD/SGD Exotic Forex Pair

Introduction

NZD/SGD is the abbreviation for the native currencies of New Zealand and Singapore. It is considered an exotic pair, where NZD is the first (base) currency, and SGD is the second (quote) currency.

Understanding NZDSGD

This pair’s price determines the value of SGD, which is equivalent to one New Zealand Dollar, NZD. We can quote it as 1 NZD per X number of SGD. For example, if the NZDSGD pair’s value is at 0.90759, we need almost 0.90759 SGD to buy one NZD.

NZDSGD Specification

Spread

The spread comes from the difference between the bid and the ask prices offered by the broker. This value is controlled by the brokers; therefore, traders don’t have a say in this. This value varies on the type of execution used for performing the trades. Below are the ECN and STP values for NZD/SGD currency pair.

Spread on ECN: 26 pips | Spread on STP: 31 pips

Fees

The fee or commission in Forex is similar to the one that is paid to stockbrokers, where it is automatically deducted from traders’ accounts when they take a trade. Note that there are no fees on STP trading accounts, but a few pips are charged on ECN accounts.

Slippage

Slippage happens when a trader tries to open a trade in a price, but it opens at another price. The main reason to occur slippage is the market volatility and the broker’s execution speed.

Trading Range in NZDSGD

Procedure to assess Pip Ranges

  1. Add the ATR indicator to your chart
  2. Set the period to 1
  3. Add a 200-period SMA to this indicator
  4. Shrink the chart so you can assess a large time period
  5. Select your desired timeframe
  6. Measure the floor level and set this value as the min
  7. Measure the level of the 200-period SMA and set this as the average
  8. Measure the peak levels and set this as Max.

NZDSGD Cost as a Percent of the Trading Range

If we look at the volatility values at the above table, we can see how the cost changes with the change in volatility of the market. We just have got that ratio and converted into percentages.

ECN Model Account 

Spread = 26 | Slippage = 5 | Trading fee = 8

Total cost = Spread + Slippage + Trading Fee

= 26 + 5 + 8

Total cost = 39

STP Model Account

Spread = 26 | Slippage = 5 | Trading fee = 0

Total cost = Spread + Slippage + Trading Fee

= 26 + 5 + 0

Total cost = 31

The Ideal way to trade the NZDSGD

The NZDSGD is a currency pair that has a lot of volatility and liquidity. Therefore, it is easier for a trader to trade this currency pair. The above-mentioned percentage values are all within almost 500%. It is an indication that the cost is higher in the lower timeframe and lowers in the higher timeframe.

In other words, the cost rises with an increase in volatility. Therefore, the risk of this pair is that it is highly volatile. However, the best time to trade in this pair is when the volatility is at the average value. A decrease in volatility is ineffective, while the increase in volatility is risky. Therefore, sticking to the average value is suitable for this pair.

Furthermore, there’s an additional way to lessen the cost of the trades you execute. This is by placing a pending order as a ‘limit’ order instead of a ‘market’ order. In this case, there will be no slippage. So, in this example, the total cost will be reduced by five pips.

STP Model Account (Using Limit Orders)

Spread = 26 | Slippage = 0 | Trading fee = 0

Total cost = Spread + Slippage + Trading Fee

= 26 + 0 + 0

Total cost = 26